Embed Size (px)
Citation preview
5412
ISSN 2286-4822
www.euacademic.org
EUROPEAN ACADEMIC RESEARCH
Vol. II, Issue 4/ July 2014
Impact Factor: 3.1 (UIF)
DRJI Value: 5.9 (B+)
The Misalignment - Is it a Determinant of the FDI in
the Developing Countries?
ABDESSALEM GOUIDER URECA, University of Sfax, Sfax
Tunisia
RIDHA NOUIRA1
UREP, University of Sfax, Sfax
Tunisia
Abstract:
This paper contributes to a current and intense debate among
economists concerning the impact that real exchange rate
misalignment can have on FDI. To identify the degree of
misalignment, a model of Edwards in Panel will be estimated for a
sample of 52 developing countries over the period 1980-2010. Once the
misalignment values are determined, they will be included in the FDI
model. The results prove that the misalignment is a main determinant
of the FDI in the developing countries. Indeed, the overvaluation has a
negative and significant effect on the FDI while undervaluation does
not have a significant effect on it. Finally, a persistent overvaluation in
developing countries can slow down the flow of FDI to these countries,
whereas the persistent undervaluation stimulates these flows.
Key words: Foreign direct investment, Overvaluation,
Undervaluation
JEL Classification: C21; C23; F31; F33
1 Corresponding author: [email protected]
Abdessalem Gouider, Ridha Nouira- The Misalignment - Is it a Determinant of the
FDI in the Developing Countries?
EUROPEAN ACADEMIC RESEARCH - Vol. II, Issue 4 / July 2014
5413
Introduction
During these last years, the attitude to the Foreign Direct
Investment (FDI) has changed. The latter became a key factor
of economic growth, in the way that several countries have
liberalized their economic policy to attract more flows of FDI to
increase employment, exports, tax revenue and to benefit from
the technological transfer (Blomström and Kokko, 2003). Since
the crisis of the debts which started in Mexico in 1982,
developing countries seem to need more and more flows of FDI
to fill the insufficiency of their clean financial resources. Since
then, they have multiplied their economic policies to improve
the attractiveness of their territories.
Beyond the traditional factors of the FDI attraction,
there is another crucial incentive that has been ignored in
literature, namely the misalignement of the real exchange rate.
According to Edwards (1989), misalignment refers to the set of
"sustained deviations of the real exchange rate observed in
relation to the level of the long-term equilibrium." The degree of
misalignment leads to imbalances represented by the
phenomena of over-or under-evaluation of the real exchange
rate which is expressed by losses or gains in competitiveness.
The misalignment of the exchange rate appears to be a key
determinant of the FDI flows. In fact, an overvalued exchange
rate negatively affects the economic competitiveness and can
reduce the FDI for domestic goods (raw materials, natural
resources....) which become more expensive and discourages
foreign investors. Conversely, by improving the competitiveness
of domestic products, the undervaluation may attract the FDI.
The prices of raw materials and domestic wages may encourage
the location of multinationals.
The overvaluation is expected to cause a decrease in the
entry of FDI since an overvalued of home currency may restrain
foreign investors to obtain for a domestic asset, since such an
investment may still be too expensive. However, the
Abdessalem Gouider, Ridha Nouira- The Misalignment - Is it a Determinant of the
FDI in the Developing Countries?
EUROPEAN ACADEMIC RESEARCH - Vol. II, Issue 4 / July 2014
5414
undervaluation is expected to cause an increase of the entry of
the FDI since an undervaluation of the home currency produces
domestic assets clearly cheap for foreign investors.
The results of the empirical studies which attempted to
empirically estimate the relationship between the
misalignment of the real exchange rate and the FDI flows
haven't been unanimously agreed. Indeed, if Grossmann and al.
(2008) were able to show that the undervaluation of the dollar
encourages the attraction of the FDI to the United States, then
its overvaluation hampers its entry, Hasnat (1998) found no
relationship between the two variables. Bénassy-Quéré and al.
(2001) found that exchange-rate volatility is detrimental to the
foreign direct investment (FDI) and that its impact compares
with that of misalignments. One policy implication is that the
building of currency blocks could be a way of increasing FDI to
emerging countries as a whole. Lee and Min (2011) found that,
for Korea, the effect of exchange rate volatility on the FDI is
persistent, whereas the misalignment level is only temporary.
However, they suggested that multinational firms consider
volatility to be more a generic determinant of the foreign
investment than misalignment of exchange rate level.
The aim of this paper is to contribute to the debate on
the relationship between the misalignment of currencies of the
developing countries and the FDI in these countries. To carry
out this research, this paper is organized as follows. In the first
section, we will discuss the determinants of the FDI in the
developing countries. In the second section, we will determine
the values of misalignment for a sample of 52 countries over the
period 1980-2010. For this reason, a model in Panel of Edwards
will be estimated. Finally, a set of econometric models are
estimated in order to detect the direction of the relationship
between the misalignment of the real exchange rate and the
FDI in these developing countries.
Abdessalem Gouider, Ridha Nouira- The Misalignment - Is it a Determinant of the
FDI in the Developing Countries?
EUROPEAN ACADEMIC RESEARCH - Vol. II, Issue 4 / July 2014
5415
1. Determinants of the FDI in the Developing Countries
The objective of this section is to identify the main factors that
explain the volume of FDI received by an economy of the
developing countries. In fact, the majority of the developing
countries try to meet the necessary criteria to attract more
foreign capital. However, there is no unified theoretical
framework which brings together all the determinants of the
FDI. In literature, the attractiveness of the FDI is conditioned
not only by economic factors but also by socio-political and
institutional factors.
Economic factors are mainly related to the market size,
to the degree of openness of the host economy and to the
macroeconomic stability.
The domestic market size is considered a key factor
in attracting foreign capital (Faustino and Leitao, 2010; Hailu,
2010). Some empirical studies have approximated this variable
by the GDP (Billigton, 1999; Moosa 2008), while other studies
used the GNP as an approximation of this factor (Metwally,
2004; Schneider and Frey, 1985). In some studies, this variable
is approximated by the GDP per capita (Alkinkube, 2003).
In all cases, strong economic growth may encourage the
entry of the FDI because it is synonymous with an increase in
the national income and domestic demand. This favors the
horizontal FDI. Indeed, multinationals seek again new market
shares. So, the more economic growth in the host country is
important, the greater domestic demand is and the more
massive inflows of the FDI will be.
Trade openness is also considered as a major
determinant that contributes positively to the FDI (Asiedu,
2002; Fedderke and Romm, 2006). The more liberal economy of
the host country will be encouraged the more foreign firms to
locate in this country. They will undergo fewer customs taxes
and will be more likely to find markets for their products.
Besides the market size, Alkinkube (2003) showed that the
Abdessalem Gouider, Ridha Nouira- The Misalignment - Is it a Determinant of the
FDI in the Developing Countries?
EUROPEAN ACADEMIC RESEARCH - Vol. II, Issue 4 / July 2014
5416
decision whether to invest in a developing country also depends
on the economic liberalization and the export promotion
policies. Several empirical studies have shown a positive
relationship between trade openness and the FDI (Chakrabarti,
2001; Asiedu, 2002). Generally, the economic openness is
measured by the sum of imports and exports relative to the
GDP.
The quality of infrastructure is an indicator of
attractiveness of the FDI. Indeed, the establishment of a basic
infrastructure (roads, airports, telecommunications ...) may
attract foreign investment flows (Asiedu, 2002; Deichmann et
al., 2003). The infrastructure is at the origin of productivity
gains because it allows the minimization of production costs
(costs of communication, transport, etc.). The foreign companies
try to exploit cost differences between different locations. This
is compatible with the vertical FDI. The quality of
infrastructure in the host country is usually determined by the
number of telephone lines per thousand people. In some
studies, this variable is approximated by the total expenditure
of the government on transportation and communication
(James, 2008).
Macroeconomic stability: This variable is usually
approximated by the inflation rate. A high inflation rate is
synonymous with the national currency depreciation and thus a
loss in terms of consumer purchasing power means a decline in
the domestic demand. Inflation is then negatively related to the
FDI (Woodward and Rolfe, 1993; Addison and Heshmati, 2003).
Financial development has a positive effect on the
entry of the FDI (Deichmann, Karidis and Sayek, 2003). A solid
financial system can facilitate the transfer of technology. It can
also contribute to the realization of sustainable economic
growth. This variable is approximated by the share of private
credit in the GDP (James, 2008).
The institutional and socio-political factors refer to
the political stability, governance and quality of institutions.
Abdessalem Gouider, Ridha Nouira- The Misalignment - Is it a Determinant of the
FDI in the Developing Countries?
EUROPEAN ACADEMIC RESEARCH - Vol. II, Issue 4 / July 2014
5417
Several empirical studies have shown that inefficient
institutions discourage the entry of the FDI (Gastanaga et al.,
1998; Asiedu and Villamil, 2000). In addition, the bad
governance can produce corruption and bureaucracy. Wei
(2000) studied the impact of corruption on the flows of the FDI
in 45 host countries. He found a negative relationship between
the level of corruption and the entry of the FDI in the host
country. Thus, political instability, corruption and bureaucracy
create an unfavorable environment to foreign investment
because the violation of the law affects the attractiveness of
territory, reduces confidence and increases the uncertainty
about the potential benefits of this investment.
The continuous search of natural resources
remains a fundamental incentive for the FDI entry and
explains the important part of foreign capital in the developing
countries. It is recognized that the country»s endowments of
production factors (natural resources, labor and capital) can
affect the attractiveness of the FDI. In this context, Aseidu
(2002), and Dupasquier Osajwe (2006) showed that natural
resources in the African countries attract more foreign
investments.
2. Misalignment and FDI
Misalignment can have positive or negative implications on the
flows of foreign direct investments. Indeed, the undervaluation
of the currency can stimulate the production of the exportable
goods which are more competitive on the international market.
This undervaluation could attract the foreign investments
either because it values them, or because it reduces the cost of
the production factors and increases, as a consequence, the
profitability of the investments in the country. In this case, the
currency undervaluation of the developing countries should
increase the entry of the flows of the FDI in these countries.
However, the currency overvaluation makes national products
Abdessalem Gouider, Ridha Nouira- The Misalignment - Is it a Determinant of the
FDI in the Developing Countries?
EUROPEAN ACADEMIC RESEARCH - Vol. II, Issue 4 / July 2014
5418
less competitive on the international markets and, as a
consequence, hinders the export of these goods. Moreover, the
overvaluation increases the cost of the investment through the
enrichment of the production factors (construction, machines,
transportation equipment…). Thus, the currency overvaluation
of the developing countries should discourage foreign investors
to invest in these countries. Therefore, the impact of the
misalignment of the real exchange rate on the foreign direct
investments depends on its nature. In reality, an
undervaluation of the currency should increase the FDI, while
an overvaluation should decrease it.
Very few studies took into account the role played by the
misalignment in the attraction of the FDI. Among these studies
we cite the work of Soydemir and Grossmann (2006). These two
authors found a negative relation between the deviation of the
real exchange rate observed by its level of PPA and the FDI
incomers in the United States. In 1998, Hasnat found no
relation between the misalignment (calculated as the difference
between the observed rate and the rate of balance of
Purchasing Power Parity (PPA)) and the flows of the FDI. By
contrast, Grossmann and al. (2008) could show the sensibility of
the FDI flows in the values of overvaluation and the
undervaluation of the US dollar. In fact, they showed that the
undervaluation of the dollar encourages the entry of the FDI in
the United States, while its overvaluation hinders it. All these
studies focused on the impact of the misalignment on the FDI
in the developed countries. For the developing countries,
Bénassy-Quéré and al. (2001) found that exchange-rate
misalignment is detrimental to foreign direct investment (FDI)
to emerging countries as a whole. Lee and Min (2011) found
that, for the Korea, the effect of exchange rate misalignment on
FDI is temporary.
In this paper, in addition to the misalignment of a
currency, the timing and the persistence of the misalignment
(overvalued or undervalued currency) might play an important
Abdessalem Gouider, Ridha Nouira- The Misalignment - Is it a Determinant of the
FDI in the Developing Countries?
EUROPEAN ACADEMIC RESEARCH - Vol. II, Issue 4 / July 2014
5419
role in analyzing the relationship between exchange rates and
FDI flows and that the omission of timing and the
overvaluation persistence in previous papers may cause the
inconclusive results.
In this section, we shall try to calculate the degree of
misalignment of the currencies of a sample of 52 developing
countries over the period 1980-2010. Then, we will determine
the impact of misalignment on the flows of the FDI in the
developing countries. So, we will introduce the variable
"misalignment" into the models of the FDI and we determine
the signification of the latter.
2.1 The misalignment of the real exchange rate
The economic model:
Over the last 30 years, the economic literature on the exchange
rate has developed in a way that allowed determining the
influence of a limited range of variables affecting the long run
real value of a currency (e.g. Williamson, 1994; Edwards, 1998).
These variables, called the ««fundamentals»«, include not only
external factors (e.g. the international terms of trade) but also
internal factors (e.g. government expenditure). The impact of
these determinants can be estimated through an econometric
regression and are used to calculate the Equilibrium Real
Effective Exchange Rate (EREER) as well as the potential
accompanying misalignment of the actual rate. Practically, the
Real Effective Exchange Rate (REER) is decomposed into the
EREER and misalignment. Edwards (1988) was the first to
propose an approach that makes it possible to distinguish
between the two sources of REER variations. The latter is
regressed on external and domestic ««fundamentals»« variables,
which bring about changes in the EREER if sustained over a
long time period and do not create misalignment, unless the
price adjustment is extremely sluggish. Much of the literature
has dealt with the advanced economies. “However, developing
Abdessalem Gouider, Ridha Nouira- The Misalignment - Is it a Determinant of the
FDI in the Developing Countries?
EUROPEAN ACADEMIC RESEARCH - Vol. II, Issue 4 / July 2014
5420
countries typically face different sets of structure issues, and a
more limited availability of data. Edwards (1986, 1989a, 1994)
made a seminal attempt to build an equilibrium exchange rate
model specifically tailored to developing countries”2. This model
was adopted by several authors such as Mongardini (1998),
Domaç and Shabsigh (1999), Nouira and al. (2011), Nouira and
Sekkat (2012) … In literature, the fundamental variables which
can act on the internal and external balance are multiple. In
this paper, six are retained namely:
- The bias of productivity (or the Balassa-Samuelson effect)
(Balassa)
- The terms of international trade (TOT)
- The degree of openness (Open)
- The government consumption (Gov)
- The debt services (Debtser)
- The net capital inflow (Capinf)
So Edward»s model can be represented under the following
shape:
(1)
The econometric analyses :
In this work, we will estimate the Edwards» model in panel for
a sample of 52 developing countries (Appendix A) over the
period 1980-2010. The sample is determined according to the
availability of data with the major source of information we
used (e.g., the World Development indicators of the World
Bank). The endogenous variable of this model is the index of
the real effective exchange rate (REER) calculated by
considering 10 main importing countries. An increase of this
2Spatotafor N., and Stavrev E., (2003). “The equilibrium Real Exchange Rate
in a commodity Exporting country: The cas of Russia”, IMF working paper
WP/03/93
Abdessalem Gouider, Ridha Nouira- The Misalignment - Is it a Determinant of the
FDI in the Developing Countries?
EUROPEAN ACADEMIC RESEARCH - Vol. II, Issue 4 / July 2014
5421
rate implies an appreciation of the REER. It is necessary to
note that, with the exception of capital inflows of which the sign
is uncertain, these variables are expressed in logarithm.
Therefore, the empirical model to be estimated is the following:
(2)
Before the estimation of model (2), a stationarity test on the
variables of the model is requested. To examine the
stationarity, we use a Pesaran (2007) test. This test presents a
new and simple procedure for testing unit roots in dynamic
panels subject to (possibly) cross sectionally dependent as well
as serially correlated errors. This test is built on the well-
known augmented Dickey-Fuller regressions. Practically, we
consider yit pertaining to the individual i at time t. Run the
regression:
(3)
and take the calculated Student statistics of ρi ; ti. Where is
the average of yit over all the individuals at time t. The statistic
(4)
is used to test for stationarity. The critical values of the CIPS
test can be computed by stochastic simulation for any fixed T >
3. We follow Pesaran (2007) and simulate the critical values
using the Monte Carlo approach. The results of the test applied
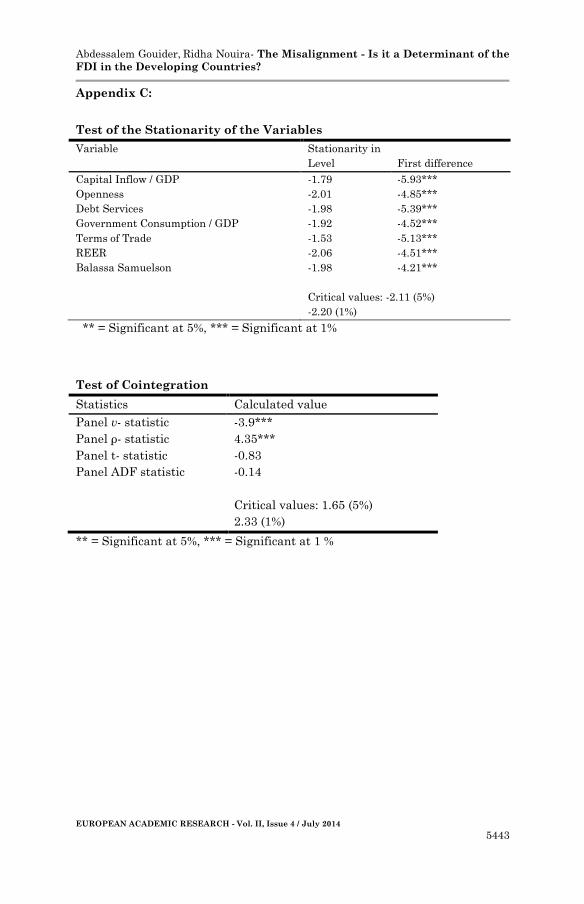
to our sample are presented in Appendix C. The tests reveal
that all the variables are I (1). Hence, if we find a relationship
between the variables that gives stationary residuals, these
variables will be considered as cointegrated.
Abdessalem Gouider, Ridha Nouira- The Misalignment - Is it a Determinant of the
FDI in the Developing Countries?
EUROPEAN ACADEMIC RESEARCH - Vol. II, Issue 4 / July 2014
5422
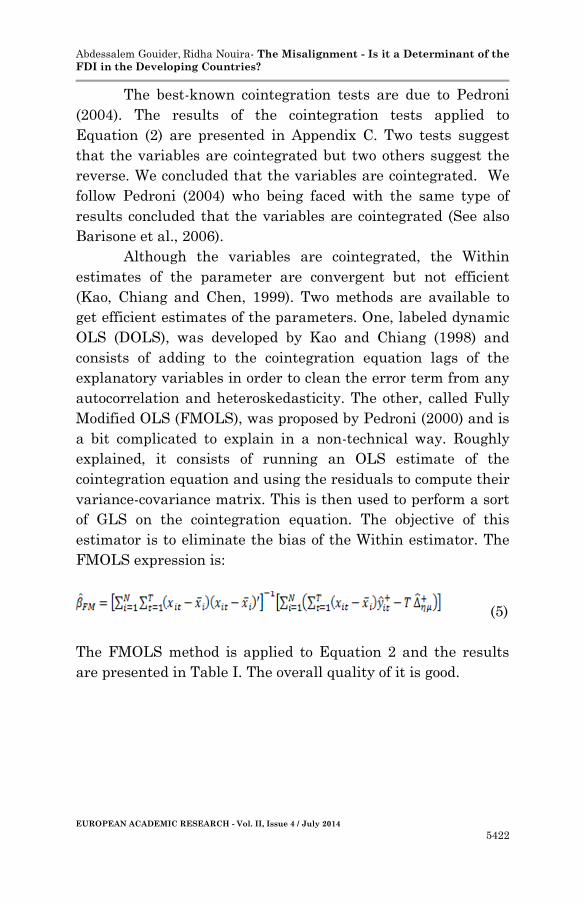
The best-known cointegration tests are due to Pedroni
(2004). The results of the cointegration tests applied to
Equation (2) are presented in Appendix C. Two tests suggest
that the variables are cointegrated but two others suggest the
reverse. We concluded that the variables are cointegrated. We
follow Pedroni (2004) who being faced with the same type of
results concluded that the variables are cointegrated (See also
Barisone et al., 2006).
Although the variables are cointegrated, the Within
estimates of the parameter are convergent but not efficient
(Kao, Chiang and Chen, 1999). Two methods are available to
get efficient estimates of the parameters. One, labeled dynamic
OLS (DOLS), was developed by Kao and Chiang (1998) and
consists of adding to the cointegration equation lags of the
explanatory variables in order to clean the error term from any
autocorrelation and heteroskedasticity. The other, called Fully
Modified OLS (FMOLS), was proposed by Pedroni (2000) and is
a bit complicated to explain in a non-technical way. Roughly
explained, it consists of running an OLS estimate of the
cointegration equation and using the residuals to compute their
variance-covariance matrix. This is then used to perform a sort
of GLS on the cointegration equation. The objective of this
estimator is to eliminate the bias of the Within estimator. The
FMOLS expression is:
(5)
The FMOLS method is applied to Equation 2 and the results
are presented in Table I. The overall quality of it is good.
Abdessalem Gouider, Ridha Nouira- The Misalignment - Is it a Determinant of the
FDI in the Developing Countries?
EUROPEAN ACADEMIC RESEARCH - Vol. II, Issue 4 / July 2014
5423
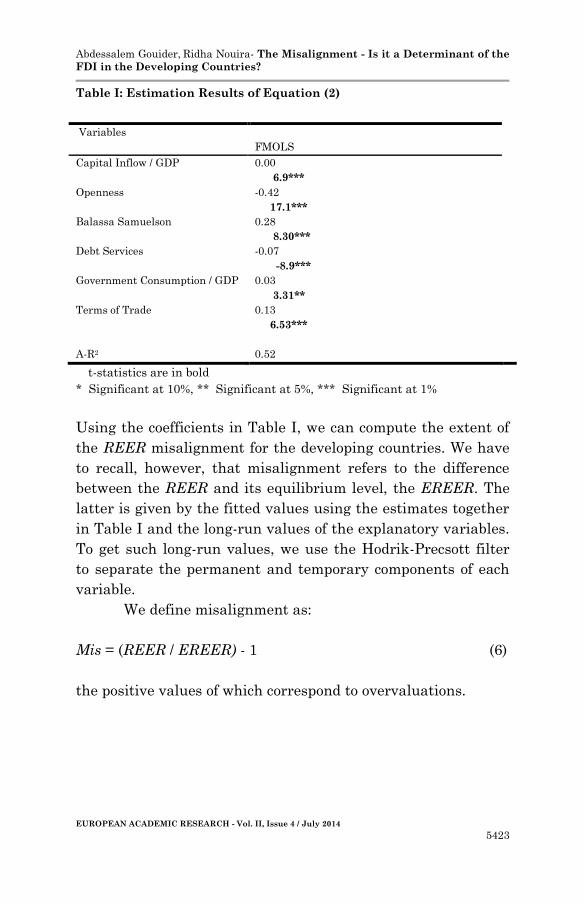
Table I: Estimation Results of Equation (2)
Variables
FMOLS
Capital Inflow / GDP 0.00
6.9***
Openness -0.42
17.1***
Balassa Samuelson 0.28
8.30***
Debt Services -0.07
-8.9***
Government Consumption / GDP 0.03
3.31**
Terms of Trade 0.13
6.53***
A-R2 0.52
t-statistics are in bold
* Significant at 10%, ** Significant at 5%, *** Significant at 1%
Using the coefficients in Table I, we can compute the extent of
the REER misalignment for the developing countries. We have
to recall, however, that misalignment refers to the difference
between the REER and its equilibrium level, the EREER. The
latter is given by the fitted values using the estimates together
in Table I and the long-run values of the explanatory variables.
To get such long-run values, we use the Hodrik-Precsott filter
to separate the permanent and temporary components of each
variable.
We define misalignment as:
Mis = (REER / EREER) - 1 (6)
the positive values of which correspond to overvaluations.
Abdessalem Gouider, Ridha Nouira- The Misalignment - Is it a Determinant of the
FDI in the Developing Countries?
EUROPEAN ACADEMIC RESEARCH - Vol. II, Issue 4 / July 2014
5424
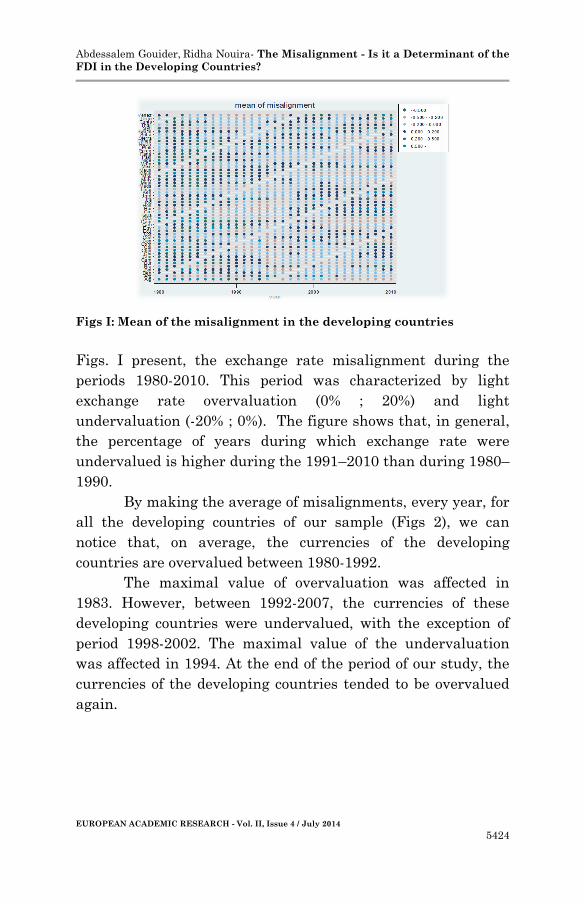
Figs I: Mean of the misalignment in the developing countries
Figs. I present, the exchange rate misalignment during the
periods 1980-2010. This period was characterized by light
exchange rate overvaluation (0% ; 20%) and light
undervaluation (-20% ; 0%). The figure shows that, in general,
the percentage of years during which exchange rate were
undervalued is higher during the 1991–2010 than during 1980–
1990.
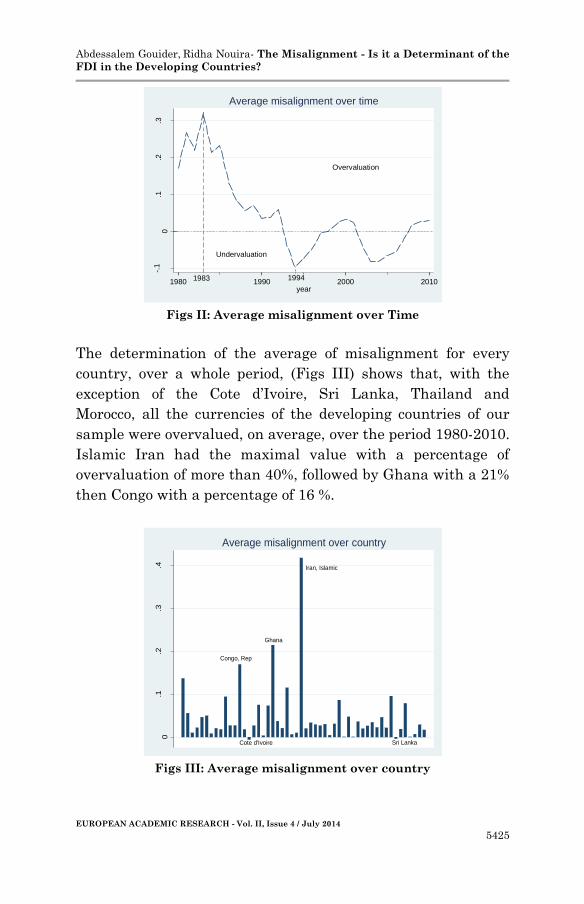
By making the average of misalignments, every year, for
all the developing countries of our sample (Figs 2), we can
notice that, on average, the currencies of the developing
countries are overvalued between 1980-1992.
The maximal value of overvaluation was affected in
1983. However, between 1992-2007, the currencies of these
developing countries were undervalued, with the exception of
period 1998-2002. The maximal value of the undervaluation
was affected in 1994. At the end of the period of our study, the
currencies of the developing countries tended to be overvalued
again.
Abdessalem Gouider, Ridha Nouira- The Misalignment - Is it a Determinant of the
FDI in the Developing Countries?
EUROPEAN ACADEMIC RESEARCH - Vol. II, Issue 4 / July 2014
5425
Overvaluation
Undervaluation
-.1
0.1
.2.3
(mea
n)
mis
%
1980 1990 2000 2010year
Average misalignment over time
1983 1994
Figs II: Average misalignment over Time
The determination of the average of misalignment for every
country, over a whole period, (Figs III) shows that, with the
exception of the Cote d’Ivoire, Sri Lanka, Thailand and
Morocco, all the currencies of the developing countries of our
sample were overvalued, on average, over the period 1980-2010.
Islamic Iran had the maximal value with a percentage of
overvaluation of more than 40%, followed by Ghana with a 21%
then Congo with a percentage of 16 %.
Iran, Islamic
Ghana
Cote d'Ivoire Sri Lanka
Congo, Rep
0.1
.2.3
.4
mea
n o
f m
is %
Average misalignment over country
Figs III: Average misalignment over country
Abdessalem Gouider, Ridha Nouira- The Misalignment - Is it a Determinant of the
FDI in the Developing Countries?
EUROPEAN ACADEMIC RESEARCH - Vol. II, Issue 4 / July 2014
5426
2.2 Empirical Relation between the misalignment and
the FDI
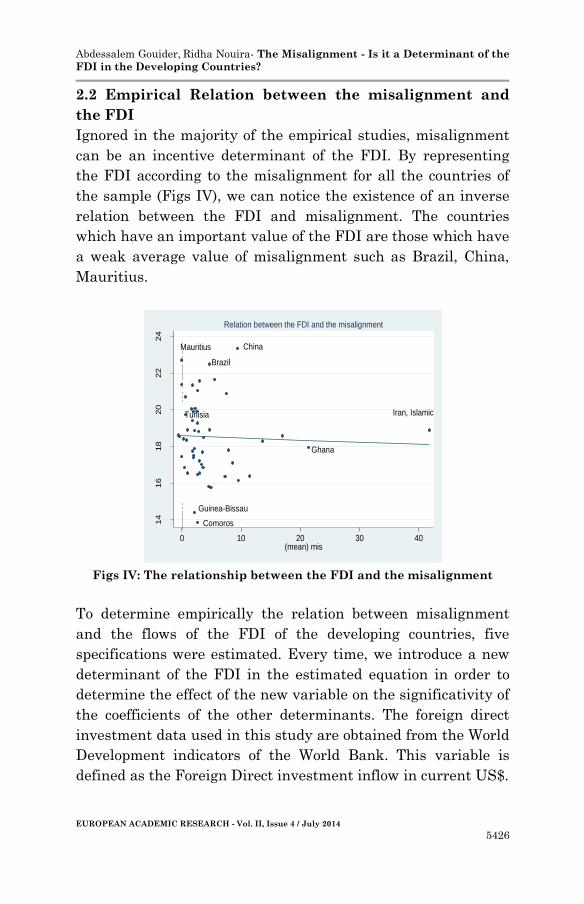
Ignored in the majority of the empirical studies, misalignment
can be an incentive determinant of the FDI. By representing
the FDI according to the misalignment for all the countries of
the sample (Figs IV), we can notice the existence of an inverse
relation between the FDI and misalignment. The countries
which have an important value of the FDI are those which have
a weak average value of misalignment such as Brazil, China,
Mauritius.
Iran, Islamic
China
Comoros
Mauritius
Ghana
Guinea-Bissau
Brazil
Tunisia
14
16
18
20
22
24
(mea
n)
log(F
DI)
0 10 20 30 40(mean) mis
Relation between the FDI and the misalignment
Figs IV: The relationship between the FDI and the misalignment
To determine empirically the relation between misalignment
and the flows of the FDI of the developing countries, five
specifications were estimated. Every time, we introduce a new
determinant of the FDI in the estimated equation in order to
determine the effect of the new variable on the significativity of
the coefficients of the other determinants. The foreign direct
investment data used in this study are obtained from the World
Development indicators of the World Bank. This variable is
defined as the Foreign Direct investment inflow in current US$.
Abdessalem Gouider, Ridha Nouira- The Misalignment - Is it a Determinant of the
FDI in the Developing Countries?
EUROPEAN ACADEMIC RESEARCH - Vol. II, Issue 4 / July 2014
5427
To estimate theses specifications, we must take account of
possible endogeneity of the explanatory variable. Indeed, the
endogeneity problem comes from several ways. For example,
the FDI may affect the misalignment simultaneously. In fact,
misalignment is defined as a function, among the determinants
of REER, the terms of international trade (TOT) and the net
capital inflow(Capinf). These two variables could be affected by
FDI flow or stock. Thus the misalignment could be a function of
existing FDI or FDI flow. We use two estimators: the two-stage
least-squares (2SLS) and the GMM with the lagged dependent
and explanatory variables as instruments. The test of
overidentifying restrictions is used to check the validity of the
estimates.
For all specifications, the period of the study covers the
period of 1980-2010, with the exception of the fifth specification
where the period of the study is 1984-2010. The sample of
countries varies from one specification to another depending on
the availability of the data.
Regarding to the first specification, we estimate the FDI
model for a sample of 50 developing countries (Appendix B). In
this specification, we will retain the following determinants:
• Degree of opening: this variable measures the degree of
economic opening of the host country. It is defined as the sum of
exports and imports relative to the GDP.
• Telephone Line: This variable approximates the degree of
development of the country’s infrastructure. It measures the
number of telephone lines per a thousand inhabitants.
• GDP Per capita: This is an indicator of the wealth of the
resident of the host country and then demand effectiveness. The
expected sign of the corresponding coefficient is positive.
• Primary School: We follow the literature in using as a human
capital indicator the primary school enrolment ratio.
These variables are from the World Development
Indicators published by the World Bank.
Abdessalem Gouider, Ridha Nouira- The Misalignment - Is it a Determinant of the
FDI in the Developing Countries?
EUROPEAN ACADEMIC RESEARCH - Vol. II, Issue 4 / July 2014
5428
In the second specification, we will add the variable
"Domestic credit" which approximates the degree of financial
development of the country. It is measured as the ratio of the
private credit to the GDP. This specification is estimated for a
sample of 49 developing countries (Appendix B).
In the third specification, the variable "Investment" is
considered as a determinant of the FDI. This variable informs
about the degree of the country industrialization. It is
approximated by the gross formation of fixed capital. This
specification is estimated for a sample of 47 countries
(Appendix B).
In the fourth specification, we will take into account the
variable "Inflation" as an approximation of the economic and
political stability of the country.
In the fifth specification, we will introduce the variable
"Political Risk" as a determinant of the FDI. The quality of
political institutions is measured by the political risk index
(ICRG). This index is a score of 100 points. It is the sum of 12
indicators relating to the transparency and quality of the
administrative system3. A high score (between 80 and 100)
indicates a low risk, whereas a low score (between 0 and 49.5)
indicates a high level of political risk. This index is positively
correlated with the FDI. This specification is estimated for a
sample of 38 countries (Appendix B) for the period 1984-2010.
We will introduce the variable misalignment that we calculated
in the 5 specifications. We do this by checking how much real
exchange rate misalignment affects the FDI in this period.
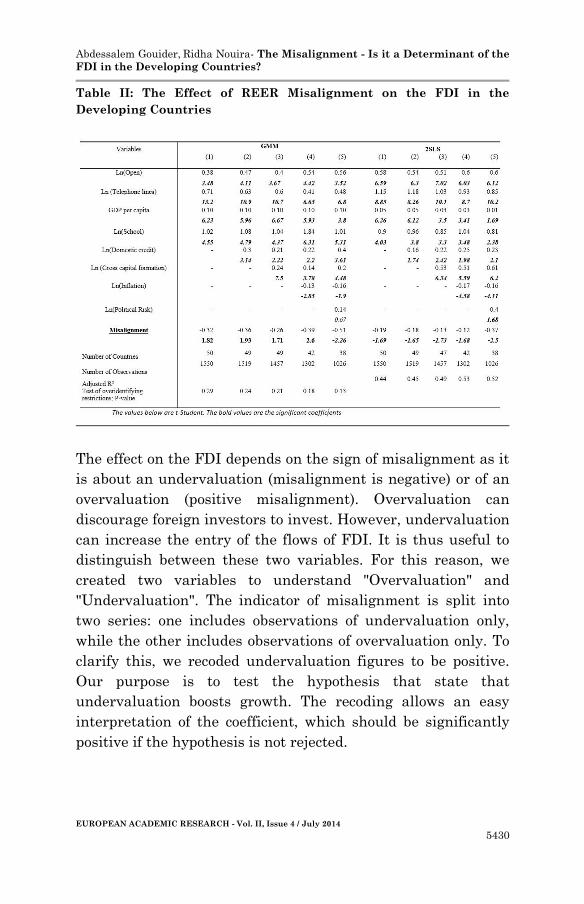
Table II recapitulates the results of the estimation of the 5
specifications with the variable misalignment.
3 The Indicator used to construct this index are given as follows: Stability and
sustainability of political power, Economic and social conditions, Investment
profile, Internal conflicts, External conflicts, Corruption, Implication of
military power in politics, Implication of religious power in politics, The level
and ability to respect the rule of law and State of Law, Ethnic tensions and
conflicts, Democratic Responsibility and Engagement of Bureaucracy,
Quality of bureaucracy.
Abdessalem Gouider, Ridha Nouira- The Misalignment - Is it a Determinant of the
FDI in the Developing Countries?
EUROPEAN ACADEMIC RESEARCH - Vol. II, Issue 4 / July 2014
5429
The results indicate that all the explanatory variables
have consistent pattern of significance and sign across
specifications. Indeed, the coefficient of the GDP per capita is
significant and positive. The coefficient of infrastructure and
Primary School are positive. Here, investors are mainly
concerned with the provision of infrastructure and the quality
of the human capital. Inflation pressures are associated with
less FDI, higher openness and better quality of development of
the country’s infrastructure (Telephone lines) are associated
with more FDI, the quality of political institutions has no
impact and the amelioration of the investment is associated
with more FDI.
Now, we attempt to study the relationship between the
RER misalignment and the foreign direct investment for the
main inquiry. With the 2SLS and irrespective of the
specification, the coefficient of the exchange rate misalignment
has a consistent significantly effect on FDI. Also, with the
GMM and irrespective of the specification, the coefficient of the
exchange rate misalignment has a consistent significantly effect
on FDI. The misalignment affects negatively the FDI in the
developing countries. The coefficient of the misalignment
variable is negative and statistically significant in all the
variants. Given the results of the test of overidentifying
restrictions, the GMM estimates are valid.
Abdessalem Gouider, Ridha Nouira- The Misalignment - Is it a Determinant of the
FDI in the Developing Countries?
EUROPEAN ACADEMIC RESEARCH - Vol. II, Issue 4 / July 2014
5430
Table II: The Effect of REER Misalignment on the FDI in the
Developing Countries
The effect on the FDI depends on the sign of misalignment as it
is about an undervaluation (misalignment is negative) or of an
overvaluation (positive misalignment). Overvaluation can
discourage foreign investors to invest. However, undervaluation
can increase the entry of the flows of FDI. It is thus useful to
distinguish between these two variables. For this reason, we
created two variables to understand "Overvaluation" and
"Undervaluation". The indicator of misalignment is split into
two series: one includes observations of undervaluation only,
while the other includes observations of overvaluation only. To
clarify this, we recoded undervaluation figures to be positive.
Our purpose is to test the hypothesis that state that
undervaluation boosts growth. The recoding allows an easy
interpretation of the coefficient, which should be significantly
positive if the hypothesis is not rejected.
Abdessalem Gouider, Ridha Nouira- The Misalignment - Is it a Determinant of the
FDI in the Developing Countries?
EUROPEAN ACADEMIC RESEARCH - Vol. II, Issue 4 / July 2014
5431
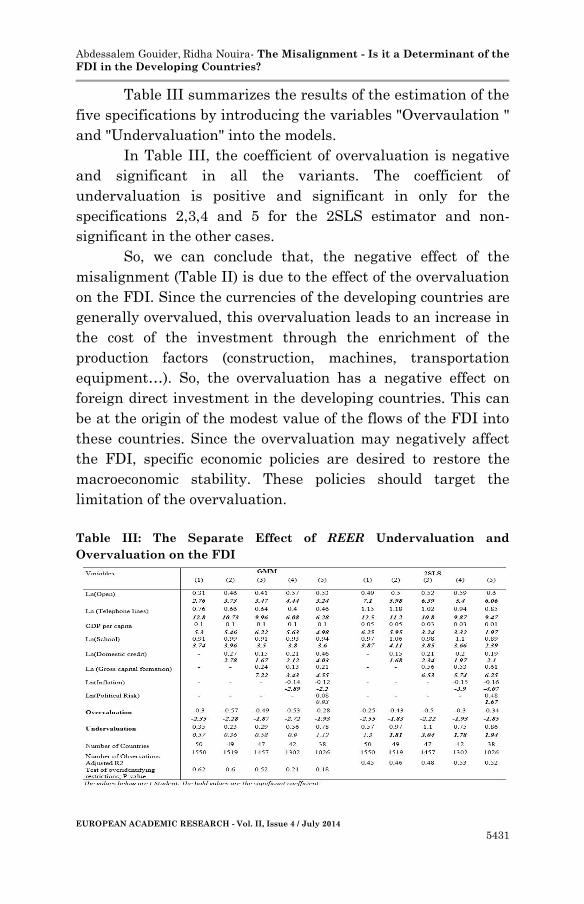
Table III summarizes the results of the estimation of the
five specifications by introducing the variables "Overvaulation "
and "Undervaluation" into the models.
In Table III, the coefficient of overvaluation is negative
and significant in all the variants. The coefficient of
undervaluation is positive and significant in only for the
specifications 2,3,4 and 5 for the 2SLS estimator and non-
significant in the other cases.
So, we can conclude that, the negative effect of the
misalignment (Table II) is due to the effect of the overvaluation
on the FDI. Since the currencies of the developing countries are
generally overvalued, this overvaluation leads to an increase in
the cost of the investment through the enrichment of the
production factors (construction, machines, transportation
equipment…). So, the overvaluation has a negative effect on
foreign direct investment in the developing countries. This can
be at the origin of the modest value of the flows of the FDI into
these countries. Since the overvaluation may negatively affect
the FDI, specific economic policies are desired to restore the
macroeconomic stability. These policies should target the
limitation of the overvaluation.
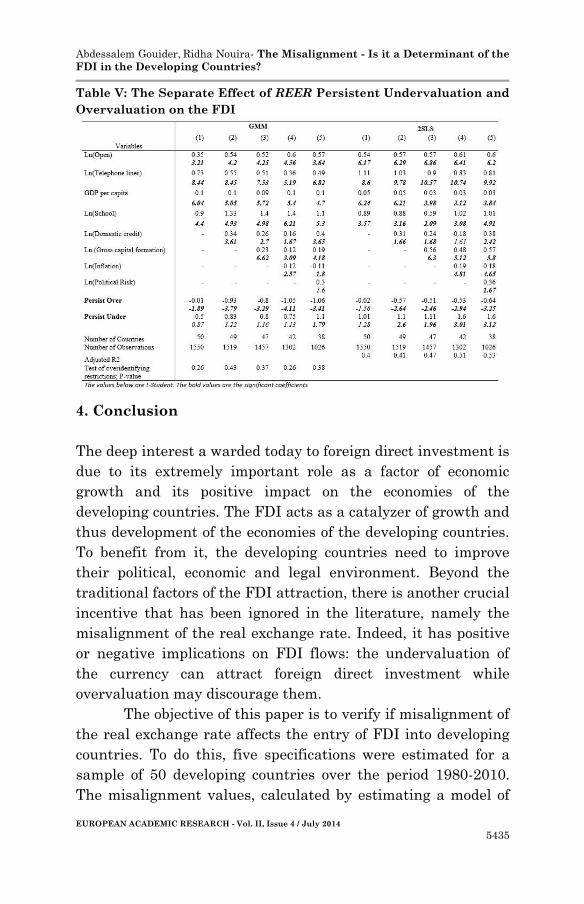
Table III: The Separate Effect of REER Undervaluation and
Overvaluation on the FDI
Abdessalem Gouider, Ridha Nouira- The Misalignment - Is it a Determinant of the
FDI in the Developing Countries?
EUROPEAN ACADEMIC RESEARCH - Vol. II, Issue 4 / July 2014
5432
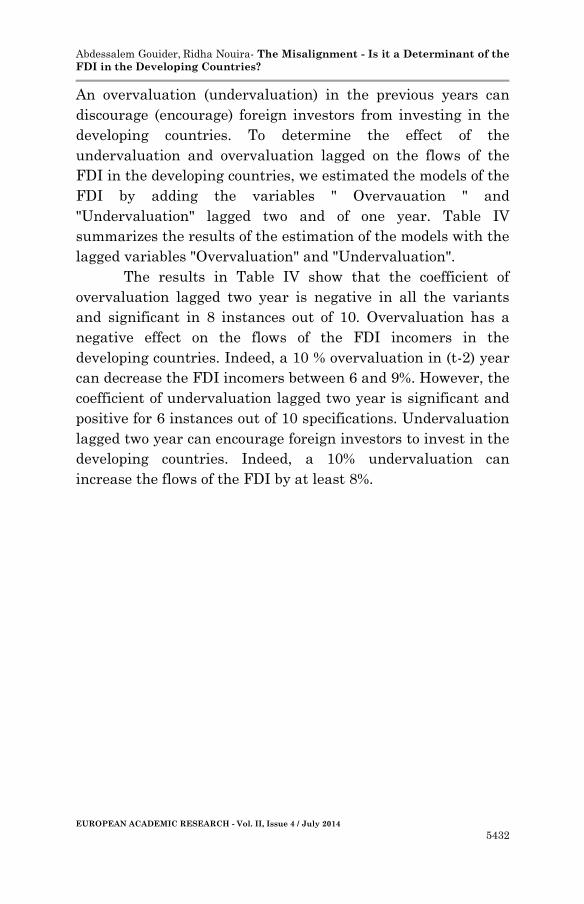
An overvaluation (undervaluation) in the previous years can
discourage (encourage) foreign investors from investing in the
developing countries. To determine the effect of the
undervaluation and overvaluation lagged on the flows of the
FDI in the developing countries, we estimated the models of the
FDI by adding the variables " Overvauation " and
"Undervaluation" lagged two and of one year. Table IV
summarizes the results of the estimation of the models with the
lagged variables "Overvaluation" and "Undervaluation".
The results in Table IV show that the coefficient of
overvaluation lagged two year is negative in all the variants
and significant in 8 instances out of 10. Overvaluation has a
negative effect on the flows of the FDI incomers in the
developing countries. Indeed, a 10 % overvaluation in (t-2) year
can decrease the FDI incomers between 6 and 9%. However, the
coefficient of undervaluation lagged two year is significant and
positive for 6 instances out of 10 specifications. Undervaluation
lagged two year can encourage foreign investors to invest in the
developing countries. Indeed, a 10% undervaluation can
increase the flows of the FDI by at least 8%.
Abdessalem Gouider, Ridha Nouira- The Misalignment - Is it a Determinant of the
FDI in the Developing Countries?
EUROPEAN ACADEMIC RESEARCH - Vol. II, Issue 4 / July 2014
5433
Table IV: The Separate Effect of REER Lagged Undervaluation and
Overvaluation on the FDI
So, for the case of the developing countries, then an
appreciating overvalued home currency in the (t-2) period can
cause a decrease of inbound FDI. Consequently, for the
developing countries, we find a negative relationship between
an overvaluation lagged two year and inbound FDI. Also, we
find that an increase in inbound FDI in the developing
Abdessalem Gouider, Ridha Nouira- The Misalignment - Is it a Determinant of the
FDI in the Developing Countries?
EUROPEAN ACADEMIC RESEARCH - Vol. II, Issue 4 / July 2014
5434
countries is related positively to a strengthening of an
undervalued home currency in the (t-2) period.
The results show that investors are mainly toward
countries with undervalued lagged two years. This supports the
positive impact of undervaluation and the negative effect of
overvaluation on FDI.
To take into account the persistence dimension, we
construct two new variables: Persistent Undervaluation
(PersistUnder) and Persistent Overvaluation (PersistOver ). If
during the past five years, the exchange rate was always
undervalued (overvalued) “PersistUnder” (“PersistOver”) takes
as a value of the average undervaluation (overvaluation) in the
five years. Otherwise, the variable takes the value 0. Table V
summarizes the results of the estimation of the five
specifications with variables “PersistOver” and “PersistUnder”.
Out of the 10 coefficients pertaining to undervaluation
in Tables 5, only five are negative and significant. In contrast,
the coefficients pertaining to overvaluation are significant and
negative in 9 instances out of 10. Therefore, we can conclude
that a continuous undervaluation can positively affect the entry
of the FDI into these developing countries. This may be
explained by the fact that a persistent undervaluation of home
currency leaves domestic assets still a bargain for foreign
investors. On the other hand, the overvaluation appears to
negatively affect the FDI in the developing countries.
Abdessalem Gouider, Ridha Nouira- The Misalignment - Is it a Determinant of the
FDI in the Developing Countries?
EUROPEAN ACADEMIC RESEARCH - Vol. II, Issue 4 / July 2014
5435
Table V: The Separate Effect of REER Persistent Undervaluation and
Overvaluation on the FDI
4. Conclusion
The deep interest a warded today to foreign direct investment is
due to its extremely important role as a factor of economic
growth and its positive impact on the economies of the
developing countries. The FDI acts as a catalyzer of growth and
thus development of the economies of the developing countries.
To benefit from it, the developing countries need to improve
their political, economic and legal environment. Beyond the
traditional factors of the FDI attraction, there is another crucial
incentive that has been ignored in the literature, namely the
misalignment of the real exchange rate. Indeed, it has positive
or negative implications on FDI flows: the undervaluation of
the currency can attract foreign direct investment while
overvaluation may discourage them.
The objective of this paper is to verify if misalignment of
the real exchange rate affects the entry of FDI into developing
countries. To do this, five specifications were estimated for a
sample of 50 developing countries over the period 1980-2010.
The misalignment values, calculated by estimating a model of
Abdessalem Gouider, Ridha Nouira- The Misalignment - Is it a Determinant of the
FDI in the Developing Countries?
EUROPEAN ACADEMIC RESEARCH - Vol. II, Issue 4 / July 2014
5436
Edwards in panel have been introduced in the models of the
FDI. The results show, firstly, that misalignment is a major
determinant of the FDI in the developing countries. In reality,
overvaluation has a negative and significant effect on FDI.
Secondly, we demonstrated that the overvaluation and
undervaluation delayed by two periods can have a significant
effect on the FDI. Delayed overvaluation has a negative effect
while delayed undervaluation has a positive effect. Finally, the
introduction of the variables "PersistOver" and "PersistUnder"
makes as conclude that the persistence of over-or
undervaluation has a significant effect on the FDI. In fact, a
persistent overvaluation can discourage the FDI inflows to the
developing countries whereas a persistent undervaluation
encourages it. So, the results support the view that foreign
investors are interested in how a currency is overvalued or
undervalued.
REFERENCES
Aitken, B.J., A.E. Harrison, and R.E. Lipsey. 1996. “Wages and
Foreign Ownership: A Comparative Study of Mexico,
Venezuela and the United States.” Journal of
International Economics, 40 (3-4): 345-71.
Alkinkube, O. 2003. “Flow of Foreign Direct investment to
Hitherto Neglected Developing Countries.” Paper
presented at the WIDER Conference on ‘The New
Economy in Development’, 2, 23-24 January 2003,
Helsinki.
Asiedu, E. 2002. “On the determinants of foreign direct
investment to developing countries: Is Africa different?”
World Development 30: 107–19.
Barisone, G., R. Driver and S. Wren-Lewis. 2006. "Are our
FEERs Justified?" Journal of International Money and
Finance 741-759.
Abdessalem Gouider, Ridha Nouira- The Misalignment - Is it a Determinant of the
FDI in the Developing Countries?
EUROPEAN ACADEMIC RESEARCH - Vol. II, Issue 4 / July 2014
5437
Bénassy-Quéré, A., L. Fontagné, and A. Lahrèche-Révil. 2001.
“Exchange-Rate Strategies in the Competition for
Attracting Foreign Direct Investment.” Journal of the
Japanese and International Economies 15 : 178-198.
Blomström, M. and A. Kokko. 2003. “The economics of foreign
direct investment incentives.” Working Paper 9489,
http://www.nber.org/papers/w9489
Blomström, M. and A. Kokko. 1998. “Multinational
Corporations and Spillovers.” Journal of Economic
Surveys 12 (2).
Billington, N. 1999. “The Location of Foreign Direct
Investment: an Empirical Analysis.” Applied Economics,
31(1): 65-76.
Chakrabarti, A. 2001. “Determinants of FDI: A Comment on
Globalization-Induced Changes and the Role of FDI
Policies.” Dept. Of Economies, University of Wisconsin,
Milwaukee, WI 53201, U.S.A.
Choi, C. 2003. “Does the internet stimulate inward foreign
direct investment?” Journal of Policy Modeling (25):
319–26.
CNUCED, Rapport sur l’investissement dans le monde, 2012.
CNUCED, World Investment Report, 2004.
Deichmann J., S. Karidis and S. Sayek. 2003. “Foreign direct
investment in Turkey: Regional determinants.” Applied
Economics 35: 1767–78.
Domaç, I. and G. Shabisigh. 1999. “Real Exchange Rate
Behavior and Economic Growth: Evidence from Egypt,
Jordan, Morocco, and Tunisia.” IMF Working Paper
WP/99/40.
Dupasquier, C. and P.N. Osajwe. 2006. “Foreign direct
investment in Africa: Performance, challenges, and
responsibilities.” Journal of Asian Economics 17 (2): 241-
60.
Abdessalem Gouider, Ridha Nouira- The Misalignment - Is it a Determinant of the
FDI in the Developing Countries?
EUROPEAN ACADEMIC RESEARCH - Vol. II, Issue 4 / July 2014
5438
Edwards, S. 1986. “Real Exchange Rate Variability: An
Empirical Analysis of the Developing Countries case.”
NBER Working paper No.1930
Edwards, S. 1989a. “Exchange Rate Misalignment in
Developing Countries.” The World Bank Research
Observer, 4 (1): 3-21, Washington DC.
Edwards, S. 1989b. Real exchange Rates, Devaluation and
adjustment: Exchange Rate Policy in Developing
Countries. Cambridge, Massachusetts: MIT Press.
Edwards, S. 1994. ‘‘Real and monetary determinants of real
exchange rate behavior: Theory and evidence from
developing countries.” In Estimating Equilibrium
Exchange Rates, edited by J. Williamson, Washington,
D.C.: Institute for International Economics.
Edwards, S. 1998. “The Mexican Peso Crisis: How Much Did
We Know? When Did We Know It?” NBER WP 6334.
Fedderke, J. W. and A. T. Romm. 2006. ‘‘Growth Impact and
Determinants of Foreign Direct Investment into South
Africa 1956–2003.’’ Economic Modelling 23: 738–60.
Feenestra, R. and J. Markusen. 1994. ‘‘Accounting for Growth
with New Inputs.’’ International Economic Review 35:
429-47.
Gastanaga, V., J. Nugent and B. Pashamiova. 1998. ‘‘Host
Country Reforms and FDI Inflows: How Much
Difference Do They Make?’’ World Development 26(7):
1299-1314.
Grossmann, A., M.W. Simpson and C.J. Brown. 2008. ‘‘The
impact of deviation from relative purchasing power
parity equilibrium on U.S. foreign direct investment.’’
The Quarterly Review of Economics and Finance.
Hailu, Z.A. 2010. ‘‘Impact of Foreign Direct Investment on
Trade of African Countries.’’ International Journal of
Economics and Finance 2: 122-33.
Abdessalem Gouider, Ridha Nouira- The Misalignment - Is it a Determinant of the
FDI in the Developing Countries?
EUROPEAN ACADEMIC RESEARCH - Vol. II, Issue 4 / July 2014
5439
Hansen B.E., 1992. ‘‘Tests for parameter instability in
regression with I (1) process.’’ Journal of Business and
Economic Statistics 10: 321-35.
James B. Ang. 2008. ‘‘Determinants of foreign direct investment
in Malaysia.’’ Journal of Policy Modeling 30: 185–89.
Kao, C., M-H. Chiang and B. Chen. 1999. ‘‘International R&D
Spillovers: An Application of Estimation and Inference
in Panel Cointegration.’’ Oxford Bulletin of Economics
and Statistics, Special issue: 691-709.
Lee, B. and B. Min. 2011. “Exchange rates and FDI strategies of
multinational enterprises.” Pacific-Basin Finance
Journal 19(5): 586-603.
Leitão, N.C., and H.C. Faustino. 2010. ‘‘Determinants of
Foreign Direct Investment in Portugal.’’ Journal of
Applied Business and Economics 11(3).
Metwally, M.M. 2004. ‘‘Impact of EU FDI on Economic Growth
in Middle Eastern Countries.’’ European Business
Review 16(4): 381-89.
Mongardini, J. 1998. ‘‘Estimating Egypt’s Equilibrium Real
Exchange Rate.’’ IMF Working Paper WP/98/5.
Moosa, I.A. 2008. ‘‘The Determinants of Foreign Direct
Investment in MENA Countries: an Extreme Bounde
Analysis.’’ Applied Economics Letters 16 (15): 1559-63.
Morrissey O. and D.W. TeVelde. 2003. ‘‘Do Workers in Africa
get a Wage Premium if employed in Firms owned by
Foreigners?’’ Journal of African Economies 12 (1): 41-73.
Nouira, R., P. Plane and K. Sekkat. 2011. ‘‘Exchange Rate
Undervaluation and Manufactured Exports: A
Deliberate Strategy?’’ Journal of Comparative
Economics 39: 584–601.
Nouira, R. and K. Sekkat. 2012. ‘‘Desperately seeking the
positive impact of undervaluation on growth.’’ Journal of
Macroeconomics 34: 537–52.
Abdessalem Gouider, Ridha Nouira- The Misalignment - Is it a Determinant of the
FDI in the Developing Countries?
EUROPEAN ACADEMIC RESEARCH - Vol. II, Issue 4 / July 2014
5440
Schneider, F. and B.S. Frey. 1985. ‘‘Economic and Political
Determinants of Foreign Direct Investment.’’ World
Development 13 (2): 161-75.
Pedroni, P. 2000. ‘‘PPP Tests in Cointegrated Panels.’’ Indiana
University Working Papers.
Pedroni, P. 2004. ‘‘Panel Cointegration Asymptotic and Finite
Sample Properties of Pooled Time Series Tests with an
Application to the PPP Hypothesis.’’ Econometric Theory
20: 597-625.
Pesaran, M.H. 2007. ‘‘A Simple Panel Unit Root Test in the
Presence of Cross Section Dependence.’’ Journal of
Applied Econometrics 22: 265-312.
Soydemir G. and A. Grossmann. 2006. ‘‘The Impact of
Productivity Adjusted Deviations from PPP on the U.S.
Inbound FDI: Evidence from Japan, U.K. and Germany.’’
Journal of Economics and Finance 30: 140-54.
Wei, S. 2000. ‘‘How Taxing is Corruption on International
Investors.’’ The Review of Economics and Statistics 82
(1): 1-11.
Abdessalem Gouider, Ridha Nouira- The Misalignment - Is it a Determinant of the
FDI in the Developing Countries?
EUROPEAN ACADEMIC RESEARCH - Vol. II, Issue 4 / July 2014
5441
Appendix:
Appendix A: Countries in the Sample Used to Compute the EREER
Africa Latin America Asia
Algeria Argentina China
Benin Bolivia Iran
Burkina-Faso Brazil Thailand
Cameroon Columbia Pakistan
Chad Costa-Rica India
Comoros Ecuador Philippines
Congo, Rep Mexico Malaysia
Cote d»Ivoire Paraguay Jordan
Egypt Venezuela Syria
Gabon Haiti
Gambia Honduras
Ghana Panama
Guatemala Uruguay
Guinea-Bissau Chile
Kenya
Lesotho
Madagascar
Malawi
Mali
Mauritania
Mauritius
Morocco
Niger
Panama
Rwanda
Senegal
Sierra-Leone
Sri Lanka
Swaziland
Appendix B: Countries in the Sample Used to estimate the
specification 1,2,3,4 and 5
Specification
1
Specification
2
Specification
3
Specification
4
Specification
5
Algeria Algeria Algeria Algeria Algeria
Argentina Argentina Columbia Argentina Argentina
Benin Benin Benin Bolivia Bolivia
Bolivia Bolivia Costa-Rica Brazil Brazil
Brazil Brazil Ecuador Burkina-Faso Burkina-Faso
Burkina-Faso Burkina-Faso Burkina-Faso Cameroon Cameroon
Cameroon Cameroon Cameroon Chad China
Abdessalem Gouider, Ridha Nouira- The Misalignment - Is it a Determinant of the
FDI in the Developing Countries?
EUROPEAN ACADEMIC RESEARCH - Vol. II, Issue 4 / July 2014
5442
Chad Chad Chad China Columbia
Chile Chile Thailand Columbia Congo, Rep
China China Pakistan Congo, Rep Costa-Rica
Columbia Columbia Mexico Costa-Rica Cote d»Ivoire
Comoros Comoros Comoros Cote d»Ivoire Ecuador
Congo, Rep Congo, Rep Congo, Rep Ecuador Egypt
Costa-Rica Costa-Rica Paraguay Egypt Gabon
Cote d»Ivoire Cote d»Ivoire Cote d»Ivoire Gabon Gambia
Ecuador Ecuador Venezuela Gambia Ghana
Egypt Egypt Egypt Ghana Guatemala
Gabon Gabon Gabon Guatemala Honduras
Gambia Gambia Gambia Honduras India
Ghana Ghana Ghana India Iran
Guatemala Guatemala Guatemala Iran Jordan
Honduras Honduras Chile Jordan Kenya
India India Jordan Kenya Madagascar
Iran Iran India Lesotho Malawi
Jordan Jordan Madagascar Malaysia
Kenya Kenya Kenya Malawi Mexico
Lesotho Lesotho Lesotho Malaysia Morocco
Madagascar Madagascar Madagascar Mauritius Niger
Malawi Malawi Malawi Mexico Pakistan
Malaysia Malaysia Morocco Panama
Mali Mali Mali Niger Panama
Mauritania Mauritius Mauritius Pakistan Paraguay
Mauritius Mexico Morocco Panama Philippines
Mexico Morocco Honduras Panama Senegal
Morocco Niger Niger Paraguay Sri Lanka
Niger Pakistan Panama Philippines Syria
Pakistan Panama Malaysia Senegal Thailand
Panama Panama Senegal Sri Lanka Uruguay
Panama Paraguay China Swaziland
Paraguay Philippines Panama Syria
Philippines Rwanda Syria Thailand
Rwanda Senegal Sri Lanka Uruguay
Senegal Sierra-Leone Swaziland
Sierra-Leone Sri Lanka Argentina
Sri Lanka Swaziland Bolivia
Swaziland Syria Brazil
Thailand Thailand Philippines
Uruguay Uruguay Iran
Venezuela Venezuela Uruguay
Syria
Abdessalem Gouider, Ridha Nouira- The Misalignment - Is it a Determinant of the
FDI in the Developing Countries?
EUROPEAN ACADEMIC RESEARCH - Vol. II, Issue 4 / July 2014
5443
Appendix C:
Test of the Stationarity of the Variables
Variable
Stationarity in
Level First difference
Capital Inflow / GDP -1.79 -5.93***
Openness -2.01 -4.85***
Debt Services -1.98 -5.39***
Government Consumption / GDP -1.92 -4.52***
Terms of Trade -1.53 -5.13***
REER -2.06 -4.51***
Balassa Samuelson -1.98 -4.21***
Critical values: -2.11 (5%)
-2.20 (1%)
** = Significant at 5%, *** = Significant at 1%
Test of Cointegration
Statistics Calculated value
Panel v- statistic -3.9***
Panel ρ- statistic 4.35***
Panel t- statistic -0.83
Panel ADF statistic -0.14
Critical values: 1.65 (5%)
2.33 (1%)
** = Significant at 5%, *** = Significant at 1 %