Embed Size (px)
Citation preview

American Geographical Society
The Management Center in the United StatesAuthor(s): William GoodwinSource: Geographical Review, Vol. 55, No. 1 (Jan., 1965), pp. 1-16Published by: American Geographical SocietyStable URL: http://www.jstor.org/stable/212852 .
Accessed: 08/05/2014 23:32
Your use of the JSTOR archive indicates your acceptance of the Terms & Conditions of Use, available at .http://www.jstor.org/page/info/about/policies/terms.jsp
.JSTOR is a not-for-profit service that helps scholars, researchers, and students discover, use, and build upon a wide range ofcontent in a trusted digital archive. We use information technology and tools to increase productivity and facilitate new formsof scholarship. For more information about JSTOR, please contact [email protected].
.
American Geographical Society is collaborating with JSTOR to digitize, preserve and extend access toGeographical Review.
http://www.jstor.org
This content downloaded from 169.229.32.137 on Thu, 8 May 2014 23:32:56 PMAll use subject to JSTOR Terms and Conditions

The Geographical Review
VOLUME LV January, 1965 NUMBER 1
THE MANAGEMENT CENTER IN THE UNITED STATES
WILLIAM GOODWIN
IN THE literature on the classification of cities little or no attention has been given to management per se or to management centers. A recent bibliography of central-place studies,' which lists the significant studies
of tertiary activities, does not contain among its more than five hundred entries a single reference explicitly to management centers; and neither this work nor the extensive bibliographies in Isard's "Methods of Regional Analysis"2 make any mention of management functions.
Among the better-known functional classifications of cities, none appears to regard management as a separate function. Harris3 states that his classifi- cation "is based on the activity of greatest importance in each city." Func- tional importance, in the Harris classification, is measured mainly by the number of people employed in each industry. Harris recognizes nine classes of cities but does not include management among their activities.
More recently, Nelson has also presented a functional classification of American cities,4 based, like Harris's, on United States census categories. Although Nelson includes a wider range of activities than Harris, he makes no mention of management as a separate category. Alexandersson,5 in his
1 Brian J. L. Berry and Allan Pred: Central Place Studies: A Bibliography of Theory and Appli- cations, Bibliography Ser. No. 1, Regional Science Research Institute, Philadelphia, 1961.
2 Walter Isard: Methods of Regional Analysis ([Cambridge, Mass.] New York and London, 1960). 3 Chauncy D. Harris: A Functional Classification of Cities in the United States, Geogr. Rev., Vol.
33, 1943, pp. 86-99; reference on p. 86. 4Howard J. Nelson: A Service Classification of American Cities, Econ. Geogr., Vol. 31, 1955,
pp. 189-210. 5 Gunnar Alexandersson: The Industrial Structure of American Cities (Lincoln, Nebr., and Stock-
holm, 1956).
> DR. GOODWIN is associate professor of geography at the University of Wisconsin, Milwaukee.
Copyright ? 1965 by the American Geographical Society of New York
This content downloaded from 169.229.32.137 on Thu, 8 May 2014 23:32:56 PMAll use subject to JSTOR Terms and Conditions

THE GEOGRAPHICAL REVIEW
comprehensive analysis of the functional role of American cities, which uti- lizes the concepts of "city forming" and "city serving," evidently does not
regard management as either and therefore does not include it in the classifi- cation. Hart's study of the cities of the American South6 follows the general pattern set by Harris; it likewise makes no mention of the importance of
management and fails to identify any city as a management center. In "Metropolis and Region" Duncan and his associates classify standard
metropolitan areas with 300,000 inhabitants or more in 1950 into seven cate-
gories according to "metropolitan functions and regional relationships."7 Although these investigators did not consider management as such, their
grouping of the SMA's appears to correspond closely with the grouping re-
sulting from the work presented in this paper. The omission of management in the classifications reviewed above is
readily explained by the fact that their basis was the most important "func- tion" as measured by employment. By this criterion the number of people engaged in management is not large enough to be of significance. Moreover,
although it is possible to extract "managers" from the census data, the cate-
gory is too inclusive to be satisfactory. In any case, it is questionable whether or not employment is a proper measure of management activities.
It is hoped that the present paper may contribute toward filling the gap in the literature by identifying the cities in which management is important. Admittedly, the methods used are not wholly satisfactory, but it is believed that they are a step in the right direction.
MANAGEMENT AND MANAGEMENT CENTERS
Management is an idea-handling, not a materials-handling, function, and as such it is somewhat intangible. Vernon8 points out that "whereas manu-
facturing, transportation, retail trade, and wholesale trade are economic ac- tivities whose existence is easily recognized and catalogued, many aspects of office activity are more difficult to classify." Managerial operations are office
6John Fraser Hart: Functions and Occupational Structures of Cities of the American South, Annals Assn. of Amer. Geogrs., Vol. 45, 1955, pp. 269-286.
7 Otis Dudley Duncan and others: Metropolis and Region (Baltimore, 1960), pp. 259-275. The seven categories are as follows: National Metropolis (N); Regional Metropolis (R); Regional Capital, Submetropolitan (C); Manufacturing, three classes (D, D-, and M); and Special Cases (S). These are based on a scattergram that plots per capita value added by manufacture against per capita wholesale
sales; the third dimension of population is indicated by the size of the circle (pp. 264 and 271). 8 Raymond Vernon: The Changing Econonmic Function of the Central City [Sipplementary Paper
No. 1, Area Development Committee of CED; Committee for Economic Development, New York, 1959], P. 55.
2
This content downloaded from 169.229.32.137 on Thu, 8 May 2014 23:32:56 PMAll use subject to JSTOR Terms and Conditions

THE MANAGEMENT CENTER
activities if nothing else. As part of the national and local urban scene, man-
agers, the offices they occupy, and the distribution of these offices invite
investigation. Vernon also observes:9 "To the extent that the office function grows,
therefore, the growth may well occur to a disproportionate extent in the office districts of the larger central cities, at the expense of the regional centers. The possibility [is] that only the largest cities may be the principal bene- ficiaries of continued office growth-indeed,. . . they may be the only bene- ficiaries." If, as it appears, office functions and, particularly, the headquarters offices of nationally important companies are to continue to gravitate to the
already existing office centers, it is pertinent to establish which are the pres- ently important cities.
In the past twenty years the electronic computer has grown from a curi-
osity to a much-used tool of management. Many routine decisions are pro- grammed for electronic computers; many data are processed by punch cards rather than by pencil, paper, and desk calculators. This "revolution" has re- duced the number of clerks needed to prepare the raw materials for decision
making. The change now taking place in the mechanics of decision making may have either of two opposite results with respect to the location of man-
agement centers. On the one hand, the reduction in the number of employees needed to staff a headquarters office may hasten the concentration of de- cision making in a few locations; on the other hand, it may well mean dis-
persion of headquarters because of the flexibility of data flows through a
computer. At the moment it is not clear just what effect the rapid introduc- tion of electronic data processing will have on the concentration of office functions, but one must be aware of its great potential for changing the
pattern of "office" cities.
Although the making of decisions is the function of only a very small
part of the American labor force, the influence of the decision makers on the social and economic welfare of the nation is enormous. The day-to-day decisions of the executives of the largest businesses, together with the de- cisions made in Washington, D. C., determine the course of economic events in the country-and, to no small degree, in the rest of the world as well.
A management center may therefore be defined as a city in which there is a concentration of headquarters ofices of nationally important companies. It is a
place apart from the production centers. The people identified as "managers" 9 Vernon, op. cit., p. 60. Italics are the present writer's.
3
This content downloaded from 169.229.32.137 on Thu, 8 May 2014 23:32:56 PMAll use subject to JSTOR Terms and Conditions

THE GEOGRAPHICAL REVIEW
14
13
/ 12 /
11 / /
10 ! /I / 10 9 /
/ 8-
7 /
/ 6
5 f
4 / ee*,
3 /
/00 2 G -
n . . GEOGR.REV.,JAN.,1965
E
z O [-
-J
O 0 0.
15--/V.
14 ~~~14 | ~ ~N.Y.C. 13-
12
11
10 * .. ..
9
8
7 L,A. ! Chi.?
5' ... . . --
4 De.* *Ph.
S.F.
Pi.o Ba. S. L. K.C. M.-S.P. a.
Bu- Mi. Ho. Se. Da. H, . ~~~~~~~~~~S,,
1 2 3 4 5 67 9 1011 12 " 6 7 8 9 10 MANAGERS AND CLERKS MANAGERS AND CLERKS
(hundreds of thousands) (hundreds of thousands) FIG. i-Managers (except farm managers) and clerks in relation to total population for the twenty largest urbanized
areas in the United States. Source: 1960 Census of Population and 1958 Census of Manufactures. FIG. 2-Managers (except farm managers) and clerks per 1oo,ooo workers in relation to population for the twenty
largest urbanized areas in the United States. Key: N.Y.C., New York City; L.A., Los Angeles; Chi., Chicago; De., Detroit; Ph., Philadelphia; Pi., Pittsburgh; Bu., Buffalo; Mi., Milwaukee; Ba., Baltimore; Cn., Cincinnati; Cl., Cleve- land; S.L., St. Louis; Ho., Houston; K.C., Kansas City; Se., Seattle; M.-St.P., Minneapolis-St. Paul; S.F., San Francisco; Bo., Boston; Da., Dallas; Wa., Washington, D.C. The horizontal scale has been expanded to permit clarity in reading the graph. Source: 1960 Census of Population; 1958 Census of Manufactures.
are those who sell their managerial talents irrespective of the nature of the company that employs them. A management center is a reservoir of mana- gerial talent available for hire.
MANAGEMENT AND POPULATION
New York City would unquestionably be accorded the position of prime management center of the United States, but which other cities exhibit the same general characteristics as New York?
Intuitively, and probably by common assumption, the relative impor- tance of a city as a business-management center is considered to have a more or less positive linear relation to the size of its population. The most readily available measure of management would be the count of managers and clerks made by the census. Figure 1 plots the total number of managers and clerks for the twenty largest (according to population) urbanized areas of the United States against the populations. Clearly a straight-line relationship exists.
cr 0
E
z 0 1-
0- 0 0-
4
This content downloaded from 169.229.32.137 on Thu, 8 May 2014 23:32:56 PMAll use subject to JSTOR Terms and Conditions

THE MANAGEMENT CENTER
However, when the relation of managers and clerks to all other workers is calculated and the result plotted against the population (Fig. 2), no such
straight-line relationship emerges. Rather, a distribution of cities can be ob- served from left to right across the graph, from the industrial centers of Detroit, Pittsburgh, and Buffalo to the purely administrative center of Wash-
ington, D. C. Thus it would seem that the intuitive view is both confirmed and questioned, and one is led to further consideration of the question.
SOURCES OF DATA
It can be assumed that large companies require a large managerial per- sonnel, and therefore the concentration of large companies in a city is indica- tive of managerial concentration also. Relevant information about individual
companies was assembled and summarized, city by city. Publicly owned
companies are required to publish annual reports of their financial status, and these reports carry a wealth of additional information. The business pub- lications, such as Moody's,'I and the Standard and Poor investors reference manuals" publish annually the information available about companies. For- tune has made a survey of America's largest companies, both industrial and nonindustrial, and for the past nine years has published annually (July and
August) a list of America's five hundred largest industrial companies, and for the last five years a list of the fifty largest commercial banks, insurance, transportation, utility, and merchandising companies respectively.
Since it is presumed that only companies of national importance can col-
lectively create a management center of national importance, the 750 com-
panies listed in the Fortune survey served as a base. Each company was checked against one or both of the standard investors manuals and also
against Thomas' Register of American Manufacturers,2 1961 edition, for ac-
curacy and to determine the location of the production facilities of the com-
pany. The data used in this study refer to the 1962 status of the companies. This list, published in 1963, was first compared with the lists published in earlier years'3 to determine whether there had been significant shifts in the
composition. Only the companies in the lower ranks appear to have changed completely, though naturally there has been some shifting of relative im-
portance over the years. It was felt, however, that changes over the last ten
years had not been sufficient to warrant taking earlier years into account,
"0 Published by Moody's Investors Service, New York. " Published by Standard and Poor's Corporation, New York. 12 Published annually by the Thomas Publishing Company, New York. 13 A careful company-by-conlpany comparison was made with the annual surveys for 1955, 1957,
1959, 1961, and 1963. It was disappointing that no significant trends in concentration were discernible.
5
This content downloaded from 169.229.32.137 on Thu, 8 May 2014 23:32:56 PMAll use subject to JSTOR Terms and Conditions

THE GEOGRAPHICAL REVIEW
because the appearance or disappearance of companies from the list did not
modify substantially the relative importance of a city as a management center. Also, comparison of the two years 1954 and 1963 did not reveal any substantial geographical shift in management centers.
RESULTS OF THE ANALYSIS
The results of this investigation are most easily presented in a series of tables. Because of the limited scope of the data, these results are certainly neither final nor conclusive, and undoubtedly other means of attacking the
problem need exploration. Table I presents data concerning the 500 leading industrial companies of
America aggregated according to the locations of their headquarters cities. Three reasonable, if arbitrarily chosen, criteria served to determine the cities that seemed to meet the test of national importance as management centers:
(1) at least ten headquarters offices, (2) at least two billion dollars in assets or sales in 1962 (about 1 percent of the total assets and sales of the 500 com-
panies), and (3) at least 0oo,oo0 employees (about 1 percent of the total
employment of the 500 companies). Centers included in the original com- pilation but eliminated from the table are Akron, Minneapolis-St. Paul,
Wilmington, Bethlehem-Allentown, Seattle, Cincinnati, Dallas, Toledo, Milwaukee, and Bartlesville (Oklahoma). Although these cities had one or both of the other qualifications, each failed to have more than ten offices.
It is not enough that a city has a large concentration of offices; these offices should represent widespread control, both spatially and industrially, and separation from production facilities. To determine the extent of the
"empire" controlled from each city, a tabulation was made of the states in which each company with headquarters in that city had located one or more plants, and the totals were summed. For example, 83 companies with
headquarters in New York City had one or more plants in California. However, for determining the extent of geographical control of a city the total number of plants was not considered necessary, merely the number of
companies with branch plants in the various states. A city whose control did not extend to at least twenty-four states and Canada was not regarded as a
management center. Only New York City and Chicago companies are
represented in all forty-eight states of the conterminous United States and in
Canada; the most poorly represented is Cleveland, with twenty-nine states and Canada. Table II summarizes this information.
A more satisfactory view of the extent of the control of a city can be
gained from a map on which have been plotted the basic data from which
6
This content downloaded from 169.229.32.137 on Thu, 8 May 2014 23:32:56 PMAll use subject to JSTOR Terms and Conditions

THE MANAGEMENT CENTER 7
Table II was constructed. Six such maps are presented, for New York, Chicago, Los Angeles, San Francisco, Detroit, and Pittsburgh (Figs. 3-8). The importance of New York and Chicago as headquarters cities emerges
TABLE I-CONCENTRATION OF INDUSTRIAL HEADQUARTERS OFFICES
NUMBER OF SALES ASSETS NUMBER OF CITY OFFICES (In thousands of dollars) EMPLOYEES
New York 163 84,355,806 124,477,751 3,650,089 Detroit 13 28,801,564 19,319,678 1,594,487 Chicago 51 19,798,326 14,300,775 717,541 Pittsburgh 21 10,760,815 12,031,841 439,313 Los Angeles 16 8,361,378 5,698,259 307,056 San Francisco 14 5,690,201 6,973,327 206,227 Philadelphia 16 4,423,190 4,372,831 171,613 St. Louis 12 4,229,250 3,177,712 185,734 Cleveland 15 4,172,215 3,512,877 188,902 Boston 12 2,140,787 1,503,882 118,358
Compiled from Fortune, July, 1963, and Moody's Industrials, 1962 edition.
TABLE II-EXTENT OF "EMPIRE" BY CITY OF CONTROL, CONTERMINOUS UNITED STATES AND CANADA*
NO. OF STATES
HEADQUARTERS WITH BRANCH TOTAL NO. CITY PLANTS OF PLANTS
NO. OF STATES
HEADQUARTERS WITH BRANCH TOTAL NO. CITY PLANTS OF PLANTS
New York City 48 1,455 San Francisco 34 97 Chicago 48 528 Wilmingtona 34 51 Minneapolis-St. Paula 43 128 Detroit 30 112
Pittsburgh 40 212 Philadelphia 30 82 St. Louis 38 125 Cleveland 29 99 Los Angeles 38 98 Bostonb 21 48
Source: Moody's Industrials, 1962 edition; Thomas' Register of American Manufacturers, 1961. * All cities listed have a plant or plants in Canada. a Not included in Table I because of failure to meet requirements, but included here for complete-
ness and the fact that it is industrially significant. b The small extent of its industrial empire eliminates Boston as an industrial management center,
in accordance with the criterion.
clearly from these maps and contrasts strongly with that of the West Coast centers of Los Angeles and San Francisco. Detroit and Pittsburgh, notable
manufacturing centers, appear to have their control principally in the industrial sections of the country.
Although a city need not necessarily have a diversity of industries to
qualify as a management center, undoubtedly a larger pool of broader
managerial talents would be available in a city with many different industries than in a one-industry city. Other things being equal, a city with a wide range of nationally important companies is better qualified to claim a position of rank among managerial centers. An attempt was made to classify all companies studied according to the United States Standard Industrial
This content downloaded from 169.229.32.137 on Thu, 8 May 2014 23:32:56 PMAll use subject to JSTOR Terms and Conditions

8 THE GEOGRAPHICAL REVIEW
FIG. 3-The number of companies, by states, whose headquarters offices are located in New York. A solid dot represents two plants; a circle, one plant. Source: Moody's Industrials, 1962; Thomas' Register of American Manufacturers, 1961.
FIG. 4-The number of companies, by states, whose headquarters offices are located in Chicago. A solid dot represents two plants; a circle, one plant. Source: Moody's Industrials, 1962; Thomas' Register of American Manufacturers, 1961.
This content downloaded from 169.229.32.137 on Thu, 8 May 2014 23:32:56 PMAll use subject to JSTOR Terms and Conditions

THE MANAGEMENT CENTER 9
FIG. 5-The number of companies, by states, whose headquarters offices are located in Los Angeles. A solid dot represents two plants; a circle, one plant. Source: Moody's Industrials, 1962; Thomas' Register of American
Manufacturers, 1961.
FIG. 6-The number of companies, by states, whose headquarters offices are located in San Francisco. A solid dot represents two plants; a circle, one plant. Source: Moody's Industrials, 1962; Thomas' Register of American Manufacturers, 1961.
This content downloaded from 169.229.32.137 on Thu, 8 May 2014 23:32:56 PMAll use subject to JSTOR Terms and Conditions

THE GEOGRAPHICAL REVIEW
FIG. 7-The number of companies, by states, whose headquarters offices are located in Detroit. A solid dot represents two plants; a circle, one plant. Source: Moody's Industrials, 1962; Thomas' Register of American Manufacturers, 1961.
FIG. 8-The number of companies, by states, whose headquarters offices are located in Pittsburgh. A solid dot represents two plants; a circle, one plant. Source: Moody's Industrials, 1962; Thomas' Register of American Manufacturers, 1961.
10
This content downloaded from 169.229.32.137 on Thu, 8 May 2014 23:32:56 PMAll use subject to JSTOR Terms and Conditions
THE MANAGEMENT CENTER
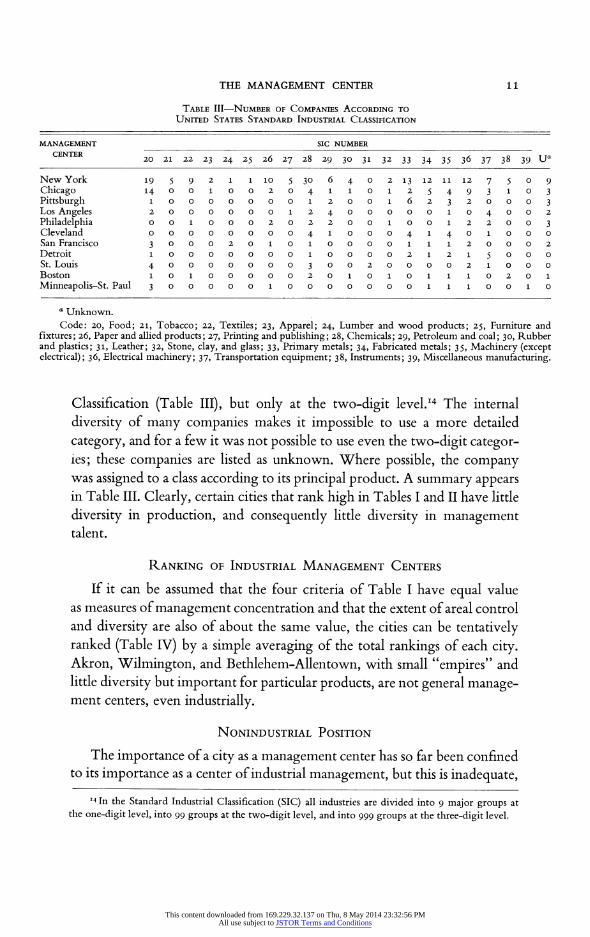
TABLE III-NUMBER OF COMPANIES ACCORDING TO UNITED STATES STANDARD INDUSTRIAL CLASSIFICATION
MANAGEMENT SIC NUMBER CENTER
20 21 22 23 24 25 26 27 28 29 30 31 32 33 34 35 36 37 38 39 Ua
New York 19 5 9 2 1 1 10 5 30 6 4 0 2 13 12 11 12 7 5 0 9 Chicago 14 0 0 1 0 0 2 0 4 1 1 0 1 2 5 4 9 3 1 0 3 Pittsburgh 1 o o o o o o o 1 2 o o 1 6 2 3 2 o 0 0 3 Los Angeles 2 O O O O O O 1 2 4 0 0 0 0 0 1 0 4 0 0 2 Philadelphia o o 1 o o o 2 0 2 2 0 0 1 O O 1 2 2 0 0 3 Cleveland o o o o o o o o 4 1 0 0 0 4 1 4 0 1 0 0 0 San Francisco 3 0 0 0 2 0 1 0 1 0 0 0 0 1 1 1 2 0 0 0 2 Detroit 1 o o o o o o o 1 o o o o 2 1 2 1 5 0 0 0 St. Louis 4 0 0 0 0 0 0 0 3 0 0 2 0 0 0 0 2 1 0 0 0 Boston 1 0 1 o 0 o o o 2 0 1 0 1 0 1 1 1 0 2 0 1 Minneapolis-St. Paul 3 0 0 0 0 0 1 0 0 0 0 0 0 0 1 1 1 0 0 1 0
a Unknown. Code: 20, Food; 21, Tobacco; 22, Textiles; 23, Apparel; 24, Lumber and wood products; 25, Furniture and
fixtures; 26, Paper and allied products; 27, Printing and publishing; 28, Chemicals; 29, Petroleum and coal; 30, Rubber and plastics; 31, Leather; 32, Stone, clay, and glass; 33, Primary metals; 34, Fabricated metals; 35, Machinery (except electrical); 36, Electrical machinery; 37, Transportation equipment; 38, Instruments; 39, Miscellaneous manufacturing.
Classification (Table III), but only at the two-digit level.I4 The internal
diversity of many companies makes it impossible to use a more detailed
category, and for a few it was not possible to use even the two-digit categor- ies; these companies are listed as unknown. Where possible, the company was assigned to a class according to its principal product. A summary appears in Table III. Clearly, certain cities that rank high in Tables I and II have little
diversity in production, and consequently little diversity in management talent.
RANKING OF INDUSTRIAL MANAGEMENT CENTERS
If it can be assumed that the four criteria of Table I have equal value as measures of management concentration and that the extent of areal control and diversity are also of about the same value, the cities can be tentatively ranked (Table IV) by a simple averaging of the total rankings of each city. Akron, Wilmington, and Bethlehem-Allentown, with small "empires" and little diversity but important for particular products, are not general manage- ment centers, even industrially.
NONINDUSTRIAL POSITION
The importance of a city as a management center has so far been confined to its importance as a center of industrial management, but this is inadequate,
I4 In the Standard Industrial Classification (SIC) all industries are divided into 9 major groups at the one-digit level, into 99 groups at the two-digit level, and into 999 groups at the three-digit level.
11
This content downloaded from 169.229.32.137 on Thu, 8 May 2014 23:32:56 PMAll use subject to JSTOR Terms and Conditions

THE GEOGRAPHICAL REVIEW
for it does not take into account other business activities. For example, the large commercial banks and the insurance companies exercise an all-
pervasive influence as major sources of funds that recognize no visible bounds.
Legal restrictions and banking and insurance laws place limits on the tangible evidence of control, but the size of assets alone is indicative of relative im-
TABLE IV-RANKING OF CITIES AS INDUSTRIAL MANAGEMENT CENTERS
RANK
No. of No. of No. of AV. CITY offices Sales Assets employees plants Diversity RANK
New York 1 1 1 1 1 1 1
Chicago 2 3 3 3 2 2 2
Pittsburgh 3 4 4 4 3 4 3 Detroit 8 2 2 2 5 6 4 San Francisco 7 6 5 6 8 4 5 Los Angeles 4 5 6 5 7 9 6
Philadelphia 42 7 7 9 9 4 7 Cleveland 6 9 8 7 6 7 8 St. Louis 9 8 9 8 4 9 9
TABLE V-NONINDUSTRIAL ASSETS, FIFTEEN LARGEST CENTERS
(In billions of dollars)
ASSETS
CITY Bank Insurance Transport Utility Total
New York 49.0 63.6 4.9 36.0 153.5 San Francisco 19.9 - 2.8 - 22.7
Chicago 9.9 0.9 6.0 0.7 17.5 Hartford - 13.5 - - 13.5 Boston 2.0 9.2 - - 11.2 Los Angeles 8.8 1.6 o.1 - 10.5 Philadelphia 3.6 3.3 3.2 - 10.1
Cleveland 3.5 - 2.2 - 5.7 Milwaukee 0.9 4.5 -- 5-4 Houston 0.9 - - 3.9 4.8 Detroit 4.6 - -- 4.6 Pittsburgh 3.6 - - - 3.6 Dallas 2.5 0.9 o. 1 - 3.5 Minneapolis-St. Paul 0.7 0.4 2.4 - 3.5 St. Louis 1.5 - 1.9 - 3-4
Source: Fortune, August, 1963; Moody's Financials, 1962 edition.
portance. Few transportation companies are national in scope, but the larger airlines and railroads serve large sections of the country and may therefore
be considered of national importance. Utility companies, with the exception of American Telephone and Telegraph and Western Union, are commonly local, both in service area and in outlook; therefore only the national service
utilities were included in the computations. Inasmuch as the sole common
denominator among the various kinds of business activity is assets, this
12
This content downloaded from 169.229.32.137 on Thu, 8 May 2014 23:32:56 PMAll use subject to JSTOR Terms and Conditions

THE MANAGEMENT CENTER 13
criterion was used, though "policies in force" or "policyholders" might have provided a better measure for insurance companies. Table V presents a compilation of the nonindustrial assets of the cities in the same fashion that the industrial data were summarized.
Many of the important industrial cities are also important nonindustrial
TABLE VI-TOTAL ASSETS CONTROLLED BY COMPANIES IN MANAGEMENT CENTERS*
(In billions of dollars)
RANK CITY ASSETS RANK CITY ASSETS
1 New York 283.3 17 Wilmington 3.5 2 Chicago 36.5 18 Cincinnati 3.3 3 San Francisco 30.2 19 Akron 3.1 4 Detroit 24.7 20 Springfield (Mass.) 2.7 5 Los Angeles 16.4 21 Bethlehem-Allentown 2.4 6 Pittsburgh 15.7 22 Winston-Salem 2.0 7 Philadelphia 14.4 23 Des Moines 1.9 8 Hartford 13.5 24 Bartlesville 1.7 9 Boston 13.0 25 Fort Wayne 1.6
10 Cleveland 9.2 26 Richmond 1.5 11 St. Louis 7.0 27 Toledo 1.2 12 Houston 6.7 28 Rochester 1.2 13 Milwaukee 6.6 29 Peoria 1.14 14 Minneapolis-St. Paul 5.4 30 Baltimore 1.12 15 Dallas 4-5 31 Nashville 1.o 16 Seattle 3.8
Compiled from Fortune, Moody's, Standard and Poor. * Includes assets held by national merchandising companies but not used in previous calculations.
Their inclusion here is to indicate full economic power and thus the magnitude of management control centered in each city.
TABLE VII-RATIO OF NONINDUSTRIAL TO INDUSTRIAL ASSETS
CITY RATIO CITY RATIO
Akron o.16a Los Angeles 1.89 Toledo o.16" Minneapolis-St. Paul 1.98 Bethlehem-Allentown 0.21" Philadelphia 2.35 Detroit 0.26 Houston 3.00 Pittsburgh 0.31 San Francisco 3.34 St. Louis 1.06 Milwaukee 3.86 Cleveland 1.48 Dallas 4.00 Cincinnati 1.54 Boston 7.35 Chicago 1.58 Hartford 13.50 New York 1.82
a Estimate based on assignment of nonindustrial assets as determined by summing the assets of banks and the like within these as recorded in Moody's. Nonindustrial assets include assets of nationally important merchandising companies.
centers, but Hartford, Milwaukee, Houston, and Dallas, as measured by assets, are obviously more important as financial centers than as industrial centers. Thus a second criterion of rank is suggested, namely the total of nonindustrial assets. In addition to repeated proof of the importance of New York City and Chicago as control centers, the great banking wealth of San
This content downloaded from 169.229.32.137 on Thu, 8 May 2014 23:32:56 PMAll use subject to JSTOR Terms and Conditions

THE GEOGRAPHICAL REVIEW
20
Detroit -124 -a~~~~~~~~~~~18 ~~~~~~New York
City
16 112
Chicago 14 * 1
Pittsburgh 12
10
8 San Francisco
6 - 6 \ Philadelphia Los Angeles
02 Wilmington *2 4tAkron I
*I St. Louis Boston * * ? | Cleyeland BethleHem-Allentown
2 - Circinnati 1 ?Milaukee Minneapolis-St. Paul
kToledo| *Dallas Hartford HoLston
0 2 4 6 8 10 12 14 16 18 20 22 24
BANKING AND INSURANCE ASSETS GEOGR.REV,JAN.,1965 (in billions of dollars)
FIG. 9-Industrial assets plotted against banking and insurance assets. The numerals 1, 2, and 3
represent the positions that Chicago, Philadelphia, and Minneapolis-St. Paul respectively would
have had if the assets of transportation companies had been included in the nonindustrial assets.
The arc in the lower left corner roughly delimits the nationally important centers from the centers
whose influence is more restricted.
Francisco is pointed up, together with the insurance centers noted above. With the two rankings of importance before us, it is now necessary to
attempt to combine them into a single measure. The one set of data common to all economic activities and to all cities is assets. Assets, whether of a
business firm or of a bank, are commonly recognized as a measure of im-
portance. Table VI combines all assets, industrial and nonindustrial, for each
city with assets of more than one billion dollars and ranks the cities accord-
ingly. The relation between the industrial and nonindustrial assets can be
analyzed both arithmetically and graphically. The simple ratio of nonin- dustrial to industrial assets was computed (Table VII), and the relative
importance of the cities was graphed (Fig. 9). The graph serves as a basis for
qualifying the cities as balanced in management control or more important industrially or financially. If the graph is read clockwise from the vertical
axis, the cities are seen to be arrayed in order from those dominated by
1-
(a
o
o -0 (0
._o 0
--
w
_U
:
Q z
14
4
This content downloaded from 169.229.32.137 on Thu, 8 May 2014 23:32:56 PMAll use subject to JSTOR Terms and Conditions

THE MANAGEMENT CENTER
\. . _ i iSt.Louis
/
-- - .-, . '
i:-o$s e ' Bartlesville .ashville .
'A' 'geles I ' / AT
283 New York \G e M XC
\, (^ Q 0 PDetroit 0 Secondary cities 0 200 400 600 800 1000 ^^S^o Phil adgfielphia Other cities with assets of one billion dollars Kilometers
Springfiei or mre
GEOGR.REVJAN.,1965
FIG. 1o-Headquarters cities. This map is based on the total assets held by major companies in the 31 cities shown. The cities have been differentiated into three major categories according to the source of their power.
industry to those which are primarily financial centers. In addition, the graph shows the relative importance of each city, at least with regard to assets held by its major companies, and thus, if assets of large companies are a reliable measure of management, their importance as management centers. A
relation of managers and clerks to all workers is indicative of a management center-an assumption confirmed by the analysis in this paper.
TYPES OF MANAGEMENT CENTERS
Three distinct groups of cities emerge: (i) general management centers of two sizes, regional and national, called by GottmannI5 quaternary centers; (2) financial cities of regional and national importance, here labeled tertiary centers; and (3) industrial cities, in which the bulk of the wealth and control is in industry, here called secondary centers.
Figure 10 identifies all cities with assets of one billion dollars or more held by nationally important companies (Table VI). The twenty-one largest held by nationally important companies (Table VI). The twenty-one largest
5 Jean Gottmann: Megalopolis (New York, 1961), p. 576.
15
This content downloaded from 169.229.32.137 on Thu, 8 May 2014 23:32:56 PMAll use subject to JSTOR Terms and Conditions

THE GEOGRAPHICAL REVIEW
are identified according to their relative importance as quaternary, tertiary, or secondary. It is clear that few cities can be called national management centers. The dominance of New York is overwhelming; its total assets are nearly eight times those of its nearest rival, Chicago. No other city can approach the diversity of operations performed, and it must be remembered that using only the five hundred largest industrial companies and the fifty largest of each kind of major nonindustrial company has not revealed the full importance of the city. In the quaternary group, New York, Chicago, Los Angeles, and Philadelphia can be considered national management centers (though the case for Los Angeles is weakened by its heavy dependence on the aircraft industry for the bulk of its industrial assets), and Cleveland, St. Louis, Minneapolis-St. Paul, and Cincinnati regional management centers. In the tertiary group, San Francisco, Hartford, and Boston must be classed as nationally important; Milwaukee, Dallas, and Springfield (Massachusetts), all with important insurance companies dominating the pattern, are of lower rank, as is Seattle. The secondary centers are Detroit, Pittsburgh, Akron, Bethlehem-Allentown, and Wilmington.
16
This content downloaded from 169.229.32.137 on Thu, 8 May 2014 23:32:56 PMAll use subject to JSTOR Terms and Conditions