Embed Size (px)
Citation preview

UNCLASSIFIED
UNCLASSIFIED
UNITED STATES BOMB DATA CENTER (USBDC) EXPLOSIVES INCIDENT REPORT (EIR)
2019
The Annual Explosives Incident Report (EIR) reviews bombing and explosives related incidents from information reported to the United States Bomb Data Center (USBDC) through the Bomb Arson Tracking System (BATS).

UNCLASSIFIED
UNCLASSIFIED
Table of Contents
Executive Summary ______________________________________________________________ 1
Explosions – 2019 ________________________________________________________________ 2
Recoveries – 2019 ________________________________________________________________ 8
Suspicious Packages – 2019 ___________________________________________________ 12
Bomb Threats – 2019 __________________________________________________________ 13
Hoaxes – 2019 __________________________________________________________________ 14
Thefts/Losses – 2019 __________________________________________________________ 15
Contact Information ___________________________________________________________ 17

EXECUTIVE SUMMARY
Page | 1 UNCLASSIFIED
UNCLASSIFIED
2019 Explosives Incident Report (EIR)
OPERATING HIGHLIGHTS The 2019 Explosives Incident Report (EIR) is an informational product prepared by the United States Bomb Data Center (USBDC), using incident data reported in the Bomb Arson Tracking System (BATS) by 2,529 interagency partners and 12,515 registered users. This report examines the total number of explosives related incidents reported in BATS for calendar year 2019 and includes explosions and bombings, recoveries, suspicious packages, bomb threats, hoaxes, and explosives thefts/losses. It is important to note that BATS is a real-time dynamic incident management system that is strictly user dependent; therefore, it is possible that the data represented in this report may differ slightly from previously reported data due to updates or changes made by the owner of individual records.
STRATEGIC HIGHLIGHTS From January 1, 2019, through December 31, 2019, BATS captured a total of 14,940 explosives related incidents. Of the reported incidents, there were 715 explosions of which 251 were bombings, with California (27) and Pennsylvania (23) having the highest numbers. There were a total of 7,298 recoveries reported in 2019, with the majority being explosives (non-improvised explosive devices (IEDs)). There were a total of 5,482 suspicious/unattended package incidents, a decrease of 26 percent since 2018. Bomb threats decreased 33 percent in 2019. Assembly, education, residential, and office/business remain the top four targets of bomb threats during 2019. The number of reported incidents targeting education facilities decreased by almost half since 2018.
LOOKING AHEAD In 2019, the United States Bomb Data Center’s two sections, Bomb Arson Tracking System Section (BATSS) and Arson and Explosives Information and Analysis Section (AEIAS), worked to collect, analyze and disseminate information regarding arson and suspected criminal misuse of explosives to increase situational awareness to detect, deter and prevent criminal acts. AEIAS produced 223 arson and explosives intelligence products during calendar year (CY) 2019.
James Watson Director, USBDC

EXPLOSIONS – 2019
Page | 2 UNCLASSIFIED
UNCLASSIFIED
2019 Explosives Incident Report (EIR)
1.1 Explosion Incidents, Summary and Trends Explosion Incidents are identified by the following categories: bombings, accidental, undetermined, and under investigation. There may be some that were left blank or unspecified. The undetermined explosion category is used when the investigation has concluded, but the explosion type was unidentified. The under investigation category is used when the cause of the explosion is still pending or awaiting laboratory results. Explosion Incidents include all incidents where explosive materials, chemicals, or ignitable mixtures were determined to be the primary cause of an explosion. There were 715 Explosion Incidents recorded in BATS during 2019, a slight increase from 2018. Bombings decreased, from 289 reported incidents in 2018 to 251 incidents in 2019.
Figure 1. BATS Reported Explosion Incidents, 2015–19
EXPLOSIONS – 2019
Page | 3 UNCLASSIFIED
UNCLASSIFIED
2019 Explosives Incident Report (EIR)
Victim injuries account for 88 percent of the total number of reported injuries in 2019 and were primarily caused by accidental explosions.
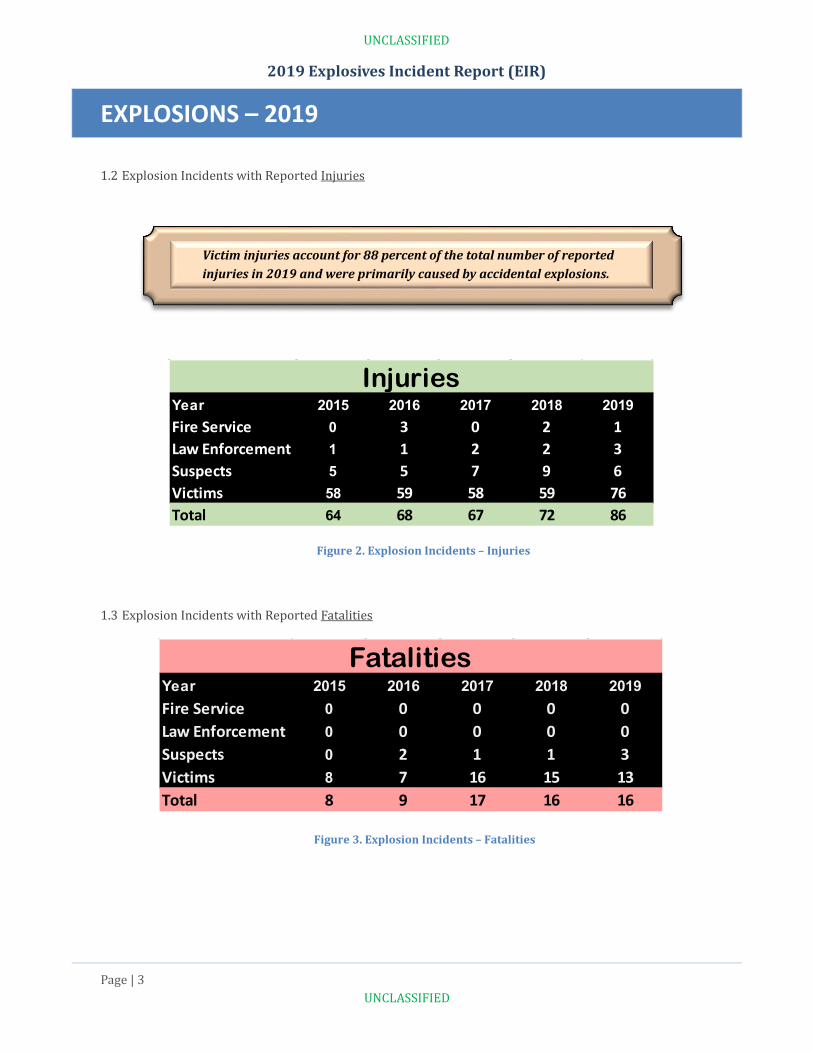
Figure 3. Explosion Incidents – Fatalities
1.2 Explosion Incidents with Reported Injuries
1.3 Explosion Incidents with Reported Fatalities
Year 2015 2016 2017 2018 2019Fire Service 0 0 0 0 0Law Enforcement 0 0 0 0 0Suspects 0 2 1 1 3Victims 8 7 16 15 13Total 8 9 17 16 16
Fatalities
Year 2015 2016 2017 2018 2019Fire Service 0 3 0 2 1Law Enforcement 1 1 2 2 3Suspects 5 5 7 9 6Victims 58 59 58 59 76Total 64 68 67 72 86
Injuries
Figure 2. Explosion Incidents – Injuries
EXPLOSIONS – 2019
Page | 4 UNCLASSIFIED
UNCLASSIFIED
2019 Explosives Incident Report (EIR)
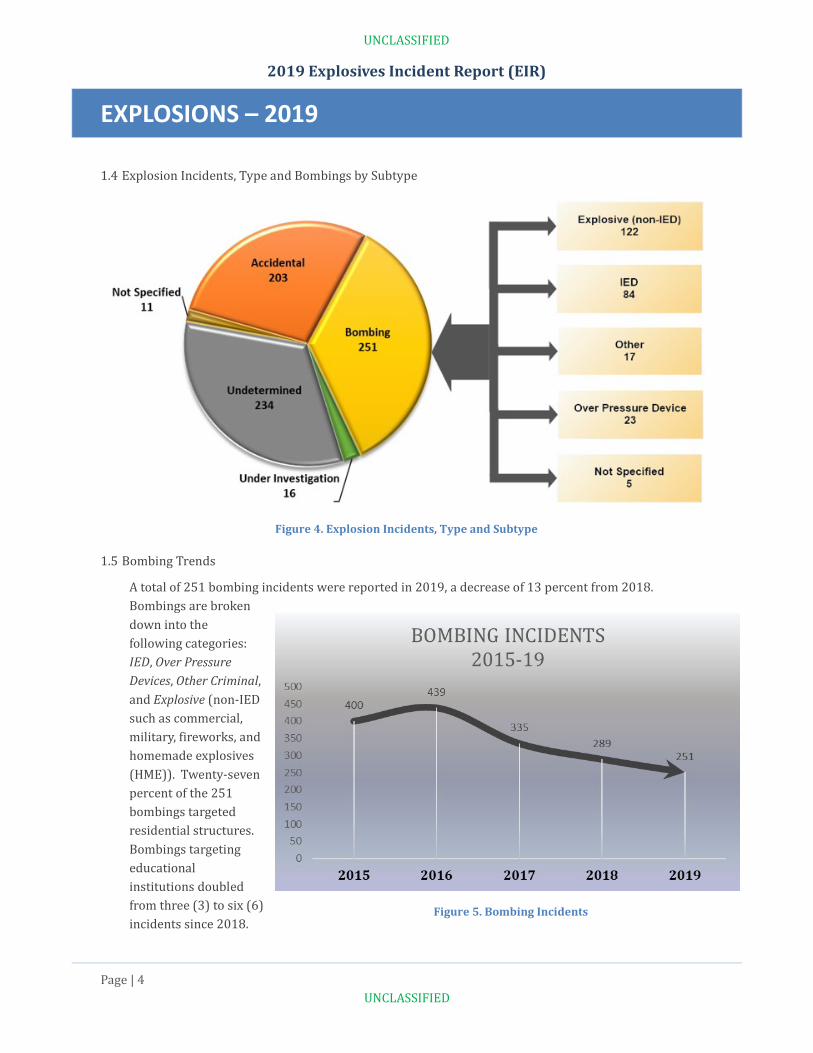
1.4 Explosion Incidents, Type and Bombings by Subtype
1.5 Bombing Trends
A total of 251 bombing incidents were reported in 2019, a decrease of 13 percent from 2018. Bombings are broken down into the following categories: IED, Over Pressure Devices, Other Criminal, and Explosive (non-IED such as commercial, military, fireworks, and homemade explosives (HME)). Twenty-seven percent of the 251 bombings targeted residential structures. Bombings targeting educational institutions doubled from three (3) to six (6) incidents since 2018.
Figure 5. Bombing Incidents
Figure 4. Explosion Incidents, Type and Subtype

EXPLOSIONS – 2019
Page | 5 UNCLASSIFIED
UNCLASSIFIED
2019 Explosives Incident Report (EIR)
The figure below represents all of the States that had 10 or more reported bombings in 2019. As a comparison, 2017 and 2018 are included as well. There was a significant decrease in California (45%) and Washington (42%), whereas South Carolina has seen an increase (71%) since 2017.
1.6 Explosions Device – Main Charges
Pyrotechnics/Fireworks, Commercial Explosives - Propellant, and Improvised/Homemade Explosives (HME) - Fuel Oxidizer Mixtures were the most common device main charges reported in explosion incidents for 2019.
Figure 6. Comparison of Bombings by State
Figure 7. Explosions Device – Main Charges, 2019
♦ Consumer Fireworks – 35% ♦ Display Fireworks – 6% ♦ Not Specified – 59%
EXPLOSIONS – 2019
Page | 6 UNCLASSIFIED
UNCLASSIFIED
2019 Explosives Incident Report (EIR)
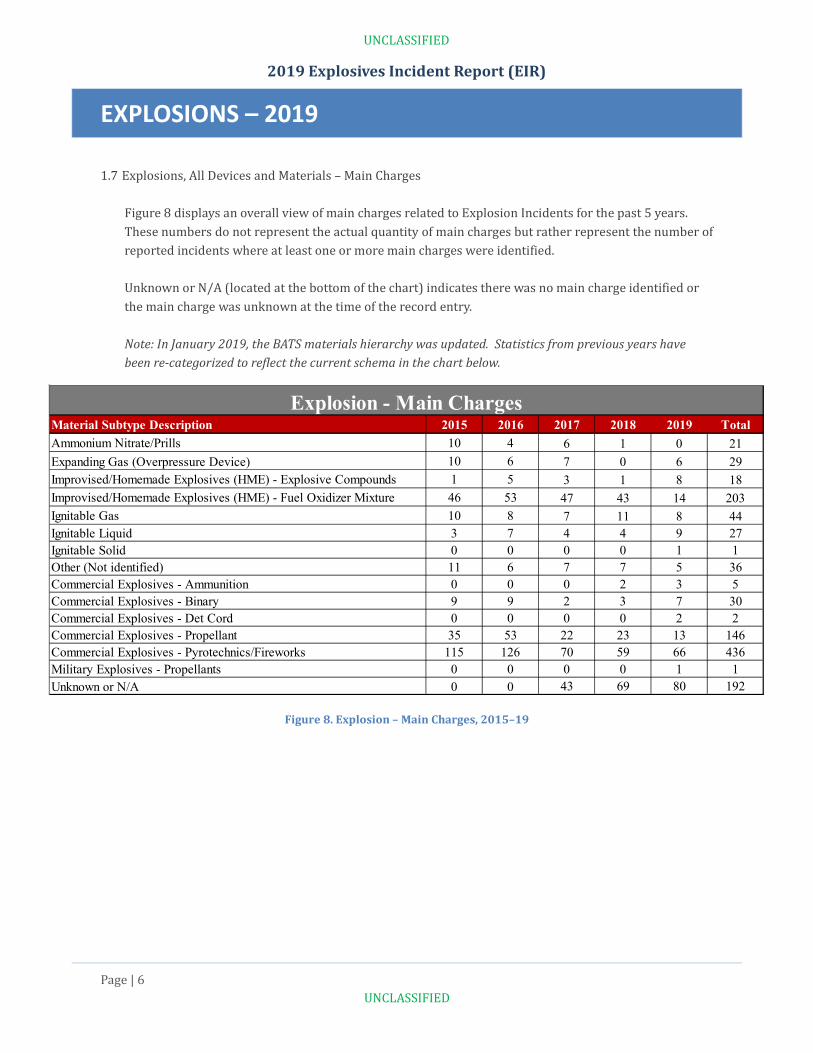
1.7 Explosions, All Devices and Materials – Main Charges Figure 8 displays an overall view of main charges related to Explosion Incidents for the past 5 years. These numbers do not represent the actual quantity of main charges but rather represent the number of reported incidents where at least one or more main charges were identified.
Unknown or N/A (located at the bottom of the chart) indicates there was no main charge identified or the main charge was unknown at the time of the record entry. Note: In January 2019, the BATS materials hierarchy was updated. Statistics from previous years have been re-categorized to reflect the current schema in the chart below.
Figure 8. Explosion – Main Charges, 2015–19
Material Subtype Description 2015 2016 2017 2018 2019 TotalAmmonium Nitrate/Prills 10 4 6 1 0 21Expanding Gas (Overpressure Device) 10 6 7 0 6 29Improvised/Homemade Explosives (HME) - Explosive Compounds 1 5 3 1 8 18Improvised/Homemade Explosives (HME) - Fuel Oxidizer Mixture 46 53 47 43 14 203Ignitable Gas 10 8 7 11 8 44Ignitable Liquid 3 7 4 4 9 27Ignitable Solid 0 0 0 0 1 1Other (Not identified) 11 6 7 7 5 36Commercial Explosives - Ammunition 0 0 0 2 3 5Commercial Explosives - Binary 9 9 2 3 7 30Commercial Explosives - Det Cord 0 0 0 0 2 2Commercial Explosives - Propellant 35 53 22 23 13 146Commercial Explosives - Pyrotechnics/Fireworks 115 126 70 59 66 436Military Explosives - Propellants 0 0 0 0 1 1Unknown or N/A 0 0 43 69 80 192
Explosion - Main Charges

EXPLOSIONS – 2019
Page | 7 UNCLASSIFIED
UNCLASSIFIED
2019 Explosives Incident Report (EIR)
1.8 Explosion – Device Containers
The data represented in figure 9 illustrates the number of explosives incidents for each container type and does not represent the actual quantity of identified containers. For example, if there were multiple pipe bombs with end caps discovered in the same incident, the numbers below would represent one pipe and one end cap associated with that incident. However, if there were two identical container types recovered in the same incident but both consisted of independent material subtypes, then both are counted. Note: Unknown or N/A is selected when either a container was not known at the time of entry or there was no container associated with the device.
Figure 10. Switches Related to Explosions – 2019
Figure 9. Explosion Device Containers – 2019
1.9 Explosion – Switches
Figure 10 shows the total number of switches reported during an explosion incident for calendar year (CY) 2019. Time-Pyrotechnic Delay (Sage/Time Fuse, Hobby Fuse) switches were among the highest reported during 2019. Victim Operated switches decreased from 10 in 2018 to 1 in 2019. Note: Unknown or N/A is selected when either a switch was not known at the time of entry or there was no switch associated with the device.
Time - Mechanical (Clock Mechanism, Displacement) 1Time - Pyrotechnic Delay (Safe/Time Fuse, Hobby Fuse) 6Victim Operated - Pressure 1Unknown or N/A 73Grand Total 81
Switch Type

RECOVERIES – 2019
Page | 8 UNCLASSIFIED
UNCLASSIFIED
2019 Explosives Incident Report (EIR)
2.1 Recovery Incidents, Summary and Trends
2.2 Recovery Types
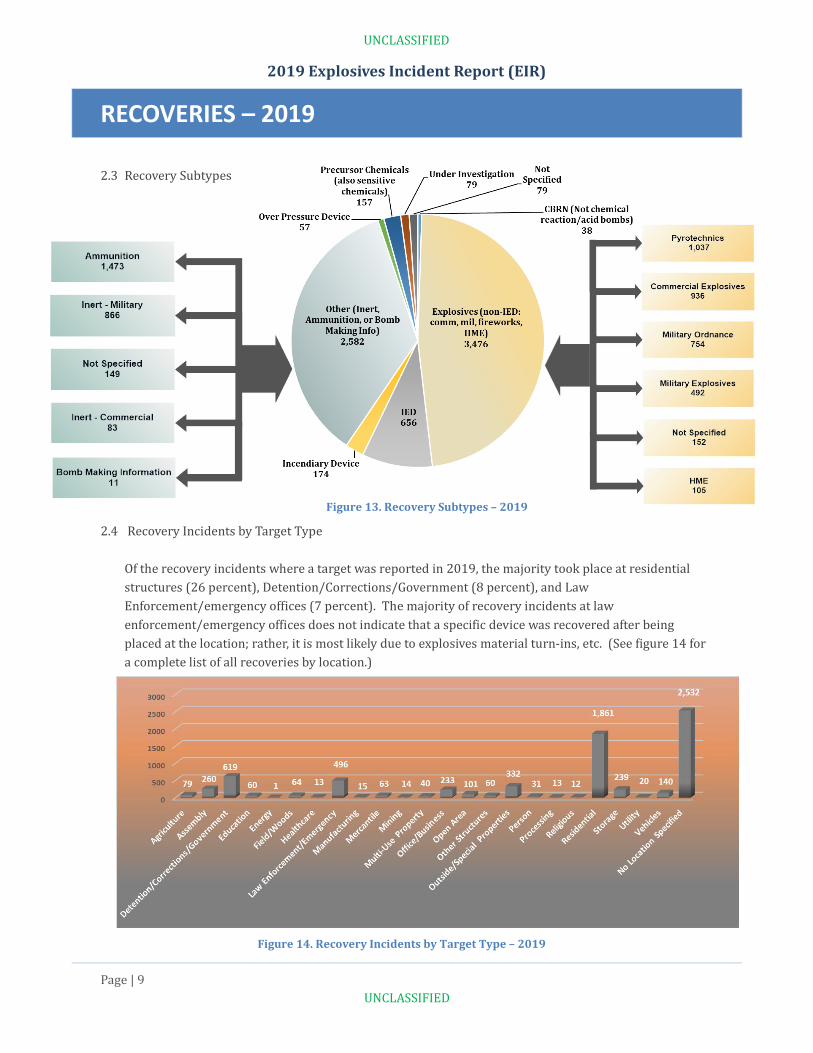
Overall, the largest recovery type and subtype categories remain unchanged. Explosives (non-IED) recoveries represent the majority of recoveries during 2019. This is followed by the “Other” category, which includes the following subtypes: Ammunition, Bomb Making Information, Inert–Commercial, and Inert–Military. Of those subtypes, Ammunition (1,473) and Inert–Military (866) were the most reported. (See figures 12 and 13.)
Figure 11. Recovery Incidents, 2015–19
Figure 12. Recovery Types – 2019
RECOVERIES – 2019
Page | 9 UNCLASSIFIED
UNCLASSIFIED
2019 Explosives Incident Report (EIR)
Figure 13. Recovery Subtypes – 2019
2.3 Recovery Subtypes
2.4 Recovery Incidents by Target Type Of the recovery incidents where a target was reported in 2019, the majority took place at residential structures (26 percent), Detention/Corrections/Government (8 percent), and Law Enforcement/emergency offices (7 percent). The majority of recovery incidents at law enforcement/emergency offices does not indicate that a specific device was recovered after being placed at the location; rather, it is most likely due to explosives material turn-ins, etc. (See figure 14 for a complete list of all recoveries by location.)
Figure 14. Recovery Incidents by Target Type – 2019

RECOVERIES – 2019
Page | 10 UNCLASSIFIED
UNCLASSIFIED
2019 Explosives Incident Report (EIR)
Recovery – All Devices and Materials - Main Charges
Figure 15 displays an overall view of main charges related to recovery incidents for the past 5 years. These numbers do not represent the actual quantity of main charges but rather represent the number of reported incidents where at least one or more main charges were identified.
Unknown or N/A (located at the bottom of the chart) indicates there was no main charge identified or the main charge was unknown at the time of the record entry.
Note: Due to the large amount of data, if a main charge had a grand total of 10 or fewer recoveries, it was not included in the chart. Additionally, in January 2019, the BATS materials hierarchy was updated. Statistics from previous years have been re-categorized to reflect the current schema in the chart below.
Figure 15. Recovery – Main Charges, 2015–19
Material Type 2015 2016 2017 2018 2019 Grand TotalAmmonium Nitrate/Prill 21 24 18 21 0 84Commercial Explosives - Ammunition 0 0 0 11 33 44Commercial Explosives - Binary 46 49 41 35 67 238Commercial Explosives - Blasting Agent 57 38 52 37 39 223Commercial Explosives - Det Cord 0 0 0 0 51 51Commercial Explosives - Dynamite 128 101 91 73 88 481Commercial Explosives - Propellant 436 500 386 435 228 1,985Commercial Explosives - Pyrotechnic Fireworks 590 627 348 339 414 2,318Commercial Explosives - Shaped Charge 21 13 16 4 9 63Commercial Explosives - Plastic Explosives 6 12 3 10 21 52Commercial Explosives - Cast Explosives 29 38 29 24 17 137Commercial Explosives - Liquid Explosives 12 13 8 3 6 42Improvised/Homemade Explosives (HME) - Explosive Compounds 16 18 12 20 22 88Improvised/Homemade Explosives (HME) - Fuel Oxidizer Mixture 303 306 246 275 50 1,180Military Explosives - Demolition Materials 31 30 12 43 25 141Military Explosives - Incendiaries 0 0 0 1 12 13Military Explosives - Munitions/Ordnance 0 0 0 31 87 118Military Explosives - Propellants 0 0 0 1 11 12Special Purpose Devices 15 4 1 9 23 52CS/OC Grenade (LE) 17 12 6 7 0 42Flashbang/Distraction (LE) 7 5 7 6 0 25Ignitable Gas 7 5 9 4 9 34Ignitable Liquid 72 81 43 30 33 259Ignitable Solid 16 12 13 4 15 60Match Heads 4 12 3 5 0 24Nitroglycerene 8 4 2 0 0 14Ordnance 13 2 19 0 0 34Other 60 71 62 50 71 314PETN 3 6 6 19 0 34Primer 5 2 5 1 0 13Signaling Device 37 40 15 18 0 110Simulator 20 25 5 20 2 72Smoke Grenade (LE) 13 16 13 10 1 53TNT 16 22 15 16 0 69Unknown or N/A 0 0 314 579 508 1,401Grand Total 2,009 2,088 1,800 2,141 1,842 9,880
Recovery - Main Charges

RECOVERIES – 2019
Page | 11 UNCLASSIFIED
UNCLASSIFIED
2019 Explosives Incident Report (EIR)
2.5 Recovery – Switches The majority of recovered switch types in 2019 included Time – Pyrotechnic (safety/time or hobby fuses) and Command Pull switches. Time – Pyrotechnic switches decreased by 14 percent, and Command – Pull switches has remained unchanged since 2018. (See figure 16 for a breakdown of switch types with corresponding total number of incidents.) Note: Unknown or N/A (691) was left off the chart. It is selected when either a switch was not known at the time of entry or there was no switch associated with the device.
2.6 Recovery – Containers Figure 17 provides the number of incidents where a container was reported as recovered in 2019. The statistics represented in this chart include a count of every time the specific container type was reported as recovered but does not represent the exact quantity of containers that were recovered. For instance, if one incident reported a recovery of two pipes, four end caps/plugs, and two bottles/jugs, it would be represented in the graph below as one incident. However, if there were two identical container types recovered in the same incident but both consisted of independent material subtypes, then both would be counted. Note: Unknown or N/A is selected when either a container was not known at the time of entry or there was no container associated with the device.
Figure 17. Recovery of Containers – 2019
Figure 16. Recovered Switches – 2019

SUSPICIOUS PACKAGES – 2019
Page | 12 UNCLASSIFIED
UNCLASSIFIED
2019 Explosives Incident Report (EIR)
3.1 Suspicious Packages, Summary and Trends There were 5,482 suspicious/unattended package incidents reported during the 2019 calendar year. This was a 26-percent decrease from 2018, and is an average amount of incidents when looking at a 5-year comparison.
Incidents involving suspicious Packages/Parcels decreased by half; however, Book Bag/Purse increased from 1,136 incidents in 2018 to 1,324 incidents in 2019. Incidents of suspicious persons doubled since last year. (See figure 19 for a comparison of suspicious package types between 2018 and 2019.)
Figure 18. Suspicious/Unattended Packages, 2015–19
Figure 19. Suspicious/Unattended Package Incident Types, 2018–19
Type 2018 2019 DifferenceBook Bag / Purse 1,136 1,324 188Cargo (commercial) 161 63 -98Letter / Envelope 255 201 -54Luggage / Briefcase 1,235 764 -471Other 1,039 910 -129Package / Parcel 2,006 1,001 -1,005Person 31 63 32Powder (Without Envelope) 55 53 -2Suspicious Container 1,132 926 -206Under Investigation 1 0 -1Vehicle 182 151 -31Not Identified 171 26 -145

BOMB THREATS – 2019
Page | 13 UNCLASSIFIED
UNCLASSIFIED
2019 Explosives Incident Report (EIR)
Figure 21. Bomb Threat Target Types (Top Three) and Subtypes
4.1 Bomb Threats, Summary and Trends A total of 1,089 bomb-threat incidents were reported in 2019, a decrease of 33 percent since 2018. This is the lowest number reported in the past 5 years. In 2019, bomb threats were highest during the months of April (105) and August (104) with the majority of incidents occurring on Thursdays (18%). Saturdays and Sundays had the least number of reported incidents.
4.2 Bomb Threats by Target Education, residential and assembly locations were the top three targets of bomb threats during 2019. The number of reported incidents targeting offices/businesses decreased by more than half since 2018.
High School/Junior High/Middle School – 122 Elementary School – 19 College/University – 15 Other – 1 Preschool or Daycare – 5
1 (Single Family) or 2-Family Dwelling – 89 Hotel / Motel – 27 Multifamily Dwelling – 18 Other – 8 Boarding/Rooming House - 1
Amusement Center/Park - 4 Athletic/Health Club - 2 Auditorium/Concert Hall - 5 Bar/Nightclub/Tavern - 6 Bus Stop/Train Station - 2 Casino/Gambling Establishment - 3 Club, Other - 2 Convention Center / Exhibit Hall - 9 Courthouse - 17 Gymnasium - 2 Library - 3 Museum - 1 Other - 37 Park - 1 Passenger Terminal (Bus/Rail/Airport) - 14 Public or Government - 14 Radio/Television/Movie Studio - 2 Restaurant/Cafeteria - 26 Sports Stadium/Arena - 22 Theater (Play/Movie) - 3
Figure 20. Bomb Threats – 5-year Trend Analysis

HOAXES – 2019
Page | 14 UNCLASSIFIED
UNCLASSIFIED
2019 Explosives Incident Report (EIR)
Figure 23. Hoax Incident Types and Subtypes, 2015–19
5.1 Hoax Device Incidents, Summary and Trends There were 356 hoax device incidents reported in 2019, a slight decrease of 16 percent since 2018. Eighty-eight (88) percent of the reported hoax devices were IED-type hoax devices. Texas, California, Florida, Pennsylvania, and Arizona had the most reported hoax devices. Residential structures remain the most common target of reported hoax devices. Figure 22 shows that hoax device reporting is on a downward trend since 2015 with the exception of a slight increase in 2018.
5.2 Hoax Incidents by Incident Type
The most commonly reported hoax devices in 2019 were IEDs. Seventeen (17) of the 356 hoax incidents did not specify a type.
Figure 22. Hoax Device Incidents, 2015–19
Type of reported hoax devices 2015 2016 2017 2018 2019IED 474 468 361 376 312CBRN (Not chemical reaction/acid bombs) 10 12 11 14 11Incendiary Device 36 23 16 19 16Total 520 503 388 409 339
THEFTS/LOSSES – 2019
Page | 15 UNCLASSIFIED
UNCLASSIFIED
2019 Explosives Incident Report (EIR)
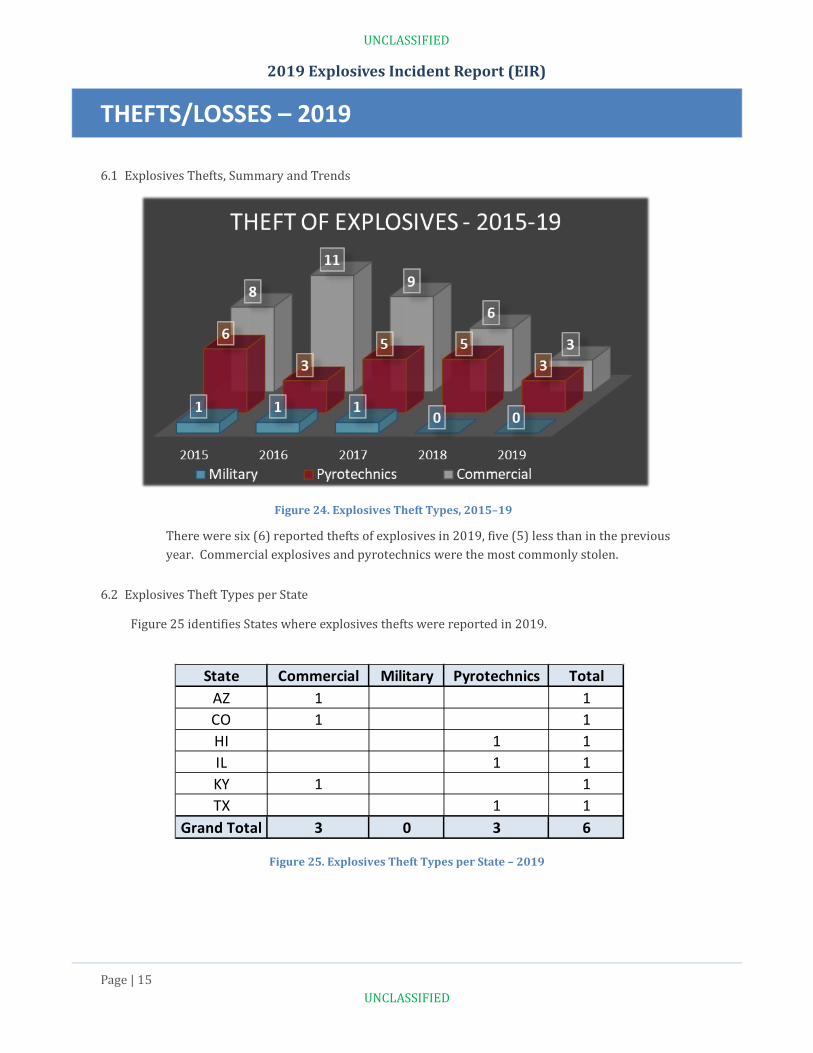
Figure 25. Explosives Theft Types per State – 2019
6.1 Explosives Thefts, Summary and Trends
There were six (6) reported thefts of explosives in 2019, five (5) less than in the previous year. Commercial explosives and pyrotechnics were the most commonly stolen.
6.2 Explosives Theft Types per State
Figure 25 identifies States where explosives thefts were reported in 2019.
Figure 24. Explosives Theft Types, 2015–19
State Commercial Military Pyrotechnics TotalAZ 1 1CO 1 1HI 1 1IL 1 1KY 1 1TX 1 1
Grand Total 3 0 3 6

THEFTS/LOSSES – 2019
Page | 16 UNCLASSIFIED
UNCLASSIFIED
2019 Explosives Incident Report (EIR)
Figure 27. Explosives Loss Types per State – 2019
6.3 Explosives Losses, Summary and Trends
There were 136 instances of explosives losses reported during 2019, a slight increase from 2018. The majority of explosives losses were commercial explosives (83 percent) and pyrotechnics (11 percent).
Figure 26. Explosives Loss Types, 2015–19
State Commercial Military Pyrotechnics TotalAK 1 1 2AR 5 5AZ 4 4CA 5 1 1 7CO 3 2 5CT 1 1FL 2 0 2HI 1 1ID 1 1IL 4 4IN 2 3 5KS 1 2LA 4 4MI 2 2MN 1 1MS 5 5NH 2 2NJ 1 1
State Commercial Military Pyrotechnics TotalNM 1 1NV 1 1NY 1 2 3OH 2 2OK 8 8OR 3 2 5PA 2 2 4SC 2 1 3TN 5 5TX 16 16UT 13 2 1 16VA 1 1VT 1 1 2
WA 1 1WI 1 1WV 1 1WY 13 13
Grand Total 113 8 15 136
CONTACT INFORMATION
Page | 17 UNCLASSIFIED
UNCLASSIFIED
2019 Explosives Incident Report (EIR)
Contact Information
United States Bomb Data Center 3750 Corporal Road, Redstone Arsenal, AL 35898 Tel 256-261-7580 Fax 866-927-4570 [email protected]
TO REQUEST ADDITIONAL INFORMATION, PLEASE SEND AN EMAIL TO:
[email protected] OR CALL 1-800-461-8841