Embed Size (px)
Citation preview

UNCLASSIFIED
UNCLASSIFIED
UNITED STATES BOMB DATA CENTER (USBDC) EXPLOSIVES INCIDENT REPORT (EIR)
2017The Annual Explosives Incident Report (EIR) reviews bombing and explosives related incidents from information reported to the United States Bomb Data Center (USBDC) through the Bomb Arson Tracking System (BATS).

UNCLASSIFIED
UNCLASSIFIED
Table of Contents
Executive Summary ______________________________________________________________ 1
Explosions - 2017 ________________________________________________________________ 2
Recoveries - 2017 ________________________________________________________________ 8
Suspicious Packages - 2017 ___________________________________________________ 12
Bomb Threats - 2017 __________________________________________________________ 13
Hoaxes - 2017 __________________________________________________________________ 14
Thefts/Losses - 2017 __________________________________________________________ 15
Contact Information - 2017 ___________________________________________________ 17

EXECUTIVE SUMMARY
Page | 1 UNCLASSIFIED
UNCLASSIFIED
2017 Explosives Incident Report (EIR)
OPERATING HIGHLIGHTS The 2017 Explosives Incident Report (EIR) is an informational product prepared by the United States Bomb Data Center (USBDC), using incident data reported in the Bomb Arson Tracking System (BATS) by its 2,600 interagency partners and 12,845 registered users. This report examines the total number of explosives related incidents reported in BATS for calendar year 2017 and includes explosions and bombings, recoveries, suspicious packages, bomb threats, hoaxes, and explosives thefts/losses. It is important to note that BATS is a real-time dynamic incident management system that is strictly user dependent; therefore, it is possible that the data represented in this report may differ slightly from previously reported data due to updates or changes made by the owner of individual records.
STRATEGIC HIGHLIGHTS From January 1, 2017, through December 31, 2017, BATS captured a total of 14,814 explosives related incidents. Of the reported incidents, there were 687 explosions of which 335 were bombings, with California and Washington having the highest numbers. There were a total of 6,727 recoveries reported in 2017, with the majority being explosives (non-improvised explosive devices (IEDs)). There were a total of 5,552 suspicious/unattended package incidents, a decrease of 8 percent since 2016. Bomb threats continue to decrease slightly as they have for the past 5 years. There were 1,670 bomb threats reported in 2015, 1,536 in 2016, and 1,228 in 2017. Education and office/business properties remain the most commonly reported targets of bomb threats. Bomb threats to assembly locations increased by 30 percent since 2016.
LOOKING AHEAD Throughout 2017, the USBDC continues to build on previous efforts of expanding operational support to all of our interagency partners and members of the BATS user community. The BATS Section (BATSS) has maintained its focus on the BATS program and related system enhancements, while the Arson and Explosives Information and Analysis Section (AEIAS) has focused on arson and explosives analytical products as well as explosives identification, tracing and theft/loss reporting. AEIAS is also responsible for developing and producing intelligence products such as this annual report as well as a variety of other standardized, automated and on-demand reports that serve to inform the BATS user community and increase regional and national situational awareness concerning explosives and arson related incidents. This realignment within the USBDC, along with enhancements of BATS 8.1 and mobile BATS (mBATS2.1), will continue to establish the USBDC as a center of excellence for arson and explosives related reporting within the United States.
James Watson Director, USBDC

EXPLOSIONS – 2017
Page | 2 UNCLASSIFIED
UNCLASSIFIED
2017 Explosives Incident Report (EIR)
1.1 Explosion Incidents, Summary and Trends
Explosion Incidents are identified by the following categories: bombings, accidental, undetermined and under investigation explosions. The undetermined explosion category is used when the investigation has concluded, but the explosion type was unidentified. The under investigation category is used when the cause of the explosion is still pending or awaiting laboratory results.
Explosion Incidents include all incidents where explosive materials, chemicals, or ignitable mixtures were determined to be the primary cause of an explosion.
There were 687 Explosion Incidents recorded in BATS during 2017, a slight decrease of 2 percent from 2016. Bombings also decreased, from 439 reported incidents in 2016 to 335 incidents in 2017.
Figure 1. Explosion Incidents, 2013–17
EXPLOSIONS – 2017
Page | 3 UNCLASSIFIED
UNCLASSIFIED
2017 Explosives Incident Report (EIR)
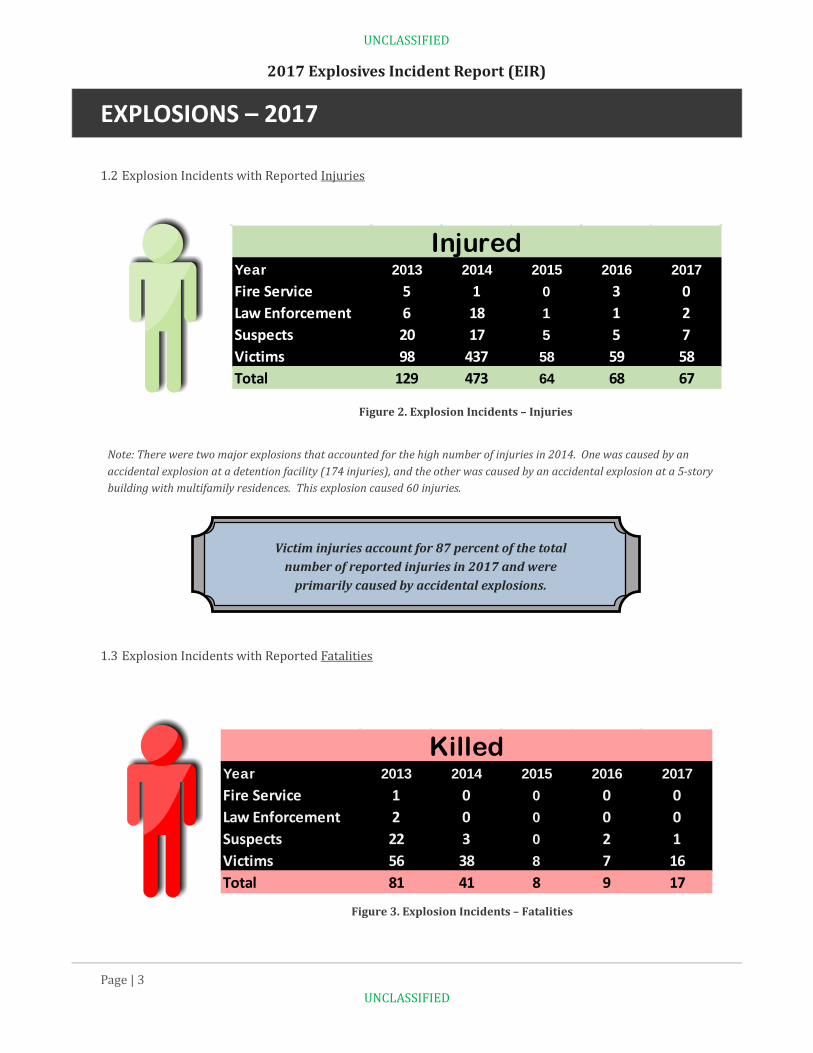
Victim injuries account for 87 percent of the total number of reported injuries in 2017 and were
primarily caused by accidental explosions.
Figure 3. Explosion Incidents – Fatalities
1.2 Explosion Incidents with Reported Injuries
1.3 Explosion Incidents with Reported Fatalities
Figure 2. Explosion Incidents – Injuries
Note: There were two major explosions that accounted for the high number of injuries in 2014. One was caused by an accidental explosion at a detention facility (174 injuries), and the other was caused by an accidental explosion at a 5-story building with multifamily residences. This explosion caused 60 injuries.
Year 2013 2014 2015 2016 2017Fire Service 1 0 0 0 0Law Enforcement 2 0 0 0 0Suspects 22 3 0 2 1Victims 56 38 8 7 16Total 81 41 8 9 17
Killed
Year 2013 2014 2015 2016 2017Fire Service 5 1 0 3 0Law Enforcement 6 18 1 1 2Suspects 20 17 5 5 7Victims 98 437 58 59 58Total 129 473 64 68 67
Injured

EXPLOSIONS – 2017
Page | 4 UNCLASSIFIED
UNCLASSIFIED
2017 Explosives Incident Report (EIR)
1.4 Explosion Incidents, Type and Subtype
1.5 Bombing Trends
A total of 335 bombing incidents were reported in 2017, a decrease of 24 percent from 2016. Bombings are broken down into the following categories: IED, Over Pressure Devices, Other Criminal, and Explosive (non-IED such as commercial, military, fireworks, and HME). Ninety-nine (99) of the 335 bombings targeted Residential structures. As in 2016, there were two (2) reported churchbombings in 2017. Schoolbombings decreased from22 incidents in 2016 to 11incidents in 2017.
Figure 4. Explosion Incidents, Type and Subtype
Figure 5. Bombing Incidents
EXPLOSIONS – 2017
Page | 5 UNCLASSIFIED
UNCLASSIFIED
2017 Explosives Incident Report (EIR)
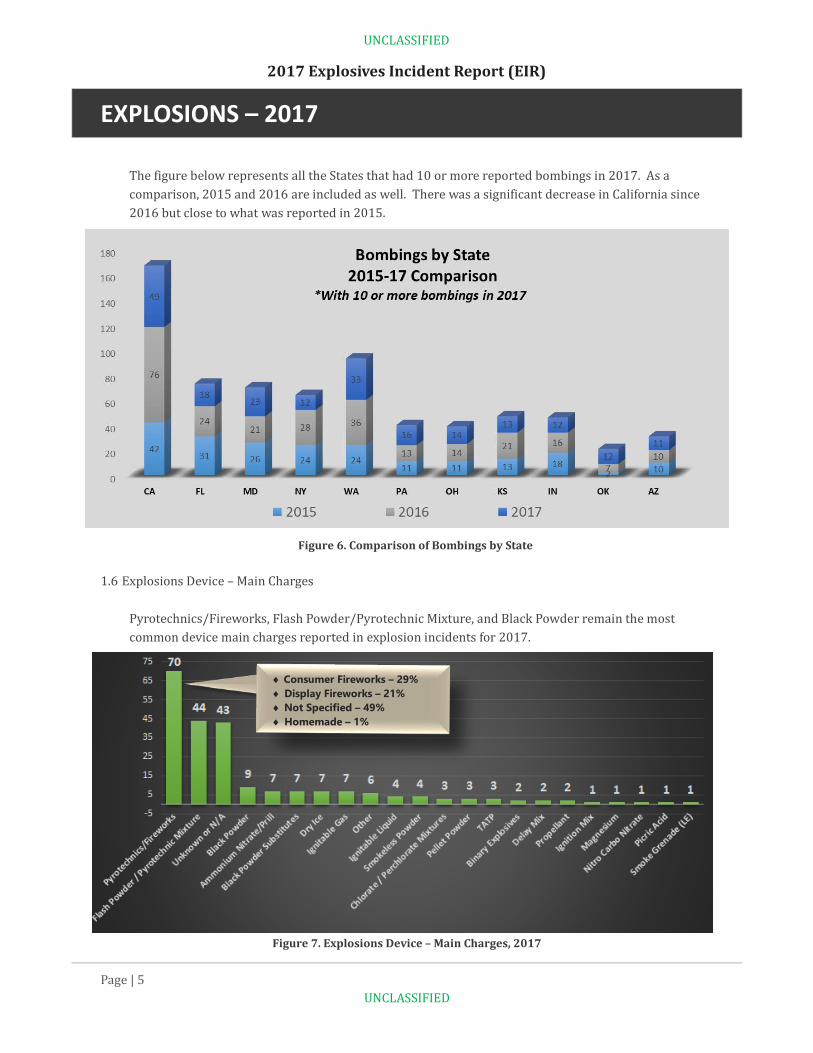
The figure below represents all the States that had 10 or more reported bombings in 2017. As a comparison, 2015 and 2016 are included as well. There was a significant decrease in California since 2016 but close to what was reported in 2015.
1.6 Explosions Device – Main Charges
Pyrotechnics/Fireworks, Flash Powder/Pyrotechnic Mixture, and Black Powder remain the most common device main charges reported in explosion incidents for 2017.
Figure 6. Comparison of Bombings by State
Figure 7. Explosions Device – Main Charges, 2017
♦ Consumer Fireworks – 29%♦ Display Fireworks – 21%♦ Not Specified – 49%♦ Homemade – 1%
EXPLOSIONS – 2017
Page | 6 UNCLASSIFIED
UNCLASSIFIED
2017 Explosives Incident Report (EIR)
Figure 8 displays an overall view of
main charges related to Explosion
Incidents for the past 5 years.
These numbers do not represent the actual quantity of main charges but rather represent
the number of reported incidents where at least one
or more main charges were
identified.
Unknown or N/A (located at the bottom of the
chart) indicates there was no main charge identified
or the main charge was
unknown at the time of the record
entry.
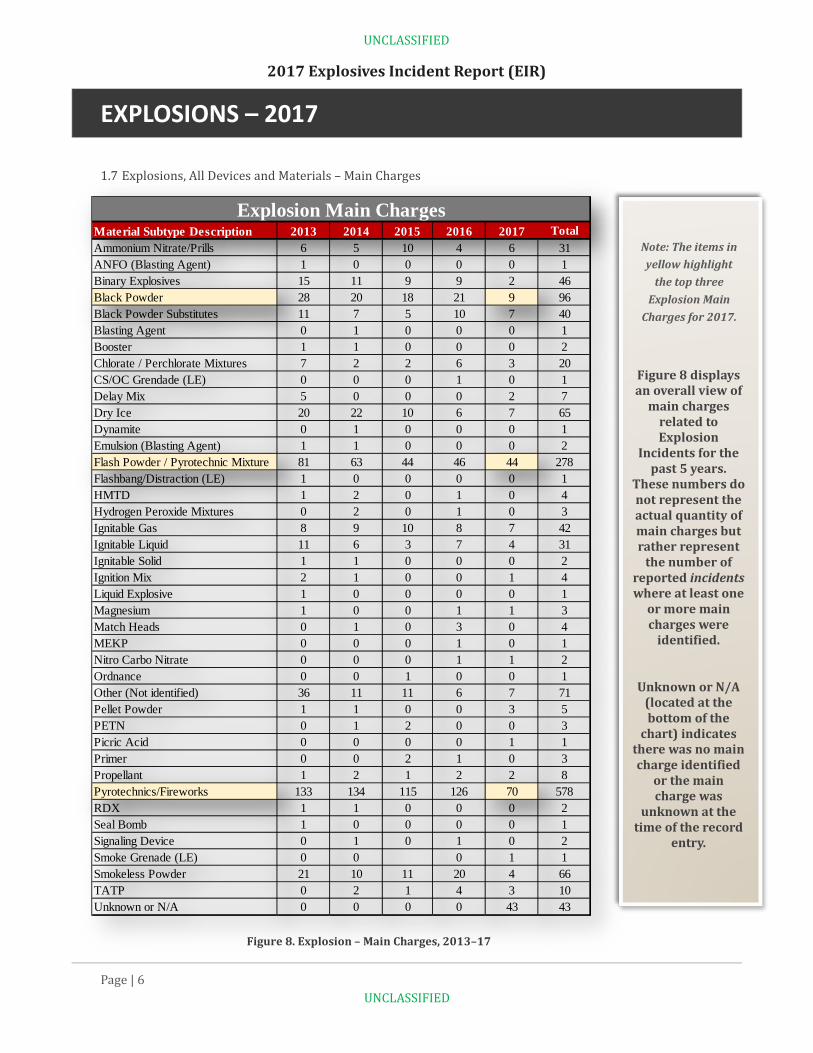
1.7 Explosions, All Devices and Materials – Main Charges
Figure 8. Explosion – Main Charges, 2013–17
Note: The items in yellow highlight
the top three Explosion Main
Charges for 2017.
Material Subtype Description 2013 2014 2015 2016 2017 TotalAmmonium Nitrate/Prills 6 5 10 4 6 31ANFO (Blasting Agent) 1 0 0 0 0 1Binary Explosives 15 11 9 9 2 46Black Powder 28 20 18 21 9 96Black Powder Substitutes 11 7 5 10 7 40Blasting Agent 0 1 0 0 0 1Booster 1 1 0 0 0 2Chlorate / Perchlorate Mixtures 7 2 2 6 3 20CS/OC Grendade (LE) 0 0 0 1 0 1Delay Mix 5 0 0 0 2 7Dry Ice 20 22 10 6 7 65Dynamite 0 1 0 0 0 1Emulsion (Blasting Agent) 1 1 0 0 0 2Flash Powder / Pyrotechnic Mixture 81 63 44 46 44 278Flashbang/Distraction (LE) 1 0 0 0 0 1HMTD 1 2 0 1 0 4Hydrogen Peroxide Mixtures 0 2 0 1 0 3Ignitable Gas 8 9 10 8 7 42Ignitable Liquid 11 6 3 7 4 31Ignitable Solid 1 1 0 0 0 2Ignition Mix 2 1 0 0 1 4Liquid Explosive 1 0 0 0 0 1Magnesium 1 0 0 1 1 3Match Heads 0 1 0 3 0 4MEKP 0 0 0 1 0 1Nitro Carbo Nitrate 0 0 0 1 1 2Ordnance 0 0 1 0 0 1Other (Not identified) 36 11 11 6 7 71Pellet Powder 1 1 0 0 3 5PETN 0 1 2 0 0 3Picric Acid 0 0 0 0 1 1Primer 0 0 2 1 0 3Propellant 1 2 1 2 2 8Pyrotechnics/Fireworks 133 134 115 126 70 578RDX 1 1 0 0 0 2Seal Bomb 1 0 0 0 0 1Signaling Device 0 1 0 1 0 2Smoke Grenade (LE) 0 0 0 1 1Smokeless Powder 21 10 11 20 4 66TATP 0 2 1 4 3 10Unknown or N/A 0 0 0 0 43 43
Explosion Main Charges
EXPLOSIONS – 2017
Page | 7 UNCLASSIFIED
UNCLASSIFIED
2017 Explosives Incident Report (EIR)
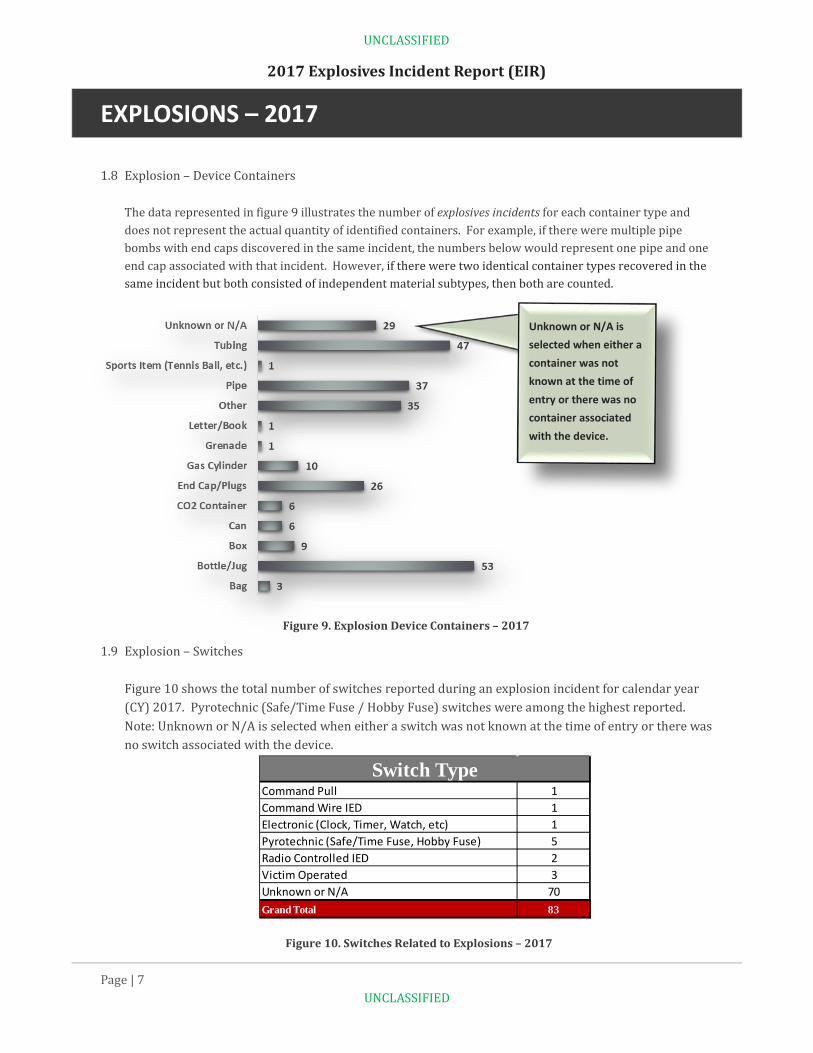
1.8 Explosion – Device Containers The data represented in figure 9 illustrates the number of explosives incidents for each container type and does not represent the actual quantity of identified containers. For example, if there were multiple pipe bombs with end caps discovered in the same incident, the numbers below would represent one pipe and one end cap associated with that incident. However, if there were two identical container types recovered in the same incident but both consisted of independent material subtypes, then both are counted.
1.9 Explosion – Switches Figure 10 shows the total number of switches reported during an explosion incident for calendar year (CY) 2017. Pyrotechnic (Safe/Time Fuse / Hobby Fuse) switches were among the highest reported. Note: Unknown or N/A is selected when either a switch was not known at the time of entry or there was no switch associated with the device.
Figure 10. Switches Related to Explosions – 2017
Figure 9. Explosion Device Containers – 2017
Unknown or N/A is selected when either a container was not known at the time of entry or there was no container associated with the device.
Command Pull 1Command Wire IED 1Electronic (Clock, Timer, Watch, etc) 1Pyrotechnic (Safe/Time Fuse, Hobby Fuse) 5Radio Controlled IED 2Victim Operated 3Unknown or N/A 70Grand Total 83
Switch Type

RECOVERIES – 2017
Page | 8 UNCLASSIFIED
UNCLASSIFIED
2017 Explosives Incident Report (EIR)
2.1 Recovery Incidents, Summary and Trends
2.2 Recovery Types
Overall, the largest recovery type and subtype categories remain unchanged. Explosives (non-IED) recoveries represent the majority, with commercial explosives recoveries and pyrotechnic recoveries in the lead. The “Other” category includes the following subtypes: Ammunition, Bomb Making Information, Inert Commercial, and Inert–Military. Of those subtypes, Ammunition (963) and Inert–Military (825) were the most reported. (See figures 12 and 13.)
Figure 11. Recovery Incidents, 2013–17
Figure 12. Recovery Types – 2017

RECOVERIES – 2017
Page | 9 UNCLASSIFIED
UNCLASSIFIED
2017 Explosives Incident Report (EIR)
Figure 13. Recovery Subtypes
2.3 Recovery Subtypes
2.4 Recovery Incidents by Target Type Of the recovery incidents where a target was reported in 2017, the majority took place at residential structures (29 percent) and law enforcement/emergency offices (10 percent). The majority of recovery incidents at law enforcement/emergency offices does not indicate that a specific device was recovered after being placed at the location; rather, it is most likely due to explosives material turn-ins, etc. See figure 14 for a complete list of all recoveries by location.
Figure 14. Recovery Incidents by Target Type

RECOVERIES – 2017
Page | 10 UNCLASSIFIED
UNCLASSIFIED
2017 Explosives Incident Report (EIR)
Figure 15 displays an overall view of
main charges related to recovery
incidents for the past 5 years. These
numbers do not represent the
actual quantity of main charges but rather represent
the number of reported incidents where at least one
or more main charges were
identified.
Unknown or N/A (located at the bottom of the
chart) indicates there was no main
charge identified or the main charge was unknown at the time of the record entry.
Due to the large
amount of data, if a main charge had a
grand total of 10 or fewer recoveries, it was not included in
the chart.
2.5 Recovery – All Devices and Materials - Main Charges
Figure 15. Recovery – Main Charges, 2013–17
Note: The items in yellow highlight
the top five Recovery Main
Charges for 2017.
Material Type 2013 2014 2015 2016 2017 Grand TotalAmmonium Nitrate/Prill 21 19 21 24 18 103ANFO (Blasting Agent) 13 16 17 9 14 69Binary Explosives 31 47 46 49 41 214Black Powder 200 220 182 210 150 962Black Powder Substitutes 72 74 77 79 84 386Booster 25 39 22 30 25 141Chlorate / Perchlorate Mixtures 17 12 18 15 7 69Composition B 3 7 7 8 4 29Composition C4 23 34 31 30 12 130CS/OC Grenade (LE) 3 21 17 12 6 59Dry Ice 4 6 5 2 1 18Dynamite 157 154 128 101 91 631Emulsion (Blasting Agent) 23 41 28 19 30 141Flash Powder / Pyrotechnic Mixture 363 303 285 291 239 1,481Flashbang/Distraction (LE) 1 6 7 5 7 26HMTD 4 2 4 6 6 22Ignitable Gas 9 1 7 5 9 31Ignitable Liquid 89 91 72 81 43 376Ignitable Solid 17 18 16 12 13 76Ignition Mix 3 2 1 1 5 12Match Heads 11 5 4 12 3 35Nitroglycerene 6 6 8 4 2 26Ordnance 2 6 13 2 19 42Other 67 51 60 71 62 311Pellet Powder 7 5 2 2 0 16Perforator 11 12 14 9 9 55Perforator Oil Well Gun Assembly 8 5 0 1 1 15PETN 13 7 3 6 6 35Picric Acid 21 16 12 13 8 70Primer 13 10 5 2 5 35Propellant 15 5 12 9 12 53Pyrotechnics/Fireworks 721 593 590 627 348 2,879RDX 2 6 8 7 2 25Seal Bomb 11 13 15 4 1 44Shape Charge 3 9 7 4 7 30Sheet Explosive 10 11 6 12 3 42Signaling Device 25 29 37 40 15 146Simulator 23 18 20 25 5 91Slurry (Blasting Agent) 21 17 12 8 3 61Smoke Grenade (LE) 2 8 13 16 13 52Smokeless Powder 205 184 163 200 140 892TATP 8 3 4 5 4 24TNT 17 31 16 22 15 101Unknown or N/A 0 0 0 0 314 314Water Gel (Blasting Agent) 5 2 0 2 5 14
Recovery Main Charges

RECOVERIES – 2017
Page | 11 UNCLASSIFIED
UNCLASSIFIED
2017 Explosives Incident Report (EIR)
2.6 Recovery – Switches The majority of recovered switch types in 2017 included Pyrotechnic (safety/time or hobby fuses) and command pull switches. See figure 16 for a breakdown of switch types with corresponding total number of incidents. Note: Unknown or N/A is selected when either a switch was not known at the time of entry or there was no switch associated with the device.
2.7 Recovery – Containers Figure 17 provides the number of incidents where a container was reported as recovered in 2017. The statistics represented in this chart include a count of every time the specific container type was reported as recovered but does not represent the exact quantity of containers that were recovered. For instance, if one incident reported a recovery of two pipes, four end caps/plugs, and two bottles/jugs, it would be represented in the graph below as one incident. However, if there were two identical container types recovered in the same incident but both consisted of independent material subtypes, then both would be counted. Note: Unknown or N/A is selected when either a switch was not known at the time of entry or there was no switch associated with the device.
Figure 16. Recovered Switches – 2017
Figure 17. Recovery of Containers – 2017
SUSPICIOUS PACKAGES – 2017
Page | 12 UNCLASSIFIED
UNCLASSIFIED
2017 Explosives Incident Report (EIR)
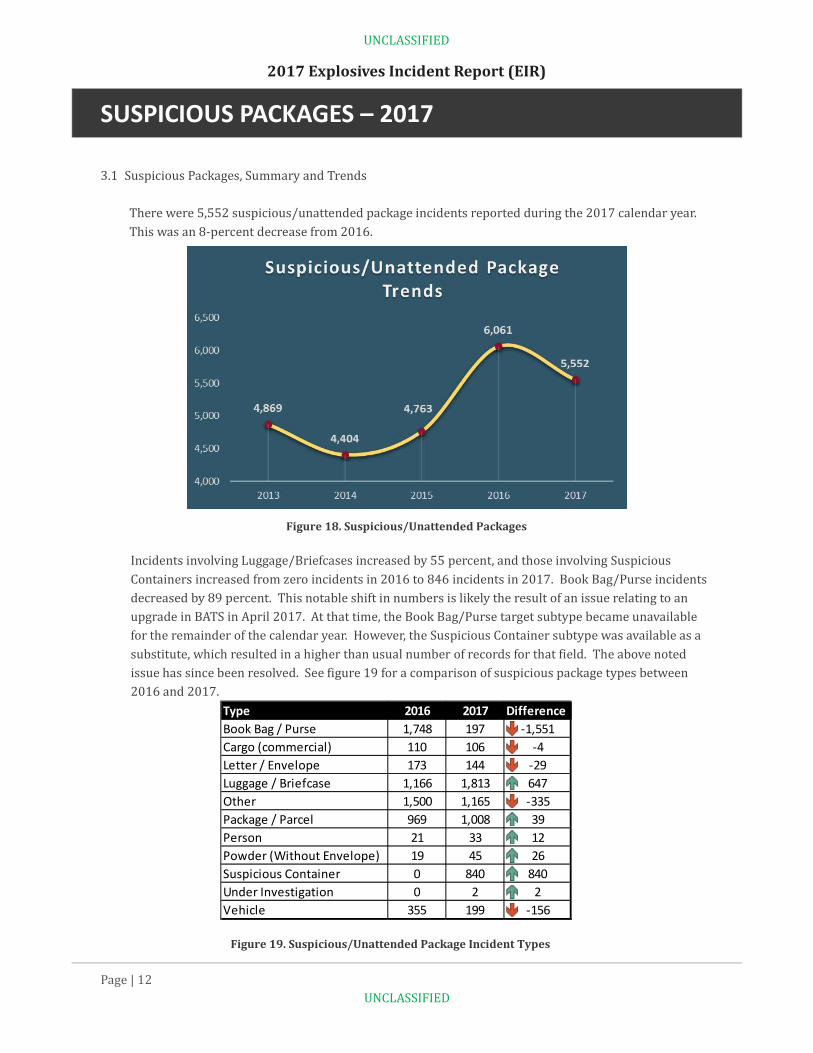
3.1 Suspicious Packages, Summary and Trends There were 5,552 suspicious/unattended package incidents reported during the 2017 calendar year. This was an 8-percent decrease from 2016.
Incidents involving Luggage/Briefcases increased by 55 percent, and those involving Suspicious Containers increased from zero incidents in 2016 to 846 incidents in 2017. Book Bag/Purse incidents decreased by 89 percent. This notable shift in numbers is likely the result of an issue relating to an upgrade in BATS in April 2017. At that time, the Book Bag/Purse target subtype became unavailable for the remainder of the calendar year. However, the Suspicious Container subtype was available as a substitute, which resulted in a higher than usual number of records for that field. The above noted issue has since been resolved. See figure 19 for a comparison of suspicious package types between 2016 and 2017.
Figure 18. Suspicious/Unattended Packages
Figure 19. Suspicious/Unattended Package Incident Types
Type 2016 2017 DifferenceBook Bag / Purse 1,748 197 -1,551Cargo (commercial) 110 106 -4Letter / Envelope 173 144 -29Luggage / Briefcase 1,166 1,813 647Other 1,500 1,165 -335Package / Parcel 969 1,008 39Person 21 33 12Powder (Without Envelope) 19 45 26Suspicious Container 0 840 840Under Investigation 0 2 2Vehicle 355 199 -156

BOMB THREATS – 2017
Page | 13 UNCLASSIFIED
UNCLASSIFIED
2017 Explosives Incident Report (EIR)
Figure 21. Bomb Threat Target Types (Top Three) and Subtypes
4.1 Bomb Threats, Summary and Trends A total of 1,228 bomb threat incidents were reported in 2017, a decrease of 20 percent since 2016 and an overall 28-percent decrease since 2013. In 2017, bomb threats were highest during the month of May with the majority of incidents occurring on Tuesdays.
4.2 Bomb Threats by Target Education, office/business, residential and assembly remain the top four targets of bomb threats in 2017. The number of reported incidents targeting assemblies increased by 30 percent since 2016. Restaurants and courthouses account for almost half of the bomb threats targeting assemblies in 2017.
High School/Junior High/Middle School – 166
Elementary School – 29 College/University – 22 Other – 10 Preschool or Daycare – 5 Career or Vocational Training – 3 Adult Education – 2
1 (Single Family) or 2-Family Dwelling – 78 Boarding / Rooming House – 2 Dormitory / Sorority / Fraternity House – 1 Hotel / Motel – 19 Multifamily Dwelling – 35 Other – 10
Other – 64 Department / Discount Store – 34 Bank – 22 Shopping / Strip Mall – 11 Grocery Store – 10 Post Office – 4 Household Goods Store – 2 Recreational / Hobby / Pet Store – 1
Figure 20. Bomb Threats – 5-year Trend Analysis

HOAXES – 2017
Page | 14 UNCLASSIFIED
UNCLASSIFIED
2017 Explosives Incident Report (EIR)
Figure 23. Hoax Incident Types and Subtypes
5.1 Hoax Device Incidents, Summary and Trends There were 503 hoax device incidents reported in 2017. Ninety-three (93) percent of the reported hoax devices were IED-type hoax devices. California, Florida, Washington, and Colorado had the most reported hoax devices. Residential structures remain the most common target of reported hoax devices. Figure 22 shows that hoax device reporting is on a downward trend and is the lowest number seen since 2013.
5.2 Hoax Incidents by Incident Type
The most commonly reported hoax devices in 2017 were IEDs.
Figure 22. Hoax Device Incidents, 2013–17
Type of reported hoax devices 2013 2014 2015 2016 2017IED 627 579 474 468 361CBRN (Not chemical reaction/acid bombs) 19 18 10 12 11Incendiary Device 33 35 36 23 16Total 679 632 520 503 388

THEFTS/LOSSES – 2017
Page | 15 UNCLASSIFIED
UNCLASSIFIED
2017 Explosives Incident Report (EIR)
Figure 25. Explosives Theft Types per State
6.1 Explosives Thefts, Summary and Trends
There were 15 reported thefts of explosives in 2017, which is unchanged from the previous 2 years. Commercial explosives remain the most commonly stolen, followed by pyrotechnics.
6.2 Explosives Theft Types per State
Figure 25 identifies states where explosives thefts were reported in 2017.
Figure 24. Explosives Theft Types, 2013–17
State Commercial Military Pyrotechnics TotalAR 2 2CA 2 2FL 1 1GU 1 1ID 1 1IN 2 2
MO 2 2MT 1 1TX 1 1VA 1 1WV 1 1
Grand Total 9 1 5 15

THEFTS/LOSSES – 2017
Page | 16 UNCLASSIFIED
UNCLASSIFIED
2017 Explosives Incident Report (EIR)
Figure 27. Explosives Loss Types per State – 2017
6.3 Explosives Losses, Summary and Trends
There were 136 instances of explosives losses reported during 2017, an increase of 46 percent from 2016 and the highest number for the past 5 years. The majority of explosives losses were commercial explosives (77 percent) and pyrotechnics (21 percent).
Figure 26. Explosives Loss Types, 2013–17
State Commercial Military Pyrotechnics TotalAK 5 2 7AL 2 2AR 3 1 4AZ 6 6CA 4 3 7CO 1 1 2FL 3 1 4GA 2 1 3HI 1 1IA 1 1ID 1 1IL 2 1 3IN 1 3 4KS 1 3 4KY 1 1LA 10 10MI 1 1 2MN 2 3 5MO 1 2 3MS 4 4
State Commercial Military Pyrotechnics TotalMT 2 2NC 1 1ND 4 4NH 3 1 4NJ 2 2NV 4 4NY 1 1OK 6 6OR 2 2PA 3 2 5TN 3 1 4TX 10 1 11UT 4 4VA 2 2VT 2 2WA 1 1WI 1 1WV 2 2WY 4 3
Grand Total 105 2 29 136

CONTACT INFORMATION
Page | 17 UNCLASSIFIED
UNCLASSIFIED
2017 Explosives Incident Report (EIR)
Contact Information
United States Bomb Data Center 3750 Corporal Road, Redstone Arsenal, AL 35898 Tel 256-261-7580 Fax 866-927-4570 [email protected]
TO REQUEST ADDITIONAL INFORMATION, PLEASE SEND AN EMAIL TO:
[email protected] OR CALL 1-800-461-8841