Embed Size (px)
Citation preview

Estimation of Crack Mouth Opening Displacement in Concrete UsingOptical Fiber SensorsSobha B1*, Samrajyam K1, Sai Prasad RLN1 and Rao TDG2
1Department of Physics, National Institute of Technology, Warangal, India2Department of Civil Engineering, National Institute of Technology, Warangal, India*Corresponding author: Dr Sobha B, Department of Physics, National Institute of Technology, Warangal, India, E-mail: [email protected]
Received date: October 29, 2017; Accepted date: December 11, 2017; Published date: December 15, 2017
Copyright: ©2017 Sobha B, et al. This is an open-access article distributed under the terms of the Creative Commons Attribution License, which permits unrestricteduse, distribution, and reproduction in any medium, provided the original author and source are credited.
Abstract
Concrete is a multi-phase composite material and used widely in construction industry because of highcompressive strength and low cost. Its limited tensile strength makes it prone to cracking. Important parameters likecharacteristic length, fracture energy Gf critical crack width WC are used to understand cracks in concrete. Thecrack width is estimated either as crack mouth opening displacement (CMOD/COD) or as crack tip openingdisplacement (CTOD). Several optical and non-optical methods can provide information about crack presence butdo not provide information on crack opening and crack width which are important from considerations of durability.To this end we present our research results in three point bend tests on pre-notched concrete samples (M-20composition) using (a) Intensity based plastic optic fiber (POF) using phase difference measurement method (b)Fiber Bragg grating (FBG) method. The CMOD estimation and relative sensitivity of these methods will bepresented.
Keywords: Crack mouth opening displacement; Three point bendspecimens; UTM; FBGs; Plastic optical fiber; Phase difference method;Prenotched concrete
Introduction
Figure 1: The load deformation plot of concrete
Concrete is known to be a multiphase composite material, whichconsists of a mixture of cement, coarse and fine aggregates, water, airand chemical admixtures. In the process of SHM (structural healthmonitoring), crack detection and width measurement is one of theseveral other monitored parameters [1,2]. Cracks in concrete mainlyoccur due to (i) Continuous exposure to harsh environments and inservice loading (ii) Application of repeated loads or combination ofloads and (iii) Natural hazards, aging, thermal contraction upondrying, etc. Generally, crack widths ranging from 0.2 mm to 2.0 mmare known, leading to structural failure. The load deformation curve ofa quasi-brittle material as concrete is illustrated in (Figure 1).
The fracture behavior of quasi-brittle materials such as concrete ischaracterized by a Fracture Process Zone (FPZ) ahead of the maincrack. Here several mechanisms such as micro-cracking, crackdeflection, aggregate bridging and crack branching, determine thefracture behavior of concrete[3,4]. This is illustrated in Figure 2 below.When the material is tested under the displacement beyond the Whenthe material is tested under closed loop displacement controlled testingcondition, the displacement beyond the peak stress results due tomajor crack opening. (Shown as point of starting of strain localizationin (Figure 1) This process is accompanied by unloading of the rest ofthe specimen. The Crack Mouth Opening Displacement (CMOD) isknown to be a good indicator of fracture properties that characterizethe concrete materials It is however often difficult to determine CrackTip Opening Displacement (CTOD) as it is linked to the details ofconstitution of the micro cracked zone. However CTOD is related tothe crack mouth opening displacement (CMOD). The interrelationshipbetween CMOD and CTOD is complex mainly due to the considerableextent of the micro cracked zone in front of the crack tip.
In recent times fiber optic sensors have been adopted for crackmonitoring and detection. These include mainly Plastic Optic Fiber(POF) and Fiber Bragg gratings (FBG). Each of these have their ownlimits of applicability.
Survey of NDT methods in concreteThe nondestructive techniques used for sensing cracks and crack
monitoring are broadly divided into (1) Non optical methods and (2)Optical methods. The non-optical methods include (a) Ultrasonic (b)impact-echo method (c) Acoustic emission (d) Infrared thermographand (e) Ground penetrating radar [5,6]. The optical fiber sensor basedmethods are classified further as (a) Intensity modulated sensors (b)Polari metric sensors, (c) Interferometric sensors and (d)Spectrometric sensors [7,8]. The intensiometric sensors can be usedefficiently for long range sensing applications using economical
Opt
ometry
: Open Access
ISSN: 2476-2075
Optometry: Open Access Sobha et al.,, Optom Open Access 2018, 3:1DOI: 10.4172/2476-2075.1000126
Research Article Open Access
Optom Open Access, an open access journalISSN:2476-2075
Volume 3 • Issue 1 • 1000126

devices. The interferometric sensors, FBG sensors, and polarimetricsensors are more preferred for localized sensing, but involvecomplicated and costly signal processing and it is also easier tomeasure the optical power than the phase/state of lightpolarization[9,10]. The notable methods in recent times also includedigital image correlation (DIC) [11,12] and fiber loop ring downtechnique (FLRD) [13]. Various fiber optic sensors have beendeveloped in the recent past for the detection of cracks in concretespecimens, however most of them are limited in their applications.
Figure 2: Fracture Process Zone (FPZ) in concrete illustrating themechanisms that operates.
The necessity of choosing a method needs to address:
Need only detection of crack and trace its propagation.
Is it needed to measure the crack width at the chosen location or indistributed points?
In this paper we report on our research using: POF sensors.
FBG sensors for estimation of CMOD in prenotched concretespecimens subjected to three point bend (TPB) test. We shall alsopresent our results of comparison of the sensitivity of these techniquesin M_20 composition of concrete.
Experimental
Materials
Property Cement
(IS 12269-1983)
Natural river sand
(Fine aggregate)
Crushed Coarse
Aggregate
Specificgravity
3.15 2.60 2.78
Table 1: Specific gravity of the constituents of M-20 composition.
Cement conforming to ISI 12269-1983 with specific gravity 3.15 wasused for the concrete mix. Natural river sand that has specific gravity2.60 is used as fine aggregate. Crushed coarse aggregate of two sizes (a)20 mm size aggregate constituting 60% is mixed with (b)Aggregate of10 mm size that constitutes 40%. The specific gravity of the variousconstituents is listed in (Table 1).
Casting processCubes casted with 100 mm side were used to determine the
compressive strength of concrete while cylinders casted with 150 mmdiameter and 300 mm length were used to determine the modulus ofelasticity of the concrete. The elasticity modulus of the concrete isexperimentally found to be 28.560 MPa, which is confirming to theM20 grade mix composition specifications. Prisms of dimensions (400× 100 × 100) mm (L × B × D) and beams of dimensions (700 × 500 ×100) mm (L × B × D) (Table 2), size were cast with the above concrete.
Beam
Dimensions(mm)
Concretecompressive
Strength (MPa)
Cement
Fine Coarse
Aggregate
W/C
Ratio
400 × 100 × 100
700 × 150 × 100
27 1 1.58 3.17 0.5
Table 2: Properties of the Concrete specimens.
A needle vibrator has been used for compaction. All the specimenswere cured for 28 to 40 days in the curing tank. At the end of curingtime the samples were separated from the curing tank and a notch wasmade in the specimens using a notch cutter. Notch depth (a/d=0.2, 0.3)was used for the prisms and beams. The nomenclature for the TPBspecimens and photograph of casted beams in curing tank are shownin (Figures 3A and 3B) respectively.
Figure 3(A): Nomenclature for TPB specimens.
The measured compressive strength (MPa) for the M_20composition is 27 MPa.
3.0 Principle of the POF Sensor using Phase Difference Method:Plastic Optic Fiber sensor (POF) has been chosen for estimation ofcrack width measurement for prenotched concrete beams subjected tothree point bend (TPB) test guided by the following considerations: Itis (a) economical sensor-wise (b) provides high sensitivity (c) is ruggedon concrete surface and capable of being embedded into concrete (d)sensor has fast response. The crack widths to be measured lie in therange (0.02 mm-3 mm). In our earlier experiments, we have reportedon the use of POF for estimation of crack width in TPB tests ofconcrete from the technique of amplitude changes [10,14]. The presenttechnique is based on an adoption of POF based strain sensor usingphase measurement [15]. A step index multimode POF with a corediameter of 980 μm having a numerical aperture of 0.5 with sensitivityat 650 nm was employed to measure the strain developed in terms ofphase difference. The fiber was divided into two parts of equal length,POF1 and POF2, out of which (a) POF1 is unstrained fiber while, (b)POF2 is the sensing fiber.
Citation: Sobha B, Samrajyam K, Sai Prasad RLN, Rao GTD (2018) Estimation of Crack Mouth Opening Displacement in Concrete UsingOptical Fiber Sensors. Optom Open Access 3: 126. doi:10.4172/2476-2075.1000126
Page 2 of 8
Optom Open Access, an open access journalISSN:2476-2075
Volume 3 • Issue 1 • 1000126
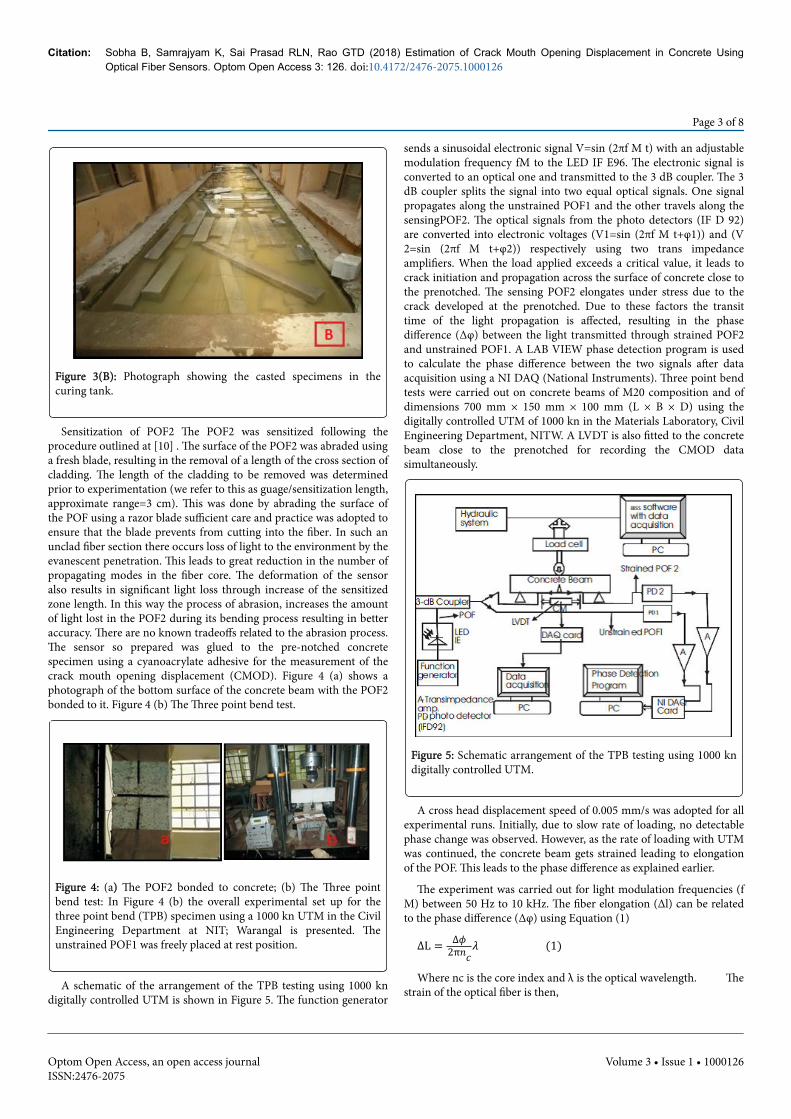
Figure 3(B): Photograph showing the casted specimens in thecuring tank.
Sensitization of POF2 The POF2 was sensitized following theprocedure outlined at [10] . The surface of the POF2 was abraded usinga fresh blade, resulting in the removal of a length of the cross section ofcladding. The length of the cladding to be removed was determinedprior to experimentation (we refer to this as guage/sensitization length,approximate range=3 cm). This was done by abrading the surface ofthe POF using a razor blade sufficient care and practice was adopted toensure that the blade prevents from cutting into the fiber. In such anunclad fiber section there occurs loss of light to the environment by theevanescent penetration. This leads to great reduction in the number ofpropagating modes in the fiber core. The deformation of the sensoralso results in significant light loss through increase of the sensitizedzone length. In this way the process of abrasion, increases the amountof light lost in the POF2 during its bending process resulting in betteraccuracy. There are no known tradeoffs related to the abrasion process.The sensor so prepared was glued to the pre-notched concretespecimen using a cyanoacrylate adhesive for the measurement of thecrack mouth opening displacement (CMOD). Figure 4 (a) shows aphotograph of the bottom surface of the concrete beam with the POF2bonded to it. Figure 4 (b) The Three point bend test.
Figure 4: (a) The POF2 bonded to concrete; (b) The Three pointbend test: In Figure 4 (b) the overall experimental set up for thethree point bend (TPB) specimen using a 1000 kn UTM in the CivilEngineering Department at NIT; Warangal is presented. Theunstrained POF1 was freely placed at rest position.
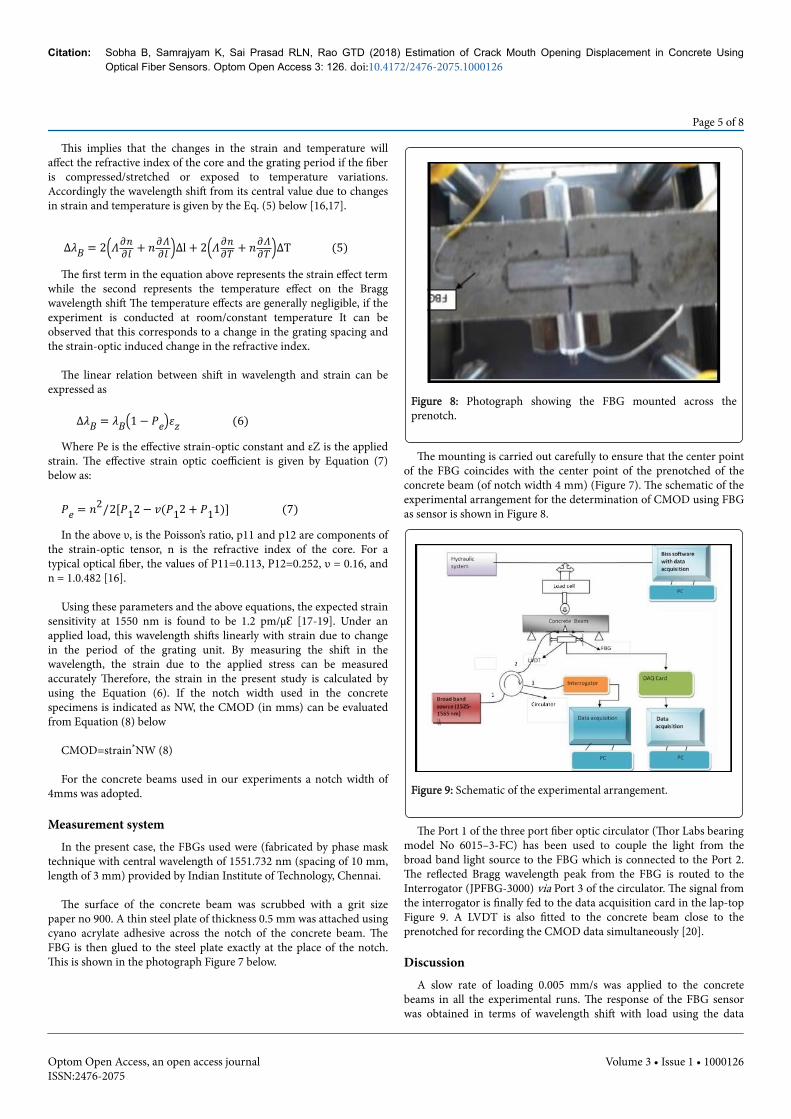
A schematic of the arrangement of the TPB testing using 1000 kndigitally controlled UTM is shown in Figure 5. The function generator
sends a sinusoidal electronic signal V=sin (2πf M t) with an adjustablemodulation frequency fM to the LED IF E96. The electronic signal isconverted to an optical one and transmitted to the 3 dB coupler. The 3dB coupler splits the signal into two equal optical signals. One signalpropagates along the unstrained POF1 and the other travels along thesensingPOF2. The optical signals from the photo detectors (IF D 92)are converted into electronic voltages (V1=sin (2πf M t+φ1)) and (V2=sin (2πf M t+φ2)) respectively using two trans impedanceamplifiers. When the load applied exceeds a critical value, it leads tocrack initiation and propagation across the surface of concrete close tothe prenotched. The sensing POF2 elongates under stress due to thecrack developed at the prenotched. Due to these factors the transittime of the light propagation is affected, resulting in the phasedifference (Δφ) between the light transmitted through strained POF2and unstrained POF1. A LAB VIEW phase detection program is usedto calculate the phase difference between the two signals after dataacquisition using a NI DAQ (National Instruments). Three point bendtests were carried out on concrete beams of M20 composition and ofdimensions 700 mm × 150 mm × 100 mm (L × B × D) using thedigitally controlled UTM of 1000 kn in the Materials Laboratory, CivilEngineering Department, NITW. A LVDT is also fitted to the concretebeam close to the prenotched for recording the CMOD datasimultaneously.
Figure 5: Schematic arrangement of the TPB testing using 1000 kndigitally controlled UTM.
A cross head displacement speed of 0.005 mm/s was adopted for allexperimental runs. Initially, due to slow rate of loading, no detectablephase change was observed. However, as the rate of loading with UTMwas continued, the concrete beam gets strained leading to elongationof the POF. This leads to the phase difference as explained earlier.
The experiment was carried out for light modulation frequencies (fM) between 50 Hz to 10 kHz. The fiber elongation (Δl) can be relatedto the phase difference (Δφ) using Equation (1)ΔL = Δ�2π��� (1)
Where nc is the core index and λ is the optical wavelength. Thestrain of the optical fiber is then,
Citation: Sobha B, Samrajyam K, Sai Prasad RLN, Rao GTD (2018) Estimation of Crack Mouth Opening Displacement in Concrete UsingOptical Fiber Sensors. Optom Open Access 3: 126. doi:10.4172/2476-2075.1000126
Page 3 of 8
Optom Open Access, an open access journalISSN:2476-2075
Volume 3 • Issue 1 • 1000126

� = �� (2)Here L=gauge length of the fiber pasted across the notch of the
concrete beam. If the notch width of the concrete beam is denoted asNW the value of CMOD can be calculated from equation (3)
CMOD = ϵ*NW (3)
ResultsFigures 6a and 6c depict the response plot between Stroke (mm) vs.
Phase (deg) vs. Load (kn) for the modulation frequencies at 250 Hz, 10kHz respectively. Figures 6b and 6d depict the plot between cmod(mm) vs. CMOD (mm) for fM of 250 Hz, 10 kHz respectively.
The point between which Δφ is estimated is indicated by arrows.The consolidated results obtained at all frequencies of modulationtested are presented in (Table 3).
Figure 6: (a) Response Plot for fM=250Hz; (b) Comparative Plot forfM=250Hz; (c) Response Plot for fM=10 KHz; (d) Comparative Plotfor fM=10 KHS.
Frequency(Hz)Phase ShiftMeasured(degrees)
CMOD(mm)using LVDT
CMOD
(mm)usingPOF Sensor
Difference(mm)
250 23 0.6 0.3 0.3
500 42 0.6 0.4 0.2
750 45 0.6 0.5 0.1
1000 50 0.6 0.7 0.1
10000 200 2.3 2 0.3
Table 3: Consolidated Results at all tested Modulation frequencies.
Conclusions
(a) The magnitude of phase change is below 90 degrees for the rangeof modulation frequencies tested except for the frequency ofmodulation of 10 kHz, (b) It is observed to increase, as the value of f Mincreases, (c )The transition of the phase becomes steeper as f Mincreases, (d) The agreement between the CMOD values estimatedusing the phase measurement technique agree well with the LVDT dataas the f M increases, (e) The features of the phase response beyond thepeak load tend to be more clearer at lower frequencies (250 Hz) andget smeared towards high frequencies.
CMOD Estimation Using a FBG Sensor
Principle of the fiber Bragg grating (FBG)The FBG consists of periodic changes of the refractive index that is
formed in the core of a single mode optical fiber from exposure to anintense UV interference pattern. The working principle of the FBG isillustrated in Figure 7 below.
When light from a broad band optical source is coupled into theFBG, this grating structure results in the reflection of light at a specificnarrow band wavelength [16]. The center wavelength of this narrowlight spectrum is referred to as Bragg wavelength λB. Thus the Bragggrating is transparent for the incident light at wavelengths other thanthe Bragg wavelength where phase matching of the incident andreflected beams occur.
The Bragg condition for the wavelength of reflected light isexpressed as�� = 2����Λ (4)
Figure 7: The working principle of the Fiber Brag grating (FBG)[17]
Where λB is the Bragg wavelength of FBG, neff is the effective indexof the fiber core, and Λ is the grating period.
The refractive index of the fiber core is affected by mechanical andthermal changes. As observed in Eq. (4) above, the reflectedwavelength satisfying the Bragg condition is dependent on the effectivecore refractive index and grating period.
Citation: Sobha B, Samrajyam K, Sai Prasad RLN, Rao GTD (2018) Estimation of Crack Mouth Opening Displacement in Concrete UsingOptical Fiber Sensors. Optom Open Access 3: 126. doi:10.4172/2476-2075.1000126
Page 4 of 8
Optom Open Access, an open access journalISSN:2476-2075
Volume 3 • Issue 1 • 1000126
This implies that the changes in the strain and temperature willaffect the refractive index of the core and the grating period if the fiberis compressed/stretched or exposed to temperature variations.Accordingly the wavelength shift from its central value due to changesin strain and temperature is given by the Eq. (5) below [16,17].
Δ�� = 2 �∂�∂� + �∂�∂� Δl + 2 �∂�∂� + �∂�∂� ΔT (5)The first term in the equation above represents the strain effect term
while the second represents the temperature effect on the Braggwavelength shift The temperature effects are generally negligible, if theexperiment is conducted at room/constant temperature It can beobserved that this corresponds to a change in the grating spacing andthe strain-optic induced change in the refractive index.
The linear relation between shift in wavelength and strain can beexpressed as Δ�� = �� 1− �� �� (6)
Where Pe is the effective strain-optic constant and εZ is the appliedstrain. The effective strain optic coefficient is given by Equation (7)below as:
�� = �2/2[�12− �(�12 + �11)] (7)In the above υ, is the Poisson’s ratio, p11 and p12 are components of
the strain-optic tensor, n is the refractive index of the core. For atypical optical fiber, the values of P11=0.113, P12=0.252, υ = 0.16, andn = 1.0.482 [16].
Using these parameters and the above equations, the expected strainsensitivity at 1550 nm is found to be 1.2 pm/μƐ [17-19]. Under anapplied load, this wavelength shifts linearly with strain due to changein the period of the grating unit. By measuring the shift in thewavelength, the strain due to the applied stress can be measuredaccurately Therefore, the strain in the present study is calculated byusing the Equation (6). If the notch width used in the concretespecimens is indicated as NW, the CMOD (in mms) can be evaluatedfrom Equation (8) below
CMOD=strain*NW (8)
For the concrete beams used in our experiments a notch width of4mms was adopted.
Measurement systemIn the present case, the FBGs used were (fabricated by phase mask
technique with central wavelength of 1551.732 nm (spacing of 10 mm,length of 3 mm) provided by Indian Institute of Technology, Chennai.
The surface of the concrete beam was scrubbed with a grit sizepaper no 900. A thin steel plate of thickness 0.5 mm was attached usingcyano acrylate adhesive across the notch of the concrete beam. TheFBG is then glued to the steel plate exactly at the place of the notch.This is shown in the photograph Figure 7 below.
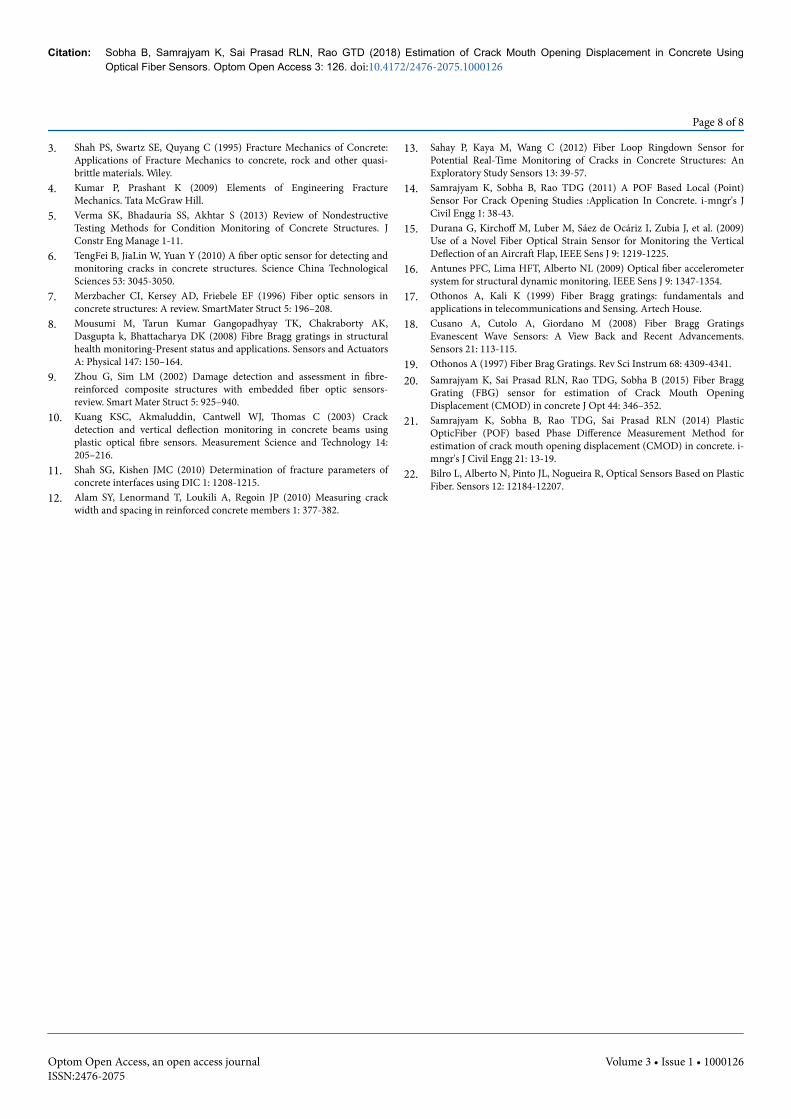
Figure 8: Photograph showing the FBG mounted across theprenotch.
The mounting is carried out carefully to ensure that the center pointof the FBG coincides with the center point of the prenotched of theconcrete beam (of notch width 4 mm) (Figure 7). The schematic of theexperimental arrangement for the determination of CMOD using FBGas sensor is shown in Figure 8.
Figure 9: Schematic of the experimental arrangement.
The Port 1 of the three port fiber optic circulator (Thor Labs bearingmodel No 6015–3-FC) has been used to couple the light from thebroad band light source to the FBG which is connected to the Port 2.The reflected Bragg wavelength peak from the FBG is routed to theInterrogator (JPFBG-3000) via Port 3 of the circulator. The signal fromthe interrogator is finally fed to the data acquisition card in the lap-topFigure 9. A LVDT is also fitted to the concrete beam close to theprenotched for recording the CMOD data simultaneously [20].
DiscussionA slow rate of loading 0.005 mm/s was applied to the concrete
beams in all the experimental runs. The response of the FBG sensorwas obtained in terms of wavelength shift with load using the data
Citation: Sobha B, Samrajyam K, Sai Prasad RLN, Rao GTD (2018) Estimation of Crack Mouth Opening Displacement in Concrete UsingOptical Fiber Sensors. Optom Open Access 3: 126. doi:10.4172/2476-2075.1000126
Page 5 of 8
Optom Open Access, an open access journalISSN:2476-2075
Volume 3 • Issue 1 • 1000126

acquisition system (Figure 15). Initially there is no observable shift ofwavelength of FBG. However, when the applied load approaches thepoint of peak stress, the rate of shift in the Bragg wavelength is seen toincrease and continues beyond the point of peak stress. This isattributed to the initiation of cracking in the concrete beam, at thepeak stress followed by crack propagation. The applied stress on theFBG in the direction of the fiber axis results in the extension of itsphysical dimensions and in the change of effective period of the FBGviz. Λ. The effective period of the grating Λ increases with crackinitiation and propagation beyond peak stress point. The shift in theBragg wavelength increases till the unloading point. These features canbe clearly understood from the experimental data plot of Figure 10.
Figure 10: The plot of stroke vs. Load for FBG1.
From the knowledge of the acquired wavelength shift after the peakstress the corresponding strain developed was calculated (in to microstrain) by using Equation (6). The variation of CMOD (mms)estimated from Equation (8) and plotted as a function of stroke (mm)with increasing load (in kn) is shown in Figure 11.
From this plot it can be inferred that the crack mouth openingdisplacement (CMOD) increases rather slowly till the peak stress.Beyond the peak stress the value of CMOD increases at a faster ratedue to the opening of the crack in the concrete beam at the prenotchregion. The nature of the results was repeated with all FBG sensorstested.
From this plot it can be inferred that the crack mouth openingdisplacement (CMOD) increases rather slowly till the peak stress.Beyond the peak stress the value of CMOD increases at a faster ratedue to the opening of the crack in the concrete beam at the prenotchregion. The nature of the results was repeated with all FBG sensorstested.
Figure 11: The plot of stroke vs. Load /CMOD of FBG1.
The nature of linear variation between the shift in the Braggwavelength and the estimated crack mouth opening displacement(CMOD) is plotted in Figure 12 below. From Equation (4) it isobserved that the Bragg wavelength is directly related to the effectivegrating period Λ. As the load is applied starting from the minimumvalue there is an increase in the strain experienced by the FBG. Thisleads to the increase of effective grating period Λ and hence theincreases in Bragg wavelength shift. The strain thus measured is usedto estimate the CMOD from Equation (8). Thus this plot serves asvalidity for the theory outlined previously.
Figure 12: Plot showing the Bragg wavelength shift vs. CMOD(mm).
The CMOD obtained from the FBG sensor was also compared withthe CMOD acquired by using an LVDT which was fitted to theconcrete beam close to the prenotch. The nature of agreement obtainedis shown in Figure 13. The FBG sensor exhibits better sensitivity thanthe LVDT on strain softening side beyond the peak stress.
From this plot it can be inferred that the crack mouth openingdisplacement (CMOD) increases rather slowly till the peak stress.Beyond the peak stress the value of CMOD increases at a faster ratedue to the opening of the crack in the concrete beam at the prenotchregion. The nature of the results was repeated with all FBG sensors
Citation: Sobha B, Samrajyam K, Sai Prasad RLN, Rao GTD (2018) Estimation of Crack Mouth Opening Displacement in Concrete UsingOptical Fiber Sensors. Optom Open Access 3: 126. doi:10.4172/2476-2075.1000126
Page 6 of 8
Optom Open Access, an open access journalISSN:2476-2075
Volume 3 • Issue 1 • 1000126

tested .The repeatability of the measured CMOD has also been foundto be very good even when the FBG is changed as depicted in Figure14. This was always true with all FBGs tested. Further the average valueof CMOD measured at peak stress is 0.005 mm.
Figure 13: Comparison of CMOD with LVDT data.
Figure 14: Plot showing the repeatability of the data obtained usingdifferent FBGs.
Overall ConclusionsThe (table 4) given below presents the estimated CMOD value using
three methods adopted [20].
In the case of POF sensors the radiation power loss due toevanescent modes depends on the discontinuity in the core/claddinginterface, the fiber dimensions and also the angle of launching the lightinto the core. In evanescent field sensors the removal of the claddinglayer and exposing of the core is a commonly adopted technique. Thisprocess serves to increase the loss in the propagating modes when thefiber is bent.
Figure 15: Photograph of the data acquisition.
Due to reasons of low cost, simple and effective approach ofmonitoring, POF based sensor methods may be prefered where highresolution and precision are not the main deciding factors.
The problem of (a) intensity variation caused due to macro bendingeffect along the fiber and (b) any other disturbance not connected withthe quantity under measurement may also lead to variation inresolution. However these problems are readily overcome by (a) takingcare in the positioning of the fiber and (b) adopting self-referencingmethods such as path difference sensing [21,22]. The finding of ourresearch has revealed an overall agreement between the data obtainedwith LVDT and the Phase difference measurement technique using thePOF.
The resolution of the FBG based sensor is far superior as it isdependent on the value of the grating element. The agreement betweenthe data obtained with the FBG sensor and LVDT is also found to begood. The resolution of FBG sensors was found to better than LVDTon the beyond the peak value.
Hence it can be concluded that the choice of approach in CMODestimation is dependent on the accuracy needed and the consequentcomplexity of the instrumentation to be adopted.
S.NO Technique CMOD value Range
1POF Intensity basedTechnique Around 0.3 mm (300 micrometers)
2Phase DifferenceMeasurement Technique
0.3 mm to 2 mm Depending onfrequency of Modulation
3 FBG based sensor Technique 0.002 to 0.004 mm (2 micrometers)
Table 4: Results of CMOD estimated using POF and FBG basedsensors.
References1. López-Higuera M, Rodríguez L, Quintela A, Cobo A (2010) Currents and
Trends on Fiber Sensing Technologies for SHM: The 2nd MediterraeneanPhotonics Conference.
2. Chong KP, Carino NJ, Washer G (2003) Health monitoring of civilinfrastructures. Smart Mater Struct 12: 483–493.
Citation: Sobha B, Samrajyam K, Sai Prasad RLN, Rao GTD (2018) Estimation of Crack Mouth Opening Displacement in Concrete UsingOptical Fiber Sensors. Optom Open Access 3: 126. doi:10.4172/2476-2075.1000126
Page 7 of 8
Optom Open Access, an open access journalISSN:2476-2075
Volume 3 • Issue 1 • 1000126
3. Shah PS, Swartz SE, Quyang C (1995) Fracture Mechanics of Concrete:Applications of Fracture Mechanics to concrete, rock and other quasi-brittle materials. Wiley.
4. Kumar P, Prashant K (2009) Elements of Engineering FractureMechanics. Tata McGraw Hill.
5. Verma SK, Bhadauria SS, Akhtar S (2013) Review of NondestructiveTesting Methods for Condition Monitoring of Concrete Structures. JConstr Eng Manage 1-11.
6. TengFei B, JiaLin W, Yuan Y (2010) A fiber optic sensor for detecting andmonitoring cracks in concrete structures. Science China TechnologicalSciences 53: 3045-3050.
7. Merzbacher CI, Kersey AD, Friebele EF (1996) Fiber optic sensors inconcrete structures: A review. SmartMater Struct 5: 196–208.
8. Mousumi M, Tarun Kumar Gangopadhyay TK, Chakraborty AK,Dasgupta k, Bhattacharya DK (2008) Fibre Bragg gratings in structuralhealth monitoring-Present status and applications. Sensors and ActuatorsA: Physical 147: 150–164.
9. Zhou G, Sim LM (2002) Damage detection and assessment in fibre-reinforced composite structures with embedded fiber optic sensors-review. Smart Mater Struct 5: 925–940.
10. Kuang KSC, Akmaluddin, Cantwell WJ, Thomas C (2003) Crackdetection and vertical deflection monitoring in concrete beams usingplastic optical fibre sensors. Measurement Science and Technology 14:205–216.
11. Shah SG, Kishen JMC (2010) Determination of fracture parameters ofconcrete interfaces using DIC 1: 1208-1215.
12. Alam SY, Lenormand T, Loukili A, Regoin JP (2010) Measuring crackwidth and spacing in reinforced concrete members 1: 377-382.
13. Sahay P, Kaya M, Wang C (2012) Fiber Loop Ringdown Sensor forPotential Real-Time Monitoring of Cracks in Concrete Structures: AnExploratory Study Sensors 13: 39-57.
14. Samrajyam K, Sobha B, Rao TDG (2011) A POF Based Local (Point)Sensor For Crack Opening Studies :Application In Concrete. i-mngr's JCivil Engg 1: 38-43.
15. Durana G, Kirchoff M, Luber M, Sáez de Ocáriz I, Zubia J, et al. (2009)Use of a Novel Fiber Optical Strain Sensor for Monitoring the VerticalDeflection of an Aircraft Flap, IEEE Sens J 9: 1219-1225.
16. Antunes PFC, Lima HFT, Alberto NL (2009) Optical fiber accelerometersystem for structural dynamic monitoring. IEEE Sens J 9: 1347-1354.
17. Othonos A, Kali K (1999) Fiber Bragg gratings: fundamentals andapplications in telecommunications and Sensing. Artech House.
18. Cusano A, Cutolo A, Giordano M (2008) Fiber Bragg GratingsEvanescent Wave Sensors: A View Back and Recent Advancements.Sensors 21: 113-115.
19. Othonos A (1997) Fiber Brag Gratings. Rev Sci Instrum 68: 4309-4341.20. Samrajyam K, Sai Prasad RLN, Rao TDG, Sobha B (2015) Fiber Bragg
Grating (FBG) sensor for estimation of Crack Mouth OpeningDisplacement (CMOD) in concrete J Opt 44: 346–352.
21. Samrajyam K, Sobha B, Rao TDG, Sai Prasad RLN (2014) PlasticOpticFiber (POF) based Phase Difference Measurement Method forestimation of crack mouth opening displacement (CMOD) in concrete. i-mngr's J Civil Engg 21: 13-19.
22. Bilro L, Alberto N, Pinto JL, Nogueira R, Optical Sensors Based on PlasticFiber. Sensors 12: 12184-12207.
Citation: Sobha B, Samrajyam K, Sai Prasad RLN, Rao GTD (2018) Estimation of Crack Mouth Opening Displacement in Concrete UsingOptical Fiber Sensors. Optom Open Access 3: 126. doi:10.4172/2476-2075.1000126
Page 8 of 8
Optom Open Access, an open access journalISSN:2476-2075
Volume 3 • Issue 1 • 1000126