Embed Size (px)
Citation preview
The interbank market risk premium, central bankinterventions, and measures of market liquidity
Annika Alexius∗, Helene Birenstam†, and Johanna Eklund‡
February 4, 2014
Abstract
When the interbank market risk premium soared during the financialcrisis, it created a wedge between interest rates actually paid by pri-vate agents and the rapidly falling policy rates. Many central banksattempted to improve the situation by supplying liquidity to the do-mestic interbank market. This paper studies the Swedish interbankmarket risk premium using a unique data set on traded volume be-tween banks and between banks and the Riksbank. We find that themain determinants of the Swedish interbank premium are internationalvariables, such as US and EURO area risk premia. International ex-change rate volatility and the EURO/USD deviations from CIP alsomatters, while standard mesures of domestic market liquidity and do-mestic credit risk have insignificant effects. Our measure of actualturnover in the interbank market is however associated with a signif-icant reduction of the interbank market risk premium, as are creditprovisions by the central bank.
Keywords: Interbank market risk premium, liquidity risk, credit risk,credit provisions.JEL classifications: F31, F41.
∗Annika Alexius, Department of Economics, Stockholm University, 106 91 Stockholm,Sweden. E-mail: [email protected].†Helene Birenstam, Department of Statistics, Stockholm University. E-mail: he-
[email protected].‡Johanna Eklund, Financial Stability Department, Sveriges Riksbank. E-mail: jo-
1
1 Introduction
The interbank market received relatively little academic attention until the
financial crisis in 2007-09, when the risk premium in this particular market
sky rocketed. The resulting wedge between central bank policy interest rates
and the interest rates paid by consumers and investors turned into a major
concern during the recession, partly because this hampered the expansionary
effects of monetary policy. For instance, the Federal Funds Rate was lowered
by 5.25 percent between September 2007 and December 2008, but bank
lending rates only fell by 1.1 percent during the same period. Instead, the
interbank market risk premium increased from a stable level around 7 basis
points to a maximum of 360 basis points or 3.60 percent in October 2008.
Since this episode, both policy institutions and academic researchers have
devoted considerable attention to how the interbank market risk premium
is determined and what central banks can do to affect it. The relative
importance of illiquidity versus credit risk (and/or other risks) is important
not only from an academic point of view but also because different policy
measures are called for depending on which factors that cause movements in
the interbank market risk premium. Central banks have a variety of tools at
their disposal for improving market liquidity, but these interventions are only
effective to the extent that the interbank market risk premium is actually
driven by illiquidity rather than by other factors.
This paper utilizes a unique data set on the transaction volume in the
Swedish interbank market to investigate how liquidity, credit risk, Riksbank
interventions, and other factors affect the interbank market risk premium
in Sweden. Our data set differs from transaction volume data from e-Mid
and target2 used by e.g. Michaud and Upper (2008), and Heijmans et al
2
(2010) in that the Riksbank collects all transactions in the Swedish interbank
market, while e-Mid covers a small (less than 20 percent) and falling fraction
of the EURO interbank market. We compare interbank market liquidity as
measured by transaction volume data from the Riksbank to the standard
liquidity measure in this literature, which is the interest rate spread between
covered and uncoved sovereign bonds (Schwartz, 2010, Valenzuela, 2010, and
others).
Since 2008, the empirical literature on the interbank market risk pre-
mium has burgeoned. Different studies using different measures of liquidity,
credit risk, and various other variables such as risk aversion have reached dif-
ferent conclusions concerning the importance of these factors to movements
in the risk premium. Taylor and Williams (2009) and others find that the
interbank market risk premium is mainly driven by credit risk. Their mea-
sure of liquidity does not have significant effects. Using different measures of
both market liquidity and credit risk, Schwartz (2010) concludes that liquid-
ity risk is the more important factor. Fukuda (2011) studies interbank rate
rates across currency denominations to identify the different effects (both the
Tokyo Interbank Offered Rate (TIBOR) and the London Interbank Offered
Rate (LIBOR) are quoted in Yen as well as in US dollars). He finds that
counter party credit risk in a specific country affects the TIBOR-LIBOR
interest rate differential across currency denominations, while liquidity con-
ditions appear to be currency specific and affect dollar denominated interest
rates (TIBOR and LIBOR) differently from corresponding interest rates
denominated in Yen. Michaud and Upper (2008) document a long run rela-
tionship between credit risk and the interbank market risk premium in time
series data, but find only insignificant effects on day to day movements in
interbank spreads. They also investigate a cross section of LIBOR inter-
3
bank rates for different banks and find that credit default swap prices for
the borrowing banks are statistically unrelated to the risk premia paid by
these banks. According to Angelini et al. (2011), two thirds of the soaring
interbank spread during the 2008 financial crisis was due to increased risk
aversion rather than credit risk or illiquidity.
The empirical results concerning the relative importance of market liq-
uidity for the interbank market risk premium appear to be systematically
related to the proxies used to capture the different effects. Credit risk is typ-
ically measured using data on bank credit default spreads (as in Taylor and
Williams (2009), Fukuda (2011), Michaud and Upper (2008)). The main
exception is Schwartz (2010), who calculates the spread between interbank
rates paid by banks with high versus low credit ratings. Since the probabil-
ity of default can be calculated using CDS prices, several studies calculate
rather than estimate the effect of counterpart credit risk on the interbank
market risk premium (Bank of England 2007, Poskitt 2011).
Capturing liquidity in an OTC (over the counter) market such as the
interbank market turns out to be more diffi cult. Data on the measures of
liquidity frequently used in studies of stock markets (such as bid-ask spreads
or traded volume) are typically unavailable in case of the interbank market
since it is dominated by bilateral transaction and detailed information about
these is rarely collected. Taylor and Williams (2009), Fukuda (2011) and
others estimate the impact of liquidity provisions by central banks and con-
clude that liquidity conditions affect the interbank market risk premium iff
these liquidity provisions have significant effects. However, liquidity pro-
vided by central banks is not necessarily a perfect substitute for market
liquidity. Schwartz (2010) uses the spread between bonds with (ideally) the
same expected cash flows but different liquidity characteristics to capture
4
the liquidity premium. Similarly, Valenzuela (2010) measures liquidity risk
as the spread between US sovereign bonds and AAA bonds of international
organizations. As discussed in Section 2, this strategy identifies an asset spe-
cific liquidity premium on covered bonds. While this premium may well be
empirically correlated with the interbank market liquidity premium, these
two premia are in theory determined by different factors.
The single most important variable behind movements in the Swedish
interbank market risk premium turns out to be the US interbank market
risk premium, followed by international exchange rate volatility and the
deviations from covered interest rate parity between the EURO and the
USD. As discussed by Baba and Packer (2009), the latter variable can be
assumed to capture the shortage of US dollar credit in Europe during the
financial crisis. Somewhat surprisingly, we find that domestic credit risk,
measured as the average credit default spread for major Swedish banks,
does not affect the interbank market risk premium significantly once we
control for international variables. This implies that the strategy to first
calculate the theoretical credit risk premium from CDS data, deduct the
resulting credit premium from the actual interbank market risk premium
and then either conclude that the remaining part of the risk premium is
due to liquidity risk (as in Bank of England, 2007) or estimate the effects of
liquidity and other variables on the remaining part of the risk premium (as
in Poskitt, 2011) may be empirically questionable.
Higher domestic liquidity as measured by interbank market transaction
volume is associtated with a significantly lower interbank market risk pre-
mium. Liquidity measured as the yield spread between covered and sov-
ereign bonds is barely correlated with interbank market traded volume at
all, and the bond spread displays high correlations with measures of credit
5
risk and stock market volatility. Credit provisions by the Riksbank are also
associated with a significant reduction of the risk premium. The size of this
effect does not differ significantly from the effect of trade between banks.
Hence liquidity provided by the Riksbank could be a substitute for market
liquidity. As shown in section 4.2, the results concerning the effects of the
Riksbank interventions are somewhat sensitive to the set of control variables
used.
2 Measuring interbank market liquidity
As a general notion, liquidity is defined as the ease with which assets are
traded. An illiquid asset is more diffi cult to sell than a liquid asset. Similarly,
it is more diffi cult to buy and sell assets on an illiquid market than on
a liquid market. This is often modeled as an exogenous transaction cost
that may vary over time and/or between different assets and markets. The
most common empirical counterpart is bid-ask spreads, data on which is
typically unavailable in the case of over the counter (OTC) markets such as
the interbank market.
Rather than just assuming an exogenous transaction cost to model illiq-
uidity, this cost can be derived endogenously through several different mech-
anisms. In models with asymmetric information and adverse selection, the
transaction cost depends on the probability of dealing with an informed
trader and on how much additional information she has. Such models are
developed by Glosten and Milgrom (1985) and Kyle (1985). The quantita-
tive importance of this mechanism can be captured by measuring the impact
of an additional net order flow on market prices. The more information that
is revealed by an additional unit of trade, the more it affects the equilibrium
6
price and the higher is the transaction cost due to asymmetric information.
A common empirical proxy is the average change in market price per unit of
trade (Korajdsyk and Sadka, 2008). More complex measures of the effect of
asymmetric information on transaction costs can also be constructed, such
as the difference in bid-ask spread between small orders and large orders
divided by the corresponding difference in order size (Goyenko et al., 2009).
A second strand of the theoretical literature on liquidity premia as an
endogenously derived transaction cost focuses the inventory risk of market
makers (Amihud and Mendelson, 1980). It is more risky and hence more
costly to hold an asset before being able to re-sell it if asset returns are
volatile, traded volume or turnover is low and/or volatile, the more of this
asset the market maker already holds, and the less diversifiable these risks
are. The theoretical concept of liquidity here centers around "the value of
immediacy", i.e. the willingness to pay for immediate trade with a market
maker rather than delaying the transaction while finding a buyer. As above,
empirical measures capture how much the market price is temporarily de-
pressed by e.g. an unexpected sell order. A standard proxy is again the
average change in market price per unit of trade.
The third mechanism for creating endogenous transaction costs is par-
ticularly relevant to OTC markets, such as the interbank market. Search
frictions and bilateral bargaining can cause differences in return also be-
tween assets with identical expected cash flows if these assets have different
liquidity characteristics. The theoretical illiquidity concept in these model
corresponds to the time it takes before an asset can be sold. Assets that
are traded more frequently are associated with lower search costs and hence
carry a lower liquidity premium. The theoretical model that has the closest
connection to the empirical literature on liquidity premia in the interbank
7
market is Vayanos and Weill (2008), who show how bonds with identical cash
flows but different liquidity characteristics can trade at different prices.1 Se-
curities with larger float (supply) or higher trading volume have less severe
search problems and correspondingly lower liquidity premia in equilibrium.
Observable related proxies of market liquidity are relative asset supplies,
traded volumes, or the return differential between assets with the same cash
flow but different liquidity characteristics (such as the yield spread between
sovereign and covered bonds used to identify the liquidity premium in the
interbank market in Schwartz, 2010, Valenzuela, 2010, and Dubecq et al.,
2013).
Given that liquidity is modelled as a transaction cost (exogenous or
endogenous), the next question is how it is priced in equilibrium. The the-
oretical literature contains several points about the pricing of liquidity that
are relevant to the choice of empirical proxies for liquidity in the interbank
market. For instance, asset specific liquidity and market liquidity are two
different concepts. Hence, the market liquidity premium is not necessarily
captured by measures of asset specific liquidity premia, which is what the
Schwartz (2010) and Valenzuela (2010) strategy implies. In standard mod-
els, deterministic differences in transaction costs (liquidity) between assets
only commands a negligible (second order) premium in equilibrium because
optimizing investors are able to allocate their portfolios to trade their liq-
uid assets while holding their illiquid assets (Constantinides 1986, Heaton
and Lucas, 1996). In contrast, market wide liquidity shocks can result in a
1Vayanos and Wang (2007) develop a search-based model of asset pricing with risk
neutral investors. Duffi e, Garleanu and Pedersen (2005) assume that there is a market
maker, while Duffi e, Garleanu and Pedersen (2007) assume that investors meet randomly
and bargain biletarally.
8
substantial liquidity premium, especially if the shocks are permanent rather
than transitory (Acharya and Pedersen, 2005).
There is also a conceptual difference between the amount of liquidity
(as measured e.g. by the volume of trade on a specific market) and the
equilibrium price of liquidity (as measured e.g. by yield differences between
two otherwise identical assets with different liquidity characteristics). In
Acharya and Pedersen (2005), the asset specific liquidity premium is higher
for assets whose illiquidity covaries positively with market illiquidity and
market return.2 The reason is that investors pay a premium for assets
that are liquid in times of low market return and vice versa; the liquidity
premium is higher for assets that are more diffi cult to sell during market
downturns. The largest component of the estimated asset specific liquidity
premium is due to the covariance between asset specific liquidity and market
returns (Acharya and Pedersen, 2005). This also indicates that the difference
between two asset specific liquidity premia may capture other factors than
market liquidity.
Hence there are several different objections to a measure of interbank
market liquidity that uses the interest differential between two bonds with
(ideally) the same cash flows but different liquidity characteristics. First,
it focuses on the bond market rather than the interbank market. Liquidity
shocks in these two markets may in fact be highly correlated, but this is
an empirical issue that remains to be studied. Second, the spread between
two bond yields captures differences in asset specific liquidity rather than
2 In contrast to the standard result, asset specific liquidity risk is priced in Acharya and
Pedersen (2005) because they assume that all assets have to be sold each period. Also,
because liquidity is stochastic, the liquid asset can be hit by a shock to the transaction
cost.
9
market liquidity. Some part of the movements in this spread may be due to
market liquidity shocks, but how much is unclear and the empirical findings
of Acharya and Pedersen (2005) imply that the bulk of an asset specific liq-
uidity premium is due to the covariance between the asset specific liquidity
shocks and market returns. Third, the yield spread between two bonds con-
cerns the equilibrium price of liquidity rather than the amount of illiquidity
in the market. Finally, the bundle of bonds covered by a sovereign govern-
ment often includes publicly owned companies with a non-zero probability
of being sold within five years, such as SBAB in the case of Sweden.3 Hence,
the premium on covered bonds may include various factors specific to such
companies. To conclude, there is reason to believe that the yield spread
between sovereign and covered bonds is a rather different animal from the
interbank market liquidity that we would like to measure.
The most common empirical measure of liquidity in empirical finance
is bid-ask spreads. For instance, a recent study by Goyenko et al. (2009)
investigates how well 24 different proxies of liquidity actually capture the de-
sired phenomenon, using bid-ask spreads as the "true" benchmark measure
of liquidity against which all other proxies are evaluated. A disadvantage
of using bid-ask spreads is that they include various technical transactions
costs that may vary for reasons that are unrelated to true liquidity. Other
frequently used measures of liquidity focus on the amount of trade, such as
the rate of turnover, the traded amount, or the number of transactions.
Data on bid-ask spreads or traded volume are rarely available in the case
of the interbank market because information about bilateral transactions be-3The Swedish state has already tried to sell SBAB twice, in 2001 and 2007-8, but
certain paragraphs concerning what will happen to outstanding bonds in case of a change
of ownership has hampered these attempts.
10
tween banks is typically not collected by any agency. Instead, two measures
of liquidity frequently encountered in empirical studies of the interbank mar-
ket are the interest rate spread between bonds with similar expected cash
flows but different liquidity characteristics that is discussed above and used
by e.g. Schwartz, 2010, and Valenzuela, 2010, and the estimated effects of
central bank liquidity injections (as in Taylor and Williams, 2009). The
idea behind the latter proxy is that the more the interbank risk premium is
reduced by central banks provisions of liquidity, the larger is the liquidity
premium. Liquidity provided by central banks is however not necessarily a
perfect substitute for genuine market liquidity and can also have signalling
effects of the opposite sign. For instance, Brunetti et al. (2011) find that
unexpected liquidity provisions by ECB during the financial crisis crowded
out privately supplied liquidity and increased market volatility by revealing
that the central bank had new private information.
Poskitt (2011) constructs two non-standard empirical proxies for inter-
bank market liquidity: Average bid-ask spreads as quoted by dealers, and
the number of dealers active in the market, using intraday quote data from
the offshore market for three month US dollar funding from the Thomson
Reuters Tick History database of SIRCA. He finds significant effects of liq-
uidity on the theoretically derived non-default (or credit) component of the
LIBOR-OIS spread.4
Turning to the availability of data on interbank market transaction vol-
ume, a first observation is that the interbank market is dominated by bilat-
eral trade and details of these transaction are rarely collected by any agency.
4Following Bank of England (2007), Poskitt calculates and deducts the theoretical
default related component of the interbank market risk premium using CDS data and
estimate the effects of liqudity etc on the remaning part of the risk premium.
11
There is a European electronic platform called e-Mid, covering 15-20 percent
of the Eurozone interbank market trade, from which various information is
recorded. Because the share of the European interbank trade covered by
e-Mid fluctuates over time and has fallen considerably since the 2007-8 fi-
nancial crisis, volume data from this source is less reliable than e.g. price
data. A specific bank can be assumed to pay approximately the same price
on transactions using this platform as through other means, but a change
in traded volume on e-Mid can be due to a change in traded volume on
the EMU interbank market or to a change in the banks’choice of trading
mode. For instance, Vento and Ganga (2009) argues that banks were more
reluctant to use e-Mid during the financial crisis because they did not want
information about their trading activities to be revealed. e-Mid data are
used by Angelini et al. (2011) and Brunetti et al (2011), but neither paper
studies liquidity or the volume of trade since these papers focus on the effects
of bank specific factors. Vento and Ganga (2009) have e-Mid transaction
data but do not use it in their empirical investigation. Michaud and Upper
(2008) calculate four different proxies for liquidity using e-Mid data: the
number of trades, trading volume, bid-ask spreads, and the average price
impact of trades, but only report eyeball econometrics of the finding that
market liquidity appears to be important to the interbank market risk pre-
mium. Heijmans et al. (2010) have a similar data set for Netherlands from
a platform called Target2, but also do not use them to study the relation-
ship between market liquidity and the interbank risk premium. The market
transaction volume is a straight forward measure of market liquidity. We
are not aware of previous empirical studies of the liquidity premium in the
interbank market using market transaction volume data.
12
3 Data
Typically, the interbank market risk premium is defined as the (cross bank
average) interbank rate minus the expected average short money market rate
as measured by the Overnight Index Swap Rate, OIS. For instance, U.S. OIS
rates are calculated based on the daily federal funds rate. Unfortunately,
such as financial instrument does not exist in Sweden. The instrument
closest to the desired measure of expected future daily policy rates is the
STINA swap, where the floating leg is the average overnight intebank rate.
Following the Riksbank, the Swedish interbank risk premium is calculated
as the STINA swap rate plus the spread between the shortest interbank rate
and the repo rate. These data are collected from Thomson Reuters.
The credit risk of domestic banks is proxied by an equally weighted
average of the credit default swap (CDS) spreads of the 4 largest Swedish
banks. These data are also collected from Thomson Reuters, as are US and
EURO zone interbank market risk premia defined as the average three month
interbank rate minus the corresponding OIS rate. Data on the deviations
from covered interest rate parity (CIP) between the EURO and the USD,
and between the SEK and the EURO, are calculated using three months
T-bill rates and matching three months currency futures. We also have data
on the implied volatility of five major international exchange rates (not
including the SEK), the Swedish stock market and the U.S. stock market.
All data are daily and collected from Thompson Reuter. The sample period
is January 2, 2007 to November 22, 2011, see Table 1 for details.
Two different measures of interbank market liquidity are investigated.
First, following Schwartz (2010) and Valenzuela (2010), we calculate the
interest rate differential between Swedish government bonds and bonds of
13
the same maturity (two years and five years) that are guaranteed or covered
by the Swedish government. This measure of market liquidity is contrasted
to the volume of transactions on the Swedish interbank market. The data
on overnight interbank market trade are based on records of loan advances
and repayments processed in the Swedish large value payment system, RIX,
managed by the Swedish Riksbank.
In the RIX-system, large value payments are recorded one by one by
the participants themselves. In that process the banks indicate the type
of transaction that the payment originates from, e.g. if the transaction is
an overnight deposit with another participant bank. The data includes all
transactions registered as an overnight deposit in the RIX-system, made
between two banks and with a maturity from one day to the next. Hence,
the transactions contain bilaterally unsecured overnight interbank deposits
between the banks members in RIX. However, to the extent that the banks’
make overnight deposits in the Riksbank in addition to the transactions
made to manage their own liquidity position, these are most likely not caught
in the data. Indicatively, such transactions are rare. In addition, the banks
also make overnight transactions in the form of repos and swaps which are
not captured in the data either. Finally, not all banks are members in the
RIX-system. Specifically, only a few foreign banks are members in RIX.5
5The following banks are members of RIX: Bankgirocentralen, Citibank, CLS Bank,
Crédit Agricole. Danske Bank. DnB NOR Bank, EMCF, Euroclear Sweden, Fortis Bank
SA/NV, Kommuninvest, Landshypotek AB, Länsförsäkringar Bank, NASDAQ OMX,
Nordea Bank, Nordnet Bank, Nykredit Bank A/S, Riksbanken, Riksgälden, Royal Bank
of Scotland, SBAB, SEB, Skandiabanken, Svensk Exportkredit, Svenska Handelsbanken,
Swedbank AB, Ålandsbanken. Banks that are not RIX members but have some activity
on the Swedish interbank market include Deutsche Bank AG, JP Morgan Chase Bank,
and UBS AG.
14
These banks instead balance their liquidity by taking overnight loans with
their correspondent banks, which are members in RIX. Such transactions
are captured only indirectly, as they affect the correspondent banks’ net
balances and thus the correspondent banks’ overnight loan requirements.
The sample period for the data on interbank market transaction volume is
July 16, 2007 to November 11, 2010.6
Several studies have shown that the deviations from covered interest
parity (CIP) are strongly correlated to the interbank market risk premium
(Grifoli and Ranaldo, 2010). We include the deviations from CIP between
the EURO and the USD as an exogenous control variable given the as-
sumption that Sweden is a small country that does not affect international
developments.
Table 1 shows descriptive statistics, sample periods and unit root tests
for all included time series. According to the ADF unit root test, the main
variables are clearly I(0): Swedish and US risk premia, traded volume in the
interbank market, international stock volatility, international exchange rate
volatility. This is an unusual finding, but our sample period is also unusually
long and covers calm periods both before and after the financial crisis. The
null hypotheses of the presence of unit roots is marginally rejected for sev-
eral other variables, including the EURO area risk premium and liquidity
measured as the spread between sovereign and covered bonds. Given the
6The Riksbank has detailed raw data on Swedish interbank market volumes contained
in one excel file for each day also after November 2010. Unfortunetaly, they have not been
willing to convert this information to time series data or grant us access to the original
files to update the data set. For the sample period that we have, the data on transaction
volumes had already been collected manually from each excel file by Riksbank staff for a
different purpose.
15
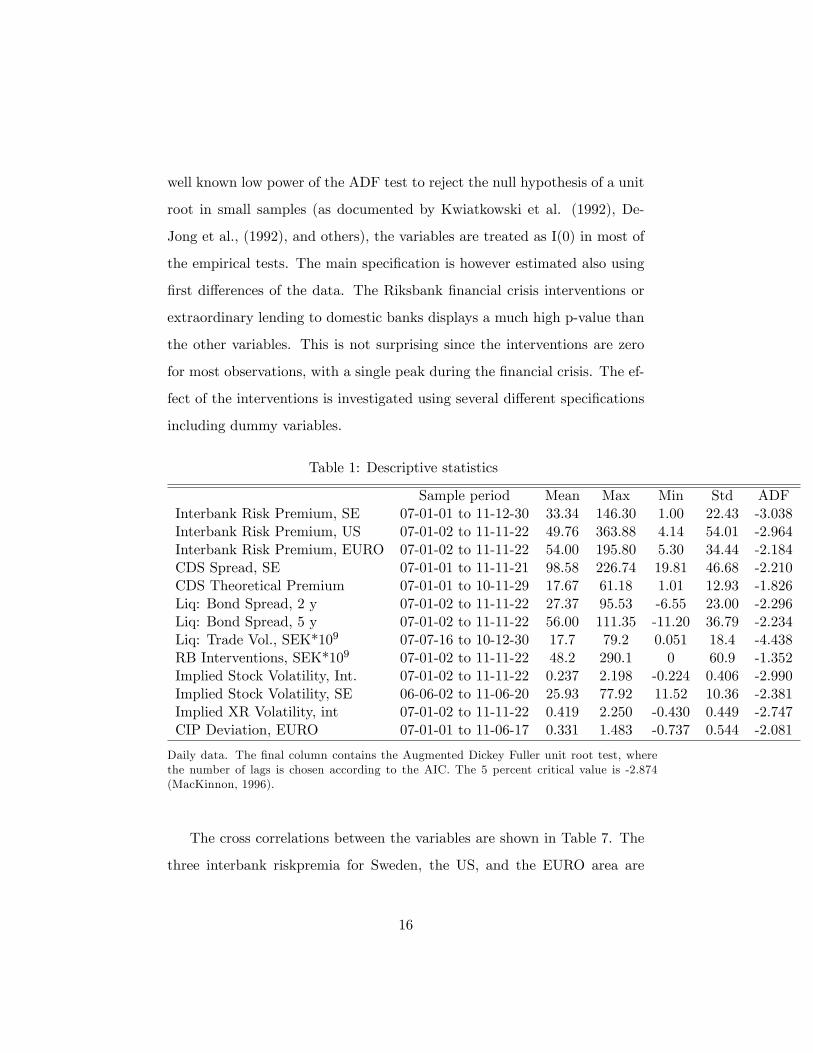
well known low power of the ADF test to reject the null hypothesis of a unit
root in small samples (as documented by Kwiatkowski et al. (1992), De-
Jong et al., (1992), and others), the variables are treated as I(0) in most of
the empirical tests. The main specification is however estimated also using
first differences of the data. The Riksbank financial crisis interventions or
extraordinary lending to domestic banks displays a much high p-value than
the other variables. This is not surprising since the interventions are zero
for most observations, with a single peak during the financial crisis. The ef-
fect of the interventions is investigated using several different specifications
including dummy variables.
Table 1: Descriptive statistics
Sample period Mean Max Min Std ADFInterbank Risk Premium, SE 07-01-01 to 11-12-30 33.34 146.30 1.00 22.43 -3.038Interbank Risk Premium, US 07-01-02 to 11-11-22 49.76 363.88 4.14 54.01 -2.964Interbank Risk Premium, EURO 07-01-02 to 11-11-22 54.00 195.80 5.30 34.44 -2.184CDS Spread, SE 07-01-01 to 11-11-21 98.58 226.74 19.81 46.68 -2.210CDS Theoretical Premium 07-01-01 to 10-11-29 17.67 61.18 1.01 12.93 -1.826Liq: Bond Spread, 2 y 07-01-02 to 11-11-22 27.37 95.53 -6.55 23.00 -2.296Liq: Bond Spread, 5 y 07-01-02 to 11-11-22 56.00 111.35 -11.20 36.79 -2.234Liq: Trade Vol., SEK*109 07-07-16 to 10-12-30 17.7 79.2 0.051 18.4 -4.438RB Interventions, SEK*109 07-01-02 to 11-11-22 48.2 290.1 0 60.9 -1.352Implied Stock Volatility, Int. 07-01-02 to 11-11-22 0.237 2.198 -0.224 0.406 -2.990Implied Stock Volatility, SE 06-06-02 to 11-06-20 25.93 77.92 11.52 10.36 -2.381Implied XR Volatility, int 07-01-02 to 11-11-22 0.419 2.250 -0.430 0.449 -2.747CIP Deviation, EURO 07-01-01 to 11-06-17 0.331 1.483 -0.737 0.544 -2.081
Daily data. The final column contains the Augmented Dickey Fuller unit root test, wherethe number of lags is chosen according to the AIC. The 5 percent critical value is -2.874(MacKinnon, 1996).
The cross correlations between the variables are shown in Table 7. The
three interbank riskpremia for Sweden, the US, and the EURO area are
16
highly correlated. Volatility measures also display correlations above 0.7
with the risk premia. Figures 1 through 5 show the variables in questions.
Liquidity measures as the yield spread between sovereign and covered bonds
display a similar pattern as the interbank market risk premia and the volatil-
ity measures, while the volume of trade on the interbank market falls during
the financial crisis and does not recover within the sample period. The
Riksbank interventions are large relative to the volume of trade between
banks.
4 Empirical results
In order to capture the effects of domestic credit risk, liquidity risk, and
central bank interventions on the Swedish interbank market risk premium,
we need to control for other factors influencing the risk premium and use
appropriate econometric techniques and instruments to avoid endogeneity.
For instance, it is not a priori clear whether higher credit risk as measure by
the CDS spread of Swedish banks result in a higher interbank market risk
premium, whether a higher risk premium results in higher CDS spreads, or
whether both variables simply react to the same international shocks. In
case of a small open economy such as Sweden, international variables can be
assumed to be exogenous. Endogeneity is obviously a problem in the case
of domestic variables and the central bank interventions in particular. The
Riksbank’s liquidity interventions may decrease the risk premium, but it is
likely that the Riksbank decides to intervene when the market risk premium
is perceived to be excessively high. In addition, all these variables react to
the same shocks. News, for instance information about the Greek haircut
negotiations halting again, are likely to affect both credit risk, market liquid-
17
ity, the Riksbank credit provisions, and the interbank market risk premium.
Hence instrumental variables are used to estimate these relationships. The
choice of instruments is discussed in some detail below, but the main princi-
ple is to use lagged variables. Current shocks do not affect lagged variables,
and a financial market shock in t+1 is by definition unpredictable given the
information available at t.
4.1 Main findings
Given data on the CDS spreads of domestic banks and liquidity, controlling
for other variables (international risk premia and international exchange
rate risk), and estimating the relationship using instrumental variables, the
estimated coeffi cients are interpreted as the effect of domestic credit risk on
the interbank market risk premium:
(1) rpSEt = β0 +∑ki=1 βiXit + εt,
where rpSEt is the Swedish interbank market risk premium and Xit is
a set of variables includes the US and EURO area interbank market risk
premia, international exchange rate risk (measured as the implicit volatility
of 5 major exchange rates, and the deviations from covered interest parity,
CIP, between the EURO and the US dollar), domestic credit risk, liquidity,
and the Riksbank interventions. The international variables can be assumed
to be unaffected by shocks to the small Swedish economy. The relationship
nevertheless has to be estimated using instrumental variable techniques since
international shocks affect both Swedish and international variables simul-
taneously.
A suitable set of instruments for estimating (1) consists of variables that
are uncorrelated with the error term and suffi ciently correlated with the
18
X-variables. From theory, the realization of financial variables in period
t should be impossible to predict using the information available at t − 1,
lagged variables are valid instruments. Given that the residuals typically
display first order autocorrelation but not higher order autocorrelation, we
use lags two and above. Table 2 reports the p-value of the J-test for overi-
dentifying restrictions and the Crabb-Donald test for instrument validity.
The latter approximately a multivariate equivalent to the F-test of the first
stage regression in a 2SLS in the univariate case. The Crabb-Donald test
falls radically when higher lags than lag three of the variables are included.
Hence the standard set of instruments in Table 2 consists of the second and
third lag of all variables in the specification in question. In case of the Riks-
bank interventions, one and two month lags are used, since the volume of
extraordinary loans to the banks is not altered on a daily basis. The ef-
fects of this variable is studied more extensively in Section 4.2. More details
about the set of instruments used in each specification are provided in the
footnotes of the tables.
Table 2 shows the main results. Interbank markets are highly integrated
across international borders and two main determinants of the Swedish in-
terbank market risk premium are the US and EURO zone interbank market
risk premia. These two variables are highly correlated (0.89) and their rela-
tive influence varies across the specifications. In column one, only interna-
tional variables are included. US and international stock volatility have been
excluded since they consistently lack significant effects on the Swedish inter-
bank market risk premium over and above the effects through US and EURO
interbank market risk premia. The Swedish interbank market appears to re-
act more than the US and EURO markets to international exchange rate
factors since both international exchange rate volatility and the deviations
19
from CIP between the EURO and the US are significant. This is consistent
with the exchange rate being more important to a small open economy than
to larger and more closed economies. In the second column of Table 2, do-
mestic variables are added to the regression. Credit risk of Swedish banks
as measured by the CDS premium, domestic liquidity measured by the yield
spread between sovereign and covered bonds, and the implicit volatility of
Swedish stocks are estimated with negative, insignificant coeffi cients. Hence
these domestic variables that are available for the full sample do not appear
to have independent effects on the Swedish interbank market risk premium.
Columns three and four includes the traded volume on the interbank
market for the shorter sample period for which this variable is available.
Traded volume in the interbank market is expected to be negatively related
to the risk premium and this parameter is significant. Section 4.2 shows
that this finding is reasonably robust, but also that it is possible to find
specifications where the volume of trade does not have a significant negative
effect on the interbank market risk premium.
The final column contains standardized coeffi cients, where all variables
have been divided by their standard deviations. This results in coeffi cients
of comparable sizes in the sense that the relative importance of the different
variables for movements in the Swedish interbank market risk premium is
captured. The relative sizes of the unstandardized variables do not cap-
ture how important the variables are, since the variables are measured in
different units and have different variances. For instance, judging from the
non-standardized coeffi cients in column two, one would conclude that the
Eurozone risk premium is more important to the Swedish risk premium, be-
cause its estimated effect is larger. However, even though all riskpremia are
measured in the same unit (basis points, annualized), the US risk premium
20
has a much larger variance and therefore accounts for more of the variation
in the Swedish risk premium. Traded volume and the amount of Riksbank
lending to banks is measured in SEK, which renders an evaluation of the
relative importance of the variables based on estimated coeffi cients that
are not standardized even more hazardous. The final column shows that
the US risk premium is the most important determinant of the Swedish
interbank market risk premium, followed by the implicit volatility of inter-
national exchange rates, the EURO/USD deviations from CIP, the covered
bonds spread (although the estimated effect is negative and insignificant),
interbank market transactions volume, Swedish CDS premium and then the
EURO interbank market risk premium.
During the financial crisis in 2009, many central banks attempted to al-
leviate the credit crunch and keep the financial markets functioning. The
Riksbank initiated major interventions (lending to domestic banks) in Oc-
tober 2008 and phased these loans out during 2010. As discussed above,
we have data set covering the daily volume of credit (loans) from the Riks-
bank to domestic banks. This amount peaked at 300 000 000 000 SEK or
40 percent of GDP in July 2009. The robustness of this finding is investi-
gated in Section 4.2. Since the unit of measurement is millions of SEK, the
magnitude of the effect of the interventions on the interbank market risk
premium is rather modest, around 50 basis points or 0.5 percent when the
interventions peaked in July 2009.
21
4.2 Robustness of the effectiveness of the Riksbank’s inter-
ventions
According to the main findings in Section c, the credit provisions by the
Riksbank to domestic banks are associated with a significant reduction of
the interbank market risk premium. Table 3 shows two types of robustness
tests of the effects of the interventions. First, the interventions variable
is defined in different ways: as a continuos variable simply measuring the
amount lent to the banks each day, and as a discrete dummy variable taking
the value 1.0 when a positive amount is lent to the market.
The fact that this type of interventions where the central bank provides
liquidity to the interbank market has significant effects on the risk premium
is often taken as evidence of a market liquidity premium. For instance,
Fukuda’s (2011) conclusion that the effects of market liquidity are currency
specific is based on the size and significance of the effects of central bank
liquidity injections.
4.3 Comparing the two liquidity measures
The two measures of market liquidity used in this paper are (i) relative
returns to a more liquid and a less liquid bonds with (ideally) the same
expected payoffs and (ii) turnover (traded volume) on the interbank market.
As shown in Table 7, they have a correlation of -0.22. The negative sign
is expected since a high premium on the illiquid bond signifies a negative
liquidity shock, as does low traded volume on the interbank market. This
correlation is however low and insignificant. It is also clear from Table 7
that the interest rate spread between covered bond sovereign bonds displays
higher correlations with measures of credit risk (CDS spreads) and domestic
22
as well as international financial market risk than the transaction volume
data. The correlation coeffi cients range between 0.67 and 0.8 in the former
case and between 0.04 and 0.4 for transaction volume data.
Tables 4 and 5 show various specifications including the two liquidity
measures as more and more control variables are added. Traded volume
consistently enters with the expected negative sign, but is statistically sig-
nificant only in about half of the cases. The covered bond spread has neg-
ative coeffi cients in 3 out of 8 cases and is positive and significant in two
specifications. It is also highly collinear with the other variables in the re-
gressions as indicated by the VIF measure of collinearity. Hence liquidity
as measured by traded volume in the interbank market has expected effects
on the interbank market risk premium, while liquidity as measured by the
spread between covered and sovereign bonds typically has estimated effects
of the opposite sign. Only two coeffi cients in Table 5 has the expected posi-
tive significant coeffi cients, and these are the first two specifications with no
control variables and only the EURO interbank market risk premium. The
final column of Table 5 shows the results from replacing the original data
on the yield spread between covered and sovereign bonds by a measure of
liquidity risk which is orthogonal to credit risk as measured by CDS spreads.
The results are however not affected as this orthogonal measure of liquidity
still enters with a significant negative sign rather than the expected positive
coeffi cient.
4.4 Domestic credit risk
As evident from Table 3, the Swedish interbank market risk premium is
mainly determined by international variables. The credit risk of domestic
23
banks is one of the domestic variables that could be expected to influence
it, but the estimated coeffi cients in the main results presented in Table 3
are all negative and insignificant. This result is somewhat surprising, but
not unique. Several previous studies have documented significant effects of
credit risk measured as domestic bank credit default spreads on the inter-
bank risk premium (Taylor and Williams, 2009, Fukuda 2011, ). However,
Michaud and Upper (2008) find a statistically and economically insignifi-
cant coeffi cient on CDS spreads on interbank risk premia in a very thorough
study of a cross section of banks. In addition, Angelini et al (2011) document
insignificant effects of observable measures of borrower banks’creditworthi-
ness.
When the robustness exercise above is repeated for this variable the CDS
premium actually has a positive significant effect on the interbank risk pre-
mium in several specification with only few control variables. These results
are shown in Table 6. In columns one to three, the only included control
variables are international interbank risk premia. This results in positive
significant estimates of the effect of domestic credit risk. Significance is
then lost as more variables are included in columns four and five. Adding
Swedish variables but excluding liquidity measured as the spread between
covered and sovereign bonds still yields positive estimated coeffi cients. The
final column shows that including this spread yields a negative coeffi cient.
Throughout the rest of the paper, a total of twelve specifications with full
sets of control variables yield negative estimated coeffi cients on the CDS
spread in six cases and the expected positive significant coeffi cient only in
one single case.
Given that the CDS spread itself is theoretically expected to have a
non-linear effect on the interbank market risk premium while the estimated
24
model is linear, we also calculate the theoretical credit premium from CDS
data (following Bank of England, 2007). This transformed variable should
have a linear relationship to the interbank market risk premium. As shown
in column four, this measure of credit risk still enters with a negative and
insignificant coeffi cient. Hence there is little evidence that the credit risk
of domestic banks affect the Swedish interbank market risk premium once
other variables are included.
5 Conclusions
Analyzing the interbank market risk premium is important for several rea-
sons. The recent surge in attention is mainly due to the exploding risk
premium on the interbank market during the financial crisis, as the result-
ing wedge between policy rates and the interest rates paid by consumers and
investors hampered the expansionary stance of monetary policy. Many cen-
tral banks tried to lower the interbank market risk premium using various
forms of liquidity provision. The effi cacy of such measure depends (among
other things) on the extent to which movements in the interbank market
risk premium are driven by illiquidity. There is a sizable but inconclusive
literature on the relative importance of credit risk versus liquidity risk in
the determination of interbank market risk premia. Different studies use
different methods for separating the effects of liquidity from the effects of
credit risk. Bank of England (2007) and Poskitt (2011) use credit default
spreads as proxy for the credit risk component of the risk premium. Other
studies estimate the effects of liquidity and/or credit risk using various prox-
ies to identify these two components. Finding relevant proxies for interbank
market liquidity is however diffi cult. The most common measure is the
25
interest rate spread between similar bonds with different liquidity charac-
teristics. This actually captures the difference between two asset specific
liquidity premia, which according to the liquidity augmented consumption
capital asset pricing model of Acharya and Pedersen (2005) is a function of
the covariance between asset specific liquidity shocks and market returns.
In this paper we use actual interbank market transaction volume data
collected by the Riksbank to measure interbank market liquidity. We find
that the transaction volume has a reasonably robust negative effect on the
interbank market risk premium. In contrast, the estimated effects of the
interest differential between similar bonds with different liquidity character-
istics are negative in most specifications, implying that a higher liquidity
premium on covered bonds relative to sovereign bonds is associated with a
lower risk premium.
Domestic credit risk as measured by the credit default spread of do-
mestic bank does not have a significant effect on the interbank market risk
premium in the benchmark specifications (this result is however not fully
robust). Instead, the main determinants of the Swedish interbank market
risk premium are international variables. Using standardized coeffi cients, it
turns out that the US interbank risk premium is the single most influen-
tial factor. Furthermore, international exchange rate risk measured as the
implicit volatility of major exchange rates has a large influence over and
above the effects through the interbank market risk premia in the major
countries. Hence the small open Swedish economy appears to be more sen-
sitive to exchange rate risk or the factors determining exchange rate risk
than the larger and less open US and EURO zone economies. The sam-
ple period includes the international financial crisis of 2008-2009 and the
European debt crisis in 2011, when the domestic shocks generated by the
26
Swedish economy or Swedish financial markets were relatively minor. Hence
domestic factors could well have a larger influence during periods with more
domestic disturbances.
Finally we study the effi cacy of the Riksbank’s interventions in the in-
terbank market. Using data on the amount of credit provided to Swedish
banks during the financial crisis, we find that the Riksbank was able to re-
duce the interbank market risk premium significantly. The effect of liquidity
provided by the Riksbank does not differ significantly in magnitude from the
effect of "genuine" market liquidity measured as increased transactions be-
tween banks. Finding relevant and valid instruments for the interventions
is obviously troublesome. We use very long lags to instrument for the level
of the Riksbank interventions. The endogeneity bias would generate a pos-
itive coeffi cient rather than the documented negative effect here, given that
the Riksbank intervenes in times when the interbank market risk premium
is high. The maximum effect of the Riksbank interventions in July 2009 is
estimated to between 50 and 72 basis points or 0.5 to 0.72 percentage points.
It hence appears that a considerable part of the interbank market risk
premium is due to variations in market liquidity. Furthermore, central bank
liquidity provisions have a significant but rather small effect on the risk
premium.
References
Amihud, Y. and Mendelson, H., (1980), "Dealership Market: Market-Making
with Inventory", Journal of Financial Economics 8, 31-53.
Angelini et al. (2011),"The interbank market after August 2007: What
has changed, and Why?", Journal of Money, Credit and Banking 43(5),
27
923-958.
Acharya, V. and Pedersen, L., (2005), "Asset Pricing with Liquidity
Risk", Journal of Financial Economics, 77, 375-410.
Baba, N. and Packer, F., (2009), "From Turmoil to Crisis: Dislocation in
the FX Swap Market Before and After the Failure of the Lehman Brothers",
BIS Working Papers 285.
Bank of England, 2007. "An indicative decomposition of Libor spreads",
in Markets and operations, Quarterly Bulletin, 490-510.
Brunetti, C., Filippo, M., and Harris, J., (2011), "Effects of Central
Bank intervention on the interbank market during the Subprime crisis",
The Review of Financial Studies 24(6), 2053-2083.
Constantinides, G., (1986), "Capital market equilibrium with transac-
tion costs," Journal of Political Economy 94(4), 842-862.
DeJong, D, Nankervis, J., Savin, N. E. and Whiteman, C, (1992), "Inte-
gration versus trend stationarity in time series", Econometrica 60(2), 423-
433.
Dubecq, S., Monfort, A., Renne, J., and Rousellett, G., (2013), "Credit
and Liquidity in Interbank Rates: a Quadratic Approach", Bank de France
Working Paper no 446.
Duffi e, D., Garleanu, N. and Pedersen, L., (2005), "Over-the-Counter
Markets", Econometrica 73(6), 1815-1847.
Duffi e, D., Garleanu, N. and Pedersen, L.,(2007), "Valuation in Over-
the-Countermarkets", The Review of Financial Studies 20(5), 1865-1900.
Fukuda, S., (2011), "Market-specific and currency-specific risk during
the global financial crisis: Evidence from the interbank markets in Tokyo
and London", NBER Working Paper 16962.
Glosten, L., and Milgrom, P., (1985), "Bid, Ask, and Transaction Prices
28
in a Specialist Market with Heterogenously Informed Traders", Journal of
Financial Economics 14, 71-100.
Goyenko, R., Holden, C., and Trzinka, C., (2009), "Do liquidity measures
measure liquidity?"Journal of Financial Economics 92, 153—181.
Grifoli, T., and Ranaldo, A., (2010), "Limits to Arbitrage During the
Crisis: Funding Liquidity Constraints and Covered Interest Parity", Swiss
National Bank Working Papers 2010-14.
Heaton J., and Lucas, D, (1996)"Evaluating the effects of incomplete
markets on risk sharing and asset Pricing.", Journal of Political Economy
104(3), 443-487.
Heijmans, R., Heuver, R., and Walraven, D., (2010), "Monitoring the
unsecured interbank money market using TARGET2 data", DNB Working
Paper 276.
Korajczyk, R., and Sadka, R., (2008), "Pricing the commonality across
alternative measures of liquidity", Journal of Financial Economics 87(1),
45—72.
Kyle, A., 1985, \Continuous Auctions and Insider Trading," Economet-
rica, 53, 1315-1335.
Kwiatkowski, D, Phillips, P., Schmidt, P., and Shin, Y., (1992), "Testing
the null hypothesis of stationarity against the alternative of a unit root:
How sure are we that economic time series have a unit root?", Journal of
Econometrics 54, 159-178.
Michaud, F. and Upper, C., (2008), "What drives interbank rates? Evi-
dence from the Libor panel", BIS Quarterly Review, 47-58.
Poskitt, R., (2011), "Do liquidity or credit effects explain the behavior
of the LIBOR-OIS spread?", Mimeo
Schwartz, K., (2010), "Mind the Gap: Disentangling Credit and Liquid-
29
ity in Risk Spreads", University of Pennsylvania Wharton School of Busi-
ness, Working Paper.
Taylor, J., and Williams, J., (2009) "A Black Swan in the Money Mar-
ket", American Economic Journal: Macroeconomics, 1(1): 58—83.
Valenzuela, P., (2010), "Rollover Risk and Corporate Bond Spreads",
Mimeo.
Vayanos, D., and Wang, T., (2007), "Search and endogenous concen-
tration of liquidity in asset markets", Journal of economic theory 136(1),
66-104.
Vayanos, D., and Weill, P., 2008. "A Search-Based Theory of the On-
the-Run Phenomenon," Journal of Finance, American Finance Association
63, 1361-1398.
Vento, G., and Ganga, P., (2009), "Interbank market and liquidity dis-
tribution during the Great Financial Crisis: The e-Mid Case", Journal of
Money, Investment and Banking 18, 68-94.
30
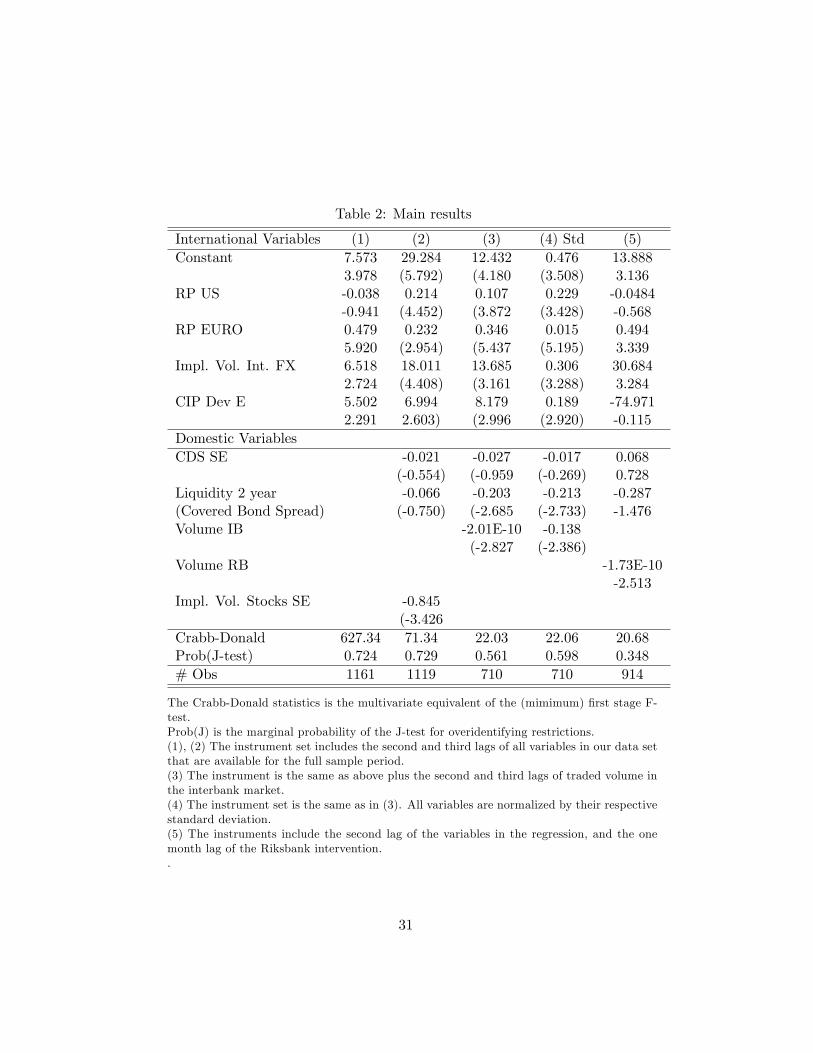
Table 2: Main results
International Variables (1) (2) (3) (4) Std (5)Constant 7.573 29.284 12.432 0.476 13.888
3.978 (5.792) (4.180 (3.508) 3.136RP US -0.038 0.214 0.107 0.229 -0.0484
-0.941 (4.452) (3.872 (3.428) -0.568RP EURO 0.479 0.232 0.346 0.015 0.494
5.920 (2.954) (5.437 (5.195) 3.339Impl. Vol. Int. FX 6.518 18.011 13.685 0.306 30.684
2.724 (4.408) (3.161 (3.288) 3.284CIP Dev E 5.502 6.994 8.179 0.189 -74.971
2.291 2.603) (2.996 (2.920) -0.115Domestic VariablesCDS SE -0.021 -0.027 -0.017 0.068
(-0.554) (-0.959 (-0.269) 0.728Liquidity 2 year -0.066 -0.203 -0.213 -0.287(Covered Bond Spread) (-0.750) (-2.685 (-2.733) -1.476Volume IB -2.01E-10 -0.138
(-2.827 (-2.386)Volume RB -1.73E-10
-2.513Impl. Vol. Stocks SE -0.845
(-3.426Crabb-Donald 627.34 71.34 22.03 22.06 20.68Prob(J-test) 0.724 0.729 0.561 0.598 0.348# Obs 1161 1119 710 710 914
The Crabb-Donald statistics is the multivariate equivalent of the (mimimum) first stage F-test.Prob(J) is the marginal probability of the J-test for overidentifying restrictions.(1), (2) The instrument set includes the second and third lags of all variables in our data setthat are available for the full sample period.(3) The instrument is the same as above plus the second and third lags of traded volume inthe interbank market.(4) The instrument set is the same as in (3). All variables are normalized by their respectivestandard deviation.(5) The instruments include the second lag of the variables in the regression, and the onemonth lag of the Riksbank intervention..
31
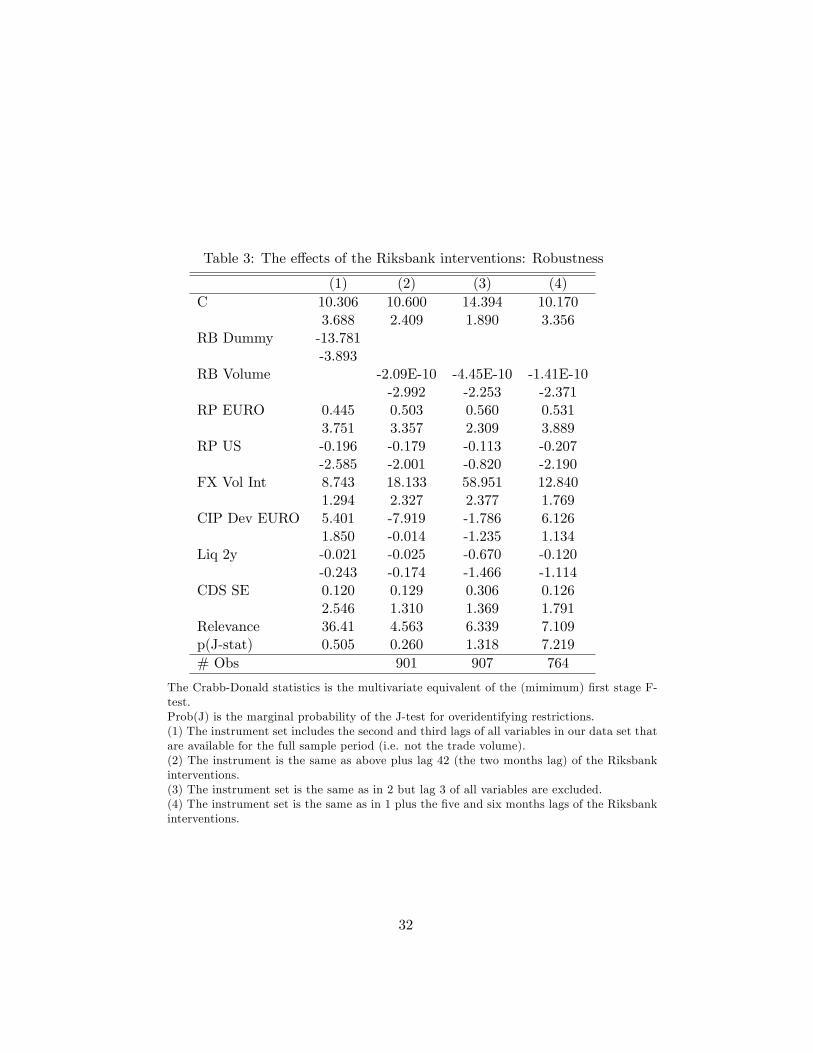
Table 3: The effects of the Riksbank interventions: Robustness
(1) (2) (3) (4)C 10.306 10.600 14.394 10.170
3.688 2.409 1.890 3.356RB Dummy -13.781
-3.893RB Volume -2.09E-10 -4.45E-10 -1.41E-10
-2.992 -2.253 -2.371RP EURO 0.445 0.503 0.560 0.531
3.751 3.357 2.309 3.889RP US -0.196 -0.179 -0.113 -0.207
-2.585 -2.001 -0.820 -2.190FX Vol Int 8.743 18.133 58.951 12.840
1.294 2.327 2.377 1.769CIP Dev EURO 5.401 -7.919 -1.786 6.126
1.850 -0.014 -1.235 1.134Liq 2y -0.021 -0.025 -0.670 -0.120
-0.243 -0.174 -1.466 -1.114CDS SE 0.120 0.129 0.306 0.126
2.546 1.310 1.369 1.791Relevance 36.41 4.563 6.339 7.109p(J-stat) 0.505 0.260 1.318 7.219# Obs 901 907 764
The Crabb-Donald statistics is the multivariate equivalent of the (mimimum) first stage F-test.Prob(J) is the marginal probability of the J-test for overidentifying restrictions.(1) The instrument set includes the second and third lags of all variables in our data set thatare available for the full sample period (i.e. not the trade volume).(2) The instrument is the same as above plus lag 42 (the two months lag) of the Riksbankinterventions.(3) The instrument set is the same as in 2 but lag 3 of all variables are excluded.(4) The instrument set is the same as in 1 plus the five and six months lags of the Riksbankinterventions.
32
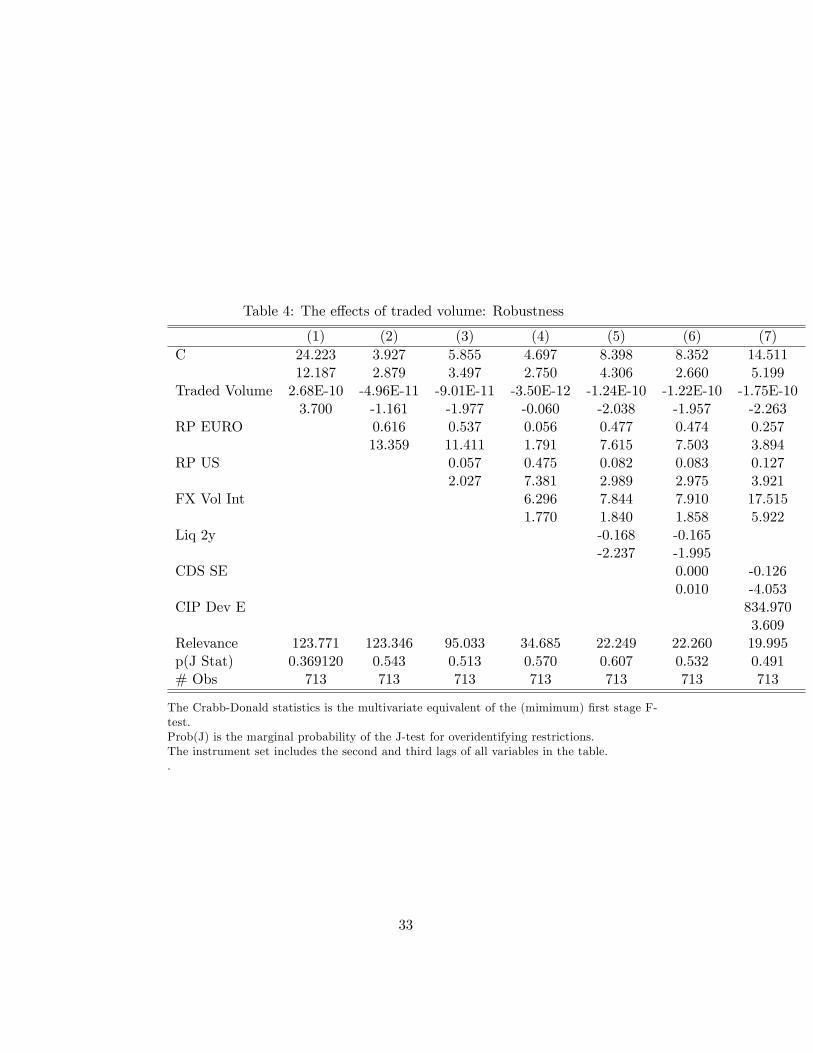
Table 4: The effects of traded volume: Robustness
(1) (2) (3) (4) (5) (6) (7)C 24.223 3.927 5.855 4.697 8.398 8.352 14.511
12.187 2.879 3.497 2.750 4.306 2.660 5.199Traded Volume 2.68E-10 -4.96E-11 -9.01E-11 -3.50E-12 -1.24E-10 -1.22E-10 -1.75E-10
3.700 -1.161 -1.977 -0.060 -2.038 -1.957 -2.263RP EURO 0.616 0.537 0.056 0.477 0.474 0.257
13.359 11.411 1.791 7.615 7.503 3.894RP US 0.057 0.475 0.082 0.083 0.127
2.027 7.381 2.989 2.975 3.921FX Vol Int 6.296 7.844 7.910 17.515
1.770 1.840 1.858 5.922Liq 2y -0.168 -0.165
-2.237 -1.995CDS SE 0.000 -0.126
0.010 -4.053CIP Dev E 834.970
3.609Relevance 123.771 123.346 95.033 34.685 22.249 22.260 19.995p(J Stat) 0.369120 0.543 0.513 0.570 0.607 0.532 0.491# Obs 713 713 713 713 713 713 713
The Crabb-Donald statistics is the multivariate equivalent of the (mimimum) first stage F-test.Prob(J) is the marginal probability of the J-test for overidentifying restrictions.The instrument set includes the second and third lags of all variables in the table..
33
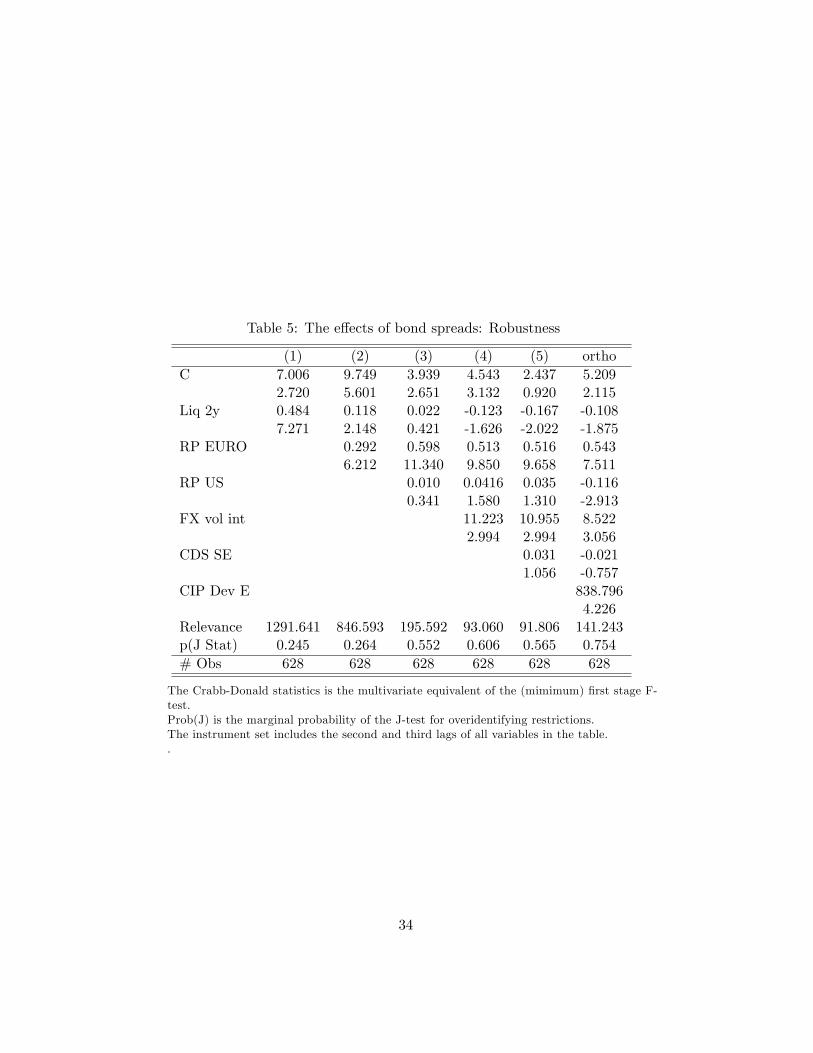
Table 5: The effects of bond spreads: Robustness
(1) (2) (3) (4) (5) orthoC 7.006 9.749 3.939 4.543 2.437 5.209
2.720 5.601 2.651 3.132 0.920 2.115Liq 2y 0.484 0.118 0.022 -0.123 -0.167 -0.108
7.271 2.148 0.421 -1.626 -2.022 -1.875RP EURO 0.292 0.598 0.513 0.516 0.543
6.212 11.340 9.850 9.658 7.511RP US 0.010 0.0416 0.035 -0.116
0.341 1.580 1.310 -2.913FX vol int 11.223 10.955 8.522
2.994 2.994 3.056CDS SE 0.031 -0.021
1.056 -0.757CIP Dev E 838.796
4.226Relevance 1291.641 846.593 195.592 93.060 91.806 141.243p(J Stat) 0.245 0.264 0.552 0.606 0.565 0.754# Obs 628 628 628 628 628 628
The Crabb-Donald statistics is the multivariate equivalent of the (mimimum) first stage F-test.Prob(J) is the marginal probability of the J-test for overidentifying restrictions.The instrument set includes the second and third lags of all variables in the table..
34
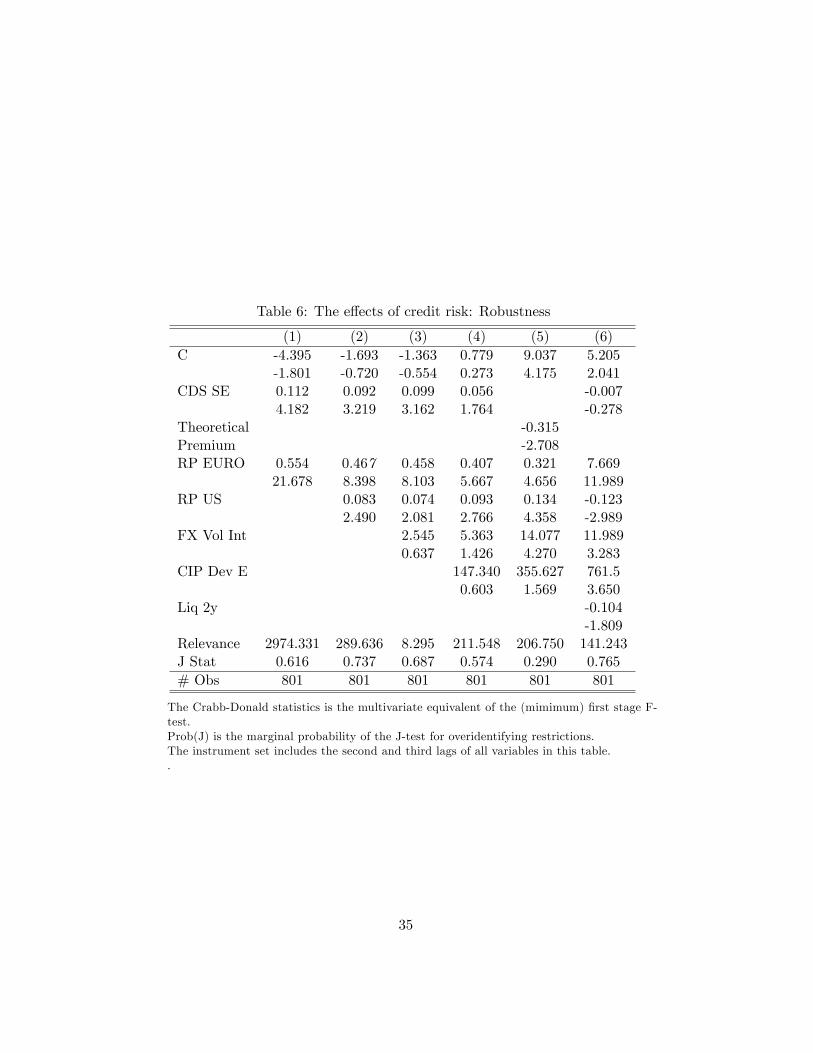
Table 6: The effects of credit risk: Robustness
(1) (2) (3) (4) (5) (6)C -4.395 -1.693 -1.363 0.779 9.037 5.205
-1.801 -0.720 -0.554 0.273 4.175 2.041CDS SE 0.112 0.092 0.099 0.056 -0.007
4.182 3.219 3.162 1.764 -0.278Theoretical -0.315Premium -2.708RP EURO 0.554 0.467 0.458 0.407 0.321 7.669
21.678 8.398 8.103 5.667 4.656 11.989RP US 0.083 0.074 0.093 0.134 -0.123
2.490 2.081 2.766 4.358 -2.989FX Vol Int 2.545 5.363 14.077 11.989
0.637 1.426 4.270 3.283CIP Dev E 147.340 355.627 761.5
0.603 1.569 3.650Liq 2y -0.104
-1.809Relevance 2974.331 289.636 8.295 211.548 206.750 141.243J Stat 0.616 0.737 0.687 0.574 0.290 0.765# Obs 801 801 801 801 801 801
The Crabb-Donald statistics is the multivariate equivalent of the (mimimum) first stage F-test.Prob(J) is the marginal probability of the J-test for overidentifying restrictions.The instrument set includes the second and third lags of all variables in this table..
35
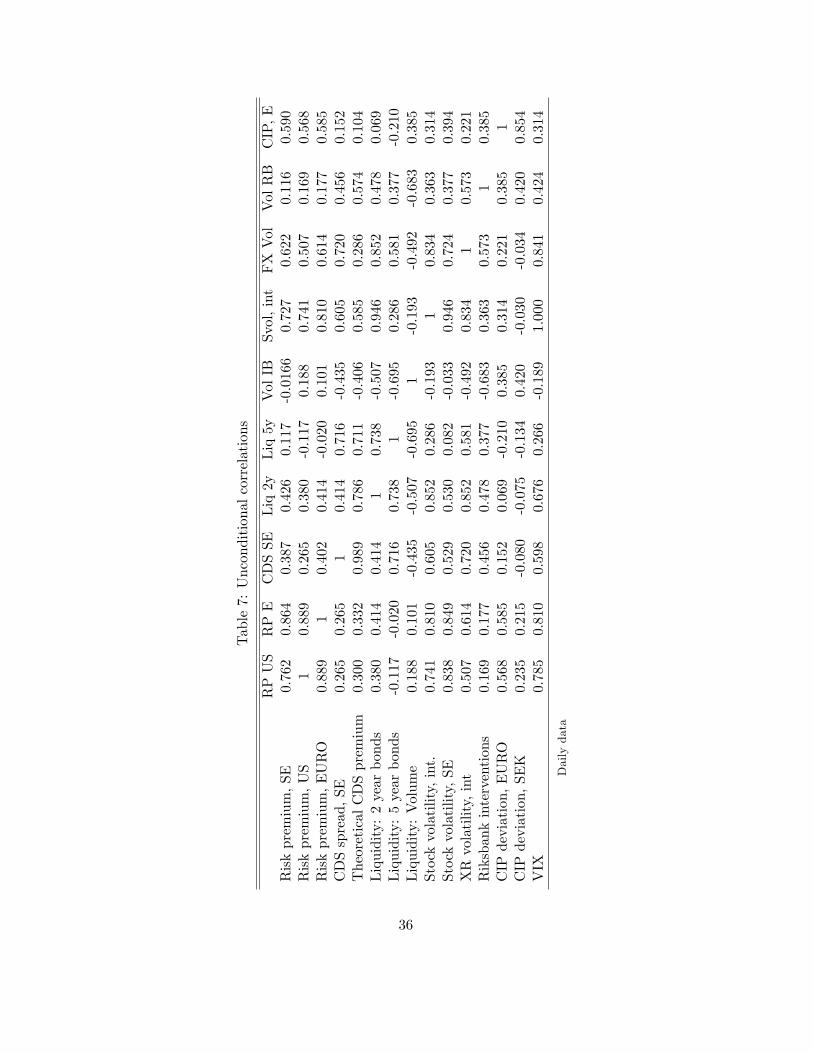
Table7:Unconditionalcorrelations
RPUS
RPE
CDSSE
Liq2y
Liq5y
VolIB
Svol,intFXVol
VolRB
CIP,E
Riskpremium,SE
0.762
0.864
0.387
0.426
0.117
-0.0166
0.727
0.622
0.116
0.590
Riskpremium,US
10.889
0.265
0.380
-0.117
0.188
0.741
0.507
0.169
0.568
Riskpremium,EURO
0.889
10.402
0.414
-0.020
0.101
0.810
0.614
0.177
0.585
CDSspread,SE
0.265
0.265
10.414
0.716
-0.435
0.605
0.720
0.456
0.152
TheoreticalCDSpremium
0.300
0.332
0.989
0.786
0.711
-0.406
0.585
0.286
0.574
0.104
Liquidity:2yearbonds
0.380
0.414
0.414
10.738
-0.507
0.946
0.852
0.478
0.069
Liquidity:5yearbonds
-0.117
-0.020
0.716
0.738
1-0.695
0.286
0.581
0.377
-0.210
Liquidity:Volume
0.188
0.101
-0.435
-0.507
-0.695
1-0.193
-0.492
-0.683
0.385
Stockvolatility,int.
0.741
0.810
0.605
0.852
0.286
-0.193
10.834
0.363
0.314
Stockvolatility,SE
0.838
0.849
0.529
0.530
0.082
-0.033
0.946
0.724
0.377
0.394
XRvolatility,int
0.507
0.614
0.720
0.852
0.581
-0.492
0.834
10.573
0.221
Riksbankinterventions
0.169
0.177
0.456
0.478
0.377
-0.683
0.363
0.573
10.385
CIPdeviation,EURO
0.568
0.585
0.152
0.069
-0.210
0.385
0.314
0.221
0.385
1CIPdeviation,SEK
0.235
0.215
-0.080
-0.075
-0.134
0.420
-0.030
-0.034
0.420
0.854
VIX
0.785
0.810
0.598
0.676
0.266
-0.189
1.000
0.841
0.424
0.314
Dailydata
36