Embed Size (px)
Citation preview
Does group affiliation affect the interbank market exposure?
Evidence from the main European banking groups*
by
Lucia Gibilaro
Lecturer in Economics and Management of Financial Intermediaries
University of Bergamo – School of Economics
Via dei Caniana 2 – 24127 Bergamo
e-mail: [email protected]
Tel +390352052675
Fax +390352052549
and
Gianluca Mattarocci
(corresponding author)
Lecturer in Economics and Management of Financial Intermediaries
University of Rome “Tor Vergata” – School of Economics
Via Columbia 2 – 00133 Rome
e-mail: [email protected]
Tel. +390672595931
Fax +39062040219
1
Does group affiliation affect the interbank market exposure? Evidence from the main
European banking groups
Abstract
The interbank market represents a possible opportunity for investment and a source of capital for
the entire banking system, and the usefulness of the market depends on the characteristics of the
bank and the credit market price dynamics.
The banking group affiliation could also affect both the asset and liability side of the interbank
exposure of the bank because of the strict relationship between all of the group’s members.
Considering a representative sample of all of the main European banks, we study the relationship
between the asset side, the liability side and the net exposure of these groups with respect to the
bank characteristics, the market dynamics and the group structure characteristics. The results
demonstrate that the group features significantly affect the interbank exposure, even if some of
the group characteristics increase or lose their relevance during the financial crisis.
JEL classification: G21, G15, G32
Keywords: Banking group, Interbank market, Intragroup relationship
1. Introduction
To overcome liquidity shocks, banks rely on relationships (Cocco et al., 2007): they can
diversify away liquidity shocks by developing bilateral lending relationships with other banks
2
(Upper and Worms, 2004), while corporate relationships arising from takeovers among banks are
intended to diversify away liquidity shocks inside the banking group (Focarelli et al., 2002).
The interbank market depends on financial contracts among banks: the banks’ role and strategies
to satisfy liquidity needs in the interbank market can be affected by the firm characteristics, such
as the control, the market segment and the size (Cajueiro and Tabak, 2008). For banks affiliated
with banking groups, the liquidity management is virtually centralized (Schinasi and Teixera,
2006), and lacking regulatory constraints, it can be considered fungible inside the banking group
(Cumming and Hirtle, 2001). The liquidity needs of a group member are a function of the
correlation between the cash flows of the group entities (D’Souza and Lai, 2006). Therefore, the
liquidity needs of the group are affected by the possible synergies existing among its members
(Vander Vennet, 2002).
In light of the relevance of the interbank transmission of liquidity among banking groups (Cabral
et al., 2002) and the impact of asset size on interbank market lending (European Central Bank,
2010), this paper studies the interbank market exposure of the main European banking groups for
the 2005–2010 time frame. At the aggregate group level, the paper tests a hypothesis about the
role of banking group features in explaining the interbank exposure of the banking groups. For
each banking group, we examine the credit both offered and obtained in the interbank market in
each year, and we study their relationship with the balance sheet indexes, the credit market
dinamycs and the group features. The results demonstrate that the interbank exposure is
significantly affected by the group characteristics, and during a financial crisis, the role of the
bank features changes because of the different strategies adopted by banking groups to overcome
the effect of the crisis.
3
In this paper we present a literature review about the firm-specific factors that affect access to the
interbank market by banks and we discuss the rationale of group structure relevance in using the
interbank market to overcome liquidity shocks (section 2). After a brief description of the sample
(section 3.1), we present a methodology for testing the relevance of group features, market
dynamics and bank characteristics in accessing the interbank market (section 3.2). Results about
the lending activity, the borrowing activity and the net interbank position are presented
separately with respect to the determinants of their value (section 3.3). The last section
summarizes the conclusions and the implication of the results (section 4).
2. Literature review Banks access the interbank market to satisfy their liquidity needs because of the risk of liquidity
shortages arising from the uncertainty both in the location (Freixas et al., 2000) and the time of
consumption (Allen and Gale, 2000). Banks can diversify away liquidity shocks by developing
bilateral lending relationships with other banks (Upper and Worms, 2004), while takeovers
among banks are intended to diversify away liquidity shocks inside the banking group (Focarelli
et al., 2002).
Both market and firm-specific factors influence the liquidity risk exposure (Bangia et al., 1999)
and the price of liquidity (Fecht et al., 2010): the banks’ roles and strategies to satisfy liquidity
needs in the interbank market can be affected by the firm characteristics, such as the control, the
market segment and the size (Cajueiro and Tabak, 2008).
For privately controlled firms, access to the interbank market to adjust the liquidity position is
affected by the type of firm ownership: the liquidity needs of the group member are affected by
the correlation between the cash flows of the group entities (D’Souza and Lai, 2006). In fact, the
4
structure of a group enables it to operate in different sectors by flexibly exploiting the possible
synergies existing among its members (Vander Vennet, 2002), even though this advantage is
countered for large groups by a potential increase in the risk level because of the increase in the
leverage and the decrease in the capital ratios (Demsetz and Strahan, 1997). Lacking regulatory
constraints, liquidity can be considered fungible inside the banking group (Cumming and Hirtle,
2001); therefore, the liquidity management is virtually centralized for the firm as a whole
(Schinasi and Teixera, 2006), and resources are allocated to the business units through a system
of internal transfer rates (Matz and Neu, 2007). The centralization of the liquidity risk
management is motivated by the fostering of efficiency through the reduction of funding costs,
the opportunity of funding diversification and the feasibility of moving collateral and funds
among the business units (Joint Forum, 2006). To overcome the disadvantages in accessing
liquidity due to their limited size (Ehrmann and Worms, 2004), savings and cooperative banks
can create group networks, in which a head institution or more second-level institutions hold
liquidity reserves and coordinate the reallocation of liquidity among the members (Mazzillis and
Schena, 2001). Nevertheless, cross-border issues encourage the management of liquidity at the
local level, even though the group must centrally oversee the liquidity management, irrespective
of the level of decentralization implemented (Institute of International Finance, 2006).
While liquidity risk depends primarily on retail deposits (Ho and Saunders, 1985) because
depositors are enabled to withdraw at low cost (Diamond and Rajan, 2001), the market segment
affects the liquidity creation by banks (Berger and Bouwman, 2009). Retail banks that take on
demand deposits and that offer loan commitments more frequently access the unsecured
interbank market to hold higher liquid buffers that can be mitigated if a less-than-perfect
5
correlation holds (Kashyap et al., 2002). For banks focused on investment activity, short-term
collateralized borrowing is more relevant to satisfy their liquidity needs (Adrian and Shin, 2008).
The size affects the attitude of the bank toward wholesale funding, including the access
opportunity (Allen et al., 1989) and the price of the funds obtained (Nyborget al., 2002). The size
matters because of economy of scope and scale: as it concerns the liquidity, a large bank has
better access to the interbank markets, for example, because it has a larger network of regular
counterparties, particularly in the case of banks labeled “too big to fail”, or because it has a wider
range of collateral to satisfy liquidity needs through the secured market (Fecht et al., 2010).
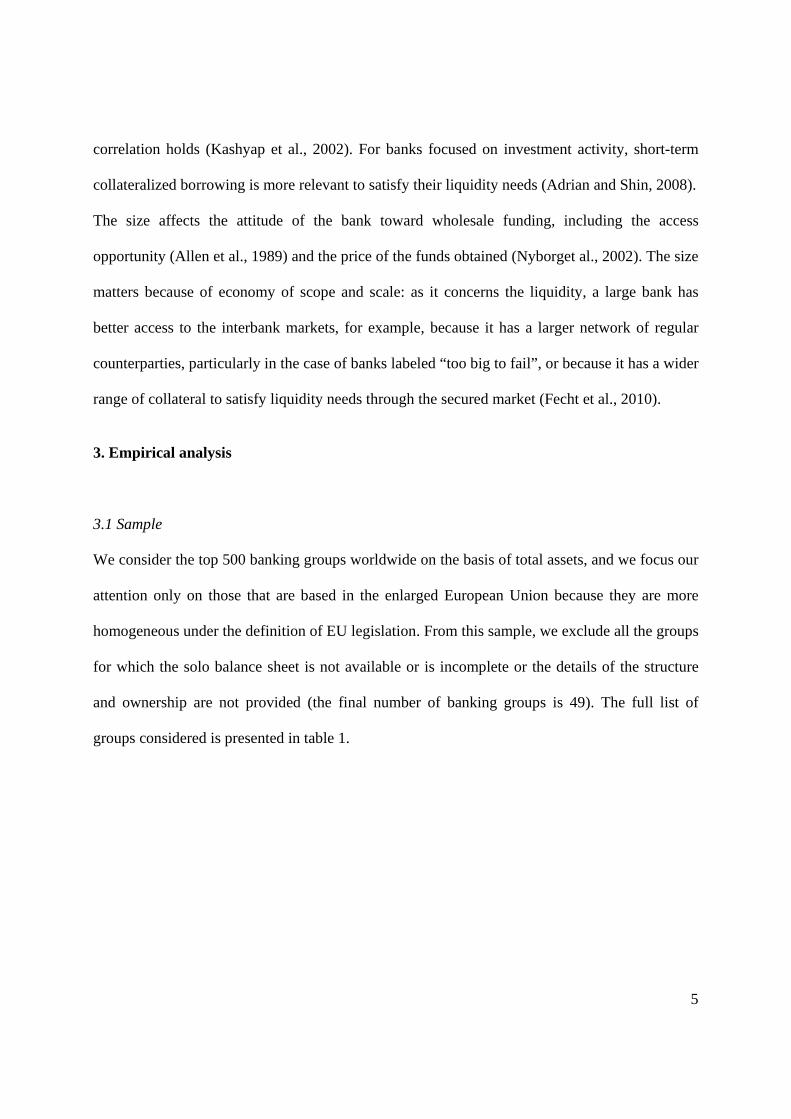
3. Empirical analysis
3.1 Sample
We consider the top 500 banking groups worldwide on the basis of total assets, and we focus our
attention only on those that are based in the enlarged European Union because they are more
homogeneous under the definition of EU legislation. From this sample, we exclude all the groups
for which the solo balance sheet is not available or is incomplete or the details of the structure
and ownership are not provided (the final number of banking groups is 49). The full list of
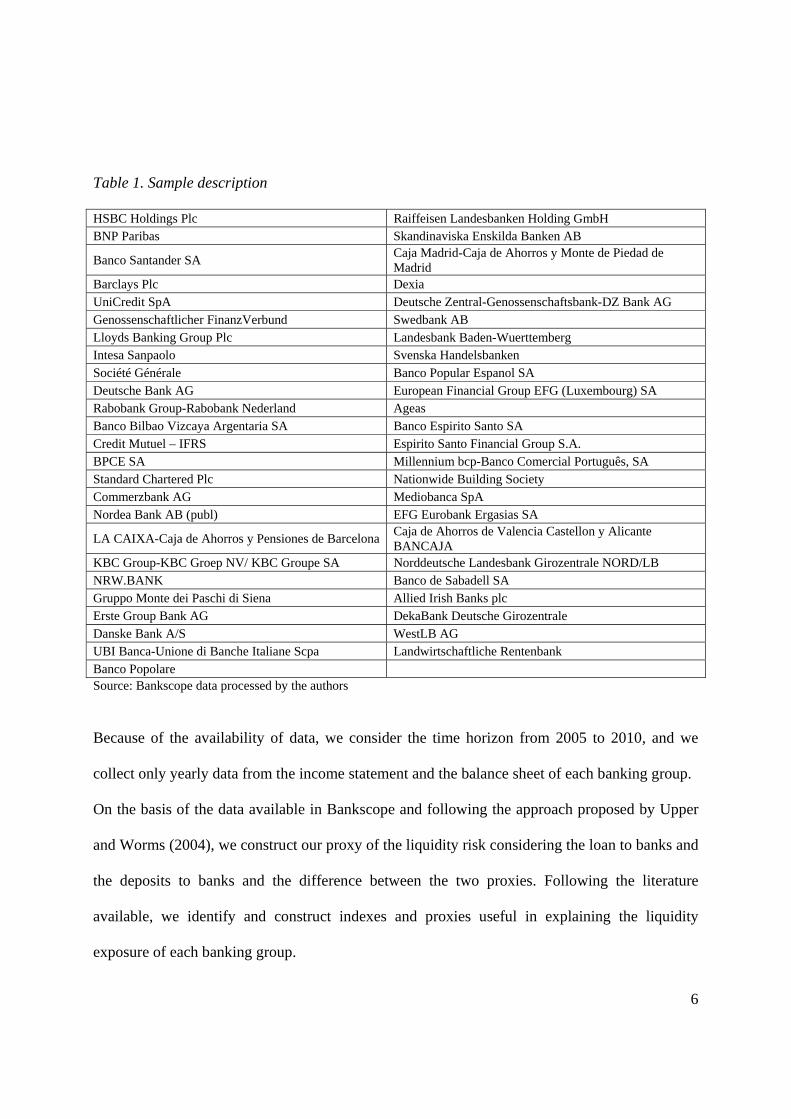
groups considered is presented in table 1.
6
Table 1. Sample description HSBC Holdings Plc Raiffeisen Landesbanken Holding GmbH BNP Paribas Skandinaviska Enskilda Banken AB
Banco Santander SA Caja Madrid-Caja de Ahorros y Monte de Piedad de Madrid
Barclays Plc Dexia UniCredit SpA Deutsche Zentral-Genossenschaftsbank-DZ Bank AG Genossenschaftlicher FinanzVerbund Swedbank AB Lloyds Banking Group Plc Landesbank Baden-Wuerttemberg Intesa Sanpaolo Svenska Handelsbanken Société Générale Banco Popular Espanol SA Deutsche Bank AG European Financial Group EFG (Luxembourg) SA Rabobank Group-Rabobank Nederland Ageas Banco Bilbao Vizcaya Argentaria SA Banco Espirito Santo SA Credit Mutuel – IFRS Espirito Santo Financial Group S.A. BPCE SA Millennium bcp-Banco Comercial Português, SA Standard Chartered Plc Nationwide Building Society Commerzbank AG Mediobanca SpA Nordea Bank AB (publ) EFG Eurobank Ergasias SA
LA CAIXA-Caja de Ahorros y Pensiones de Barcelona Caja de Ahorros de Valencia Castellon y Alicante BANCAJA
KBC Group-KBC Groep NV/ KBC Groupe SA Norddeutsche Landesbank Girozentrale NORD/LB NRW.BANK Banco de Sabadell SA Gruppo Monte dei Paschi di Siena Allied Irish Banks plc Erste Group Bank AG DekaBank Deutsche Girozentrale Danske Bank A/S WestLB AG UBI Banca-Unione di Banche Italiane Scpa Landwirtschaftliche Rentenbank Banco Popolare Source: Bankscope data processed by the authors Because of the availability of data, we consider the time horizon from 2005 to 2010, and we
collect only yearly data from the income statement and the balance sheet of each banking group.
On the basis of the data available in Bankscope and following the approach proposed by Upper
and Worms (2004), we construct our proxy of the liquidity risk considering the loan to banks and
the deposits to banks and the difference between the two proxies. Following the literature
available, we identify and construct indexes and proxies useful in explaining the liquidity
exposure of each banking group.
7
To consider the role of the group characteristics in explaining the liquidity risk exposure, we also
collect information about the rating of the group (our proxy is the Fitch support rating, which
measures the quality of the banking groups on the basis of the characteristics of the holding and
the other group members), and we analyze the ownership of each group member, the type of
subsidiaries and holdings (bank vs. other), the country of each groups’ members and the role of
controlled subsidiaries with respect to others. For group structure and ownership, Bankscope
provides only the last available data and so we use information available in the solo balance
sheet of each banking group in order to reconstruct all the changes happened in the six year time
horizon.
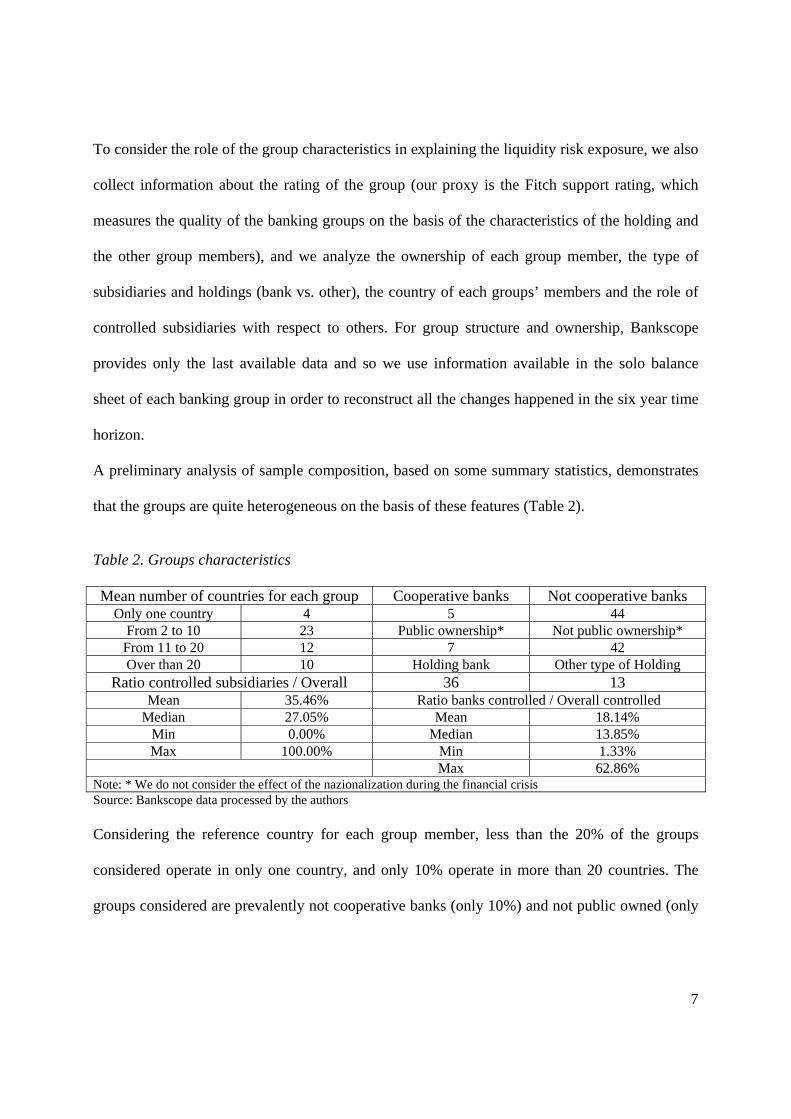
A preliminary analysis of sample composition, based on some summary statistics, demonstrates
that the groups are quite heterogeneous on the basis of these features (Table 2).
Table 2. Groups characteristics Mean number of countries for each group Cooperative banks Not cooperative banks
Only one country 4 5 44 From 2 to 10 23 Public ownership* Not public ownership*
From 11 to 20 12 7 42 Over than 20 10 Holding bank Other type of Holding
Ratio controlled subsidiaries / Overall 36 13 Mean 35.46% Ratio banks controlled / Overall controlled
Median 27.05% Mean 18.14% Min 0.00% Median 13.85% Max 100.00% Min 1.33%
Max 62.86% Note: * We do not consider the effect of the nazionalization during the financial crisisSource: Bankscope data processed by the authors Considering the reference country for each group member, less than the 20% of the groups
considered operate in only one country, and only 10% operate in more than 20 countries. The
groups considered are prevalently not cooperative banks (only 10%) and not public owned (only
8
14%), and the reference entity (holding) is normally a bank or a financial institution (more than
73%).
The ownership of each group member is, on average, less than 36%, therefore for the other
members participation does not imply corporate control. In terms of the types of controlled
entities, not all of them are banks; the banking group frequently decides to also control other
types of firms (not financial ones).
To determine the impact of interest rate market dynamics (e.g., Furfine, 2001), we also collect
information about the marginal lending facility amount and the EONIA interbank loan rate
directly from the ECB website.
3.2 Methodology
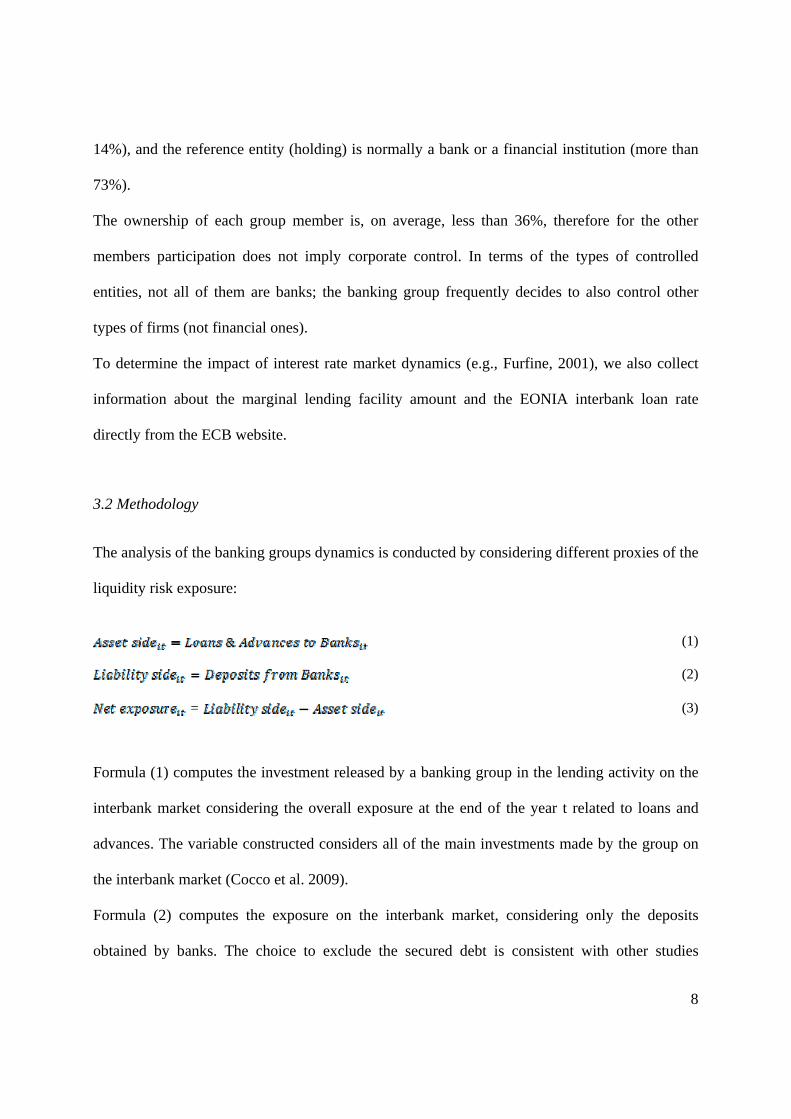
The analysis of the banking groups dynamics is conducted by considering different proxies of the
liquidity risk exposure:
(1)
(2)
= (3)
Formula (1) computes the investment released by a banking group in the lending activity on the
interbank market considering the overall exposure at the end of the year t related to loans and
advances. The variable constructed considers all of the main investments made by the group on
the interbank market (Cocco et al. 2009).
Formula (2) computes the exposure on the interbank market, considering only the deposits
obtained by banks. The choice to exclude the secured debt is consistent with other studies
9
available in the literature that demonstrate that only deposits show dynamics that are not affected
by the specific contract characteristics (e.g., Cajueiro and Tabak, 2008).
Formula (3) considers the difference between the liquidity exposure asset side and liability side
because the effects of the market conditions on the strategy are determined by the net position
(Wong, 1997) of each banking group.
The choice to consider the debt/credit exposure independently with respect to the size of the
exposure could be useful because there is evidence that demonstrates the role of specific bank
features in explaining the amount of interbank exposure in the interbank market (e.g., Iori et al.,
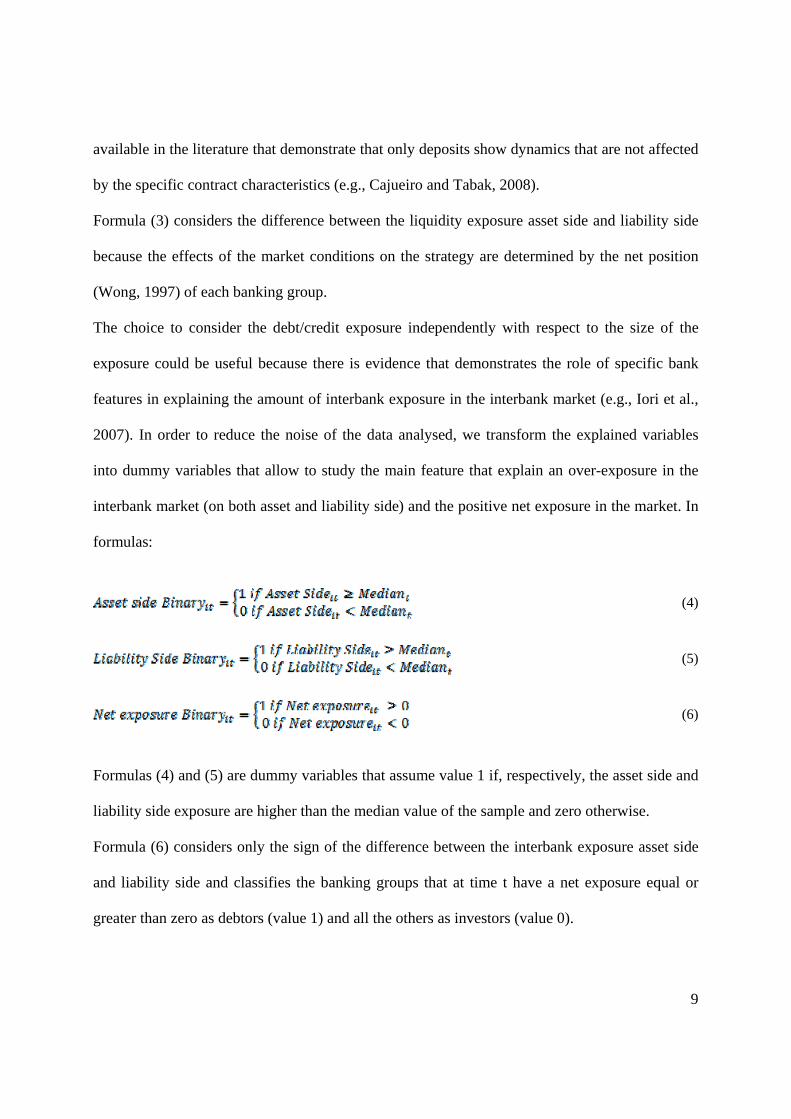
2007). In order to reduce the noise of the data analysed, we transform the explained variables
into dummy variables that allow to study the main feature that explain an over-exposure in the
interbank market (on both asset and liability side) and the positive net exposure in the market. In
formulas:
(4)
(5)
(6)
Formulas (4) and (5) are dummy variables that assume value 1 if, respectively, the asset side and
liability side exposure are higher than the median value of the sample and zero otherwise.
Formula (6) considers only the sign of the difference between the interbank exposure asset side
and liability side and classifies the banking groups that at time t have a net exposure equal or
greater than zero as debtors (value 1) and all the others as investors (value 0).
10
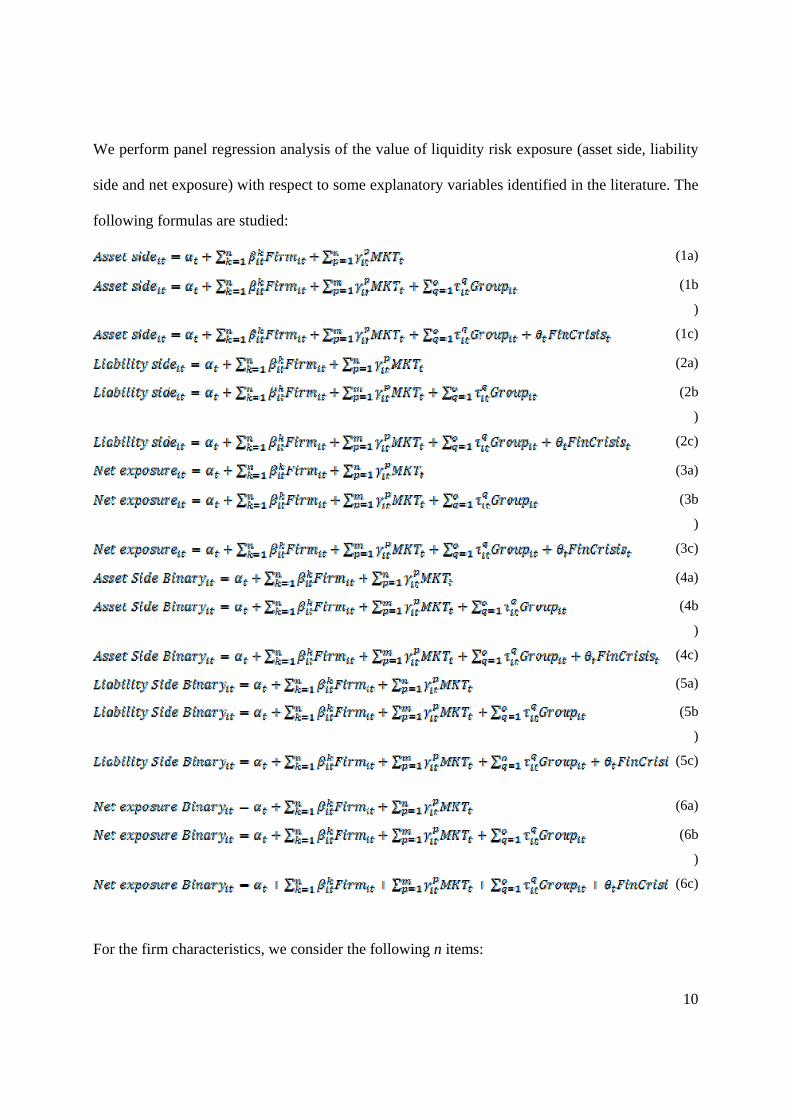
We perform panel regression analysis of the value of liquidity risk exposure (asset side, liability
side and net exposure) with respect to some explanatory variables identified in the literature. The
following formulas are studied:
(1a)
(1b
)
(1c)
(2a)
(2b
)
(2c)
(3a)
(3b
)
(3c)
(4a)
(4b
)
(4c)
(5a)
(5b
)
(5c)
(6a)
(6b
)
(6c)
For the firm characteristics, we consider the following n items:
11
Sizeit = Natural logarithm of the market value of the group i at time t. It represents a proxy for the
size of the group. Size influences the access to the interbank market for borrowers (Allen et al,
1989), but because relationship borrowing among banks is negatively affected by the size (Cocco
et al, 2008), the larger the group, the larger the amount of liquidity transfers internally released
among related parties inside the group. Therefore, the correlation of cash flows among group
members determines the liquidity needs/excess of the group (D’Souza and Lai, 2006).
NIIit = Not Interest Income on Total Assets. Based on the contribution of investment bank
activity to the profitability of the group, the variable serves as a proxy for the incidence of
investment bank activity (European Central Bank, 2010) because the focus on investment
activity indicates a higher recourse to short-term collateralized borrowing than to the interbank
market (Adrian and Shin, 2008).
ROAit = Return on Asset for group i at time t. The proxy measures the capability of the group to
create, in the long run, the internal financial resources necessary to create short-term invested
reserves to liquidate in order to meet the liquidity needs (e.g., Flannery, 1981); because it
concerns access to the interbank market, ROA affects the price of interbank market borrowing
because it signals the profitability of the assets for the lender (Furfine, 2001).
RWAit = Risk-weighted Assets on Assets for group i at time t. The variable measures the risk-
weighted assets according to the prudential regulation on capital requirements in force in the
country where the holding of the group resides. It accounts for the risk of the group deriving
from different sources and, among them, the risk of interbank loans (Rochet and Tirole, 1996).
Lendingit = Loans to customers on Total Assets for group i at time t. The variable represents the
incidence of lending activity that determines the relevance of the investment in assets that can
fail to provide liquidity when the firm needs it (Holmstroem and Tirole, 2000).
12
Impaired loansit = Impaired Loans on gross Loans for group i at time t. The variable accounts for
the quality of management of credit risk with reference to the group (Eisenbeis et al., 1999; Casu
and Girardone, 2004), and it affects the access to the interbank market, both in terms of the price
(Allen and Saunders, 1986) and the amount (Cocco et al., 2009).
Fixed assetit= Fixed Assets on Total Assets for group i at time t. The variable accounts for the
relevance of the fixed assets; therefore, it affects the opportunity to invest in the interbank
market; moreover, it is an indicator of the branches in place in the group (Cyree et al., 2000).
Depositsit= Retail Deposits on Total Assets for group i at time t. Because liquidity risk depends
primarily on retail deposits (Ho and Saunders, 1985), the variable accounts for the relevance of
such deposits in financing the assets.
Securitiesit= Securities on Total Assets for group i at time t. The range of collateral affects the
opportunity to raise liquidity through the interbank market (Fecht et al., 2010); therefore, the
variables serve as proxies for the collateral offered to satisfy liquidity needs.
For market dynamics, we consider the following m items:
Eoniat =European Overnight Interest Average. The variable serves as a proxy for the cost and the
return involved in accessing the interbank market (Prati et al., 2003).
MargLt= Marginal lending facility volumes. The variable measures the amount of liquidity
sources offered by the Central Bank that, because the Central Bank is normally the less costly
financing source, could negatively affect the number of transactions completed in the interbank
market.
For group characteristics, we consider the following o items:
Controlled/Allit = Number of controlled subsidiaries with respect to the number of total
subsidiaries for group i in year t. Because groups are able to raise funds from internal markets to
13
overcome liquidity shocks (Cetorelli et al., 2008), the variable serves as a proxy for the relevance
of affiliates for which the commitment to transfer liquidity is higher because of the corporate
control of the group.
HH Overallit = Herfindahl index of the affiliates classified for the country of origin in year t for
group i. The correlation between the cash flows of the group entities that work in the same
country can affect the liquidity position of the group (D’Souza and Lai, 2006).
HHbanksit = Herfindahl index of the banks classified for the country of origin in year t for group
i. Differences in the regulations on minimum liquidity reserve requirements and the support
provided to affiliates by the group (Joint Forum, 2006) can affect the liquidity strategy of the
group, while the correlation between the cash flows of the group entities can affect the liquidity
position of the group (D’Souza and Lai, 2006).
Banks/Allit = Number of controlled bank subsidiaries divided by the total number of controlled
subsidiaries. Because banks offer long-term assets and take retail deposits that affect the liquidity
risk (Kashyap et al., 2002), the variable serves as a proxy for the relevance of the banking
activity on controlled members of the group.
Cooperativesit = Dummy variable that assumes a value of 1 if the banking group is a cooperative
banking group in year t. Banks can form relationship networks to adjust liquidity when friction
exists both in the wholesale and retail markets (Freixas et al., 2000) because they are more
exposed to monetary policy shocks in their lending activities (Kashyap and Stein, 2000).
Because savings and cooperative banks belong to networks in which a head institution or more
second-level institutions hold liquidity reserves and coordinate the reallocation of liquidity
among the members (Mazzillis and Schena, 2001), they can overcome the disadvantages in
accessing liquidity caused by their limited size (Ehrmann and Worms, 2004).
14
Public ownerit = Dummy variable that assumes a value of 1 if the owner of the group is public in
year t. The analysis of the public ownership is relevant because the public shareholder could
normally affect the lending and investment policy of the banking group (Cajueiro and Tabak,
2008).
Ratingit = Support rating defined by Fitch that measures the quality of the banking groups based
on the characteristics of the holding and the other group members that provides a judgment on a
scale that varies from 1 (lowest-risk groups) to 6 (highest-risk groups) (Fitch, 2004).
Holding bankit = Dummy variable that assumes a value of 1 if the owner of the group is a bank in
year t. When the holding is a bank, liquidity management is defined by a high level of
centralization (Joint Forum, 2006), which affects the access to external sources to satisfy
liquidity shocks.
The last variable added is a financial crisis dummy variable that assumes a value of 1 from 2007
to the present. The inclusion of this variable makes it possible to test, as supposed in the
literature (European Central Bank, 2010), that the main financial groups changed their interbank
exposure during the last several years in order to overcome the problems related with the new
financial and macroeconomic scenario.
The summary statistics (number of observation, mean, min and max) of the variables selected are
presented in table 3.
15
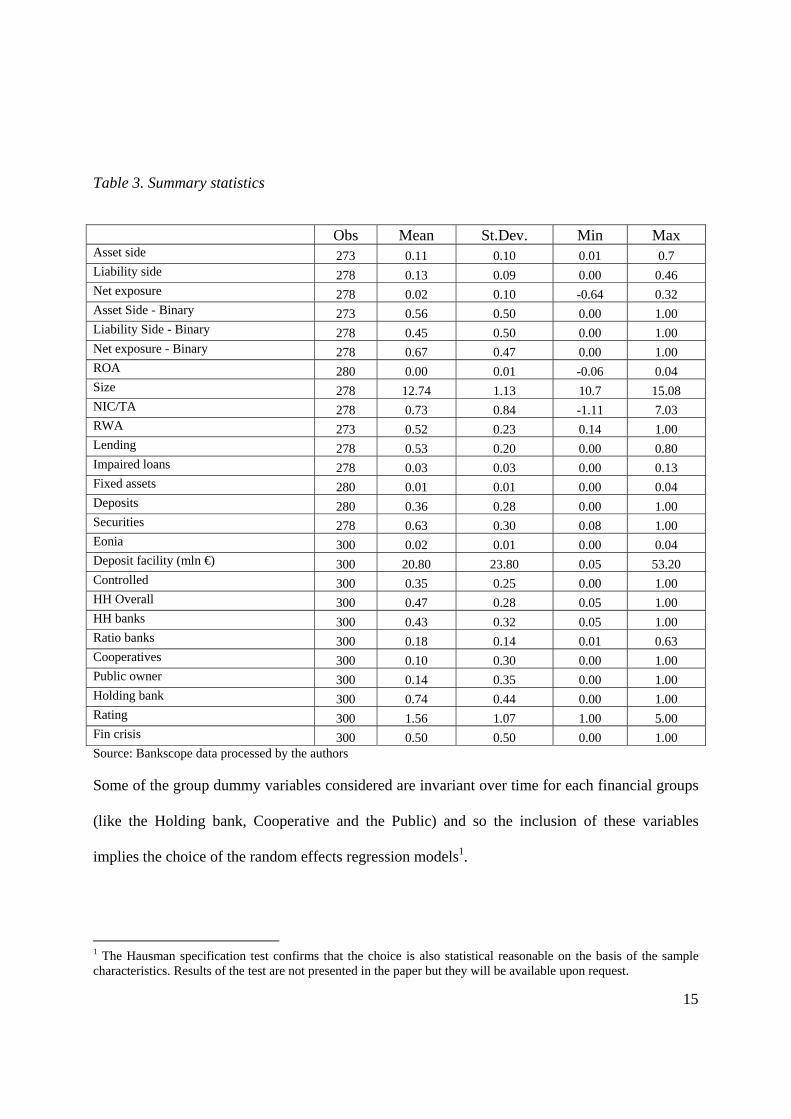
Table 3. Summary statistics
Obs Mean St.Dev. Min Max Asset side 273 0.11 0.10 0.01 0.7 Liability side 278 0.13 0.09 0.00 0.46 Net exposure 278 0.02 0.10 -0.64 0.32 Asset Side - Binary 273 0.56 0.50 0.00 1.00 Liability Side - Binary 278 0.45 0.50 0.00 1.00 Net exposure - Binary 278 0.67 0.47 0.00 1.00 ROA 280 0.00 0.01 -0.06 0.04 Size 278 12.74 1.13 10.7 15.08 NIC/TA 278 0.73 0.84 -1.11 7.03 RWA 273 0.52 0.23 0.14 1.00 Lending 278 0.53 0.20 0.00 0.80 Impaired loans 278 0.03 0.03 0.00 0.13 Fixed assets 280 0.01 0.01 0.00 0.04 Deposits 280 0.36 0.28 0.00 1.00 Securities 278 0.63 0.30 0.08 1.00 Eonia 300 0.02 0.01 0.00 0.04 Deposit facility (mln €) 300 20.80 23.80 0.05 53.20 Controlled 300 0.35 0.25 0.00 1.00 HH Overall 300 0.47 0.28 0.05 1.00 HH banks 300 0.43 0.32 0.05 1.00 Ratio banks 300 0.18 0.14 0.01 0.63 Cooperatives 300 0.10 0.30 0.00 1.00 Public owner 300 0.14 0.35 0.00 1.00 Holding bank 300 0.74 0.44 0.00 1.00 Rating 300 1.56 1.07 1.00 5.00 Fin crisis 300 0.50 0.50 0.00 1.00 Source: Bankscope data processed by the authors
Some of the group dummy variables considered are invariant over time for each financial groups
(like the Holding bank, Cooperative and the Public) and so the inclusion of these variables
implies the choice of the random effects regression models1.
1 The Hausman specification test confirms that the choice is also statistical reasonable on the basis of the sample characteristics. Results of the test are not presented in the paper but they will be available upon request.
16
3.3 Results
To test the different roles of the banking group features, we perform a panel linear regression
with random effects to test their role in explaining the liquidity exposure (Table 4).
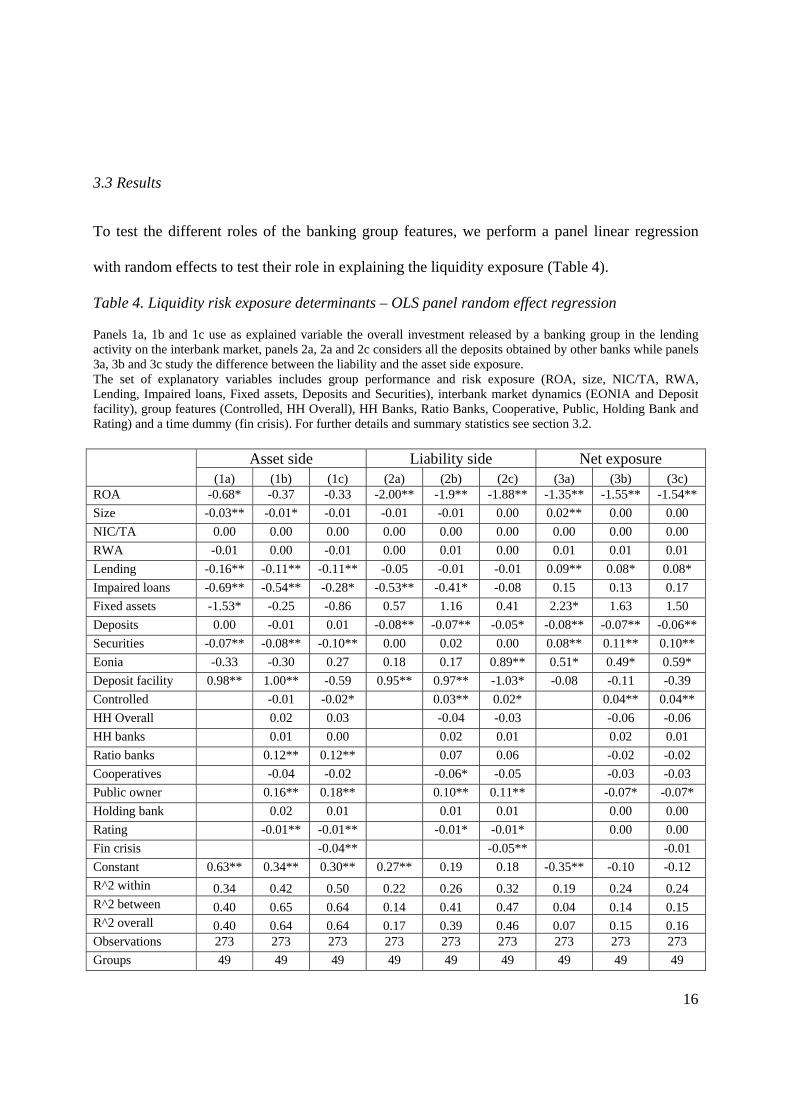
Table 4. Liquidity risk exposure determinants – OLS panel random effect regression
Panels 1a, 1b and 1c use as explained variable the overall investment released by a banking group in the lending activity on the interbank market, panels 2a, 2a and 2c considers all the deposits obtained by other banks while panels 3a, 3b and 3c study the difference between the liability and the asset side exposure. The set of explanatory variables includes group performance and risk exposure (ROA, size, NIC/TA, RWA, Lending, Impaired loans, Fixed assets, Deposits and Securities), interbank market dynamics (EONIA and Deposit facility), group features (Controlled, HH Overall), HH Banks, Ratio Banks, Cooperative, Public, Holding Bank and Rating) and a time dummy (fin crisis). For further details and summary statistics see section 3.2. Asset side Liability side Net exposure
(1a) (1b) (1c) (2a) (2b) (2c) (3a) (3b) (3c) ROA -0.68* -0.37 -0.33 -2.00** -1.9** -1.88** -1.35** -1.55** -1.54**
Size -0.03** -0.01* -0.01 -0.01 -0.01 0.00 0.02** 0.00 0.00
NIC/TA 0.00 0.00 0.00 0.00 0.00 0.00 0.00 0.00 0.00
RWA -0.01 0.00 -0.01 0.00 0.01 0.00 0.01 0.01 0.01
Lending -0.16** -0.11** -0.11** -0.05 -0.01 -0.01 0.09** 0.08* 0.08*
Impaired loans -0.69** -0.54** -0.28* -0.53** -0.41* -0.08 0.15 0.13 0.17
Fixed assets -1.53* -0.25 -0.86 0.57 1.16 0.41 2.23* 1.63 1.50
Deposits 0.00 -0.01 0.01 -0.08** -0.07** -0.05* -0.08** -0.07** -0.06**
Securities -0.07** -0.08** -0.10** 0.00 0.02 0.00 0.08** 0.11** 0.10**
Eonia -0.33 -0.30 0.27 0.18 0.17 0.89** 0.51* 0.49* 0.59*
Deposit facility 0.98** 1.00** -0.59 0.95** 0.97** -1.03* -0.08 -0.11 -0.39
Controlled -0.01 -0.02* 0.03** 0.02* 0.04** 0.04**
HH Overall 0.02 0.03 -0.04 -0.03 -0.06 -0.06
HH banks 0.01 0.00 0.02 0.01 0.02 0.01
Ratio banks 0.12** 0.12** 0.07 0.06 -0.02 -0.02
Cooperatives -0.04 -0.02 -0.06* -0.05 -0.03 -0.03
Public owner 0.16** 0.18** 0.10** 0.11** -0.07* -0.07*
Holding bank 0.02 0.01 0.01 0.01 0.00 0.00
Rating -0.01** -0.01** -0.01* -0.01* 0.00 0.00
Fin crisis -0.04** -0.05** -0.01
Constant 0.63** 0.34** 0.30** 0.27** 0.19 0.18 -0.35** -0.10 -0.12
R^2 within 0.34 0.42 0.50 0.22 0.26 0.32 0.19 0.24 0.24 R^2 between 0.40 0.65 0.64 0.14 0.41 0.47 0.04 0.14 0.15 R^2 overall 0.40 0.64 0.64 0.17 0.39 0.46 0.07 0.15 0.16 Observations 273 273 273 273 273 273 273 273 273
Groups 49 49 49 49 49 49 49 49 49

17
Source: Bankscope data processed by the authors

18
The choice to include the banking group features makes it possible to duplicate at least the
overall R2 of the regression model. Therefore, to explain the liquidity policy of the main banking
groups, it is necessary to explicitly consider the main group features. The analysis of the asset
side of the interbank exposure is normally easy to model, while the analysis of the liability side
and the net exposure is less explainable.
The performance measure of the banking groups (measured by ROA) negatively affects the
interbank exposure. For the liability side, the negative effect can be explained by the low
dependence of the group with respect to the rest of the market because of the opportunity for
self-financing. For the asset side, the relationship is negative because of the low profitability of
the interbank lending with respect to the other investment opportunities, which implies that these
types of investments are less relevant with respect to other investment opportunities (Wong,
1997). Excluding models 1b and 1c, the ROA variable does not increase the statistical fitness of
the model.
Normally, larger groups are less active in the interbank markets because of the opportunities that
they have to use internally generated financial resources to meet liquidity needs. This
relationship is clear for both the asset side, while for the liability side, there is no clear statistical
relationship. The lack of relevance for the liability side could be explained by the existence of a
residual (and marginal) financing policy in the interbank market for the larger groups that exist
to meet unexpected liquidity needs. The relevance of the size on the net exposure can imply
potential systemic effects of the interbank market activity.
The investments released in the interbank market are negatively affected by the relevance of the
lending offered in the interbank market because the bank is more worried about creating the
reserves necessary to address unexpected losses related to the lending activity. For the liability
19
side, the lending activity negatively affects the liquidity exposure only for the characteristics of
the banking group. The effect on the net exposure is strictly linked to the asset side position.
The role of impaired loans negatively affects the interbank activity (both the asset and the
liability side) because of the lower reputation of the banking groups in the market when the
number of defaults increases (Allen and Saunders, 1986).
The amount of fixed assets negatively affects the interbank investments because banks that are
more exposed in their long-term investments because of the higher need for money to support
growth invest less in the interbank market (Cjree, Wansley and Boehm, 2000). When including
the banking group structure variables, the fixed assets investment variables lose their statistical
significance.
The number of deposits positively affects all types of investments and negatively affects the need
for funding to overcome the liquidity needs. The variable is statistically relevant only for the
liability side and the net exposure and is driven by the asset side because of the high relevance of
the deposit funding for the interbank investment.
The availability of securities negatively and significantly affects the investment and net exposure
on the interbank market. The results could be explained by the preference of these types of banks
for collateralized borrowing over the interbank market (Adrian and Shin, 2008).
The EONIA interest rate seems to significantly affect both the asset side and the liability side of
the banking group’s exposure in the interbank market. The relationship is not consistent with the
literature and is not verified when the financial crisis dummy variable is considered. The
relationship identified is not related to the market dynamics; it is only affected by the change in
the EONIA market trend during the crisis (Brunnemeier, 2009).

20
The analysis of the amount of credit offered to the financial system negatively affects the
interbank activity because, normally, the higher the amount offered by the Central Bank, the
lower the need to collect money through the interbank market and the lower the interest rate of
these types of investments (Freixas et al. 2000).
Considering the banking group characteristics, only the degree of control, the type of group
(public or private) and the rating affect the liquidity exposure.
The higher the number of controlled entities in the group, the lower the investment in the
interbank market is, especially before the most recent financial crisis. The effect on the net
exposure is clearer and statistically significant and is significantly driven by the asset side that
imposes a highly centralized group that invests primarily in intragroup lending instead of
interbank investments (Cetorelli and Goldberg, 2008).
Publicly owned banking groups do not invest in the interbank sector during a financial crisis
because during a crisis, the Government agrees to provide the amount of capital necessary only if
the banking group significantly modifies (reduces) its risk exposure (Cajueiro and Tabak, 2008).
Normally, they frequently resort to interbank lending while the net exposure in the interbank
market in not clearly affected by public ownership.
Normally, less risky banking groups (lower rating assigned by Fitch) have a lower exposure in
the interbank market, and they are also able to increase the lending obtained in the interbank
market because of the high reputation they have in the credit market. The net effect is not clear
because the relevance of the asset side and the relevance of the liability side are comparable.
The financial crisis dummy variable negatively affects all types of interbank exposure because of
the lack confidence of all of the banks in the interbank transactions during a period of crisis
(European Central Bank, 2008). The relationship is statistically significant only for the liability
21
side, so the net exposure is driven by the effect on the liability side (even if it is not statistically
significant).
The analysis of the binary variables constructed on the asset side, liability side and net exposure
allows identifying some interesting differences respect the exposure amount analysis (Table 5).
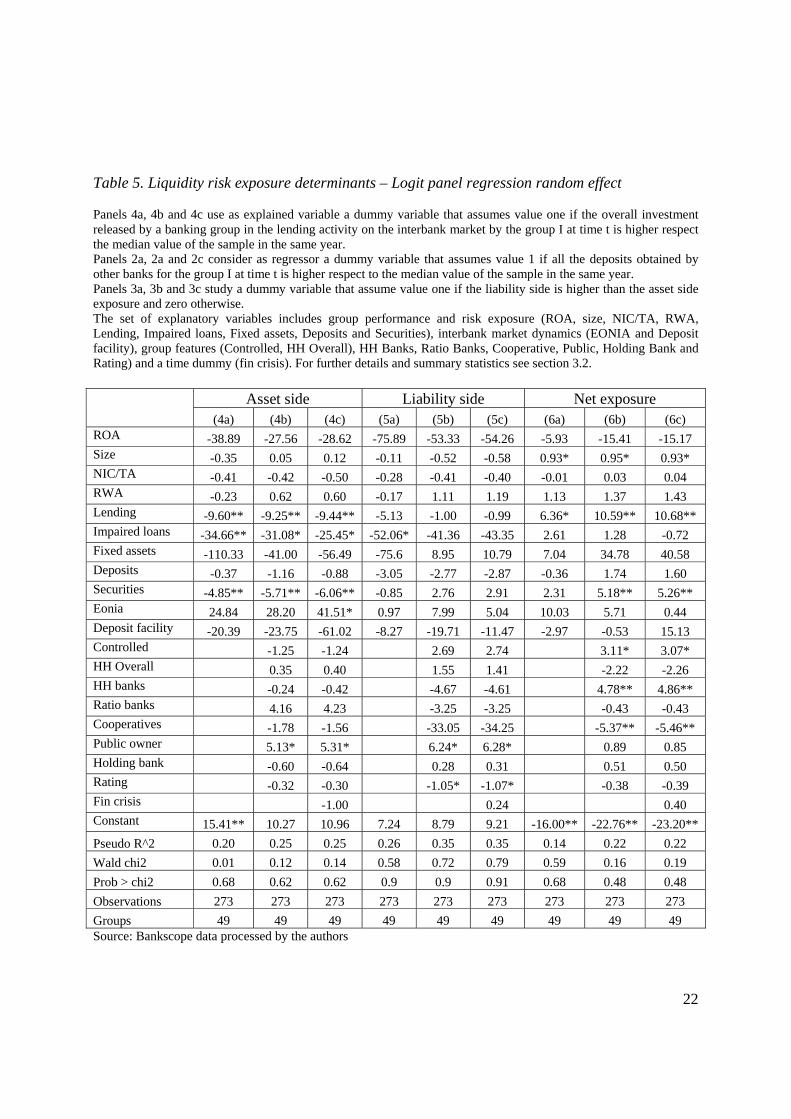
Logit regression models perform worse with respect to the ordinary least squares models when
only the asset side or the liability side are considered (the Pseudo R2 is less than an half of the R2
overall of the OLS models). While when the net exposure is taken into account, the logit
regression fits better with the data.
In terms of the explanatory variables, the choice of the logit regression models modifies
significantly the role of the firm specific and the market explanatory variables. In fact, even if
there is no change in the sign of almost all relationships identified, the statistical relevance of
fixed assets and deposits disappears and no market variable (Eonia and Deposit facility)
contributes positively to the explanatory power of the model. So all these variables play a role in
defining the amount of exposure (both credit and debit ones) but they seems to be less relevant in
defining the groups’ choice to be net lender or net debtor in the interbank market (models 6a, 6b
and 6c) or the strategy to be one of the more exposed financial group in the interbank market
(models 4a, 4b, and 4c for the asset side and models 5a, 5b and 5c for the liability side).
22
Table 5. Liquidity risk exposure determinants – Logit panel regression random effect
Panels 4a, 4b and 4c use as explained variable a dummy variable that assumes value one if the overall investment released by a banking group in the lending activity on the interbank market by the group I at time t is higher respect the median value of the sample in the same year. Panels 2a, 2a and 2c consider as regressor a dummy variable that assumes value 1 if all the deposits obtained by other banks for the group I at time t is higher respect to the median value of the sample in the same year. Panels 3a, 3b and 3c study a dummy variable that assume value one if the liability side is higher than the asset side exposure and zero otherwise. The set of explanatory variables includes group performance and risk exposure (ROA, size, NIC/TA, RWA, Lending, Impaired loans, Fixed assets, Deposits and Securities), interbank market dynamics (EONIA and Deposit facility), group features (Controlled, HH Overall), HH Banks, Ratio Banks, Cooperative, Public, Holding Bank and Rating) and a time dummy (fin crisis). For further details and summary statistics see section 3.2. Asset side Liability side Net exposure
(4a) (4b) (4c) (5a) (5b) (5c) (6a) (6b) (6c) ROA -38.89 -27.56 -28.62 -75.89 -53.33 -54.26 -5.93 -15.41 -15.17 Size -0.35 0.05 0.12 -0.11 -0.52 -0.58 0.93* 0.95* 0.93* NIC/TA -0.41 -0.42 -0.50 -0.28 -0.41 -0.40 -0.01 0.03 0.04 RWA -0.23 0.62 0.60 -0.17 1.11 1.19 1.13 1.37 1.43 Lending -9.60** -9.25** -9.44** -5.13 -1.00 -0.99 6.36* 10.59** 10.68** Impaired loans -34.66** -31.08* -25.45* -52.06* -41.36 -43.35 2.61 1.28 -0.72 Fixed assets -110.33 -41.00 -56.49 -75.6 8.95 10.79 7.04 34.78 40.58 Deposits -0.37 -1.16 -0.88 -3.05 -2.77 -2.87 -0.36 1.74 1.60 Securities -4.85** -5.71** -6.06** -0.85 2.76 2.91 2.31 5.18** 5.26** Eonia 24.84 28.20 41.51* 0.97 7.99 5.04 10.03 5.71 0.44 Deposit facility -20.39 -23.75 -61.02 -8.27 -19.71 -11.47 -2.97 -0.53 15.13 Controlled -1.25 -1.24 2.69 2.74 3.11* 3.07* HH Overall 0.35 0.40 1.55 1.41 -2.22 -2.26 HH banks -0.24 -0.42 -4.67 -4.61 4.78** 4.86** Ratio banks 4.16 4.23 -3.25 -3.25 -0.43 -0.43 Cooperatives -1.78 -1.56 -33.05 -34.25 -5.37** -5.46** Public owner 5.13* 5.31* 6.24* 6.28* 0.89 0.85 Holding bank -0.60 -0.64 0.28 0.31 0.51 0.50 Rating -0.32 -0.30 -1.05* -1.07* -0.38 -0.39 Fin crisis -1.00 0.24 0.40 Constant 15.41** 10.27 10.96 7.24 8.79 9.21 -16.00** -22.76** -23.20**
Pseudo R^2 0.20 0.25 0.25 0.26 0.35 0.35 0.14 0.22 0.22
Wald chi2 0.01 0.12 0.14 0.58 0.72 0.79 0.59 0.16 0.19
Prob > chi2 0.68 0.62 0.62 0.9 0.9 0.91 0.68 0.48 0.48
Observations 273 273 273 273 273 273 273 273 273
Groups 49 49 49 49 49 49 49 49 49 Source: Bankscope data processed by the authors
23
Looking at the groups characteristic, the asset side (models 4a, 4b, 4c) is driven by the public
ownership (positive relationship) while the liability side (models 5a, 5b, 5c) is affected by both
the public ownership and the group rating (respectively positive and negative relationship). The
analysis of the net exposure (models 6a, 6b and 6c) shows some differences respect to the linear
regression results: the main explaining variables are the degree of control, the cooperative status
dummy and the geographical concentration of the banks. The cooperative bank status could
affect the probability of being a debtor in the interbank market because (on average) this type of
bank is normally smaller, so their access to the interbank market to satisfy liquidity needs is
lower (Allen et al., 1989). The relationship with the geographical concentration could be related
to the higher geographical concentration of the portfolio that positively affects the cash flow
correlation (D’Souza and Lai, 2006).
The financial crisis dummy does not increase the explanatory power of the regression model and
so during the crisis the interbank exposure of the main financial groups did not change
significantly and the manager’s choices never changes radically. Results are consistent with the
US experience where the crisis does not change the number and type of financial intermediaries
that trade actively in interbank market even if the sensitivity to bank specific features and
riskiness is significantly increased (Afonso et al., 2011).
4. Conclusions
Consistent with other studies available in the literature, there are some bank features (such as
lending and size) and some market trends (interest rate and credit supply) that can affect the
interbank activity of banking groups. Banking group features significantly affect the exposure in
the interbank market of the overall banking group for both the asset and liability sides. The type
24
of group, the type of holding, the degree of control and the rating of the group are the most
important variables for explaining the interbank exposure.
The role of the banking features in explaining the liquidity exposure of the overall banking group
demonstrates the need for a supervisory approach that examines the banking group’s exposure
instead of analyzing each bank’s exposure. The results support the theory proposed by some
authors about the effects of a centralized banking supervision process (e.g., Rochet and Tirole,
1996) on the main European banking groups made directly by the ECB or by a macroprudential
supervisory authority.
The relevance of the banking group variables in explaining the interbank market exposure
demonstrates the need for a supervisory approach to the liquidity market dynamics that uses a
macro scenario to evaluate the intragroup bank transfers.
The next step of the research will be to refine some of the explanatory variables (such as the HH)
to verify whether the change in the specification of the index can affect the statistical fitness of
the model and the variable significance. To measure how much group features affect the liquidity
exposure, an event study approach could make it possible to identify how the different changes
in the group features could affect the interbank exposure of the banking group.
The current debate about the SFI demonstrates the attention given by supervisors to monitoring
the largest European financial groups to mitigate the risk of a future financial crisis (e.g., Masera,
2009). Evidences presented in the paper demonstrate the role of some group features in explain
their interbank exposure and could be useful in order to define the new supervisory guidelines
for liquidity management. The current regulatory framework highlights the relevance of liquidity
risk measurement at group level and points out some legal constraints that have to be considered
for evaluating liquidity transfer restrictions (BIS, 2010). Nonetheless, empirical evidences
25
presented in the paper demonstrate the relevance for the main European groups of features like
degree control, ownership, number of banks in the group and group’s rating and point out some
further development opportunities for the current regulatory framework.
References Afonso G., Kovner A., Schoar A. (2011). Stressed, Not Frozen: The Federal Funds Market in the
Financial Crisis. Journal of Finance 66, 1109-1139
Allen, F., Gale, D., 2000. Financial Contagion. Journal of Political Economy 108, 1–33.
Allen, L., Peristiani, S., Saunders, A., 1989. Bank Size, Collateral, and Net Purchase Behavior in
the Federal Funds Market: Empirical Evidence. Journal of Business 62, 501-515.
Allen, L., Saunders A., 1986. The Large-Small Bank Dichotomy in the Federal Funds Market. Journal of Banking and Finance 10, 219-30 Adrian, T., Shin, H.S., 2008. Liquidity, Monetary Policy, and Financial Cycles. Current Issues in
Economics and Finance 14, 1-7.
Berger, A.N., Bouwman, C.H.S., 2009. Bank Liquidity Creation. Review of Financial Studies
22, 3379- 3837.
BIS, 2010. Basel III: International framework for liquidity risk measurement, standards and
monitoring http://www.bis.org/publ/bcbs188.pdf
Brunnemeier, M.K., 2009. Deciphering the 2007-08 Liquidity and Credit Crunch. Journal of
Economic Perspectives 23, 77-100
Cabral, I., Dierick, F., Vesala, J., 2002. Banking Integration in the Euro Area. ECB Occasional
Paper Series < http://www.ecb.int/pub/pdf/scpops/ecbocp6.pdf>

26
Cajueiro, D.O., Tabak, B.M., 2008. The Role of Banks in the Brazilian Interbank Market: Does
Bank Type Matter?. Physica A 387, 6825-6836.
Casu, B., Girardone, C., 2004. Financial Conglomeration: Efficiency, Productivity and Strategic
Drive. Applied Financial Economics 14, 687–696.
Cocco, J.F., Gomes, F.J., Martins, N.C., 2009. Lending Relationships in the Interbank Market.
Journal of Financial Intermediation 18, 24-48.
Cumming, M., Hirtel, B.J., 2001. The Challenges of Risk Management in Diversified Financial
Companies. Journal of Financial Transformation 3, 89-95.
Cyree, K.A., Wansley, J.W., Boehm,T.P., 2000. Determinants of Bank Growth Choice. Journal
of Banking and Finance 24, 709-734.
Demsetz, R.S., Strahan, P.E., 1997. Diversification, Size, and Risk at Bank Holding Companies.
Journal of Money, Credit, and Banking 29, 300-313.
D’Souza, C., Lai, A., 2006. The Effects of Bank Consolidation on Risk Capital Allocation and
Market Liquidity. Journal of Financial Research 29, 271-291.
Diamond, D.W., Rajan, R.G., 2001. Liquidity Risk, Liquidity Creation and Financial Fragility: A
Theory of Banking. Journal of Political Economy 109, 287-327.
Ehrmann, M., Worms, A., 2004. Bank Networks and Monetary Policy Transmission. Journal of
the European Economic Association 2, 1148-1171.
European Central Bank, 2010. Beyond ROE – How to Measure Bank performance. <
http://www.ecb.europa.eu/pub/pdf/other/beyondroehowtomeasurebankperformance201009en.pdf
>.
European Central Bank, 2010, Euro Money Market Study,
<http://www.ecb.int/pub/pdf/other/euromoneymarketstudy201012en.pdf>.
27
Fecht, F., Nyborg, K.G., Rocholl, J., 2010. The Price of Liquidity: Bank Characteristics and
Market Conditions. CEPR DP n. 7794 <http://www.cepr.org/pubs/new-
dps/dplist.asp?dpno=7794.asp >
Fitch, 2004. Bank Rating Methodology. <http://www.fitchratings.cl/Upload/procesoevaluacio-
nbancos%281%29.pdf>.
Flannery, M.J., 1981. Market Interest Rate and Commercial Bank Profitability: an Empirical
Investigation. Journal of Finance 36, 1085-1101.
Furfine, C., 2001. Banks as Monitors of Other Banks: Evidence from the Overnight Federal
Funds Market. Journal of Business 74, 33-74.
Focarelli, D., Panetta, F., Salleo, C., 2002. Why Do Banks Merge?. Journal of Money, Credit and
Banking 34, 1047-1066.
Freixas, S., Parigi, B.M., Rochet, J.C., 2000. Systemic Risk, Interbank Relations, and Liquidity
Provision by the Central Bank. Journal of Money, Credit and Banking 32, 611-638.
Ho, T., Saunders, A., 1985. A micro-model of the Federal Funds market. Journal of Finance 40,
977–990.
Holmstroem, B., Tirole, J., 2000. Liquidity and Risk Management. Journal of Money, Credit and
Banking 32, 295-319.
Institute of International Finance, 2007. Principles for Liquidity Risk Management. <
http://www.iif.com/download.php?id=tv/yzuHHXJ0=>.
Iori, G., Renò, R., De Masi, G., Caldarelli G., 2007. Trading strategies in the Italian interbank
market. Phisica A 386, 467-479.
Joint Forum, 2006. The Management of Liquidity Risk in Banking Groups. <
http://www.bis.org/publ/joint16.pdf>.
28
Kashyap, A., Stein, J., 2000. What Do a Million Observation on Banks Say About the
Transmission of Monetary Policy?. American Economic Review 90, 407-28.
Kashyap, A.K., Rajan, R., Stein, J.C., 2002. Banks as Liquidity Providers: an Explanation for the
Coexistence of Lending and Deposit-Taking. Journal of Finance 57, 33-73.
Masera, R., 2009. The Great Financial Crisis. Bancaria Editrice, Rome.
Matz, L.M., Neu, P., 2007. Liquidity risk measurement and management: a practitioner's guide
to global best practices, John Wiley and Sons, Chichester, UK.
Mazzillis, M.C., Schena, C., 2001. Una lettura dell’evoluzione strutturale ed operativa delle
Banche di Credito Cooperativo nel periodo 1983-1999. Cooperazione di Credito 53, 29-57.
Nyborg, K.G., Bindseil, U., Strebulaev, I.A., 2002. Bidding and performance in repo auctions:
evidence from ECB open market operations. ECB Working Paper n. 157
<http://www.ecb.int/pub/pdf/scpwps/ecbwp157.pdf>.
Prati, A., Bartolini, L., Bertola, G., 2003. The Overnight Interbank Market: Evidence from the G-
7 and the Euro Zone. Journal of Banking and Finance 27, 2045-2083.
Rochet, J. C., Tirole, J., 1996. Interbank Lending and Systemic Risk. Journal of Money, Credit
and Banking 28, 733-762.
Schinasi, G.J., Texeira, P.G., 2006. The Lender of Last Resort in the European Single Financial
Market. IMF WP 06/127 < http://www.imf.org/external/pubs/ft/wp/2006/wp06127.pdf >.
Upper, C., Worms, A., 2004. Estimating Bilateral Exposures in the German Interbank Market: Is
there a Danger of Contagion?. European Economic Review 48, 827-849.
Vander Vennet, R., 2002. Cost and Profit Efficiency of Financial Conglomerates and Universal
Banks in Europe. Journal of Money, Credit and Banking 34, 254-282.

29
Wong, K.P., 1997. On the Determinants of Bank Interest Margins under Credit and Interest Rate
Risks. Journal of Banking & Finance 21, 251-271.