Embed Size (px)
Citation preview

The Regional Economics Applications Laboratory (REAL) of the University of Illinois focuses on the development and use of analytical models for urban and regional economic development. The purpose of the Discussion Papers is to circulate intermediate and final results of this research among readers within and outside REAL. The opinions and conclusions expressed in the papers are those of the authors and do not necessarily represent those of the University of Illinois. All requests and comments should be directed to Geoffrey J. D. Hewings, Director, Regional Economics Applications Laboratory, 607 South Matthews, Urbana, IL, 61801-3671, phone (217) 333-4740, FAX (217) 244-9339. Web page: www.real.uiuc.edu
THE IMPACT OF INDUSTRIAL SPECIALIZATION OR DIVERSITY ON EMPLOYMENT AND WAGE GROWTH:
AN ANALYSIS OF THE BRAZILIAN CASE IN THE 1990S
by
Silvia Harumi Toyoshima and Geoffrey J.D. Hewings
REAL 07-T-2 February, 2007

The Impact of Industrial Specialization or Diversity on
Employment and Wage Growth: an Analysis of the Brazilian case
in the 1990s1
Silvia Harumi Toyoshima Professor of Department of Economics Federal University of Viçosa – Brazil Geoffrey J.D. Hewings Regional Economics Applications Laboratory (REAL) University of Illinois, Urbana, IL 61801
Abstract The objective of this paper was to verify if the specialization in a given industrial sector generated positive externalities in the Brazilian microregions. Analysis explored whether specialization had a greater impact on employment and wage variation in the microregions than industrial diversity, during the 1990s, when the focus upon specialized agglomerations was reinforced as the way to promote local economic development. The method utilized was adapted from the Glaeser et al. model, an externalities generation model applied to the USA case. The results showed that changes that occurred in the Brazilian industrial sector in the 1990s influenced the impact of specialization and diversity on employment and wages, and that there are many differences across the regions of the country. On the whole, the outcome showed that the specialized microregion was important to foster employment in a region where the clusters were consolidated. In a region where the clusters formation was initiated in the 1990s, the tendency was to decrease the employment and increase the wages, indicating a process of productivity augmentation. The implication is that mature industrial concentrations can foster growth more than other locations at least in Brazilian case, confirming the principal hypothesis about the presence of increasing returns in specialized locations.
1. Introduction Recent growth theories attempt to explain the increase of disparities in development across the
regions of the world in the last decades and, consequently, identify the main variables that affect
economic growth. The common factor claimed to provide some explanation is notion of
increasing returns generated when productive activities concentrate in some locations. Romer
(1986), for example, attributes the occurrence of this phenomenon to knowledge spillovers,
1 We are grateful to Geraldo Edmundo Silva Junior (Federal University of Viçosa) for helpful discussion about the methodology and results, and to Eber Gonçalves and Tharcísio Alexandrino Caldeira for help in data collection.

Industrial Specialization. Employment and Wage Growth in Brazil 2
whereas Lucas (1988) promotes human capital and Grossman and Helpman (1994) suggest
technology as the main factors responsible for generating increasing returns.
The main explanation for increasing returns in the concentration of activities is that
geographical proximity generates externalities of a type that all firms enjoy. According to
Romer (1986), for example, where there are many firms, the knowledge can spread to from one
firm to another almost without cost. The investment in knowledge by each firm can improve the
profit of others, generating a process of increasing returns. As a result of this process some
locations, where the externalities are larger, grow faster than others.
In a recent study, Glaeser et al. (2001) addressed this issue by trying to answer the
following questions: why and how do industries and consequently cities grow, concentrating
productive activities; and what kind of productive arrangement is better to produce knowledge
spillovers, thus creating the conditions responsible for faster growth. More specifically, they
investigated whether this phenomenon occurs in more specialized cities, which produce the same
product, or in more diversified cities, which have many different productive activities. Their
work focuses on cities because they assumed that in cities the interaction among people is higher
than in rural areas and, as a consequence, the externalities generated by transmission of
information will also be higher.
The model was constructed based on three theories that deal with technological
externalities. The first one also aggregates the ideas of three authors and is termed Marshall-
Arrow-Romer (MAR) externalities.2 The concentration of one kind of industry encourages the
appearance of knowledge spillovers, through the intense competition among firms that try to spy
and imitate and through information flow carried by qualified workers. The second theory in the
model, addressed by Porter (1990), also argues that knowledge spillovers are more likely to
appear in specialized locations; the difference is that he emphasizes local competition as
important in the generation of innovation. The last theory incorporated into the model refers to
the approach of Jacobs (1969), who claimed that diversification, rather than specialization, is
important to foster fast growth in industry.
Glaeser et al (2001) focused on the largest industries of 170 cities in the USA3 in order to
check whether externalities are a permanent phenomenon. In this case, the externalities should
2 Marshall (1890), Arrow (1962) and Romer (1986). 3 Cities were constructed taking the 170 largest standard metropolitan areas (SMAs) in 1956.

Industrial Specialization. Employment and Wage Growth in Brazil 3
continue in the largest industries and not in the smallest industries, especially those that are still
in formation. The main results of their work were: (1) the local competition and diversification
were effective in explaining the employment growth in industry, but not specialization, from
1956 to 1987; and (2) the smaller size of firms, in comparison with the national average size of
firms in the same industry, contributed to faster growth.
Based on this research, the objective of this paper is to apply the Glaeser et al. (2001)
model to the analysis of Brazilian industrial growth after 1990, when many structural changes
started to occur in the economy of the country. More specifically, the paper will evaluate which
kind of geographical arrangement has been more effective in explaining the employment and
income growth –, more specialized regions or more diversified ones. Since, historically, the
southern half is more developed than the northern half of the country, the study analyzes
separately each of five Brazilian regions (North, Northeast, Southeast, South and Center-West)4.
One of the motivations in studying this issue derives from the fact that specialized areas
in some productive activity have been a major part of the policy focus of Brazilian governments
at all administrative levels. The governments have provided some type of support to firms in
order to strengthen the agglomeration tendencies, in hopes of promoting regional development.
It was hypothesized that clusters generate externalities that stimulate faster growth rates. In
Brazil, the Federal government, for example, maintains, in the Ministry of Development,
Industry and Trade, a group that it is responsible for studying productive agglomerations in order
to help the government make decisions about how to provide support to selective specialized
areas.
The other motivation is related to the increasing research about the interconnection
between productive agglomerations and regional development. There are many studies based on
different theoretical approaches, methodologies, foci of analysis, but most have a common goal,
which is to try to understand what is the effect of the concentration of productive activities of
some regions on their per capita income, productivity, growth rates of the production and so
forth. Just to cite some of the studies in this specific topic, the Economics Institute from
University of Rio de Janeiro analyzed many industrial agglomerations such as the
telecommunication sector in Campinas, one of the largest municipalities of São Paulo State
4 This is the largest territorial geographic division of Brazil.

Industrial Specialization. Employment and Wage Growth in Brazil 4
(Dória et al., 2000) and the case of FIAT in the Minas Gerais State (Lemos et al, 2000).5 In the
case of Brazil, disparities of regional income constitute one of the major problems of the country,
providing significant motivation for this type of research.
Following this introduction, the paper is organized as follows: section two identifies the
principal changes in the Brazilian economy in the 1990s that had an impact upon the industrial
structure of the country and cites some indicators of Brazilian regions performance; in section
three, the methodology in the Glaser et al (2001) model will be presented and the variables and
the data source used in this research will be defined. Section four presents the main results and
their analyses; and, finally, section five provides a summary and some concluding comments.
2. Brazilian economy and Brazilian industry in 1990s 2.1 Stabilization plan, privatization and fiscal war
The Brazilian industry was not globally competitive at the beginning of the 1990s. On the one
hand, the great problems faced by the Brazilian economy mainly in 1980s, such as foreign debt
and inflation, reduced the level of private and public investments. On the other hand, the
government policies were excessively protectionist, allowing many industries to survive without
modernizing their production process. According to Coutinho and Ferraz (1993), at the end of
1980s the main characteristics of Brazilian industry were: old production process; many firms in
each kind of industry with average size below the international average; firms producing the
whole productive chain, and so on. This combination of characteristics resulted in an old-
fashioned, expensive industrial structure that often produced products of inferior quality.
This was the landscape of Brazilian industry when the Brazilian economy started to
change in the beginning of 1990s. One of the main causes of the transformation process was the
greater exposure of the economy to international trade by imposition of World Trade
Organization mandates and by changes in economic policy implemented by the newly elected
president who was identified more with liberal ideas. The Collor Government implemented a
plan named Industrial Policy and Foreign Trade, which had objectives such as to stimulate
competition and to increase competitiveness in order to face the new worldwide economic
environment. Foreign trade policy changed with the establishment of a schedule for reducing the
5 Many others papers can be cite such as Suzigan et al. (2001), Crocco et. al. (2003).

Industrial Specialization. Employment and Wage Growth in Brazil 5
import tariff in the short term, thereby decreasing the protection of the national products (Castro,
2005).
There were many criticisms about the economic policy of this government and when the vice-
president took office as the new president (President Collor was forced to resign at the end of
1992), the foreign trade policy changed in many aspects because the abrupt reduction of the
import tariffs started a process of deindustrialization in the country. However the main point to
emphasize here is the change in public sentiment about the large and increasing protection that
was provided to industries since the acceleration of the industrialization process after 1930,
which caused lack of innovation in productive sectors within Brazil. In the beginning of 1990s,
Brazil was not in a condition to compete in the world market in most industrial sectors. In order
to face the higher competition, the private entrepreneurs reacted to this new situation and the
process of industrial restructuring began. After investment fell to a minimum level in the end of
1992 (13.4% of the GDP), it started to increase again. Most of the investments were
accomplished through the importation of machinery and equipment. Capital goods imports
increased by 48% in 1993, 43% in 1994 and 58% in 1995. At the same time, the foreign direct
investment increased from US$ 877 million in 1993 to more than US$ 2,2 billion in 1994
(Pinheiro, 1995, pp.23-24; FGV, 1996 and Coutinho & Ferraz, 1993).
The changes were deepened with the privatization process of state firms, which started at
the end of 1980s and accelerated with the implementation of the stabilization plan, Plano Real in
1994. The major share of international money that entered in this process to invest in
government firms helped to diminish the trade balance. The industrial restructuring has
continued with the entry of new capital and new technology, modernizing the production
process, improving the quality of goods, producing new products and increasing productivity
(Pinheiro and Fukasaku, 2000; Castro, 2005).
Another change that can be mentioned is the fiscal war6 phenomenon that started in 1989,
after the new Constitution from 1988 that gave more autonomy to Brazilian states. The state
governors have provided different combinations of fiscal and credit subsidies in order to attract
investments and, consequently, to promote the development of their states.7 Private firms, in
6 The fiscal war constitutes a concession of fiscal and credit subsidies in order to attract investments to the regions. 7 Eight states out 27 were highlighted by the government development bank (BNDES) as the more aggressive in fiscal war: Rio Grande do Sul e Paraná (South Region), Espírito Santo (Southeast Region), Goiás (Center-West Region) e Bahia, Pernambuco e Ceará (Northeast Region).

Industrial Specialization. Employment and Wage Growth in Brazil 6
turn, have chosen the municipalities according specific criteria such as the presence of
infrastructure in transportation, in energy and others; the presence of qualified or cheap
manpower and so on. In many cases the investments have gone to cities in some specific
industry, which has established or enhanced the specialization of these industries.
Summing up, after 1990s Brazilian industry has presented many structural
transformations. Vermulm (1999) pointed out five key changes that occurred in this decade.
The first change was the reduction of the participation of industrial value-added in the GDP. In
fact, as Vermulm emphasized, the industrial value-added in the Brazilian GDP has decreased
during the 1990s, from 32.3% in 1989 to 20.7% in1998. However, after this year the industrial
value-added has increased again to 24.2% in 2005. This result may have been influenced by the
favorable performance of the export of agro industry products.
The second tendency was the change in the industrial structure in terms of participation
of each industrial category according to their use, in which durable goods increased more than
any other category, from 1980 to 1997. The data obtained from IBGE (2006) from 1991 to
20038 confirm this tendency and durable goods increased by about 71%. The production of both
capital goods and intermediate goods increased 37.4% and 37.3% respectively. Finally, semi-
durable and non-durable goods showed very low rates of growth, only 4.2% in this period.
The other tendency was the change in the import and export structure. The import
coefficient (imports divided by total consumption) in high-tech products, from a technological,
economic and foreign trade point of view, registered higher growth in 1990s than traditional
products. On the export side, the opposite situation occurred – the export coefficient of products
derived from natural resources presented a higher rate of growth.
The fourth change may be considered the reverse of import substitution whereby there
was an increase in the use of foreign parts products in Brazil production; this occurred because
locally produced components were not competitive. Finally, according Vermulm (1999), the
industrial restructuring process has increased labor productivity. Changes such as firms’ de-
verticalization (or what Jones and Kierzkowski 2005 would refer to as the fragmentation of
production, in which production would be broken into components spread across many
establishments), higher import of parts, and the introduction of technical and organizational
innovations, increased the product per worker.
8IBGE – Monthly Industrial Research, 2006.
Industrial Specialization. Employment and Wage Growth in Brazil 7
This restructuring process has made industry more efficient and competitive and has also
transformed the industrial landscape in terms of participation of each kind of industry in the total
industrial production value, geographical relocation of industries, productivity, as well as other
changes.
Sousa (2002) verified that there was a decentralization process of Brazilian industry
across the country after the 1970s. Two states in the Southeast Region which concentrated
almost 75% of gross product – São Paulo (58%) and Rio de Janeiro (15.6%) – in 1970, showed a
greater decrease in their share; on the other hand, most other states increased their participation,
especially those in the South Region. This process was more evident before 1985. After this
year, the rate of decentralization decreased among the states. In the case of São Paulo, this
phenomenon can be explained by the strong migration of industries from the capital of the state
to its interior.
Azevedo and Toneto (2001) confirmed this tendency, showing that employment in the
1990s migrated across regions of the country, implying a decentralization process. Employment
in intensive labor sectors moved to regions that paid lower wages; employment in intensive
natural resource sectors migrated to locations that were abundant in this factor; and finally,
employment in intensive capital sectors moved to states near São Paulo, such as Paraná and
Minas Gerais. There was also migration of employment inside São Paulo State. Sabóia (2001)
verified the same movement of jobs, observing that some newer regions such as the Center-West
as well as some states of Northeast and South Regions increased their participation in national
employment as well. Public policies were very important in influencing regional relocation
because they provided firms with the incentives and subsidies to move to particular states. Many
policies sought to attract firms that produced similar goods, such as footwear, garments and so
on. Summing up, the alterations, which occurred in Brazilian industry during the 1990s
contributed to changes in productive structure and location.
2.2 Performance of Brazilian Regions
Brazil is usually divided into five major regions which aggregate a different number of
states9, as can be seen in figure 1. The Northeast and North Regions are the poorest parts of the
9 There are 26 Brazilian states distributed as follow: seven in the North Region; nine in the Northeast; four in the Southeast; three in the South; and three in the Center West Region. There is also a Federal District, the capital of Brazil.

Industrial Specialization. Employment and Wage Growth in Brazil 8
country, concentrating more than 35% of the Brazilian population but employing only 15% of
the country’s industrial employment. Most of these employees work in traditional sectors such
as food, garments, textile, furniture, footwear, and so on, that constitute about 65% of the total
industrial jobs in both regions. On the other hand, in high-tech industries such as machine and
equipment, computers, telecommunications, electric, electronic, automobile and others, the
participation is very low, 2.5% in the North and 7% in the Northeast Region (IBGE, 2006).
Figure 1: Brazilian Regions
The Center-West Region has been increasing its agribusiness sector due to abundant and
fertile land and favorable climatic conditions. It concentrates almost 7% of the Brazilian
population but only 3.3% of Brazilian industrial GDP. The average wage in the 1990s recorded
one of the largest rates of increase in the country, behind only the South Region. However, the

Industrial Specialization. Employment and Wage Growth in Brazil 9
participation of its high-tech industries is very low, 6.8%, while the share of traditional industry
is almost 60%.
Finally, the Southeast and South are the most industrialized and most technologically
developed regions of Brazil, accounting for about 43% and 15% of nationwide population and
almost 48.5% and 29% of industrial GDP, respectively. The Southeast Region employed 32% of
total industrial workers in traditional sectors and 11% in high-tech sectors; while the shares for
the South Region were 61% and 8,45%, respectively. Considering national participation, these
two regions combined account for 86.7% of the jobs in high-tech industries in the country.
As the table 1 shows, during the 1990s total employment decreased, significantly, by
about 13%. At the regional level, the Center-West Region showed significant growth in
employment (110%) while two regions – North (2%) and Northeast (0.1%) – had smaller growth
rates and the Southeast and the South experienced decreased growth rates – 25% and 0.7%,
respectively. The Southeast Region registered a large reduction in employment due to industrial
restructuring, which used labor-saving technology and because of the migration of employment
to other regions of the country. At any rate, considering the nationwide labor market, the
tendency was for a decrease in the number of jobs due to the adoption of labor-saving
technology.
<<insert table 1 here>>
For a different period, from 1996 to 2003, the data show that participation in Brazilian
industrial employment increased in all regions except in the Southeast, confirming the continuity
of the process of productive restructuring and the process of relocation of industrial activities.
Further, average wages increased substantially during this decade (1990s) in all regions,
according to the IBGE microdata. The largest increase occurred in the South Region and the
smallest was registered in the Southeast.
3. Methodology 3.1 Knowledge Spillovers Model
Glaeser et al. (2001) constructed their model aggregating the main factors that cause
externalities from the three models mentioned above: Marshall-Arrow-Romer, Jacobs and Porter.
To construct this model, they started from the following function – Atf(lt) – which represents a

Industrial Specialization. Employment and Wage Growth in Brazil 10
production function of output of one firm of one industry in a given location, where At represents
changes in technology and changes in price at time t and lt is labor input at time t. This model
abstracts from capital inputs because they do not have a measure of total productivity. The
variables technology, prices and wages are taken as given and each firm maximizes [AtfI(lt) –
wtlt] and the marginal product of labor is equal to wages:
Atf’(lt)) = wr (1)
Rewriting (1) to transform it into growth rates we have:
( )( ) ⎥⎦
⎤⎢⎣
⎡−⎟⎟
⎠
⎞⎜⎜⎝
⎛=⎟⎟
⎠
⎞⎜⎜⎝
⎛ +++
t
t
t
t
t
t
lflf
ww
AA
´´
logloglog 111 (2)
As long as the technology At is assumed to have national and local components, the growth rate
of technology can be defined as follows:
⎟⎟⎠
⎞⎜⎜⎝
⎛+⎟
⎟⎠
⎞⎜⎜⎝
⎛=⎟⎟
⎠
⎞⎜⎜⎝
⎛ +++
tnacional
tnacional
tlocal
tlocal
t
t
AA
AA
AA
,
1,
,
1,1 logloglog (3)
According to the model, the growth of national technology captures changes in the price
of the product as well as in the technology of the industry, while local technology captures
technological externalities in this industry in the city or region. The latter can be written as:
, 11
,
log g (specialization, local monopoly, diversity, initial conditions) + local tt
local t
Ae
A+
+
⎛ ⎞=⎜ ⎟⎜ ⎟
⎝ ⎠ (4)
In this initial function, they aggregate the effects of specialization, local competition and
diversity in the development of the cities. Specialization measures if there is a particular
industry that is concentrated in a city, which is part of MAR and Porter models; local monopoly
is related to the firm size of the most important industries in a city and is an important variable
for Porter; diversity measures the opposite of specialization or, in other words, if there are many
kinds of industrial sectors in a city, (derived from Jacobs´ model); and, finally, the initial
conditions are related to initial wages, employment and so on.
The final equation consider that f(l) = l1- α, 0 < α < 1 and combines the equations (2), (3)
and (4). After some mathematical manipulations, the final equation10 is as follows:
10 All steps for constructing the model are in the cited paper.
Industrial Specialization. Employment and Wage Growth in Brazil 11
, 11 1
,
1
log log log
+ (specialization, local monopoly, diversity, initial conditions) +
nacional tt t
t t nacional t
t
Al wl w A
g e
α ++ +
+
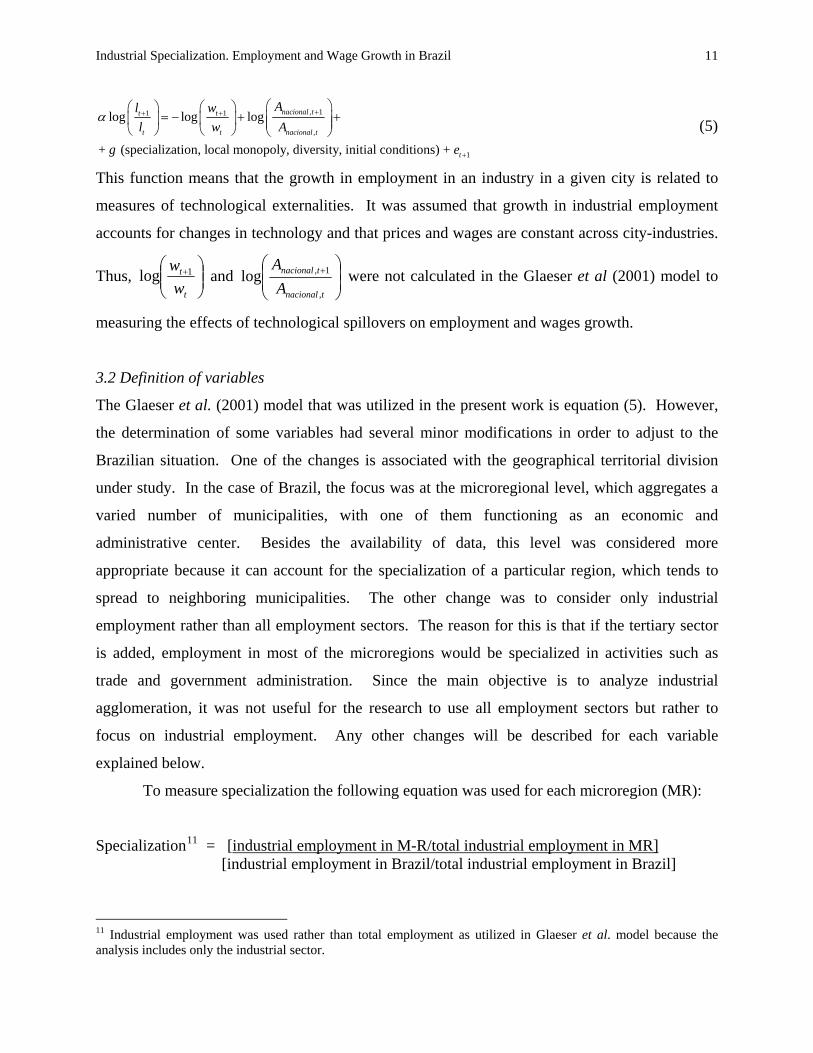
⎛ ⎞⎛ ⎞ ⎛ ⎞= − + +⎜ ⎟⎜ ⎟ ⎜ ⎟ ⎜ ⎟⎝ ⎠ ⎝ ⎠ ⎝ ⎠ (5)
This function means that the growth in employment in an industry in a given city is related to
measures of technological externalities. It was assumed that growth in industrial employment
accounts for changes in technology and that prices and wages are constant across city-industries.
Thus, ⎟⎟⎠
⎞⎜⎜⎝
⎛ +
t
t
ww 1log and ⎟
⎟⎠
⎞⎜⎜⎝
⎛ +
tnacional
tnacional
AA
,
1,log were not calculated in the Glaeser et al (2001) model to
measuring the effects of technological spillovers on employment and wages growth.
3.2 Definition of variables
The Glaeser et al. (2001) model that was utilized in the present work is equation (5). However,
the determination of some variables had several minor modifications in order to adjust to the
Brazilian situation. One of the changes is associated with the geographical territorial division
under study. In the case of Brazil, the focus was at the microregional level, which aggregates a
varied number of municipalities, with one of them functioning as an economic and
administrative center. Besides the availability of data, this level was considered more
appropriate because it can account for the specialization of a particular region, which tends to
spread to neighboring municipalities. The other change was to consider only industrial
employment rather than all employment sectors. The reason for this is that if the tertiary sector
is added, employment in most of the microregions would be specialized in activities such as
trade and government administration. Since the main objective is to analyze industrial
agglomeration, it was not useful for the research to use all employment sectors but rather to
focus on industrial employment. Any other changes will be described for each variable
explained below.
To measure specialization the following equation was used for each microregion (MR):
Specialization11 = [industrial employment in M-R/total industrial employment in MR] [industrial employment in Brazil/total industrial employment in Brazil]
11 Industrial employment was used rather than total employment as utilized in Glaeser et al. model because the analysis includes only the industrial sector.

Industrial Specialization. Employment and Wage Growth in Brazil 12
This variable shows the importance of particular industries in a city. A value greater than
one indicates that the microregion is more specialized in a given industry than the average of the
country in the same industry. To verify the degree of specialization, the five largest industries12
were taken for each microregion.
Local monopoly was defined as follows:
Competition = [firms in microregional industry/workers in MR industry] [firms in Brazilian industry/workers in Brazil industry]
In this case, the interpretation is that the more competitive local environment is related to
a value greater than one. However, this paper will not consider this variable because the data are
not reliable.
Finally, the diversity in Glaeser et al. (2001) model was taken as the participation of the
six largest industries minus one in a city in the total industry in a city. In our case, the diversity
was adapted as follow:
Diversity = employment of the largest industries in a MR minus one total industry employment in a MR
To calculate this variable, we used the same five largest industries that were used to
determine the specialization indeed. For each microregion, there are five diversity indices; in
calculating each one, one out of the five largest industries was excluded each time. 13
The initial conditions utilized in this study were the same utilized by Glaeser et al.
(2001): log of Brazilian employment in 2000/Brazilian employment in 1991 in the industries out
of top five; employment in the 5 largest industries in 1991; and average wage in the 5 largest
industries in 1991. The regional impacts were captured a little differently from the Glaser el al.
(2001) model; they included one dummy for the South region of USA. In our case, because of
the great disparities among the regions, we used n-1 dummies variables in the model for n
12 Glaeser et al. took the six largest cities. We used five because there were not six industries in many microregions. 13 Suppose, for example, that in a given microregion the five largest industries are furniture, garment, footwear, textile and food. To determining the first index it has to consider the employment of garment, footwear, textile and food except furniture; the second one it has to take furniture, footwear, textile and food except garment, and so on.

Industrial Specialization. Employment and Wage Growth in Brazil 13
regions. This was important to account for changes at the microregion level and to observe
differences across regions associated with their degree of development.
The model was run in two ways. First, we used nationwide microregion data in order to
analyze the effect of independent variables upon the whole country. Then we put four dummies
in four of the five regions,14 alternating the region that was excluded. Five different results were
obtained. Secondly, we ran the model with all microregion data and only one regional dummy
for each running in order to obtain five results, one for each region. This procedure was used to
check the results of the first model mentioned above. Thus, a total of 20 runs were conducted,
ten for specialization and ten for diversification.
3.3 The data
The data of employment and income were extracted from microdata of the Demographic Census
organized by the Brazilian Institute of Geography and Statistics (IBGE) for two years, 1991 and
2000. The regional level utilized for the research was the microregion, which aggregates several
municipalities. This level was chosen in order to verify if industrial agglomerations that include
many municipalities contributed more than other locations to employment and wage growth.
Because there are no recent available data for the microregion level, the final year was 2000,
when the last Census was taken. There are 558 microregions in the country. Then the initial
sample constituted by 2790 observations, 5 for each microregion. After the outliers were
excluded, the final sample had 2672 observations for each variable.
4. The Results Two tables, which summarize the principal results, were constructed as follows: table 2 reveals
the impact of independent variables on employment variations and while table 3 examines the
impact on wages variations. It was somewhat difficult to decide how to construct both tables
because we obtained five results with four dummies (four out of five regions) and five results
with only one dummy (one for each region) for specialization. We obtained the same number of
results for diversification. However, after analyzing all of them, we could observe many
consistent results, which means that the same logic was repeated in all functions. The most
representative function of employment growth was that which considered four dummies for the 14 It is necessary in order to not obtain the singular matrix.

Industrial Specialization. Employment and Wage Growth in Brazil 14
following regions15: North, Northeast, Southeast and South. Taking away the dummy of Center-
West Region did not alter the main results. This region had the lowest participation in Brazilian
industrial GDP in 2000, about 3.4%.
<<insert table 2 here>>
The table 2 shows that the initial conditions variables – log of variation of Brazilian
employment in the period 1991-2000 in the industries out of top five and employment in the five
largest industries in the initial period (1991) –, had no influence upon employment variation in
the Brazilian microregion as a whole nor on any particular region, neither for specialization nor
for diversity. Given these results, the dummies of the regions were not presented in the table.
However the average wages in the initial period (1991) had a significant influence on
explaining changes in employment in the 1990s. It is interesting to note that, in both columns,
the nationwide result has a positive signal, which implies that the higher the initial wages, the
higher the employment growth. However, in the Southeast Region, which was the only one that
showed a consistent significance in the model, the sign was negative, indicating that in Southeast
microregions, high wages had a negative impact upon employment. We can infer that this
opposite tendency in relation to other Brazilian regions is due to the degree of industrial
development and concentration. It is the most developed region with the highest wages in the
country (table 1) that may be related to the very well organized and powerful trade unions. With
the increased exposure of the Brazilian economy to international trade and the fiscal wars, firms
migrated to other regions in order to gain competitive advantages. In the function in which the
dummy of the Southeast was taken out, the wages of four regions registered a positive influence
upon employment (table 4, Appendix A). The interpretation of this phenomenon may be
ascribed to the fact that the firms that migrated from the Southeast to other regions, established
in locations where the wages level were lower than those of the Southeast, though the workers in
these other regions were sufficiently qualified for the same tasks.
With reference to specialization and diversity, both contributed to employment variation
when the entire country was considered. However the signs were reversed. Specialization had a
negative influence upon employment in the 1990s, while diversity had a positive influence.
15 All of 10 functions running presented the same consistent result.

Industrial Specialization. Employment and Wage Growth in Brazil 15
Initially, the results could be interpreted to imply that diversified locations were more
effective in creating new jobs; then the government would have to stimulate investments in these
regions. However, in the regional analysis, different influences of specialization and diversity
can be seen depending upon of the region. Related to specialization, the results were significant
for two regions, but with opposite signs: in the Northeast Region, specialization had a negative
impact on employment variation in the 1990s while in the South, it had a positive impact. This
occurred while total employment increased in the Northeast Region while decreasing in the
South.16 We can conclude that in the first region employment was created in non-specialized
microregions while in the specialized ones, the tendency was to decrease the number of jobs. On
the other hand, in the South Region where there are many consolidated industrial clusters, and
these locations were able to attract many investments, although most probably, the productivity
has increased more in these specialized microregions than in others. We can suggest some
reasons for this employment tendency. For the most of the country in specialized locations, the
productivity gains could have been more intensive than in other locations including the South
Region. However, in the latter, the consolidated clusters created a larger number of new jobs.
In relation to diversity, two regions presented a significant result: in the North Region the
sign was positive, like the nationwide result, and in the South the sign was negative. This
outcome reinforces the pattern of industrial concentration in the South Region, since diversity
had a negative impact upon employment during the 1990s.
Table 3 shows the impact of the same variables presented in the table 2 upon the wages
growth, but now dummies for the Northeast, Southeast, South and Center-West Regions were
considered. Now the North Region was omitted as a better option because it did not change the
main results. This region presents the second smallest industrial Brazilian GDP, corresponding
to 4.5%, in 2000.
<<insert table 3 here>>
As in the case of employment, initial conditions presented similar results. The log of
employment variation in the period 1991-2000 in the industries not among the five largest and
employment in the five largest industries, in 1991, did not have any influence upon the wage
variation in 1990s. Therefore, the dummies of these variables were not included in the table.
16 See Table 1.

Industrial Specialization. Employment and Wage Growth in Brazil 16
In relation to wages in the beginning of the period of the study, a consistent outcome was
obtained because the values presented for the whole country and for the Southeast Region – as in
the employment function – were significant in explaining the variation in the wages in 1990s.
Now, the sign was negative for all Brazilian microregions and positive for the Southeast. It
means that the high initial wages had a negative impact for the country, except in this specific
region. According to table 2, the higher initial wages, the lower employment growth in the
Southeast; both results suggest that in the most developed region of the country, the industrial
restructuring substantially augmented industrial productivity - fewer workers but with higher
wages.
On the contrary, for the other four regions, the higher number of workers was related to
lower wages, which can be confirmed with the function in which the Southeast Region is
omitted. The coefficients for each region were significant and presented a negative sign (table 4,
Appendix A). For these regions, the outcome indicated that the low initial wages locations
attracted firms to invest and to create jobs there. The wages in this case represented a factor of
competitiveness gain for firms for the most of the country.
Specialization and diversity were also significant in explaining the variation in wages in
1990s. Their influences were the opposite from those found for employment growth. Now
specialization presented a positive impact on wages while diversity had a negative influence. It
means that for the whole country, the specialized microregions tended to augment the wages and
to diminish the employment. On the contrary, the diversified microregions tended to decrease
the wages and to increase the employment. It confirms the inference that at a nationwide level,
in specialized microregions, the productivity increased more than in diversified because in the
first fewer workers are receiving higher wages and in the latter many workers are receiving
lower wages.
However, in the regional analysis, this interpretation is valid for only one region, the
Northeast. In this region, specialization had a positive influence upon wages and a negative
influence upon employment in the 1990s. It suggests that the specialized microregions in
Northeast tended to decrease their employment but the workers had increased wages. It can be
the result of the migration of some industries from the southern part of the country, due to the
fiscal war, concentrating their new investments in some locations. In contrast, the industrial
diversity in 1991 had a negative impact on the wages variation in the Northeast Region but none

Industrial Specialization. Employment and Wage Growth in Brazil 17
on employment. At any rate, we can infer that diversified microregions created more jobs than
the specialized one and with low remuneration because the employment in Northeast has
increased almost 2,5%, according table 1.
5. Summary and Conclusion The Glaeser et al. (2001) model was adapted for the Brazilian case with the purpose of verifying
if the specialized microregions in some kinds of industries had more influence upon industrial
employment and wage growth than the more diversified ones. Many changes occurred in
Brazilian industry in the 1990s, such as the restructuring process, which generated the rise in
productivity and industrial relocation.
The main results of this research study can be summarized as follow: (1) the log of the
variation of Brazilian employment in the period 1991-2000 in industries not among the top five
and the initial employment in the five largest industries were not significant in explaining
changes in employment and wages in the 1990s; (2) the initial wages were the only significant
variable among the initial conditions, which influenced the employment and the wages
variations, in a positive and negative way, respectively; (3) analyzed nationwide, specialization
had a negative impact upon employment and a positive impact upon wages; (4) diversity had an
impact opposite to that of specialization, which means a positive effect on employment and
negative on wages; and (5) the regional analysis showed that there are many differences among
the regions of the country, which were reflected in the different influences of independent
variables in the functions, mainly specialization and diversity.
In the most industrialized regions of the country, employment decreased in 1990s, 25% in
the Southeast and 0.7% in the South. Among those variables selected, the only one that
influenced the Southeast was the initial wages, which had a negative impact upon employment
and a positive impact upon wages. Both effects together may indicate two changes: the first one
is that industrial restructuring increased productivity, decreasing employment and increasing
wages. The second change is the relocation process in which many firms migrated to locations
where wages were lower, within the region or to other regions. This process occurred mainly in
São Paulo State, the most industrialized state in Brazil, where many firms moved from the
Metropolitan Area, where the wages were high, largely due to the presence of strong and

Industrial Specialization. Employment and Wage Growth in Brazil 18
organized trade unions, and where infrastructure congestion translated into more expensive
transportation costs.
In the South, the important result was related to the influence of specialization and
diversity upon employment, positive and negative, respectively. This region is known as
specialized in many industries such as furniture, footwear, garment, agribusiness, textile, metal-
mechanic and so on. Although total employment in the region decreased 0.7%, specialized
locations attracted more investments than diversified ones. The consequence was increased
employment in the former and decreased employment in the latter.
In the poorest part of the country, the Northeast and North regions, there were several
important effects of independent variables upon employment and wages in the 1990s. With
reference to Northeast Region, the results show that initial wages, specialization and diversity
had a significant impact upon the dependent variables. Contrary to the results in the Southeast
Region, initial wages had a negative effect on wage growth. Specialization had a positive and
diversity a negative influence on wages in the 1990s. Specialization also had an impact on
employment growth, but negatively. The Northeast received several types of industries, mainly
from the southern part of the country, the industrial relocation due in large part to low wages.
Interpreting these results as a whole we can infer: (1) firms chose locations in Northeast Region,
which paid lower wages; (2) firms specialized in a particular industry, such as leather and
footwear, textile and agribusiness, migrated to some locations causing a reduction in the
employment, due to the increase of the productivity, but augmented the wages; (3) diversified
microregions absorbed a larger number of employees but paying lower wages. In the case of the
North Region, only diversity had a positive impact upon employment growth. Finally, the
Center-West is a region that is developing rapidly due to agribusiness. However for this study,
none of the variables had any influence upon employment and wage growth.
The main objective of this paper was to verify the effect of industrial agglomeration on
employment and wages in a decade in which this type of concentration became important in
fostering development. It was assumed that this kind of geographical arrangement is more
propitious than others to generate increasing returns conducive to more rapid economic growth.
The results showed that changes, which occurred in the Brazilian industrial sector, in the 1990s,
influenced the impact of specialization and diversity upon employment and wages, and that there
are many differences across regions. On the whole, the outcome showed that the specialized

Industrial Specialization. Employment and Wage Growth in Brazil 19
microregion was important in fostering employment in a region where the clusters were
consolidated. In a region where the clusters formation initiated in the 1990s, the tendency was to
decrease the employment and increase the wages, indicating a process of productivity
augmentation. The implication is that mature industrial concentrations can foster growth more
than other locations at least in Brazilian case, what can confirm our principal hypothesis about
presence of increasing returns in specialized locations.
This result suggests future research, which should focus on particular Brazilian regions
and for a more extensive period, in order to obtain a more in-depth understanding of the effects
of agglomeration on economic development. A longer time period would also provide the basis
for understanding the degree to which the results were the outcomes of Plano Real or longer run
forces that are continuing to reshape the Brazilian spatial economy.
References
Arrow, K.J. (1962) “The Economic Implications of Learning by Doing,” The Review of Economic Studies, 29, 155-73.
Azevedo, P.F.; Toneto J.R. (1994) “Relocalização do emprego industrial formal no Brasil na década de 90,” Pesquisa e Planejamento Econômico, 31, 153-186.
IBGE (Brazilian Institute of Geography and Statistics). Census – Microdata, 1991 and 2000.
____________________________________________ Monthly Industrial Research, 2006. http://www.sidra.ibge.gov.br/bda/acervo/acervo1.asp?e=p&t=2&z=t&o=3.
Castro, L.B. de. (2005) “Privatização, abertura e desindexação: a primeira metade dos anos 90 (1990-1994).” In: GIAMBIAGI, F; VILLELA, A.; CASTRO, L. B. e HERMANN, J. (Eds.). Economia Brasileira Contemporânea. Rio de Janeiro: Elsevier, pp. 141-165.
Coutinho, L., Ferraz, J.C. (Eds.). (1994) Estudo da competitividade da indústria brasileira. São Paulo: Papirus.
Crocco, M., Santos, F., Simões, R. (2003) “Arranjos produtivos locais informais: uma análise de componentes principais para Nova Serrana e Ubá – Minas Gerais,” Revista Ensaios (FEE). Porto Alegre, 24, pp..
Glaeser, E. L., Kallal, H. D, Scheinkman, J.A., Shleifer, A. (1992) “Growth in cities,” Journal of Political Economy, 100, 1126-1152.

Industrial Specialization. Employment and Wage Growth in Brazil 20
Grossman, G.M. and Helpman, E. (1994) “Endogenous Innovation in the Theory of Growth,” Journal of Economic Perspectives, 8, 23-44.
Jacobs, J. (1969) The Economy of Cities. New York: Vintage.
Jones, R.W. and H. Kierzkowski (2005) “International fragmentation and the new economic geography,” North American Journal of Economics and Finance, 16, 1-10.
Lemons, M., Diniz. C., Santos, F., Crocco, M., Camargo, M. (2000) “O arranjo produtivo da Rede FIAT de fornecedores.” In: J.E. Cassiolato and H.M.M Lastres (Eds.). Arranjos e sistemas produtivos locais e as novas políticas de desenvolvimento industrial e tecnológico. Technique Note, nº 15, IE/UFRJ, Rio de Janeiro.
Lucas, R.E. (1988) “On The Mechanics of Economic Development.” In: G.R. Becker and E. Burmeister. (eds.). Growth Theory. Hants, England, Elgar.
Marshall, A. (1890) Principles of Economics. London: Macmillan,.
Pinheiro, A.C. and Fukasaku, K. (2000) A privatização no Brasil: o caso dos serviços de utilidade pública. Rio de Janeiro: BNDES.
Porter, M.E. (1990) The competitive advantage of nations. New York: Free Press.
Porto, J. Cano, N., Silva, A. (2000) “Arranjo produtivo de telecomunicações de Campinas – SP.” In: J.E. Cassiolato and H.M.M Lastres. (Eds.). Arranjos e sistemas produtivos locais e as novas políticas de desenvolvimento industrial e tecnológico. Rio de Janeiro, IE/UFRJ, Nota Técnica n° 16.
Romer, P. (1994) “Increasing returns and long-run growth,” Journal of Political Economy, 94, 1002-37.
Sabóia, J. (2001) “A dinâmica da descentralização industrial no Brasil,” Texto para Discussão, n. 452, UFRJ.
Souza, F.L. (2002) “A localização da indústria de transformação brasileira nas últimas décadas,” Texto para Discussão 95, BNDES. Rio de Janeiro.
Suzigan, W., Furtado, J., Garcia, R., Sampaio, S.E.K. (2001) “Aglomerações industriais no Estado de São Paulo,” Economia Aplicada, 5, 695-717.
Vermulm, R. (1999) “Estrutura industrial brasileira.” In: C. Costa. and C. Arruda. (eds.) Em busca do futuro: a competitividade no Brasil. Rio de Janeiro: Campus.

Industrial Specialization. Employment and Wage Growth in Brazil 21
Table 1. Employment and average wages in Brazilian Regions – 1991-2000
Variables North Northeast Southeast South Center-West
Total
Employment -1991
302.599 861.159 3.015.369 1.007.728 274.169 5.461.024
Employment -2000
308.571 881.845 2.263.809 1.000.611 301.998 4.756.834
Variation (%) 1,97 2,40 - 25 - 0,7 10,15 - 12,89 Average Wage 1991
106,11 70,27 230,75 92,00 96,06 -
Average Wage 2000
406,94 342,97 730,89 535,46 521,50 -
Variation (%) 383 488 316 582 542 - Source: IBGE, Microdata, 1991 and 2000.

Industrial Specialization. Employment and Wage Growth in Brazil 22
Table 2. Effects of specialization and diversity upon employment growth in the five largest industries in Brazilian microregions – 1991-2000
Variables Coefficients - specialization17
Coefficients - diversity
Constant 0,721635 (3.336145)*
0,599926 (2,700996)*
Log (Brazilian employment in 2000/Brazilian employment in 1991) in the industries out of top five
0,222213 (1,043514)NS
0,192294 (0,908046)NS
Employment in the 5 largest industries in 1991 0,000006 (0,196685)NS
0,000003 (0,478872)NS
Average wage in the 5 largest industries in 1991 0,000450 (2,127405)**
0,000432 (1,974813)**
Dummy N in average wage in the 5 largest industries in 1991
0,000011 (0,028059)NS
-0,000051 (-0,130817)NS
Dummy NE in average wage in the 5 largest industries in 1991
-0,000133 (-0,501355)NS
0,000098 (-0,361938)NS
Dummy SE in average wage in the 5 largest industries in 1991
-0,000425 (-1,993263)**
-0,000405 (-1,835528)***
Dummy S in average wage in the 5 largest industries in 1991
-0,000046 (-0,173868)NS
-0,000012 (-0,044010)NS
Industrial specialization in 1991 -0,010755 (-2,453537)**
Dummy N in industrial specialization in 1991 -0,009175 (-1,198230)NS
Dummy NE in industrial specialization in 1991 -0,030134 (-2,671577)*
Dummy SE in industrial specialization in 1991 0,000452 (0,078107)NS
Dummy S in industrial specialization in 1991 0,012200 (2,703024)**
Industrial diversity em 1991 0,212864 (2,762486)*
Dummy N in industrial diversity in 1991 0,197789 (1,712123)***
Dummy NE in industrial diversity in 1991 -0,017713 (-0,188683)NS
Dummy SE in industrial diversity in 1991 -0,067583 (-0,712974)NS
Dummy S in industrial diversity in 1991 -0,312573 (-3,206091)*
Teste F 6,257422 (0,000000)
7,390550 (0,000000)
17 Significance Level: * - 1%; ** - 5%; *** - 10%..

Industrial Specialization. Employment and Wage Growth in Brazil 23
Table 3. Effect of specialization and diversity upon the wage growth in the 5 largest industries of Brazilian microregion – 1991-2000
Variáveis Coefficients - specialization18
Coefficients - diversity
Constant 1,553701 (9,398959)*
1,572369 (8,720332)*
Log (Brazilian employment in 2000/Brazilian employment in 1991) in the industries out of top five
-0,064701 (-0391870)NS
-0,058577 (-0,352825)NS
Employment in the 5 largest industries in 1991 -0,000001 (-1,112319)NS
0,0000001 (0,070206)NS
Average wage in the 5 largest industries in 1991
-0,001429 (-4,958698)*
-0,001413 (-5,085885)*
Dummy NE in average wage in the 5 largest industries in 1991
-0,000060 (-0,162728)NS
-0,000101 (-0,274265)NS
Dummy SE in average wage in the 5 largest industries in 1991
0,000874 (2,978685)*
0,000855 (3,022039)**
Dummy S in average wage in the 5 largest industries in 1991
0,000213 (0,592795)NS
0,000207 (0,591094)NS
Dummy WC in average wage in the 5 largest industries in 1991
-0,000019 (-0,050575)NS
-0,000042 (-0,113649)NS
Industrial specialization in 1991 0,004428 (2,068989)**
Dummy NE in industrial specialization in 1991 0,049155 (2,441878)*
Dummy SE in industrial specialization in 1991 -0,001500 (-0,457486)NS
Dummy S in industrial specialization in 1991 -0,002241 (-0,873428)NS
Dummy WC in industrial specialization in 1991
-0,004221 (-1,474642)NS
Industrial diversity em 1991 -0,031810 (-0,673508)NS
Dummy NE in industrial diversity in 1991 -0,197618 (-2,302319)**
Dummy SE in industrial diversity in 1991 0,033599 (0,571377)NS
Dummy S in industrial diversity in 1991 -0,039011 (-0,632554)NS
Dummy C-W in industrial diversity in 1991 0,065397 (0,825536)NS
Test F 94,70248 (0,000000)
88,16649 (0,000000)
18 Significance Level: * - 1%; **- 5%; *** - 10%.

Industrial Specialization. Employment and Wage Growth in Brazil 24
APPENDIX A
Table 4. Impact of average wage in the 5 largest industries in 1991 without dummy for the Southeast Region upon the employment and wage growth
Variables Coefficients – specialization
Coefficients – diversity
EMPLOYMENT
Average wage in the 5 largest industries in 1991
0,000027 1,024939 NS
0,000025 0,933611NS
Dummy N in average wage in the 5 largest industries in 1991
0,000354 1,095947 NS
0,000437 1,280621NS
Dummy NE in average wage in the 5 largest industries in 1991
0,000306 1,856766***
0,000293 1,821667***
Dummy S in average wage in the 5 largest industries in 1991
0,000393 2,428694**
0,000379 2,343355**
Dummy WC in average wage in the 5 largest industries in 1991
0,000405 1,835528***
0,000425 1,993263**
WAGES
Average wage in the 5 largest
industries in 1991 -0,000555 -10,14520*
-000557 -10,18911*
Dummy N in average wage in the 5 largest industries in 1991
-0,000874 -2,978685*
-0,000957 -3,022039*
Dummy NE in average wage in the 5 largest industries in 1991
-0,000934 3,878041*
-0,000957 0,0001*
Dummy S in average wage in the 5 largest industries in 1991
-0,000660 -2,977118*
-0,000649 -2,955706*
Dummy WC in average wage in the 5 largest industries in 1991
-0,000893 -3,519672*
-0,000898 -3,483609*
Significance Level: * - 1%; ** - 5%; *** - 10%.