Embed Size (px)
Citation preview
A Media-Based Measure of Presidential
Candidate Ideology†
Gregory A. CaldeiraOhio State [email protected]
Christopher ZornPennsylvania State University
Version 2.1September 12, 2011
†A previous version of this paper was presented at the Annual Meeting of the MidwestPolitical Science Association, April 2-4, 2009, Chicago, IL, and at the Triangle Area MethodsGroup, March 25, 2010, Chapel Hill, NC. Despite this, this paper remains a preliminary draft;we welcome comments and suggestions, but please do not cite without permission.
Introduction: Measuring Presidential Ideology
Among students of American politics, a key challenge is the ability to identify, define, op-
erationalize, and measure the dominant dimension or dimensions of political contention.
Particularly among scholars of American political institutions, the ability to measure the
ideological positions of actors in the system – and to do so in ways that are reliable, valid,
and comparable across time and space – is central to the empirical study of those institutions.
Perhaps nowhere is the challenge more keenly felt than in the institution of the presidency.
While scholars have in recent years made great gains in our ability to measure the ideology
of members of Congress (Poole and Rosenthal 1985, 1997; Clinton et al. 2004) and the
Supreme Court (Martin and Quinn 2002; Clark and Lauderdale 2010; Zorn and Caldeira
2010), efforts to derive similar measures for presidents have been significantly fewer and less
successful. The dominant approach has been to focus on presidential support for legislation
in the U.S. Congress, either in part (Zupan 1992) or in its entirety (Poole and McCarty 1995;
Bailey 2007) to discern presidential policy preferences.
But while legislation-based measures are useful in some respects, they also have signif-
icant drawbacks. Chief among these is the limiting (and potentially biasing) effects of the
Congressional agenda on our ability to infer presidential preferences: Because presidents do
not generally (and, in most instances, cannot) take positions on most bills that are intro-
duced, the possibility of selection bias in the results of such measures must be considered.
Relatedly, presidential position-taking is in many cases also endogenous to that agenda:
presidents are able informally to “introduce” and “sponsor” legislation (with the assistance
of sympathetic members) which itself shapes the Congressional agenda. Missing from these
measures, then, is the sort of exogeneity achieved in (e.g.) Segal and Cover’s (1989) measure
of Supreme Court ideology. Finally, it is worth noting that such measures are necessarily
limited to presidents who are actually elected to office; this latter fact severely limits their
usage in models of electoral politics, where one would ideally locate all candidates for the
1
office in an ideological space.
Our goal here is to take a first step toward overcoming these current deficiencies in
the measurement of presidential policy preferences. To that end, we offer a measure of
presidential candidates’ ideology for all major- and important third-party candidates who
ran in presidential general elections between 1932 and 2008. As we describe below, our
measure is reliable, valid, and maps closely to existing measures. In addition, however, it is
largely exogenous to president’s policy actions, making it potentially valuable as a explication
thereof; moreover, it is available for all candidates for president, whether or not they were
elected to the office.
Data and Methodology
We begin with a discussion of the data on which our measure is based, which consist of
every endorsement made by a daily newspaper in every presidential general election from
1932 to 2008. For the years 1932-2004, we obtained these data from Editor and Publisher
(various years), which publishes a list of those endorsements following each general election.
These endorsements include third-party candidates, and also indicate instances in which a
paper opted not to endorse any candidate.1 Data from 2008 were obtained from Editor
and Publisher ’s website, which was updated continuously before and immediately after the
2008 election. All told, these data represent endorsements by 2613 daily newspapers for
45 candidates (20 Democrats, 20 Republicans, and five independents); after accounting for
missing data, this yields a total of 35,507 endorsements for analysis.2
1We omit from our analysis one instance (by the Richmond, Kentucky Register) of supportfor Adlai Stevenson in 1948 (a year in which Stevenson did not run for president) and oneendorsement (by the Hartford City, Indiana News-Times) of Libertarian candidate DavidBergland in 1984. Both were the sole instances of support for each candidate that year,making estimation of their positions unwise, if not impossible.
2Note that we treat “consolidation” of newspapers as a “new” paper: when the AtlantaJournal and the Atlanta Constitution merged to become the Atlanta Journal-Constitution in2001, we treat the latter paper as completely distinct from the first two. We do this because
2
Daily newspaper endorsements are an especially promising source of information on pres-
idential policy preferences. Newspapers existed in nearly every community in the U.S. during
the period under study: the number of endorsements by state range from a low of 18 (in
Hawaii) to a high of 1,247 (for California) over the period studied. As we discuss below, the
newspapers in our data also cover the range of the political spectrum, from the far right to
the far left. The large numbers of such endorsements, combined with the range over which
their positions vary, allows us to obtain a high degree of reliability in the measures we derive.
Figure 1 plots aggregate percentages of (two-party) support for Republican nominees by
daily newspapers between 1932 and 2008. Three things immediately stand out. First, overall
levels of support for Republicans were, for most of the 20th century, substantially higher
than for Democrats. This large-scale result is consistent with other, narrower studies (e.g.,
Ansolabehere et al. 2006; Larcinese et al. 2007) which show that, in general, the newspaper
industry generally favored Republicans over Democrats for most of the 1900s. Moreover,
newspaper support for the GOP increased steadily throughout the 1930s and 1940s, even as
voters returned Democrats to office four consecutive times.
A notable exception to this trend occurred in 1964, when Republican nominee Barry
Goldwater received only 46 percent of newspaper endorsements nationwide. Not surprisingly,
this reflected in part Goldwater’s perceived extremism; however, it also signaled the larger-
scale shift of the South away from the Democratic Party and towards the Republicans.
Besides Arizona (75 percent), newspaper support for Goldwater tended to be substantially
higher in the states of the old Confederacy – including Mississippi (81 percent), Georgia (55
it is impossible to assess, in any given case, what the effect of such a merger will be on theeditorial positions of the subsequent publication. This inflates somewhat the total numberof daily newspapers recorded in the data, but also results in higher levels of missing datafor those papers (since, for the example given above, the AJC is recorded as having missingendorsements from 1932 to 2000, while the Journal and the Constitution are recorded asmissing in 2004 and 2008).
3
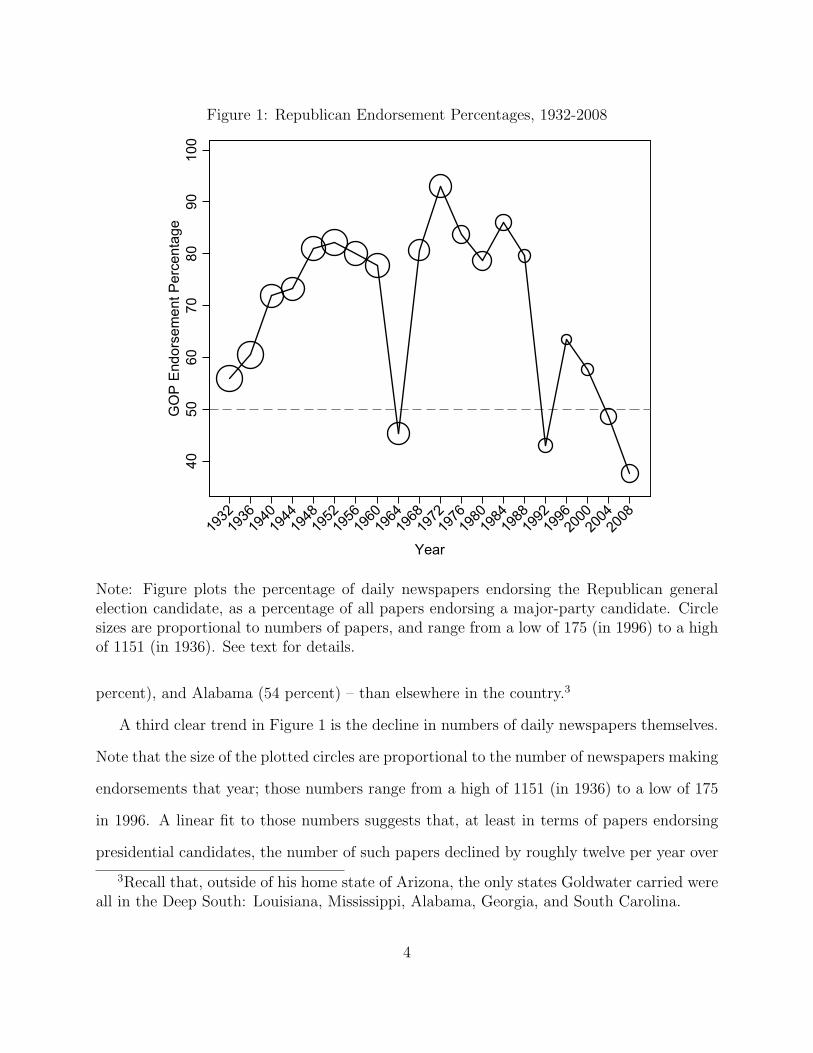
Figure 1: Republican Endorsement Percentages, 1932-200840
40
4050
50
5060
60
6070
70
7080
80
8090
90
90100
100
100GOP Endorsement Percentage
GO
P E
ndor
sem
ent P
erce
ntag
e
GOP Endorsement Percentage1932
1932
19321936
1936
19361940
1940
19401944
1944
19441948
1948
19481952
1952
19521956
1956
19561960
1960
19601964
1964
19641968
1968
19681972
1972
19721976
1976
19761980
1980
19801984
1984
19841988
1988
19881992
1992
19921996
1996
19962000
2000
20002004
2004
20042008
2008
2008Year
Year
Year
Note: Figure plots the percentage of daily newspapers endorsing the Republican generalelection candidate, as a percentage of all papers endorsing a major-party candidate. Circlesizes are proportional to numbers of papers, and range from a low of 175 (in 1996) to a highof 1151 (in 1936). See text for details.
percent), and Alabama (54 percent) – than elsewhere in the country.3
A third clear trend in Figure 1 is the decline in numbers of daily newspapers themselves.
Note that the size of the plotted circles are proportional to the number of newspapers making
endorsements that year; those numbers range from a high of 1151 (in 1936) to a low of 175
in 1996. A linear fit to those numbers suggests that, at least in terms of papers endorsing
presidential candidates, the number of such papers declined by roughly twelve per year over
3Recall that, outside of his home state of Arizona, the only states Goldwater carried wereall in the Deep South: Louisiana, Mississippi, Alabama, Georgia, and South Carolina.
4
the period studied.
The endorsement percentages in Figure 1 provide a useful overview of trends in such
behavior over time. Interestingly, those trends appear to track with overall levels of support
for the president (or the president’s party). From 1940 onward, we can obtain data on
presidential approval for the incumbent. For each election from 1940-2008, we record the
generic Gallup presidential approval percentage for the survey conducted closest (but prior)
to the general election. Since most newspapers make their endorsements within one week
of the general election, we can use these numbers to see whether endorsement support is
related to public approval for the incumbent.
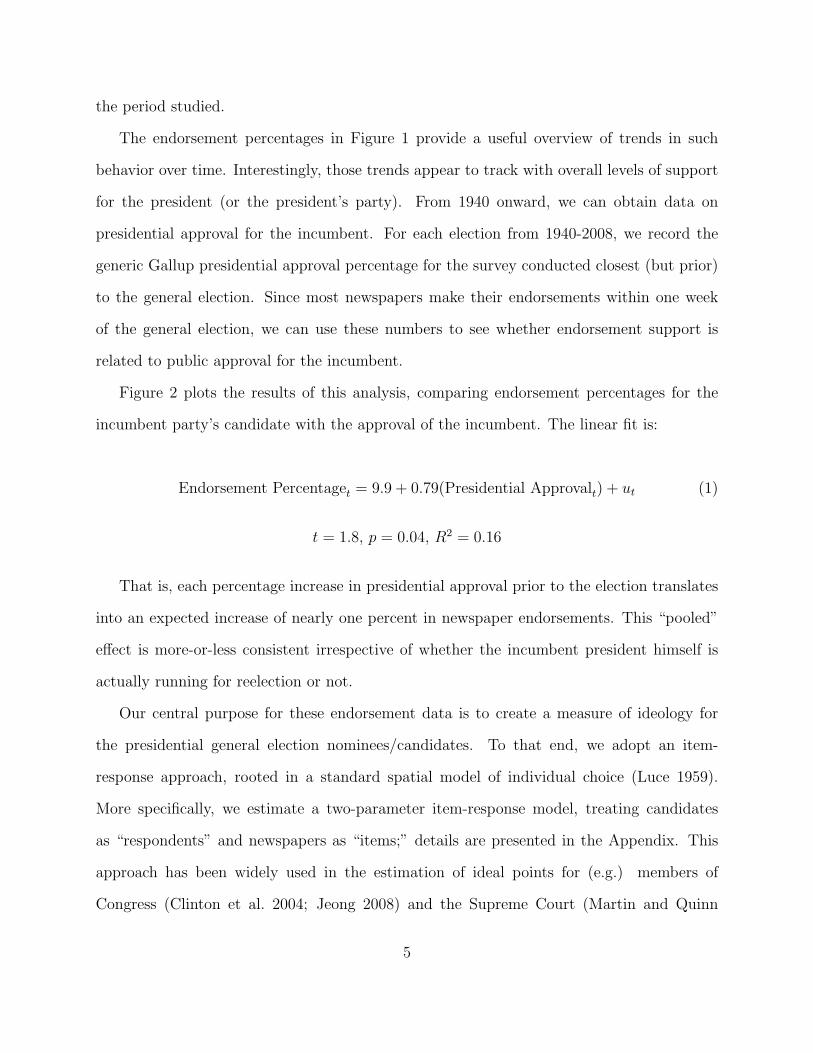
Figure 2 plots the results of this analysis, comparing endorsement percentages for the
incumbent party’s candidate with the approval of the incumbent. The linear fit is:
Endorsement Percentaget = 9.9 + 0.79(Presidential Approvalt) + ut (1)
t = 1.8, p = 0.04, R2 = 0.16
That is, each percentage increase in presidential approval prior to the election translates
into an expected increase of nearly one percent in newspaper endorsements. This “pooled”
effect is more-or-less consistent irrespective of whether the incumbent president himself is
actually running for reelection or not.
Our central purpose for these endorsement data is to create a measure of ideology for
the presidential general election nominees/candidates. To that end, we adopt an item-
response approach, rooted in a standard spatial model of individual choice (Luce 1959).
More specifically, we estimate a two-parameter item-response model, treating candidates
as “respondents” and newspapers as “items;” details are presented in the Appendix. This
approach has been widely used in the estimation of ideal points for (e.g.) members of
Congress (Clinton et al. 2004; Jeong 2008) and the Supreme Court (Martin and Quinn
5
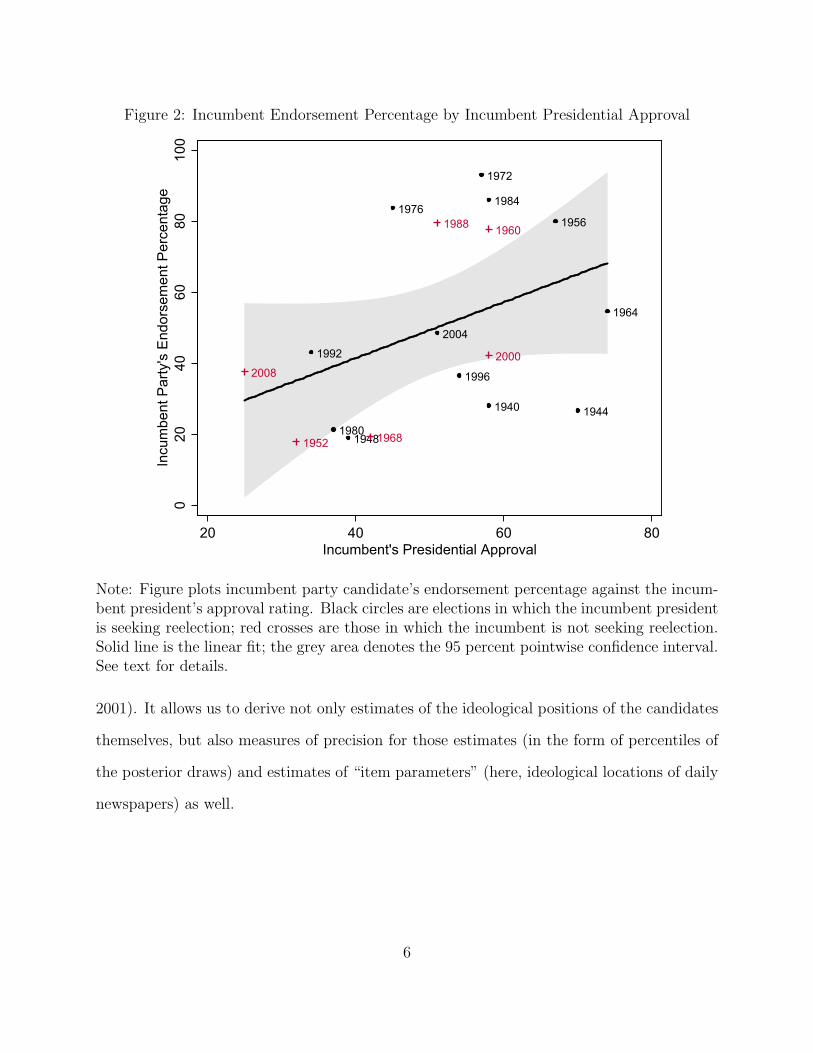
Figure 2: Incumbent Endorsement Percentage by Incumbent Presidential Approval1940
1940
19401944
1944
19441948
1948
19481956
1956
19561964
1964
19641972
1972
19721976
1976
19761980
1980
19801984
1984
19841992
1992
19921996
1996
19962004
2004
20041952
1952
19521960
1960
19601968
1968
19681988
1988
19882000
2000
20002008
2008
20080
0
020
20
2040
40
4060
60
6080
80
80100
100
100Incumbent Party's Endorsement Percentage
Incu
mbe
nt P
arty
's E
ndor
sem
ent P
erce
ntag
e
Incumbent Party's Endorsement Percentage20
20
2040
40
4060
60
6080
80
80Incumbent's Presidential Approval
Incumbent's Presidential Approval
Incumbent's Presidential Approval
Note: Figure plots incumbent party candidate’s endorsement percentage against the incum-bent president’s approval rating. Black circles are elections in which the incumbent presidentis seeking reelection; red crosses are those in which the incumbent is not seeking reelection.Solid line is the linear fit; the grey area denotes the 95 percent pointwise confidence interval.See text for details.
2001). It allows us to derive not only estimates of the ideological positions of the candidates
themselves, but also measures of precision for those estimates (in the form of percentiles of
the posterior draws) and estimates of “item parameters” (here, ideological locations of daily
newspapers) as well.
6
Presidential Ideology, 1932-2008
Our endorsement-based estimates of presidential candidate ideology are presented in Figure
3, which plots the estimated candidate parameters along with their 95 percent posterior
intervals. The estimates largely comport with expectations: Democrats are consistently
and significantly to the left of Republicans, with a significant gap between the parties and
the five independent candidates falling in the “middle.” Our estimates indicate that, by a
significant degree, the two most conservative candidates of the past 80 years were George H.
W. Bush in 1988 and Ronald Reagan in 1984. Alf Landon, Reagan (in 1980), Herbert Hoover,
and Thomas Dewey (in 1948) are also counted among the most conservative Republicans.
Interestingly, the most moderate Republican by our measure is Barry Goldwater. As we
note above, Goldwater was the first Republican nominee to garner significant endorsements
in the Deep South, while his perceived extremism worried many moderate Republicans in
the North and Midwest. We suspect that the tendency for mostly Democratic-backing
newspapers in those states to side with Goldwater (together with his abandonment by many
traditionally-Republican northern papers) is behind this counterintuitive result.
On the Democratic side, four of the most liberal eight spots are occupied by FDR, and
two by Adlai Stevenson; together with Michael Dukakis and Walter Mondale, these make up
the most liberal candidates. By contrast, we locate Jimmy Carter (in 1976), John Kerry, Bill
Clinton (in 1992), and Barack Obama as the most moderate of the Democratic nominees,
along with Bill Clinton (in 1992) and John Kerry. The five independent candidates in our
data all fall between the Democrats and Republicans, with H. Ross Perot ranking as the
most conservative and Strom Thurmond the most liberal; as with Goldwater, this latter
result is likely a function of his endorsement by traditionally-Democratic newspapers in the
Deep South. There is a clear separation between Republican and Democratic candidates,
with the independents generally shading toward the Democrats.
Some general trends in the movement of candidates are also apparent. Considering only
7
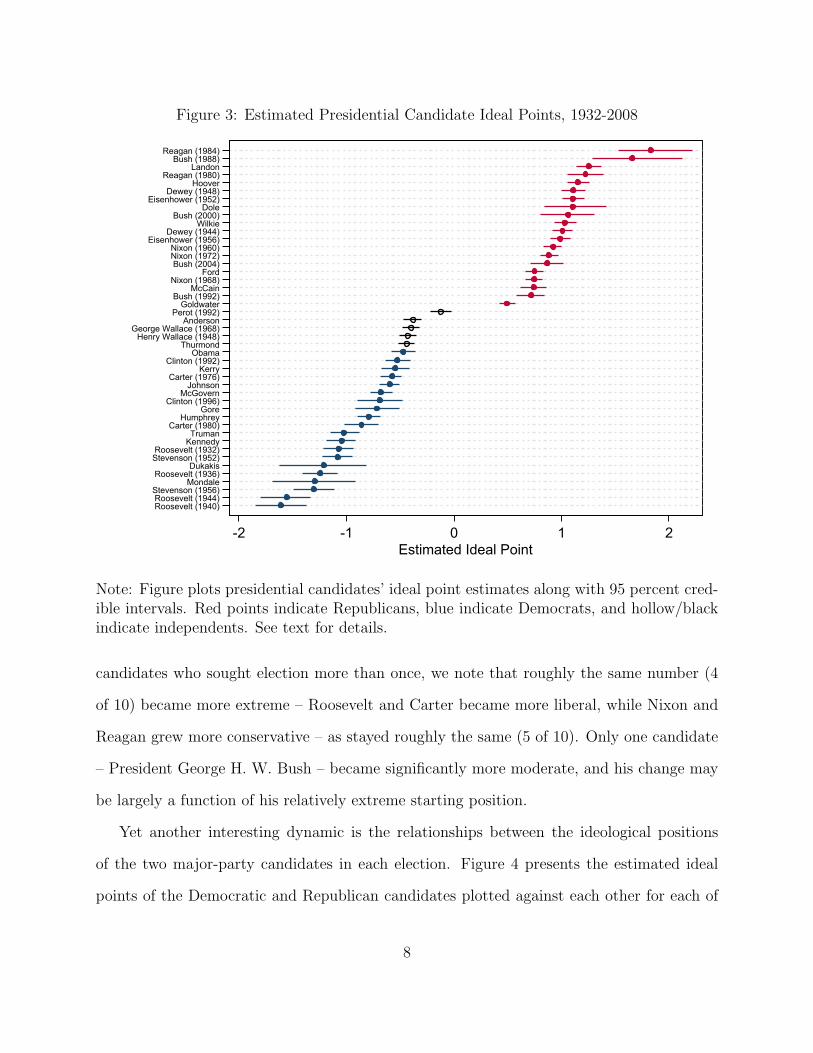
Figure 3: Estimated Presidential Candidate Ideal Points, 1932-2008Roosevelt (1940)
Roosevelt (1940)
Roosevelt (1940)Roosevelt (1944)
Roosevelt (1944)
Roosevelt (1944)Stevenson (1956)
Stevenson (1956)
Stevenson (1956)Mondale
Mondale
MondaleRoosevelt (1936)
Roosevelt (1936)
Roosevelt (1936)Dukakis
Dukakis
DukakisStevenson (1952)
Stevenson (1952)
Stevenson (1952)Roosevelt (1932)
Roosevelt (1932)
Roosevelt (1932)Kennedy
Kennedy
KennedyTruman
Truman
TrumanCarter (1980)
Carter (1980)
Carter (1980)Humphrey
Humphrey
HumphreyGore
Gore
GoreClinton (1996)
Clinton (1996)
Clinton (1996)McGovern
McGovern
McGovernJohnson
Johnson
JohnsonCarter (1976)
Carter (1976)
Carter (1976)Kerry
Kerry
KerryClinton (1992)
Clinton (1992)
Clinton (1992)Obama
Obama
ObamaThurmond
Thurmond
ThurmondHenry Wallace (1948)
Henry Wallace (1948)
Henry Wallace (1948)George Wallace (1968)
George Wallace (1968)
George Wallace (1968)Anderson
Anderson
AndersonPerot (1992)
Perot (1992)
Perot (1992)Goldwater
Goldwater
GoldwaterBush (1992)
Bush (1992)
Bush (1992)McCain
McCain
McCainNixon (1968)
Nixon (1968)
Nixon (1968)Ford
Ford
FordBush (2004)
Bush (2004)
Bush (2004)Nixon (1972)
Nixon (1972)
Nixon (1972)Nixon (1960)
Nixon (1960)
Nixon (1960)Eisenhower (1956)
Eisenhower (1956)
Eisenhower (1956)Dewey (1944)
Dewey (1944)
Dewey (1944)Wilkie
Wilkie
WilkieBush (2000)
Bush (2000)
Bush (2000)Dole
Dole
DoleEisenhower (1952)
Eisenhower (1952)
Eisenhower (1952)Dewey (1948)
Dewey (1948)
Dewey (1948)Hoover
Hoover
HooverReagan (1980)
Reagan (1980)
Reagan (1980)Landon
Landon
LandonBush (1988)
Bush (1988)
Bush (1988)Reagan (1984)
Reagan (1984)
Reagan (1984)ID2
ID2
ID2-2
-2
-2-1
-1
-10
0
01
1
12
2
2Estimated Ideal Point
Estimated Ideal Point
Estimated Ideal Point
Note: Figure plots presidential candidates’ ideal point estimates along with 95 percent cred-ible intervals. Red points indicate Republicans, blue indicate Democrats, and hollow/blackindicate independents. See text for details.
candidates who sought election more than once, we note that roughly the same number (4
of 10) became more extreme – Roosevelt and Carter became more liberal, while Nixon and
Reagan grew more conservative – as stayed roughly the same (5 of 10). Only one candidate
– President George H. W. Bush – became significantly more moderate, and his change may
be largely a function of his relatively extreme starting position.
Yet another interesting dynamic is the relationships between the ideological positions
of the two major-party candidates in each election. Figure 4 presents the estimated ideal
points of the Democratic and Republican candidates plotted against each other for each of
8
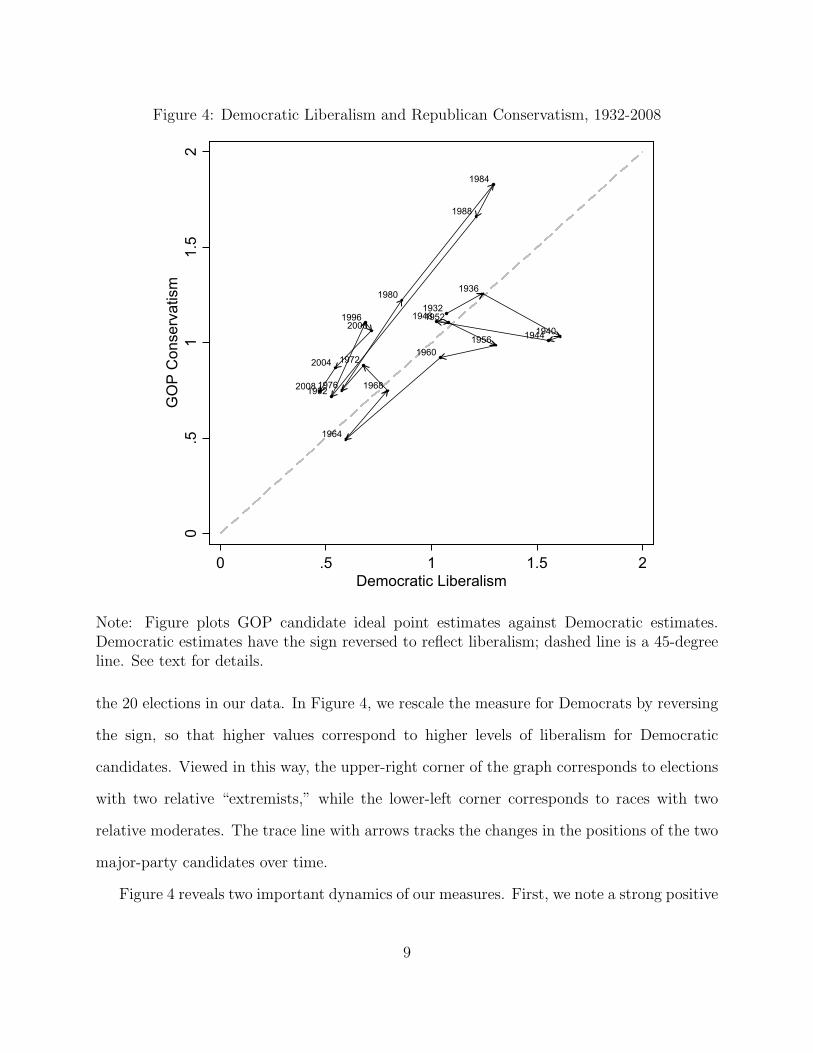
Figure 4: Democratic Liberalism and Republican Conservatism, 1932-20081932
1932
19321936
1936
19361940
1940
19401944
1944
19441948
1948
19481952
1952
19521956
1956
19561960
1960
19601964
1964
19641968
1968
19681972
1972
19721976
1976
19761980
1980
19801984
1984
19841988
1988
19881992
1992
19921996
1996
19962000
2000
20002004
2004
20042008
2008
20080
0
0.5
.5
.51
1
11.5
1.5
1.52
2
2GOP Conservatism
GO
P C
onse
rvat
ism
GOP Conservatism0
0
0.5
.5
.51
1
11.5
1.5
1.52
2
2Democratic Liberalism
Democratic Liberalism
Democratic Liberalism
Note: Figure plots GOP candidate ideal point estimates against Democratic estimates.Democratic estimates have the sign reversed to reflect liberalism; dashed line is a 45-degreeline. See text for details.
the 20 elections in our data. In Figure 4, we rescale the measure for Democrats by reversing
the sign, so that higher values correspond to higher levels of liberalism for Democratic
candidates. Viewed in this way, the upper-right corner of the graph corresponds to elections
with two relative “extremists,” while the lower-left corner corresponds to races with two
relative moderates. The trace line with arrows tracks the changes in the positions of the two
major-party candidates over time.
Figure 4 reveals two important dynamics of our measures. First, we note a strong positive
9
correlation between the degree of liberalism of the Democratic nominee and the degree of
conservatism of the Republican. The Pearson’s correlation between the two measures is 0.57
(p < .01, N = 20), suggesting that elections tend to be contested between two relative
party “extremists” or two “moderates,” but rarely one of each. Second, the trend over time
is an interesting one: both Democratic and Republican candidates grew (simultaneously)
more moderate throughout the 1950s, 1960s, and 1970s, only to become more extreme in the
1980s and then return to relative moderation in the 1990s and 2000s. We will return to the
determinants of the candidates’ ideological positions – and to the effects of those positions
on general election outcomes – in the analyses below.
While we are generally please with the face validity of our measure, it is nonetheless
desirable to investigate its internal and external validity. By “internal” validity, we refer
here to the sensitivity of the measure to changes in modeling and estimation; our assessment
of external validity is accomplished via comparison to two widely-used alternative measures
of presidential ideology.
Internal Validity
One potential concern with our measure is that it is largely a function of our chosen method
of estimation. To assess this possibility, we compare our IRT-based measure to one based
on Poole and Rosenthal’s (1985, 1991, 1997) optimal classification (OC, also known as W-
NOMINATE) method. We estimate one-dimensional OC scores for our 45 candidates, using
the same endorsement data. A comparison of the estimated positions generated by each
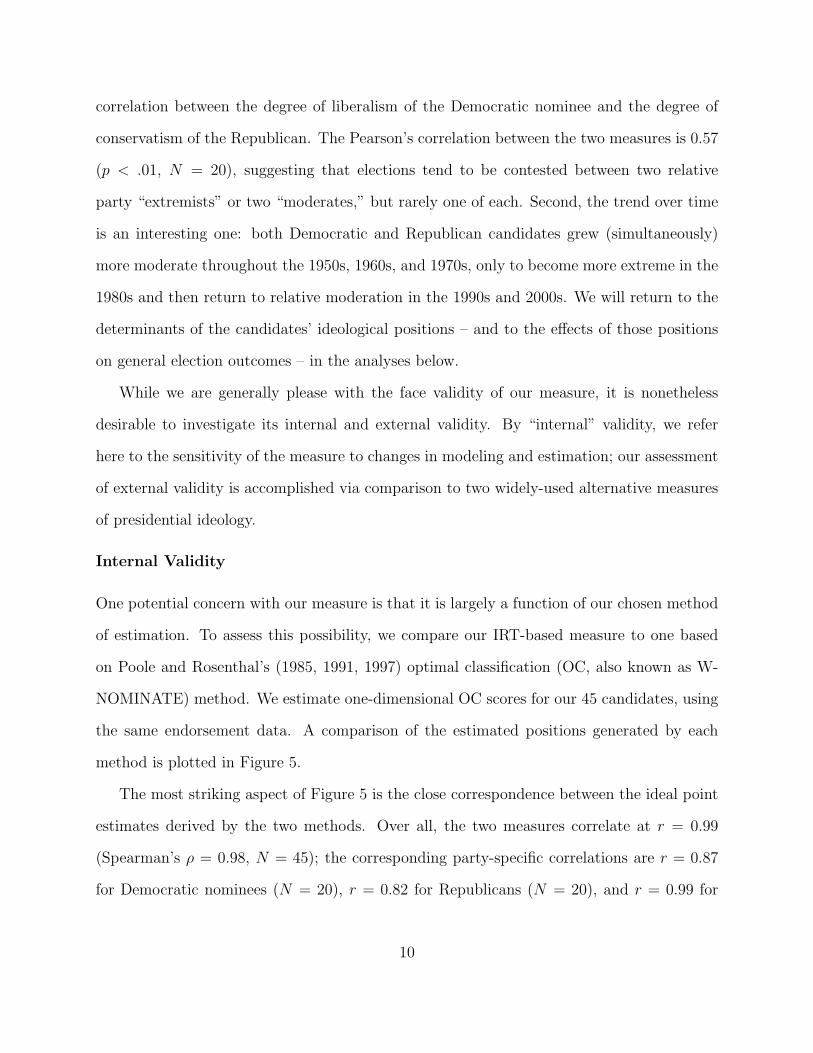
method is plotted in Figure 5.
The most striking aspect of Figure 5 is the close correspondence between the ideal point
estimates derived by the two methods. Over all, the two measures correlate at r = 0.99
(Spearman’s ρ = 0.98, N = 45); the corresponding party-specific correlations are r = 0.87
for Democratic nominees (N = 20), r = 0.82 for Republicans (N = 20), and r = 0.99 for
10
Figure 5: Ideological Positions and General Election Outcomes-2
-2
-2-1
-1
-10
0
01
1
12
2
2Estimated Ideal Point
Est
imat
ed Id
eal P
oint
Estimated Ideal Point-1
-1
-1-.5
-.5
-.50
0
0.5
.5
.51
1
1Estimated Optimal Classification Location
Estimated Optimal Classification Location
Estimated Optimal Classification Location
Note: Figure plots our ideal point estimates against those estimated using Poole and Rosen-thal’s (1997) optimal classification estimator. See text for details.
independents (N = 5). The high degree of correlation suggests that the point estimates
obtained by our IRT-based approach are not being primarily driven by our choice of estima-
tor.4 While we reserve judgment about the relative merits of the two approaches, the fact
that both arrive at the same general conclusions about the positioning of the candidates is
comforting.
4At the same time, note that the standard error estimates (not shown) for the ideal pointsare, in relative terms, generally smaller than those for the OC estimates.
11
External Validity
To assess the external validity of our measure, we compare our ideal point estimates to
two other widely-used measures of presidential ideology. The first of these are Poole and
Rosenthal’s presidential W-NOMINATE scores (Poole and McCarty 1995). These scores
are derived from presidential positions on Congressional roll call votes, and estimated via
Poole and Rosenthal’s (1997) optimal classification method, and have been widely accepted
and used in empirical studies of Congress and the presidency (e.g., Jenkins and Sala 1998;
Lindquist and Klein 2006; Nemacheck 2008). They thus differ from our estimates both in
their method and their data; as a result, they provide an external metric by which we can
assess the validity of our estimates.
Figure 6 plots three measures: our IRT-based ideal point estimates, the estimates based
on application of the OC algorithm to the endorsements data (as in Figure 5), and the
first-dimension W-NOMINATE scores for presidents Eisenhower through Bush (43). As in
Figure 5, the most striking finding is the high levels of correlation across the three measures:
while the two endorsement-based measures correlate strongly, the correlations are equally
high between them and that rooted in Presidential positions on Congressional roll calls. The
most substantial differences are between presidents of different parties; indeed, the within-
party correlations between our ideal points and the presidential W-NOMINATE scores are
more modest (r = 0.29 for Republican presidents and 0.57 for Democratic ones).
Our second comparison is to presidential ADA-support scores (Zupan 1992; Grafton and
Permaloff 2004). These scores are based on the widely-known Americans for Democratic Ac-
tion (ADA) ratings, and reflect the proportion of ADA-supported bills which also command
the support of the president. This measure this reflects the degree of policy liberalism of
each president, as manifested in his support for (or opposition to) liberal policy initiatives
in Congress. Unlike presidential W-NOMINATE scores, however, ADA support scores vary
from one year to the next.
12
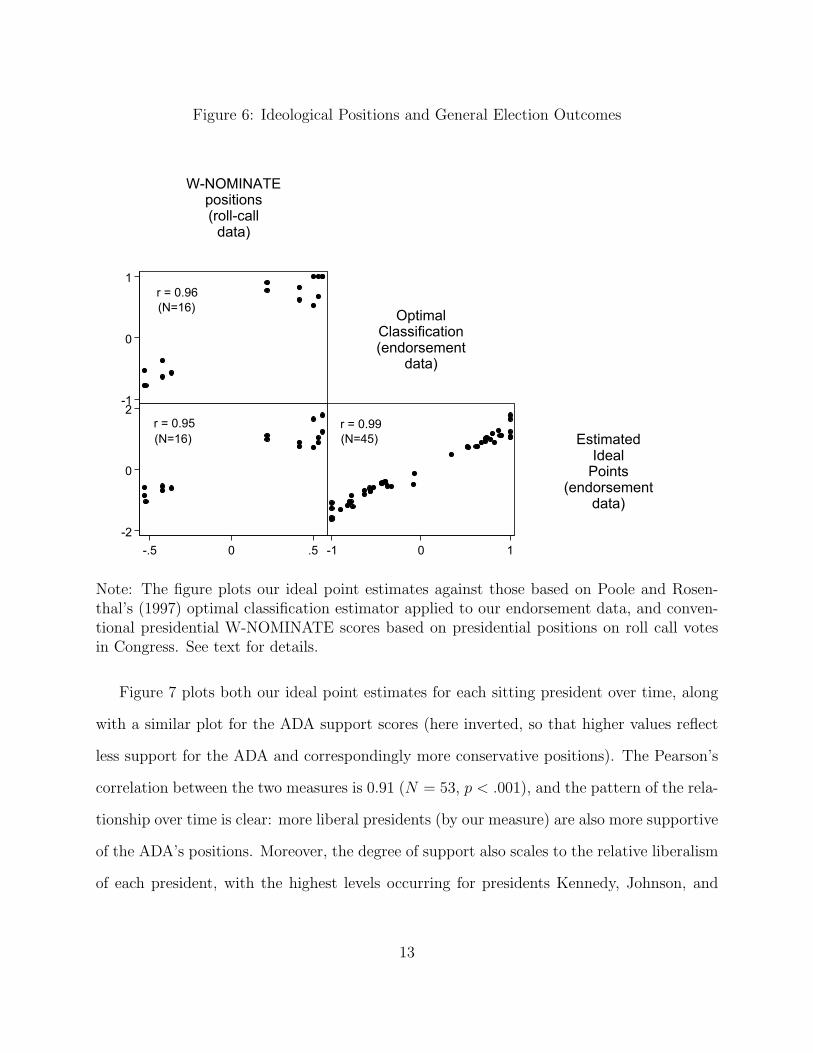
Figure 6: Ideological Positions and General Election Outcomesr = 0.96
r = 0.96
r = 0.96(N=16)
(N=16)
(N=16)r = 0.95
r = 0.95
r = 0.95(N=16)
(N=16)
(N=16)r = 0.99
r = 0.99
r = 0.99(N=45)
(N=45)
(N=45)W-NOMINATE
W-NOMINATE
W-NOMINATEpositions
positions
positions(roll-call
(roll-call
(roll-calldata)
data)
data)Optimal
Optimal
OptimalClassification
Classification
Classification(endorsement
(endorsement
(endorsementdata)
data)
data)Estimated
Estimated
EstimatedIdeal
Ideal
IdealPoints
Points
Points(endorsement
(endorsement
(endorsementdata)
data)
data)-.5
-.5
-.50
0
0.5
.5
.5-1
-1
-10
0
01
1
1-1
-1
-10
0
01
1
1-2
-2
-20
0
02
2
2
Note: The figure plots our ideal point estimates against those based on Poole and Rosen-thal’s (1997) optimal classification estimator applied to our endorsement data, and conven-tional presidential W-NOMINATE scores based on presidential positions on roll call votesin Congress. See text for details.
Figure 7 plots both our ideal point estimates for each sitting president over time, along
with a similar plot for the ADA support scores (here inverted, so that higher values reflect
less support for the ADA and correspondingly more conservative positions). The Pearson’s
correlation between the two measures is 0.91 (N = 53, p < .001), and the pattern of the rela-
tionship over time is clear: more liberal presidents (by our measure) are also more supportive
of the ADA’s positions. Moreover, the degree of support also scales to the relative liberalism
of each president, with the highest levels occurring for presidents Kennedy, Johnson, and
13
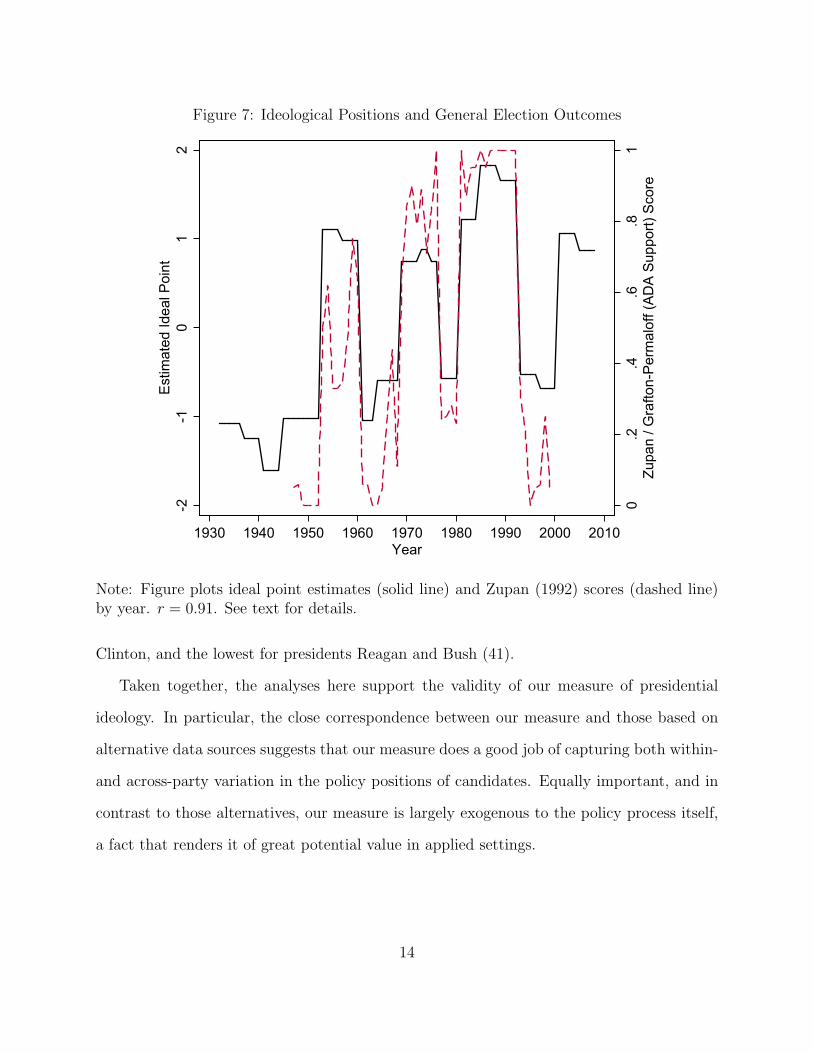
Figure 7: Ideological Positions and General Election Outcomes0
0
0.2
.2
.2.4
.4
.4.6
.6
.6.8
.8
.81
1
1Zupan / Grafton-Permaloff (ADA Support) Score
Zupa
n / G
rafto
n-P
erm
alof
f (A
DA
Sup
port)
Sco
re
Zupan / Grafton-Permaloff (ADA Support) Score-2
-2
-2-1
-1
-10
0
01
1
12
2
2Estimated Ideal Point
Est
imat
ed Id
eal P
oint
Estimated Ideal Point1930
1930
19301940
1940
19401950
1950
19501960
1960
19601970
1970
19701980
1980
19801990
1990
19902000
2000
20002010
2010
2010Year
Year
Year
Note: Figure plots ideal point estimates (solid line) and Zupan (1992) scores (dashed line)by year. r = 0.91. See text for details.
Clinton, and the lowest for presidents Reagan and Bush (41).
Taken together, the analyses here support the validity of our measure of presidential
ideology. In particular, the close correspondence between our measure and those based on
alternative data sources suggests that our measure does a good job of capturing both within-
and across-party variation in the policy positions of candidates. Equally important, and in
contrast to those alternatives, our measure is largely exogenous to the policy process itself,
a fact that renders it of great potential value in applied settings.
14
Applications: Three Examples
Finally, we briefly consider three applications of the measures developed above. In the first,
we take our measures as the central variable of interest, and ask the question: To what
extent do the ideological positions of major-party nominees for president reflect changes in
overall levels of liberalism and conservatism in the populace? Our second example treats the
candidates’ positions as a key covariate, and examines the relationship between candidates’
ideological positions and their success in the general election. Finally, we briefly describe a
potentially important by-product of our analysis: in addition to ideal points for candidates,
our model also estimates ideological positions for individual newspapers, in the form of
item parameters. All three analyses are necessarily preliminary; nonetheless, they serve to
demonstrate the potential value of the measure we derive here.
Nominee Ideology and Public Opinion
A key question in studies of representation is whether and to what extent the policy pref-
erences of officeholders (and, by extension, candidates for those offices) reflect those of the
public at large. While numerous studies have examined the connection between public opin-
ion and representation in Congress (Miller and Stokes 1963; Erikson 1978; Bartels 1991) and
in the presidency (e.g., Stimson 1999), to date few have done so in a manner that considers
presidential candidates.
Here, we consider the relationship, if any, between the ideological preferences of the
major-party presidential candidates and that of the public at large. Our central variable of
interest, then, is the ideal point estimates we derived above. For nominees of each party, we
estimate a simple model of ideological responsiveness, of the following form:
Ideologyt = β0 + β1(Opposition Party Ideologyt) + β2(Mass Ideologyt) + ut
15
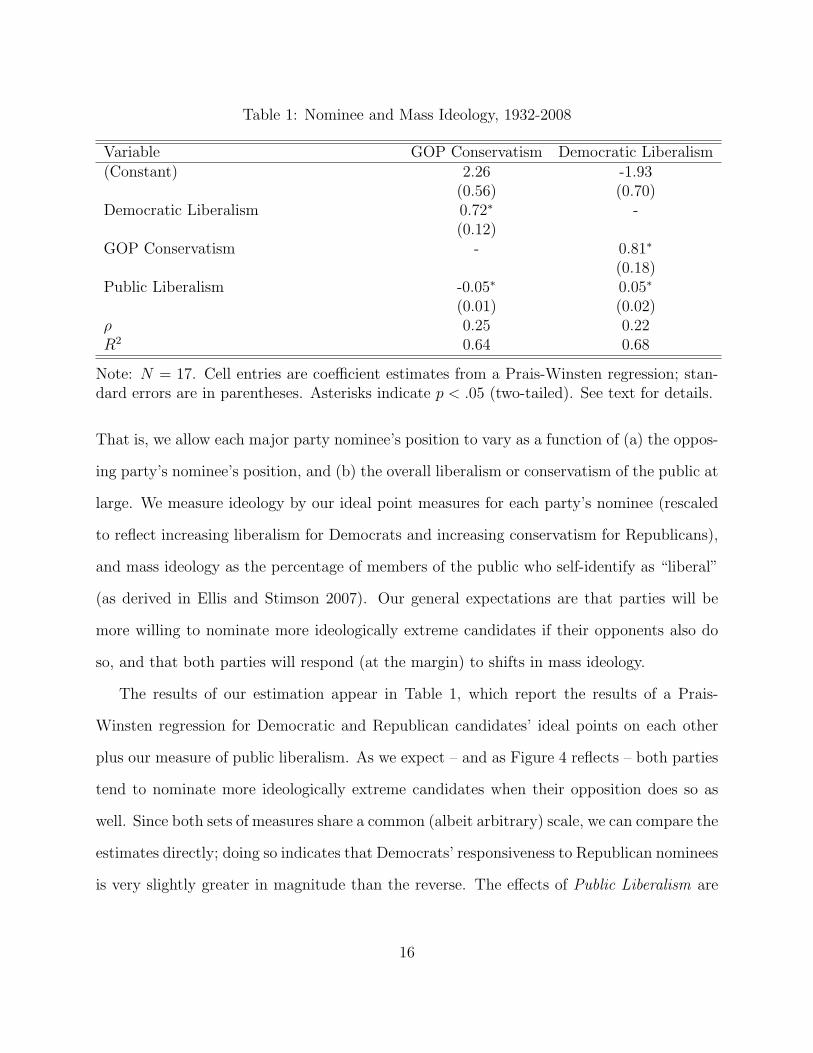
Table 1: Nominee and Mass Ideology, 1932-2008
Variable GOP Conservatism Democratic Liberalism(Constant) 2.26 -1.93
(0.56) (0.70)Democratic Liberalism 0.72∗ -
(0.12)GOP Conservatism - 0.81∗
(0.18)Public Liberalism -0.05∗ 0.05∗
(0.01) (0.02)ρ 0.25 0.22R2 0.64 0.68
Note: N = 17. Cell entries are coefficient estimates from a Prais-Winsten regression; stan-dard errors are in parentheses. Asterisks indicate p < .05 (two-tailed). See text for details.
That is, we allow each major party nominee’s position to vary as a function of (a) the oppos-
ing party’s nominee’s position, and (b) the overall liberalism or conservatism of the public at
large. We measure ideology by our ideal point measures for each party’s nominee (rescaled
to reflect increasing liberalism for Democrats and increasing conservatism for Republicans),
and mass ideology as the percentage of members of the public who self-identify as “liberal”
(as derived in Ellis and Stimson 2007). Our general expectations are that parties will be
more willing to nominate more ideologically extreme candidates if their opponents also do
so, and that both parties will respond (at the margin) to shifts in mass ideology.
The results of our estimation appear in Table 1, which report the results of a Prais-
Winsten regression for Democratic and Republican candidates’ ideal points on each other
plus our measure of public liberalism. As we expect – and as Figure 4 reflects – both parties
tend to nominate more ideologically extreme candidates when their opposition does so as
well. Since both sets of measures share a common (albeit arbitrary) scale, we can compare the
estimates directly; doing so indicates that Democrats’ responsiveness to Republican nominees
is very slightly greater in magnitude than the reverse. The effects of Public Liberalism are
16
also as expected: as the public self-identifies as liberal in greater numbers, the expected
conservatism of the GOP nominee declines, while the expected liberalism of the Democratic
candidate increases.
Both regressions fit the data reasonably well for such sparse specifications. While we
are loathe to draw too many conclusions from this relatively simple set of estimates, we
nonetheless view these findings as providing at least initial support for the prospect that,
in making their selections for president, political parties respond to ideological shifts in the
public.
Candidate Ideology and General Election Performance
Beyond the question of nominee choice, our data also allow us to test models of general
election outcomes. In particular, we can examine whether and how candidates’ ideological
positions relate to their success or failure in the general election. Here, we do so by analyzing
the association between each nominee’s estimated ideal point and the fraction of the two-
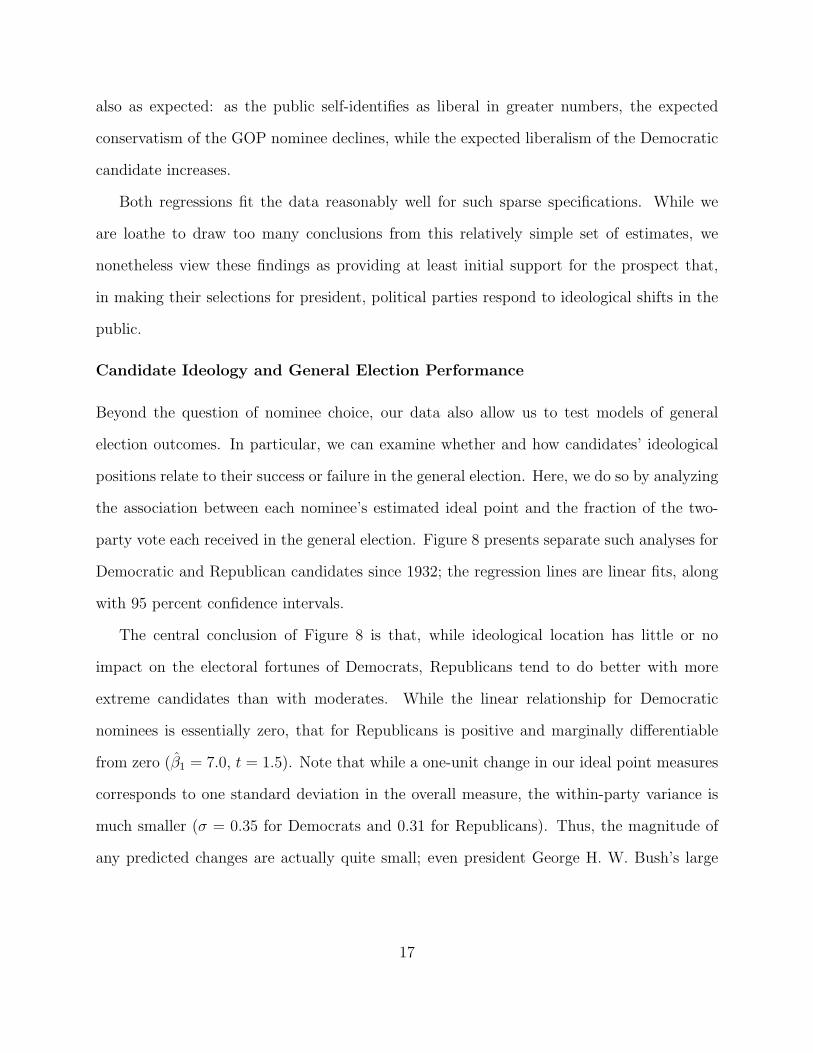
party vote each received in the general election. Figure 8 presents separate such analyses for
Democratic and Republican candidates since 1932; the regression lines are linear fits, along
with 95 percent confidence intervals.
The central conclusion of Figure 8 is that, while ideological location has little or no
impact on the electoral fortunes of Democrats, Republicans tend to do better with more
extreme candidates than with moderates. While the linear relationship for Democratic
nominees is essentially zero, that for Republicans is positive and marginally differentiable
from zero (β̂1 = 7.0, t = 1.5). Note that while a one-unit change in our ideal point measures
corresponds to one standard deviation in the overall measure, the within-party variance is
much smaller (σ = 0.35 for Democrats and 0.31 for Republicans). Thus, the magnitude of
any predicted changes are actually quite small; even president George H. W. Bush’s large
17
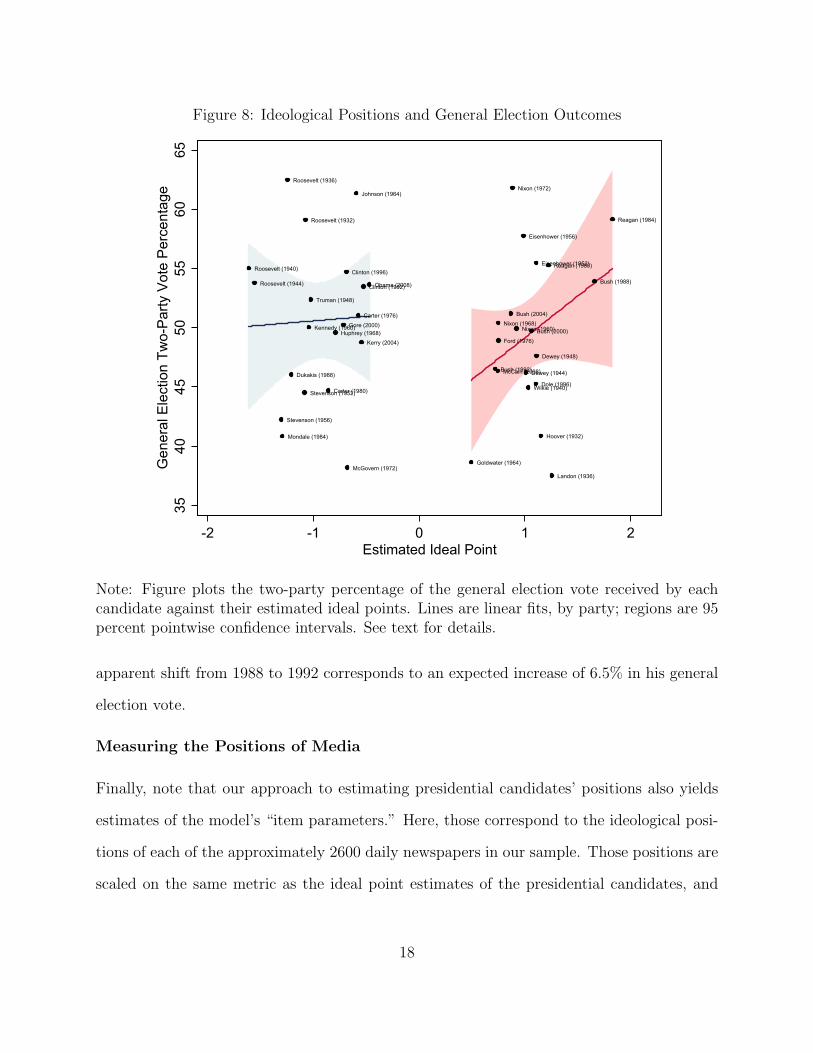
Figure 8: Ideological Positions and General Election OutcomesRoosevelt (1940)
Roosevelt (1940)
Roosevelt (1940)Roosevelt (1944)
Roosevelt (1944)
Roosevelt (1944)Stevenson (1956)
Stevenson (1956)
Stevenson (1956)Mondale (1984)
Mondale (1984)
Mondale (1984)Roosevelt (1936)
Roosevelt (1936)
Roosevelt (1936)Dukakis (1988)
Dukakis (1988)
Dukakis (1988)Stevenson (1952)
Stevenson (1952)
Stevenson (1952)Roosevelt (1932)
Roosevelt (1932)
Roosevelt (1932)Kennedy (1960)
Kennedy (1960)
Kennedy (1960)Truman (1948)
Truman (1948)
Truman (1948)Carter (1980)
Carter (1980)
Carter (1980)Huphrey (1968)
Huphrey (1968)
Huphrey (1968)Gore (2000)
Gore (2000)
Gore (2000)Clinton (1996)
Clinton (1996)
Clinton (1996)McGovern (1972)
McGovern (1972)
McGovern (1972)Johnson (1964)
Johnson (1964)
Johnson (1964)Carter (1976)
Carter (1976)
Carter (1976)Kerry (2004)
Kerry (2004)
Kerry (2004)Clinton (1992)
Clinton (1992)
Clinton (1992)Obama (2008)
Obama (2008)
Obama (2008)Goldwater (1964)
Goldwater (1964)
Goldwater (1964)Bush (1992)
Bush (1992)
Bush (1992)McCain (2008)
McCain (2008)
McCain (2008)Nixon (1968)
Nixon (1968)
Nixon (1968)Ford (1976)
Ford (1976)
Ford (1976)Bush (2004)
Bush (2004)
Bush (2004)Nixon (1972)
Nixon (1972)
Nixon (1972)Nixon (1960)
Nixon (1960)
Nixon (1960)Eisenhower (1956)
Eisenhower (1956)
Eisenhower (1956)Dewey (1944)
Dewey (1944)
Dewey (1944)Wilkie (1940)
Wilkie (1940)
Wilkie (1940)Bush (2000)
Bush (2000)
Bush (2000)Dole (1996)
Dole (1996)
Dole (1996)Eisenhower (1952)
Eisenhower (1952)
Eisenhower (1952)Dewey (1948)
Dewey (1948)
Dewey (1948)Hoover (1932)
Hoover (1932)
Hoover (1932)Reagan (1980)
Reagan (1980)
Reagan (1980)Landon (1936)
Landon (1936)
Landon (1936)Bush (1988)
Bush (1988)
Bush (1988)Reagan (1984)
Reagan (1984)
Reagan (1984)35
35
3540
40
4045
45
4550
50
5055
55
5560
60
6065
65
65General Election Two-Party Vote Percentage
Gen
eral
Ele
ctio
n Tw
o-P
arty
Vot
e P
erce
ntag
e
General Election Two-Party Vote Percentage-2
-2
-2-1
-1
-10
0
01
1
12
2
2Estimated Ideal Point
Estimated Ideal Point
Estimated Ideal Point
Note: Figure plots the two-party percentage of the general election vote received by eachcandidate against their estimated ideal points. Lines are linear fits, by party; regions are 95percent pointwise confidence intervals. See text for details.
apparent shift from 1988 to 1992 corresponds to an expected increase of 6.5% in his general
election vote.
Measuring the Positions of Media
Finally, note that our approach to estimating presidential candidates’ positions also yields
estimates of the model’s “item parameters.” Here, those correspond to the ideological posi-
tions of each of the approximately 2600 daily newspapers in our sample. Those positions are
scaled on the same metric as the ideal point estimates of the presidential candidates, and
18
Figure 9: Candidate and Newspaper Ideological Positions, 1932-2008
-10 -5 0 5 10
0.0
0.1
0.2
0.3
0.4
Newspaper and Candidate Positions
Density
Candidates
Newspapers
Note: Figure plots densities of candidate (red dashed line, N = 45) and newspaper (solidblack line, N = 2613) ideal points. Higher values indicate greater conservatism. See text fordetails.
can thus be directly compared to them.
While a complete exposition of our newspaper locations is beyond the scope of our paper,
Figure 9 shows density plots for the ideal point locations of the 45 presidential candidates in
our data (the dashed line) and for the 2613 newspapers in our estimation (solid line). Once
again, several conclusions arise from the plot. Presidential nominees, unsurprisingly, tend to
be bimodally distributed, with clusters of Republican candidates on the right and Democrats
on the left. By contrast, newspapers’ ideologies are unimodal, with a central mode between
19
those of the two parties’ candidates, and almost exactly equidistant between them. We also
note a substantial “tail” of newspapers to the right of the presidential candidates; this reflects
the presence of consistently Republican newspapers over the period studied. Interestingly,
we see only a very small similar cluster of solidly Democratic papers on the left; we suspect
that this difference is due to the fact that the most solidly Democratic papers early in our
period of study were those in the Deep South, and that nearly all of those papers moved to
the right (i.e., began endorsing Republicans) sometime during the past 40 years.
The analysis in Figure 9 is, of course, only the beginning of what one might do with the
newspaper ideology scores we estimate. A great deal of attention has recently been paid to
estimating the positions of media outlets; prominent examples include Ansolabehere et al.
(2006), Permaloff and Grafton (2006), Larcinese et al. (2007), Ho and Quinn (2008), and
Groseclose (2011). We anticipate being able to contribute to this burgeoning literature as
well.
Concluding Thoughts and Future Directions
We offer here a new, media-based measure of the ideological positions of U.S. presidential
candidates from 1932 to the present. While our audit of that measure support its face
and construct validity, and our applications suggest its potential for use in future work
on American political elections and institutions, we nonetheless believe that a number of
important questions and challenges remain.
One such question can be summarized simply: Does one dimension capture enough?
Certainly the political landscape – both for presidential candidates and for daily newspapers
– have changed in the past eight decades. Moreover, a number of other large-scale studies
(e.g. Poole and Rosenthal 1997; Stimson 1999) have indicated that the American polity is
organized around more than one dominant dimension of political contention. While they
are too preliminary to discuss here, preliminary results using our data that allow for a two-
20
dimensional structure (using Poole and Rosenthal’s optimal classification method) yields
dimensions that are similar in substance to the first two dimensions of Poole and Rosenthal’s
(1997) W-NOMINATE scores for the U.S. Congress.
Methodologically, our approach makes what is known as the local item independence as-
sumption. Formally, this means that items (in our case, newspapers’ endorsement decisions)
are conditionally independent of one another. We can foresee two aspects of our data that
make this assumption unlikely to be met in practice. First, it was commonplace in the first
half of the twentieth century for larger cities and towns to have two newspapers, one of which
tended to be more liberal, the other more conservative. To the extent that this was the case,
it is likely that the responses of those papers are to some extent dependent on one another,
even after holding constant the relative positions of the papers and candidates.
Second, and perhaps of greater concern, is the fact that a single paper’s endorsements
within a given election cannot be assumed to be independent of each other. While for most
of our years of analysis we have information on papers that did not endorse any candidate
(“independent” papers, in Editor and Publisher ’s nomenclature), it is never the case that a
paper endorses both major party candidates. Put differently, a paper’s decision to endorse
(say) the Democratic candidate precludes them from also endorsing the Republican. As a
result, local item independence is likely violated across candidates for a given newspaper in
a particular year. One consequence of this is to induce the estimated candidate positions to
be “mirror images” of one another: a particular paper’s decision to endorse one candidate
is also a decision not to endorse the other, with the result that the estimated ideal points
will be inversely related to a greater extent than they might be if local independence held
(for example, as in Figure 4). In future work, we plan to investigate models that relax
the local item independence assumption; one promising line of research in this vein is the
psychometric literature on “testlet theory” (e.g., Wainer et al. 2007).
21
References
Ansolabehere, Stephen, Rebecca Lessem, and James M. Snyder, Jr. 2006. “The Orientation
of Newspaper Endorsements in U.S. Elections, 1940-2002.” Quarterly Journal of Political
Science 1(4):393-404.
Bailey, Michael A. 2007. “Comparable Preference Estimates Across Time and Institutions
for the Court, Congress, and the Presidency.” American Journal of Political Science
51:433-48.
Bartels, Larry M. 1991. “Constituency Opinion and Congressional Policy Making: The
Reagan Defense Buildup.” American Political Science Review 85:457-74.
Carroll, Royce A., Jeffrey B. Lewis, James Lo, Keith T. Poole, and Howard Rosenthal. 2008.
“Comparing NOMINATE and IDEAL: Points of Difference and Monte Carlo Tests.”
September 30, 2008. SSRN: http://ssrn.com/abstract=1276007.
Clark, Tom, and Benjamin Lauderdale. 2010. “Locating Supreme Court Opinions in Doc-
trine Space.” American Journal of Political Science 54:871-890.
Clinton, Joshua, Simon Jackman, and Douglas Rivers. 2004. “The Statistical Analysis of
Roll Call Data.” American Political Science Review 98:355-70.
Ellis, Christopher, and James A. Stimson. 2007. “On Symbolic Conservatism in America.”
Paper prepared for the Annual Meeting of the American Political Science Association,
September 2, 2007.
Erikson, Robert S. 1978. “Constituency Opinion and Congressional Behavior: A Reexami-
nation of the Miller-Stokes Representation Data.” American Journal of Political Science
22:511-35.
Grafton, Carl, and Anne Permaloff. 2004. “Supplementing Zupan’s Measurements of the
Ideological Preferences of U.S. Presidents.” Public Choice 118:125-131.
Groseclose, Timothy. 2011. Left Turn: How Liberal Media Bias Distorts the American Mind.
New York: St. Martin’s Press.
Ho, Dan, and Kevin Quinn. 2008. “Measuring Explicit Political Positions of Media.” Quar-
terly Journal of Political Science 3:353-77.
Jackman, Simon. 2001. “Multidimensional Analysis of Roll Call Data via Bayesian Sim-
ulation: Identification, Estimation, Inference and Model Checking.” Political Analysis
9:227-41.
22
Jackman, Simon. 2011. “pscl: Classes and Methods for R Developed in the Political
Science Computational Laboratory, Stanford University.” Stanford, California: De-
partment of Political Science, Stanford University. R package version 1.03.10. URL:
http://pscl.stanford.edu.
Jenkins, Jeffrey A., and Brian R. Sala. 1998. “The Spatial Theory of Voting and the
Presidential Election of 1824.” American Journal of Political Science 42(4):1157-79.
Jeong, Gyung-Ho. 2008. “Testing the Predictions of the Multidimensional Spatial Voting
Model with Roll Call Data.” Political Analysis 16:179-96.
Larcinese, Valentino, Ricardo Puglisi, and James M. Snyder. 2007. “Partisan Bias in Eco-
nomic News: Evidence on the Agenda-Setting Behavior of U.S. Newspapers.” Working
paper: Department of Government, London School of Economics and Political Science.
Lewis, Jeffrey B. and Poole, Keith. 2004. “Measuring Bias and Uncertainty in Ideal Point
Estimates via the Parametric Bootstrap.” Political Analysis 12(2): 105-127.
Lindquist, Stefanie, and David E. Klein. 2006. “The Influence of Jurisprudential Consider-
ations on Supreme Court Decisionmaking: A Study of Conflict Cases.” Law & Society
Review 40(1):135-62.
Luce, R. 1959. Individual Choice Behavior. New York: Wiley.
Miller, Warren E., and Donald E. Stokes. 1963. “Constituency Influence in Congress.”
American Political Science Review 57:45-56.
Nemacheck, Christine L. 2008. Strategic Selection: Presidential Nomination of Supreme
Court Justices from Herbert Hoover Through George W. Bush. Charlottesville: Univer-
sity of Virginia Press.
Permaloff, Anne, and Carl Grafton. 2006. “ADA Policies and the Editorial Positions of Four
Publications.” The Social Science Journal 43(2):303-14.
Poole, Keith T., and Nolan McCarty. 1995. “Veto Power and Legislation: An Empirical
Analysis of Executive and Legislative Bargaining from 1961-1986.” Journal of Law,
Economics, and Organization 11:282-312.
Poole, Keith. 2005. Spatial Models of Parliamentary Voting. New York: Cambridge Uni-
versity Press.
Poole, Keith T., Jeffrey Lewis, James Lo, and Royce Carroll. 2007. “Scaling Roll Call Votes
with wnominate in R .” Journal of Statistical Software 22:1-23.
23
Poole, Keith T., and Howard Rosenthal. 1985. “A Spatial Model For Legislative Roll Call
Analysis.” American Journal of Political Science 29(May):357-84.
Poole, Keith T., and Howard Rosenthal. 1991. “Patterns of Congressional Voting.” Ameri-
can Journal of Political Science 35:228-78.
Poole, Keith T., and Howard Rosenthal. 1997. Congress: A Political-Economic History of
Roll Call Voting. New York: Oxford University Press.
Rasch, Georg. 1960. Probabilistic Models for Some Intelligence and Attainment Tests.
Copenhagen: Danish Institute for Educational Research.
Stimson, James A. 1999. Public Opinion in America: Moods, Cycles, and Swings, 2nd Ed.
Boulder, CO: Westview Press.
Treier, Shawn. 2009. “Where Does the President Stand? Measuring Presidential Ideology.”
Working paper: Department of Political Science, University of Minnesota.
Wainer, Howard, Eric T. Bradlow, and Xiaohui Wang. 2007. Testlet Response Theory and
Its Applications. New York: Cambridge University Press.
Zupan, Mark A. 1992. “Measuring the Ideological Preferences of U.S. Presidents: A Proposed
(Extremely Simple) Method.” Public Choice 73(3):351-61.
Zorn, Christopher J., and Gregory A. Caldeira. 2010. “Measuring Supreme Court Ideology.”
Manuscript: Pennsylvania State University.
24

![Caldeira Thiago - free-scores.com · ... ... Fantasie-Impromptu [Op.66] Composer: Chopin, Frédéric Copyright: Copyright © Caldeira Thiago](https://img.pdfslide.us/doc/110x75/5b84a3167f8b9aef498cb7f4/caldeira-thiago-free-fantasie-impromptu-op66-composer-chopin.jpg)