Embed Size (px)
Citation preview
The Impact of Detroit on the State Infant Mortality Rate and the Causes and
Manners of Deaths for Wayne County Infants
The Impact of Detroit on the State Infant Mortality Rate and the Causes and
Manners of Deaths for Wayne County Infants
Gerry PolverentoDepartment Manager
WCMEO
ObjectivesObjectives
Illustrate the comparison of MI infant mortality rate to US mortality rate Illustrate the comparison of the Wayne County
mortality rate to rest of MI Illustrate the Detroit mortality rate and its impact
on Wayne County and MI Mortality rates
Sources of DataSources of Data
1989 - 2009 Michigan Resident Birth and Death Files, Division for Vital Records & Health Statistics, Michigan Department of Community Health.
National Vital Statistics Reports (NVSR), "Births, Marriages, Divorces and Deaths: Provisional Data for 2009". August 27, 2010. Vol 58, No 25.6; NVSR.
"Deaths: Preliminary Data for 2008". December 9, 2010, Vol 59, No 2; NVSR. "Deaths: Final Data for 2007". NVSR Volume 58, Number 19. 73. May 20, 2010.
"Deaths: Final Data for 2006", Vol 57, No. 14, April 2009; and National Center for Health Statistics, historical data.
Wayne County Medical Examiner Office
Terminology ClarificationTerminology Clarification
“Rates” are per 1,000 live births
“Infant” refers to children less than one year old
Governor Snyder’s GoalGovernor Snyder’s Goal
Infant Mortality is one of Governor Snyder’s “dashboard” items.
Why it Matters: Infant mortality is a critical indicator of the overall health and welfare of Michigan and the quality and accessibility of prenatal care for women.
Status of MichiganStatus of Michigan
For every 1,000 Michigan live births, approximately eight infants die before reaching their first birthday In 2009, 881 infants under the age of one year
died, resulting in an infant mortality rate of 7.5 per 1,000 live births
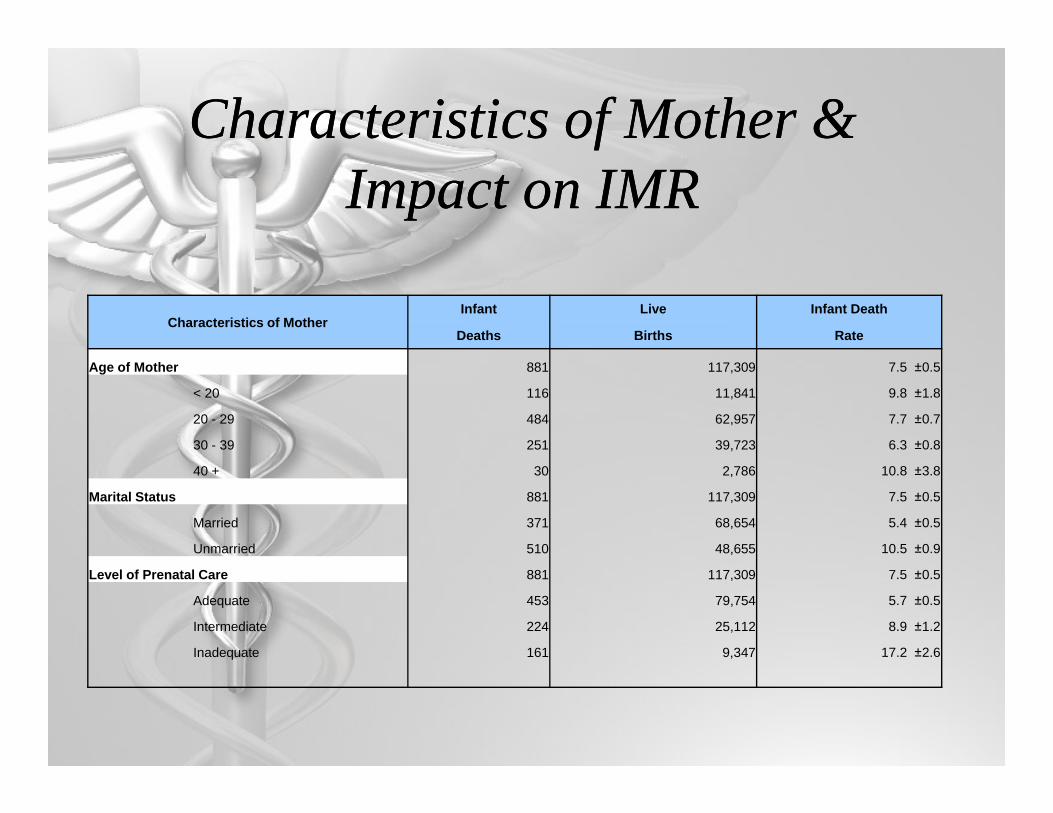
Characteristics of Mother & Impact on IMR
Characteristics of Mother & Impact on IMR
Characteristics of MotherInfant Live Infant Death
Deaths Births Rate
Age of Mother 881 117,309 7.5 ±0.5
< 20 116 11,841 9.8 ±1.8
20 - 29 484 62,957 7.7 ±0.7
30 - 39 251 39,723 6.3 ±0.8
40 + 30 2,786 10.8 ±3.8
Marital Status 881 117,309 7.5 ±0.5
Married 371 68,654 5.4 ±0.5
Unmarried 510 48,655 10.5 ±0.9
Level of Prenatal Care 881 117,309 7.5 ±0.5
Adequate 453 79,754 5.7 ±0.5
Intermediate 224 25,112 8.9 ±1.2
Inadequate 161 9,347 17.2 ±2.6
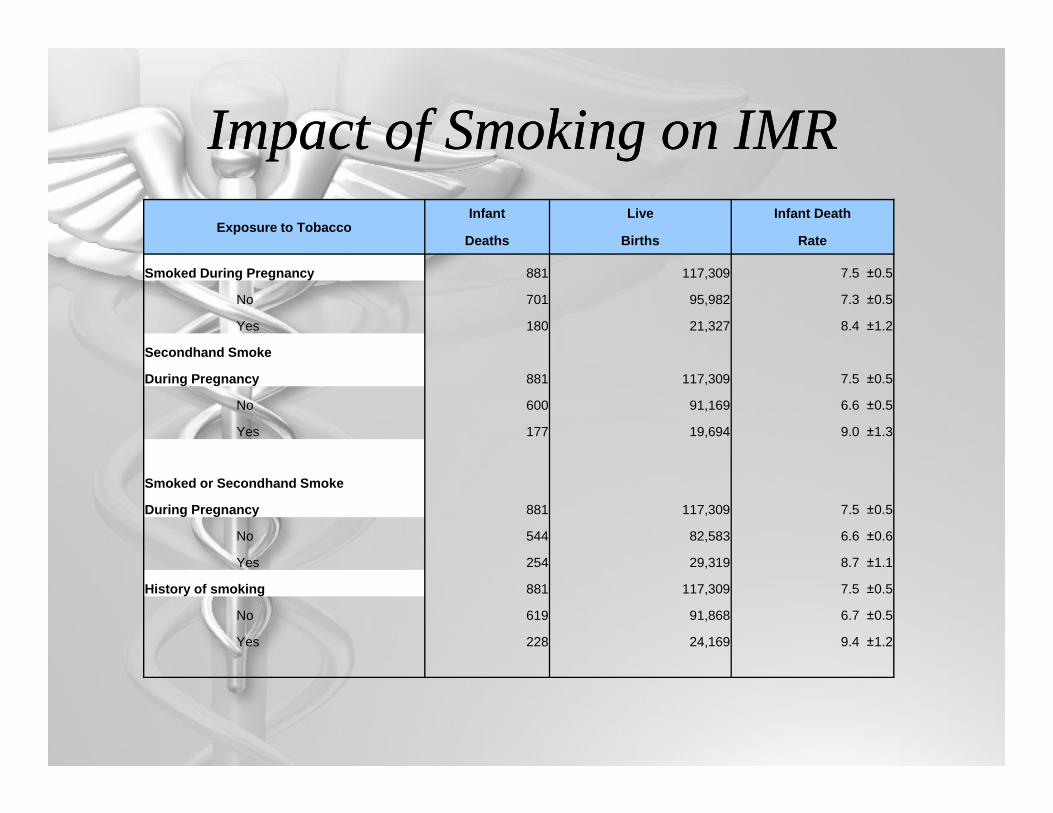
Impact of Smoking on IMRImpact of Smoking on IMRExposure to Tobacco
Infant Live Infant Death
Deaths Births Rate
Smoked During Pregnancy 881 117,309 7.5 ±0.5
No 701 95,982 7.3 ±0.5
Yes 180 21,327 8.4 ±1.2
Secondhand Smoke
881 117,309 7.5 ±0.5During Pregnancy
No 600 91,169 6.6 ±0.5
Yes 177 19,694 9.0 ±1.3
Smoked or Secondhand Smoke
881 117,309 7.5 ±0.5During Pregnancy
No 544 82,583 6.6 ±0.6
Yes 254 29,319 8.7 ±1.1
History of smoking 881 117,309 7.5 ±0.5
No 619 91,868 6.7 ±0.5
Yes 228 24,169 9.4 ±1.2
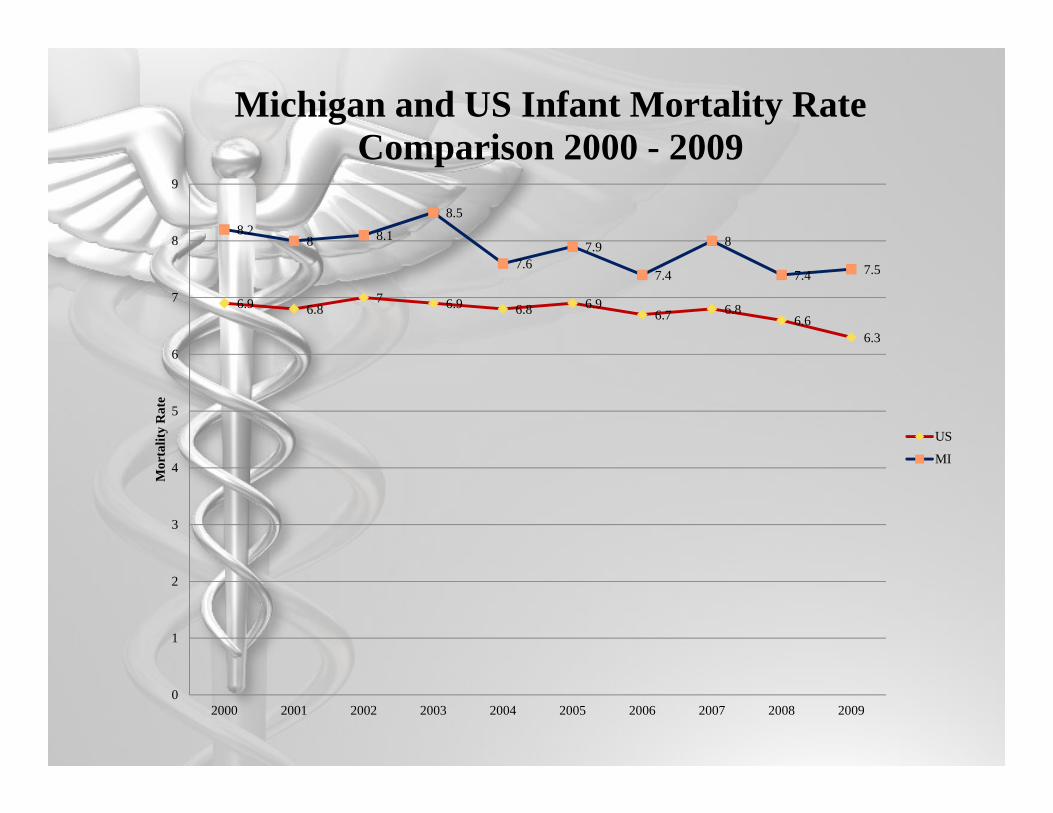
6.9 6.87 6.9 6.8 6.9
6.7 6.86.6
6.3
8.28 8.1
8.5
7.67.9
7.4
8
7.4 7.5
0
1
2
3
4
5
6
7
8
9
2000 2001 2002 2003 2004 2005 2006 2007 2008 2009
Mor
talit
y R
ate
Michigan and US Infant Mortality Rate Comparison 2000 - 2009
US
MI
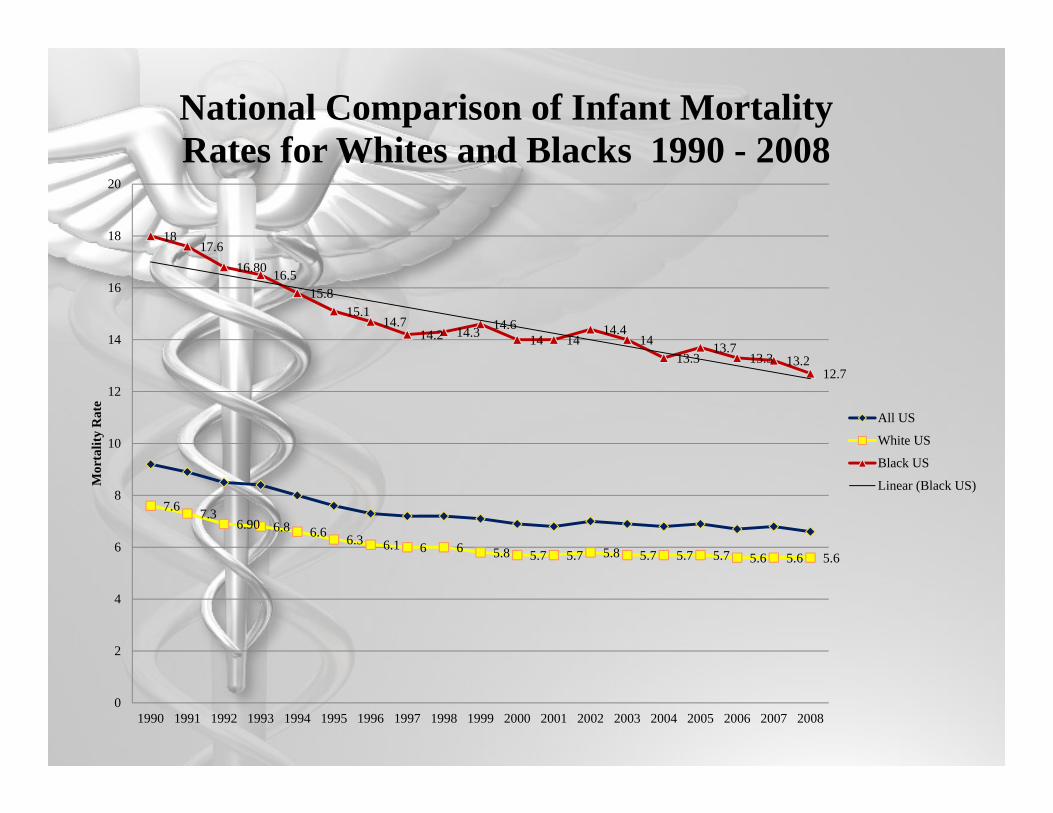
7.6 7.36.90 6.8 6.6 6.3 6.1 6 6 5.8 5.7 5.7 5.8 5.7 5.7 5.7 5.6 5.6 5.6
1817.6
16.80 16.515.8
15.114.7
14.2 14.3 14.614 14
14.414
13.313.7
13.3 13.212.7
0
2
4
6
8
10
12
14
16
18
20
1990 1991 1992 1993 1994 1995 1996 1997 1998 1999 2000 2001 2002 2003 2004 2005 2006 2007 2008
Mor
talit
y R
ate
National Comparison of Infant Mortality Rates for Whites and Blacks 1990 - 2008
All US
White US
Black US
Linear (Black US)
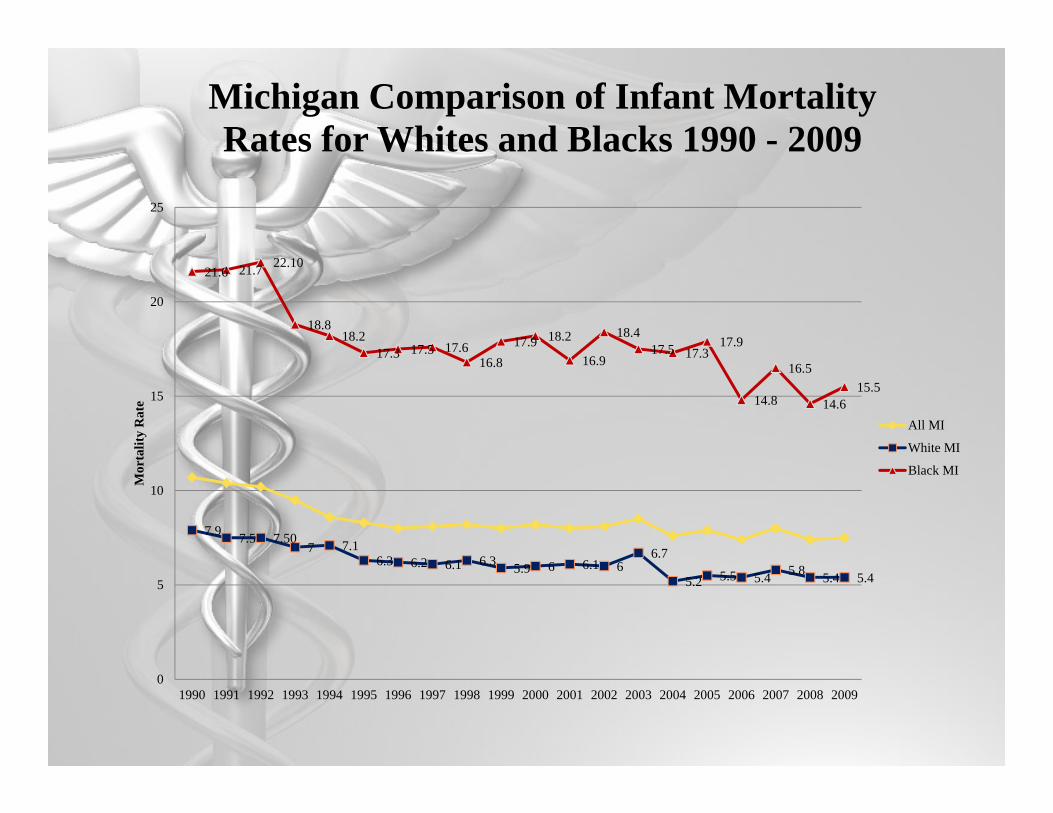
7.9 7.5 7.507 7.1
6.3 6.2 6.1 6.3 5.9 6 6.1 66.7
5.2 5.5 5.4 5.8 5.4 5.4
21.6 21.7 22.10
18.818.2
17.3 17.5 17.616.8
17.9 18.2
16.9
18.417.5 17.3
17.9
14.8
16.5
14.615.5
0
5
10
15
20
25
1990 1991 1992 1993 1994 1995 1996 1997 1998 1999 2000 2001 2002 2003 2004 2005 2006 2007 2008 2009
Mor
talit
y R
ate
Michigan Comparison of Infant Mortality Rates for Whites and Blacks 1990 - 2009
All MI
White MI
Black MI
Race Disparities in the Infant Mortality Rate in Michigan for 2009
Race Disparities in the Infant Mortality Rate in Michigan for 2009
Infant Mortality Rate for Whites in MI is 5.4 Infant Mortality Rate for Blacks in MI is 15.5 Infant Mortality Rate for other races in MI is 6.6
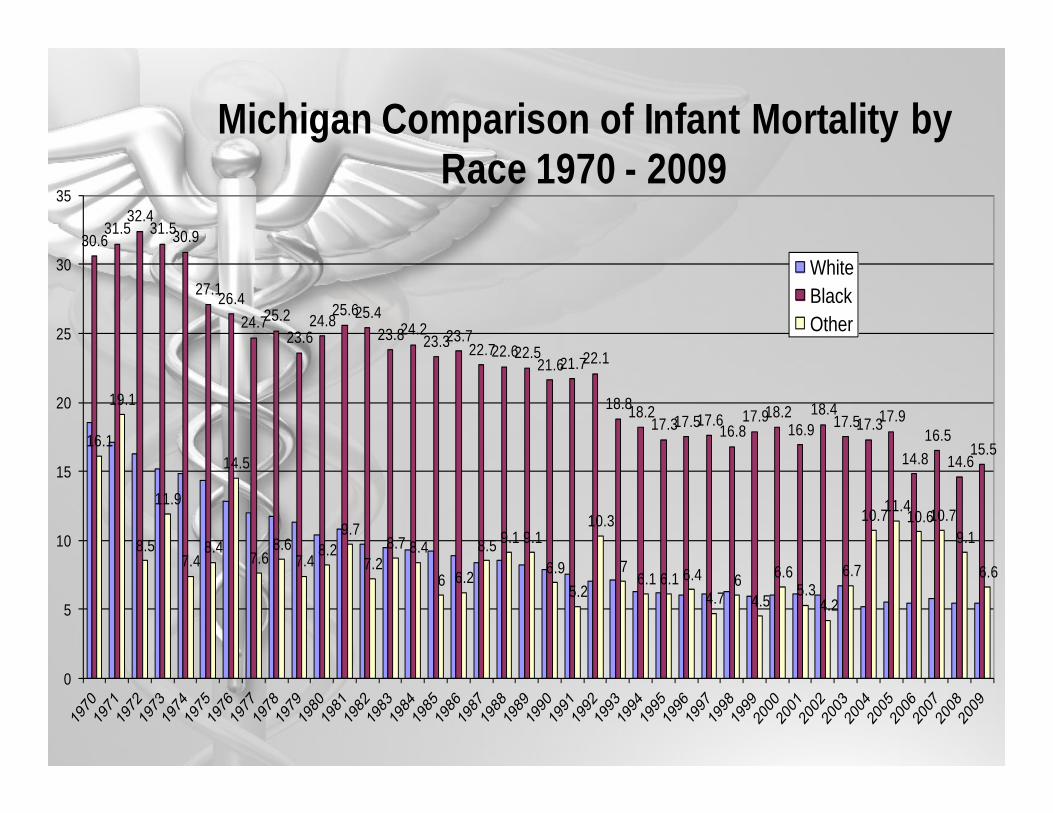
30.631.5
32.431.530.9
27.126.424.725.2
23.624.8
25.625.423.824.2
23.323.722.722.622.5
21.621.722.1
18.818.217.317.517.6
16.817.918.2
16.918.4
17.517.317.9
14.816.5
14.615.516.1
19.1
8.5
11.9
7.48.4
14.5
7.68.6
7.48.2
9.7
7.28.7 8.4
6 6.2
8.5 9.1 9.1
6.95.2
10.3
76.1 6.1 6.4
4.76
4.5
6.65.3
4.2
6.7
10.711.410.610.7
9.1
6.6
0
5
10
15
20
25
30
35
Michigan Comparison of Infant Mortality by Race 1970 - 2009
WhiteBlackOther
Wayne County’s Status -2009Wayne County’s Status -2009
As mentioned before – MI Infant Mortality Rate is 7.5
The Infant Mortality Rate for Wayne County is 10.1
10.710.4 10.2
9.5
8.68.3
8 8.1 8.2 8 8.2 8 8.18.5
7.67.9
7.48
7.4 7.5
8.7 8.88.2 8.3
7.3 7.47.1 7.2 7.4
7.17.4 7.5
7.17.5
6.77.1 7.3 7.3
6.56.8
0
2
4
6
8
10
12
1990 1991 1992 1993 1994 1995 1996 1997 1998 1999 2000 2001 2002 2003 2004 2005 2006 2007 2008 2009
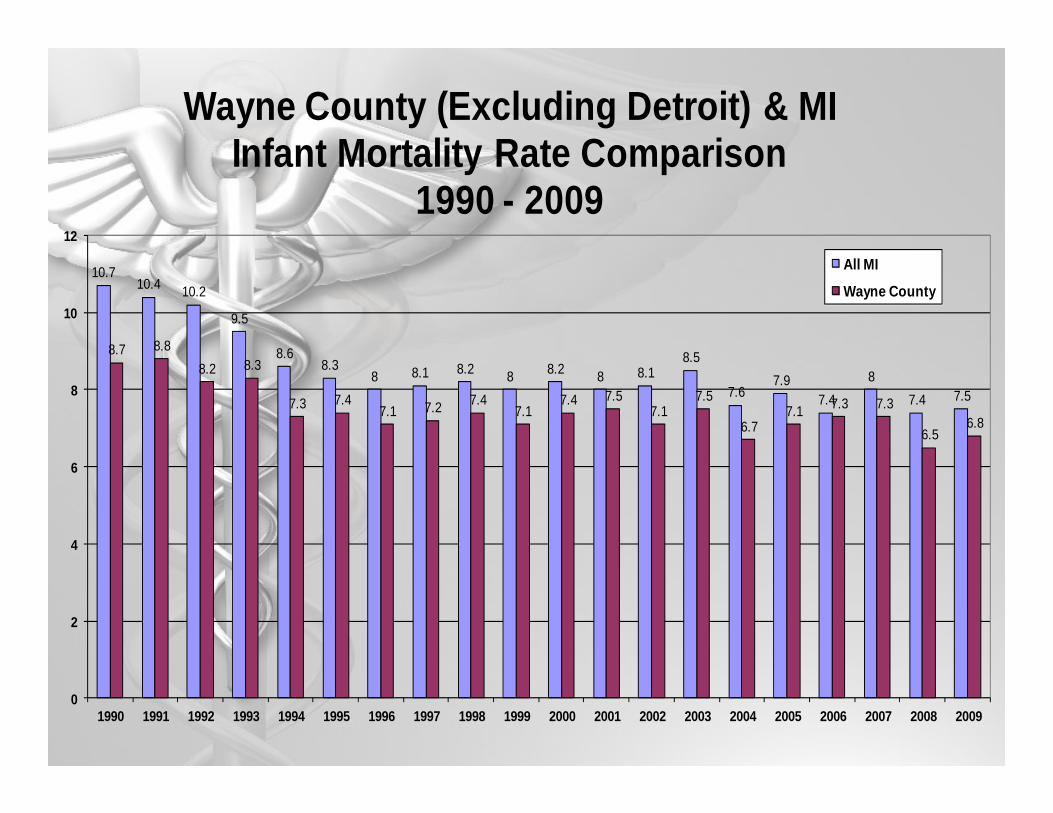
Wayne County (Excluding Detroit) & MI Infant Mortality Rate Comparison
1990 - 2009All MI
Wayne County
Michigan, Wayne County and Detroit IMR Comparison - 2009
Michigan, Wayne County and Detroit IMR Comparison - 2009
MI IMR is 6.8 when Wayne County is removed from statistics (much closer to the national IMR of 6.3)Wayne County IMR is 6.2 when Detroit is
removed from statistics Detroit IMR is 14.8
8.7 8.88.2 8.3
7.3 7.4 7.1 7.2 7.4 7.1 7.4 7.5 7.1 7.56.7 7.1 7.3 7.3
6.5 6.8
10.3
8.4 8.17.1 6.8
5.86.7 6.6 6.6 6.4 6.6
5.1
6.9
8.1
6.1 6.5 6.8 6.57.1
20.319.4
21.4
17.216.6
15.615 15.1 14.7
15.514.7
14
16.7 16.315.5 15.9
13.4
14.9 14.9 14.8
0
5
10
15
20
25
1990 1991 1992 1993 1994 1995 1996 1997 1998 1999 2000 2001 2002 2003 2004 2005 2006 2007 2008 2009
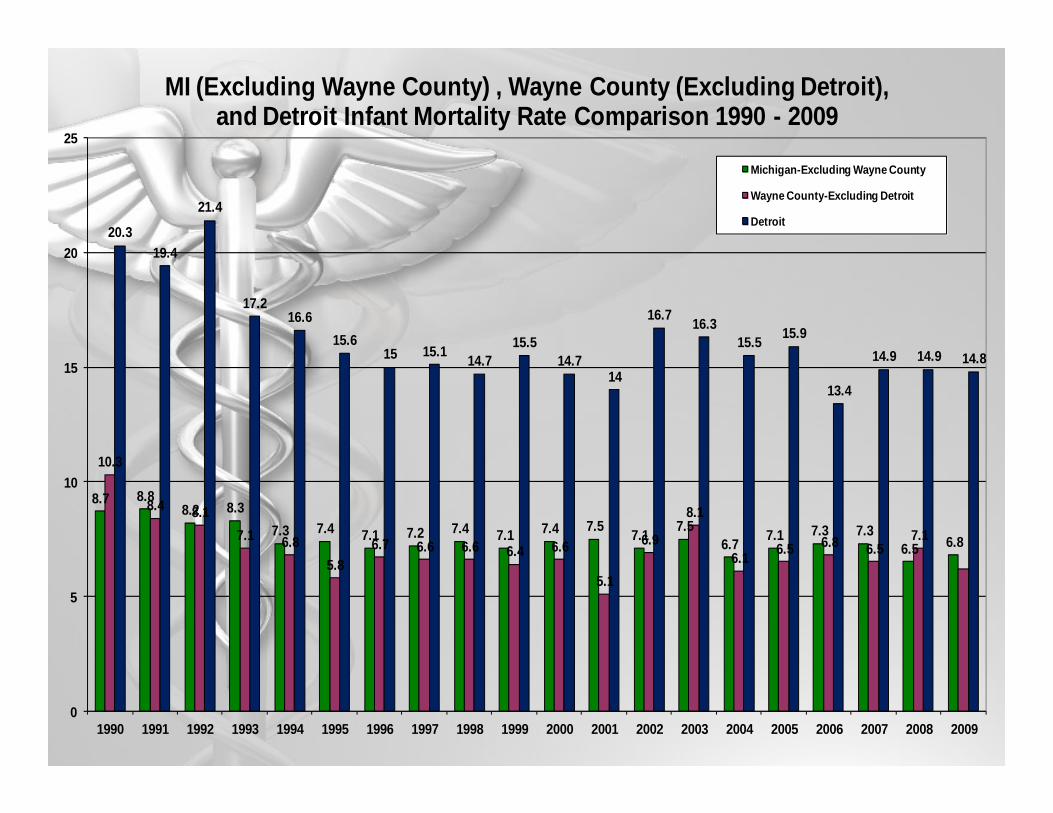
MI (Excluding Wayne County) , Wayne County (Excluding Detroit), and Detroit Infant Mortality Rate Comparison 1990 - 2009
Michigan-Excluding Wayne County
Wayne County-Excluding Detroit
Detroit
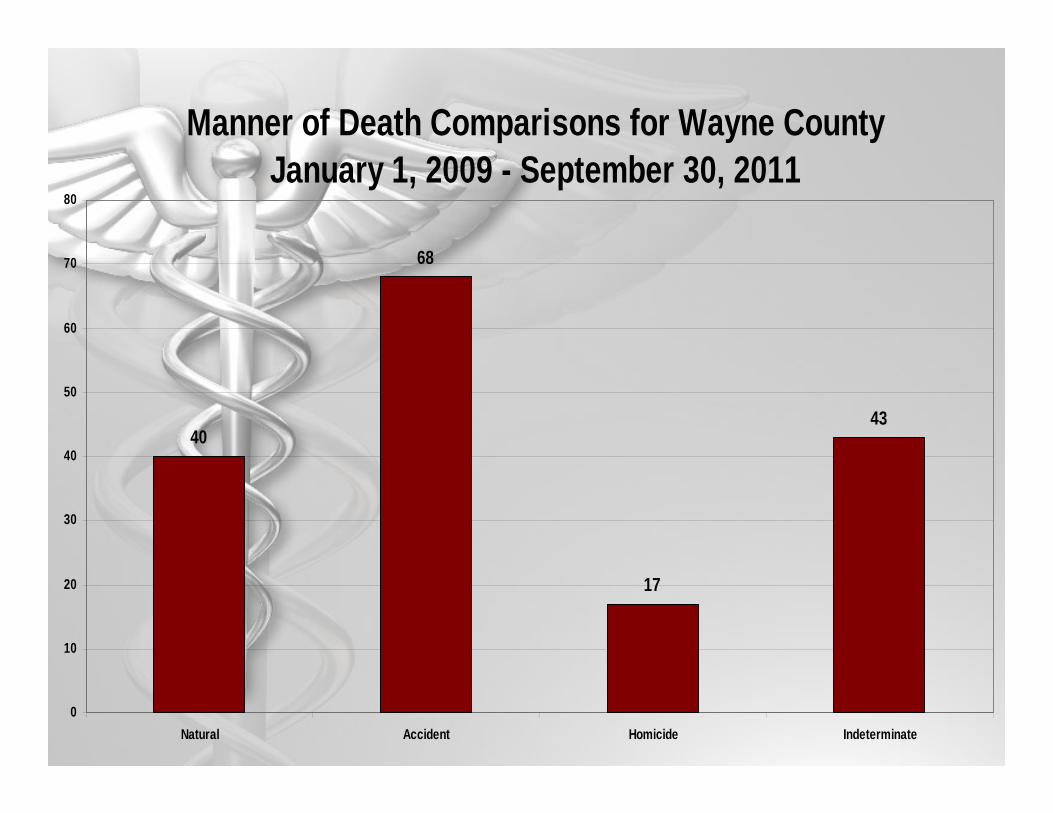
Manner of Death Comparisons for Wayne County January 1, 2009 - September 30, 2011
40
68
17
43
0
10
20
30
40
50
60
70
80
Natural Accident Homicide Indeterminate
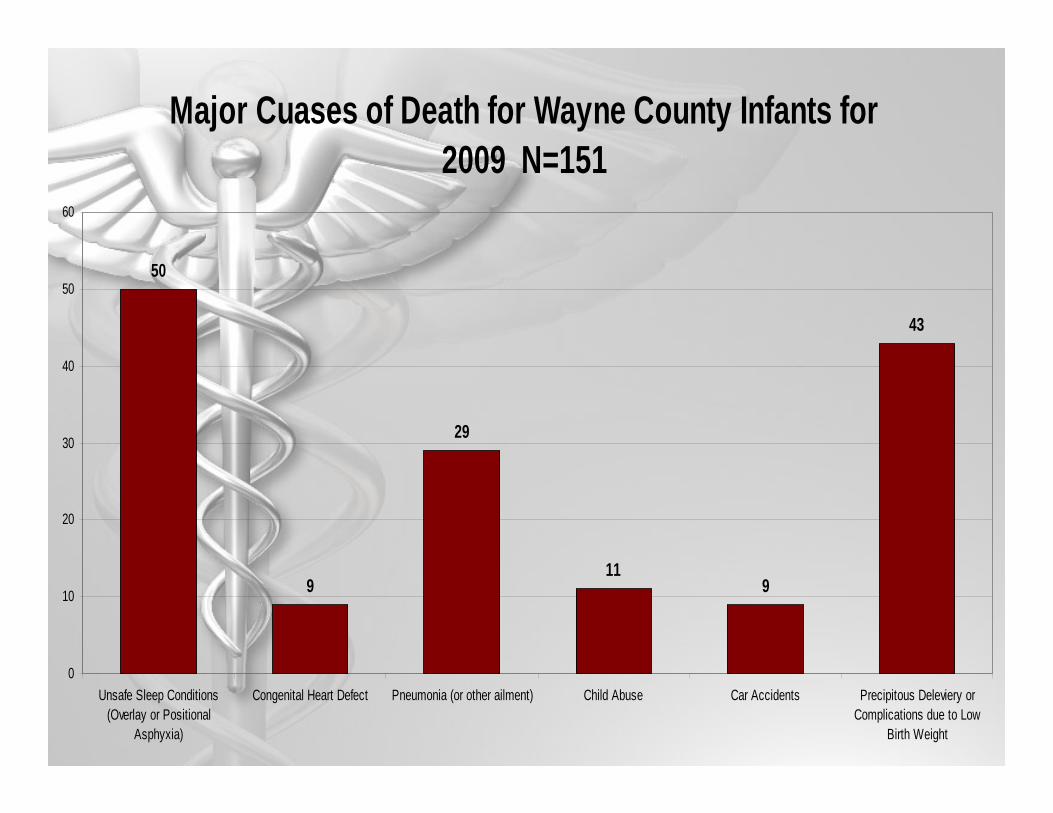
Major Cuases of Death for Wayne County Infants for 2009 N=151
50
9
29
119
43
0
10
20
30
40
50
60
Unsafe Sleep Conditions(Overlay or Positional
Asphyxia)
Congenital Heart Defect Pneumonia (or other ailment) Child Abuse Car Accidents Precipitous Deleviery orComplications due to Low
Birth Weight
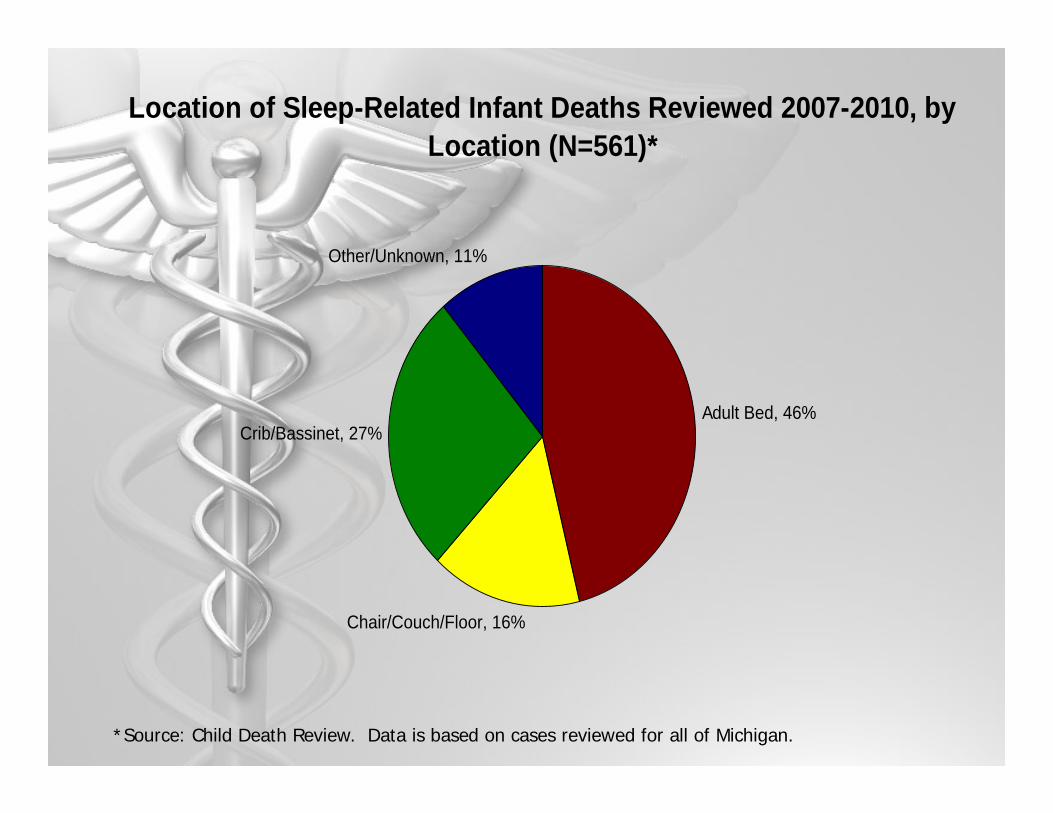
Location of Sleep-Related Infant Deaths Reviewed 2007-2010, by Location (N=561)*
Adult Bed, 46%
Chair/Couch/Floor, 16%
Crib/Bassinet, 27%
Other/Unknown, 11%
*Source: Child Death Review. Data is based on cases reviewed for all of Michigan.
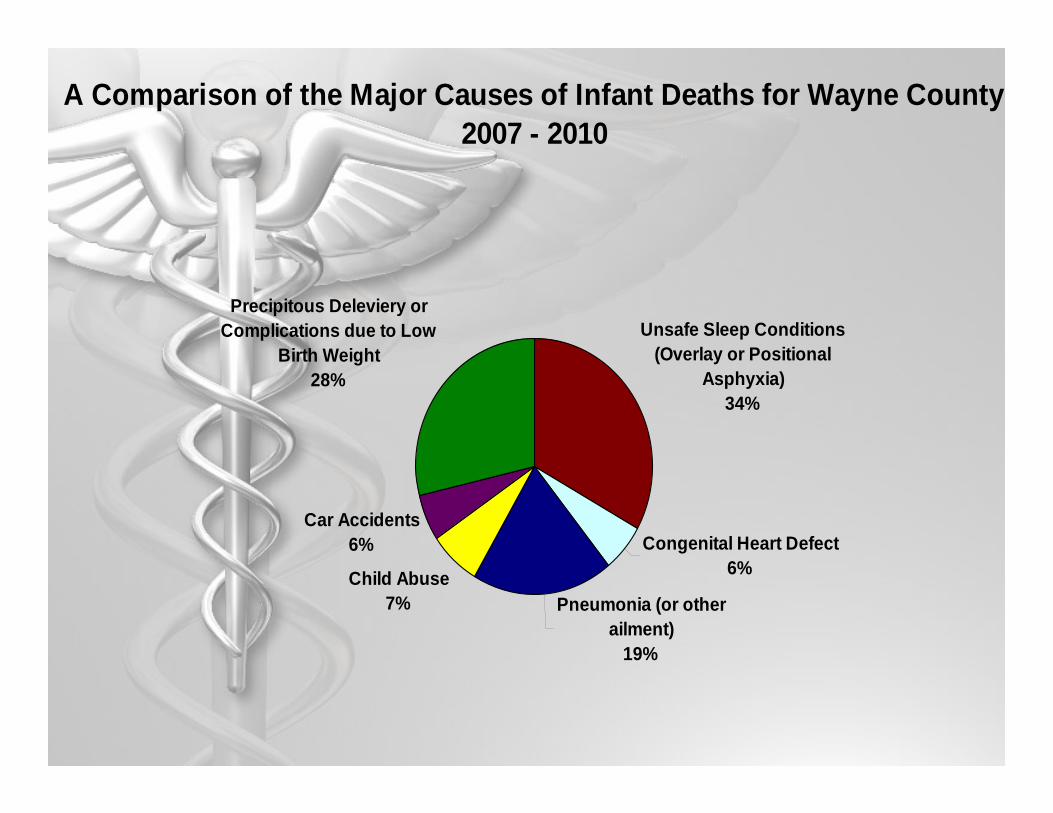
A Comparison of the Major Causes of Infant Deaths for Wayne County 2007 - 2010
Unsafe Sleep Conditions (Overlay or Positional
Asphyxia)34%
Congenital Heart Defect6%
Pneumonia (or other ailment)
19%
Child Abuse7%
Car Accidents6%
Precipitous Deleviery or Complications due to Low
Birth Weight28%
ConclusionConclusion Detroit IMR has a big impact on the State IMR The two leading causes of deaths in Wayne County are natural deaths, and
unsafe sleep conditions Targeted efforts to reduce infant deaths due to unsafe sleep have greatest
chance to move Governor Snyder’s IMR “dashboard” item in the right direction
Infant mortality (children under two years of age) is still a significant public health problem in Wayne County and especially in Detroit.
The vast majority of infant deaths seen at the Medical Examiner Office have identifiable environmental risk factors (e.g. co-sleeping, unsafe sleep surfaces, objects in crib, etc…). Many of these risk-factors can be ameliorated by stepped-up prevention efforts.
Excluding Detroit, the infant mortality rate (number of deaths per 1,000 live births) in Wayne County is similar to that of Michigan’s and the National infant mortality rate.

Questions & Contact InfoQuestions & Contact Info
Gerry PolverentoDepartment ManagerWayne County Medical
Examiner Office1300 Warren Ave.Detroit, MI [email protected]