Embed Size (px)
Citation preview
THE GROWTH OF BACTERIAL CULTURES
BY JACQUES MONODPasteur Institute, Paris, France
INTRODUCTION
The study of the growth of bacterial cultures does not consti-tute a specialized subject or branch of research: it is the basicmethod of Microbiology. It would be a foolish enterprise, anddoomed to failure, to attempt reviewing briefly a "subject"which covers actually our whole discipline. Unless, of course, weconsidered the formal laws of growth for their own sake, an ap-proach which has repeatedly proved sterile. In the present reviewwe shall consider bacterial growth as a method for the study ofbacterial physiology and biochemistry. More precisely, we shallconcern ourselves with the quantitative aspects of the method,with the interpretation of quantitative data referring to bacterialgrowth. Furthermore, we shall considerz exclusively the positivephases of growth, since the study of bacterial "death," i.e., of thenegative phases of growth, involves distinct problems and meth-ods. The discussion will be limited to populations consideredgenetically homogeneous. The problems of mutation and selectionin growing cultures have been excellently dealt with in recentreview articles by Delbriick (1) and Luria (2).
No attempt is made at reviewing the literature on a subjectwhich, as we have just seen, is not really a subject at all. Thepapers and results quoted have been selected as illustrations of thepoints discussed.
DEFINITION OF GROWTH PHASESAND GROWTH CONSTANTS
Division RATE AND GROWTH RATE
In all that follows, we shall define "cell concentration" asthe number of individual cells per unit volume of a culture and"bacterial density" as the dry weight of cells per unit volume of aculture.
Consider a unit volume of a growing culture containing at timet, a certain number x, of cells. After a certain time has elapsed,
371
www.annualreviews.org/aronlineAnnual Reviews
Ann
u. R
ev. M
icro
biol
. 194
9.3:
371-
394.
Dow
nloa
ded
from
arj
ourn
als.
annu
alre
view
s.or
gby
Cal
ifor
nia
Inst
itute
of
Tec
hnol
ogy
on 0
9/17
/07.
For
per
sona
l use
onl
y.
372 MONOD
all the ceils have divided once. The number of ceils per unitvolume (cell concentration) is then
x = xx’2;
after n divisions it will be
x -- xt.2n.
If r is the number of divisions per unit time, we have at time t~:
or using logarithms to the base 2.
log2x2 - log2xl, ............... [11
where r is the mean division rate in the time interval t~-tx. Indefining it we have considered the increase in cell concentration.When the average size of the cells does not change in the timeinterval considered, the increase in "bacterial density" is propor-tional to the increase in cell concentration. Whether growth isestimated in terms of one or the other variable, the growth rateis the sameL
However, as established in particular by the classical studiesof Henrici (3), the average size of the cells may vary considerablyfrom one phase to another of a growth cycle. It follows that thetwo variables, cell concentration and bacterial density, are notequivalent. Much confusion has been created because this im-portant distinction has been frequently overlooked. Actually, oneor the other variable may be more significant, depending on thetype of problem considered. In most of the experimental problemsof bacterial chemistry, metabolism, and nutrition, the significantvariable is bacterial density. Cell concentration is essential onlyin problems where division is actually concerned, or where aknowledge of the elementary composition of the populations isimportant (mutation, selection, etc.).
a The use of log base 2 in place of log base 10 simplifies all the calculationsconnected with growth rates. It is especially convenient for the graphical repre-sentation of growth curves. If log2 of the bacterial density (1og2--3.322 log~0) plotted against time, an increase of one unit in ordinates corresponds to one divi-sion (or doubling). The number of divisions that have occurred during any timeinterval is given by the difference of the ordinates of the corresponding points.It is desirable that this practice should become generalized.
www.annualreviews.org/aronlineAnnual Reviews
Ann
u. R
ev. M
icro
biol
. 194
9.3:
371-
394.
Dow
nloa
ded
from
arj
ourn
als.
annu
alre
view
s.or
gby
Cal
ifor
nia
Inst
itute
of
Tec
hnol
ogy
on 0
9/17
/07.
For
per
sona
l use
onl
y.

GROWTH OF BACTERIAL CULTURES 373
Although the two variables are not equivalent, it is convenientto express growth rates in the same units (i.e., number of doublingsper hour) in both cases. When cell concentrations have beenestimated, it is equivalent to the true division rate. When bacterialdensity is considered, it expresses the number of doublings ofbacterial density per unit time, or the division rate of cells postu-lated to be of constant average size. In all that follows, unlessspecified, we shall consider growth and growth rates in terms ofbacterial density.
These definitions involve the implicit assumption that in agrowing culture all the bacteria are viable, i.e., capable of divisionor at least that only an insignificant fraction of the cells are notcapable of giving rise to a clone. This appears to be a fairly goodassumption, provided homogeneous populations only are con-~idered. It has been challenged however [Wilson (4)] on the basisof comparisons of total and viable counts. But the cultures ex-amined by Wilson were probably not homogeneous (see p. 378),and the value of the viable count in determining the "absolute"number of cells which should be considered viable under theconditions of the culture is necessarily doubtful (see p. 378).Direct observations by Kelly & Rahn (5) contradict these findingsand justify the assumption. [See also Lemon (42) and Topley Wilson (43).]
GROWTH PHASES
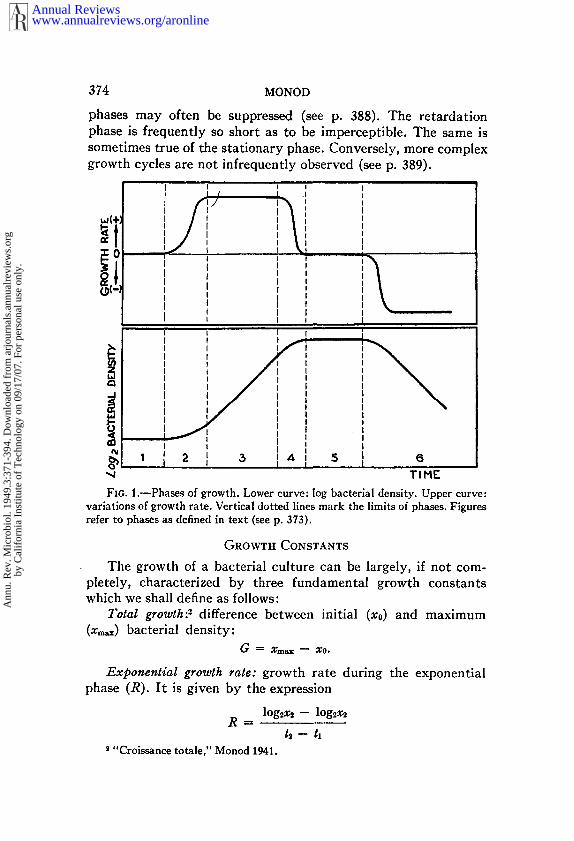
In the growth of a bacterial culture, a succession of phases,characterized by variations of the growth rate, may be conveni-ently distinguished. This is a classical conception, but the differentphases have not always been defined in the same way. The follow-ing definitions illustrated in Fig. 1 will be adopted here:
1. lag phase: growth rate null;2. acceleration phase: growth rate increases;3. exponential phase: growth rate constant;4. retardation phase: growth rate decreases;5. stationary phase: growth rate null;6. phase of decline: growth rate negative.
This is a generalized and rather composite picture of the growthof a bacterial culture. Actually, any one or several of these phasesmay be absent. Under suitable conditions, the lag and acceleration
www.annualreviews.org/aronlineAnnual Reviews
Ann
u. R
ev. M
icro
biol
. 194
9.3:
371-
394.
Dow
nloa
ded
from
arj
ourn
als.
annu
alre
view
s.or
gby
Cal
ifor
nia
Inst
itute
of
Tec
hnol
ogy
on 0
9/17
/07.
For
per
sona
l use
onl
y.
374 MONOD
phases may often be suppressed (see p. 388). The retardationphase is frequently so short as to be imperceptible. The same issometimes true of the stationary phase. Conversely, more complexgrowth cycles are not infrequently observed (see p. 389).
i
6TIME
FzG. 1.--Phases o[ growth. Lower curve: log bacterial density. Upper curve:variations of growth rate. Vertical dotted lines mark the limits of phases. Figuresrefer to phases as defined in text (see p. 373).
GROWTH CONSTANTS
The growth of a bacterial culture can be largely, if not com-pletely, characterized by three fundamental growth constantswhich we shall define as follows:
Total growth:2 difference between initial (xo) and maximum(x~) bacterial density:
G -- Xm~-
Exponential growth rate: growth rate during the exponentialphase (R). It is given by the expression
log2x2- log2x2R=
t2 -- txs "Croissanee totale," Monod 1941.
www.annualreviews.org/aronlineAnnual Reviews
Ann
u. R
ev. M
icro
biol
. 194
9.3:
371-
394.
Dow
nloa
ded
from
arj
ourn
als.
annu
alre
view
s.or
gby
Cal
ifor
nia
Inst
itute
of
Tec
hnol
ogy
on 0
9/17
/07.
For
per
sona
l use
onl
y.
GROWTH OF BACTERIAL CULTURES 375
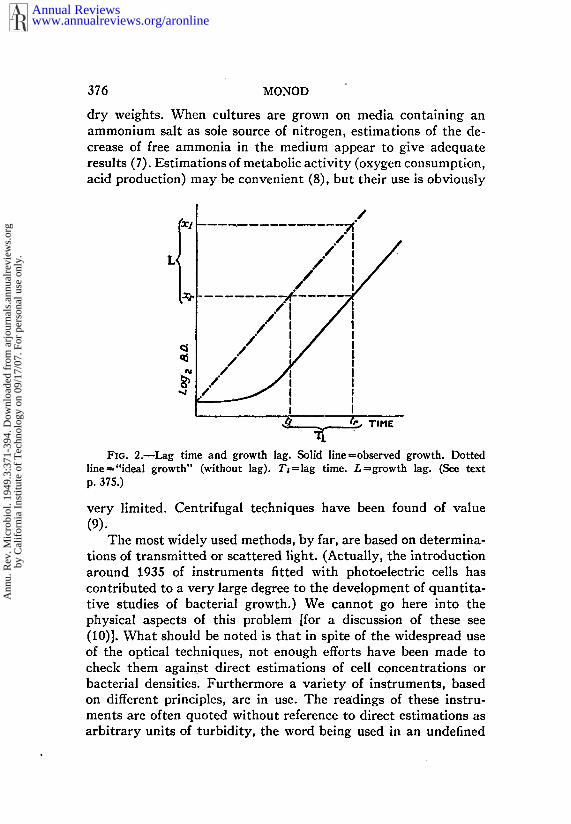
when h-t1 is any time interval within.the exponential phase.Lc~g time and growth lag.--The lag is often defined as the duration
of the lag phase proper. This definition is unsatisfactory for tworeasons: (a) it does not take into account the duration of theacceleration phase; (b) due to the shape of the growth curve, it difficult to determine the end of the lag phase with any precision.
As proposed by Lodge & Hinshelwood (6), a convenient lagconstant which we shall call lag time (T0 may be defined as thedifference between the observed time (tr) when the culture reachesa certain density (xr) chosen within the exponential phase, and the"ideal" time at which the same density would have been reached(t0 had the exponential growth rate prevailed from the start, i.e.,had the culture grown without any lag T~ = tr-t~, or
log~, - log~x0
The constant thus defined is significant only when cultureshaving the same exponential growth rate are compared. A moregeneral definition of a lag constant should be based on physiologicalrather than on absolute times. For this purpose, another constantwhich may be called growth lag (L) can be defined
L = TrR.
L is the difference in number of divisions between observed andideal growth during the exponential phase. T~ and L values areconveniently determined graphically (Fig. 2).
ON TECHNIQUES
ESTI~IATION OF GROWTH
Bearing these definitions in mind, a few general remarks maybe made about the techniques employed for the estimation ofbacterial density and cell concentrations.
]3c~cteri~l density.--For the estimation of bacterial density,the basic method is, by definition, the determination of the dryweights. However, as it is much too cumbersome (and accurateonly if relatively large amounts of cells can be used) it is employedmainly as a check of other indirect methods.
Various indirect chemical methods have been used. Nitrogendeterminations are generally found to check satisfactorily with
www.annualreviews.org/aronlineAnnual Reviews
Ann
u. R
ev. M
icro
biol
. 194
9.3:
371-
394.
Dow
nloa
ded
from
arj
ourn
als.
annu
alre
view
s.or
gby
Cal
ifor
nia
Inst
itute
of
Tec
hnol
ogy
on 0
9/17
/07.
For
per
sona
l use
onl
y.
376 MONOD
dry weights. When cultures are grown on media containing anammonium salt as sole source of nitrogen, estimations of the de-crease of free ammonia in the medium appear to give adequateresults (7). Estimations of metabolic activity (oxygen consumption,acid production) may be convenient (8), but their use is obviously
/ ~ /I
~ / Z I/ /I I
iI
FIG. 2.--Lag time and growth lag. ~lid line~ob~rved growth. Dottedline ~ "ideal growth" (without lag). T~=lag time. L=growth lag. (~ p. 375.)
very limited. Centrifugal techniques have been found of value(9).
The most widely used methods, by far, are based on determina-tions of transmitted or scattered light. (Actually, the introductionaround 1935 of instruments fitted with photoelectric cells hascontributed to a very large degree to the development of quantita-tive studies of bacterial growth.) We cannot go here into thephysical aspects of this problem [for a discussion of these see(10)]. What should be noted is that in spite of the widespread useof the optical techniques, not enough efforts have been made tocheck them against direct estimations of cell concentrations orbacterial densities. Furthermore a variety of instruments, basedon different principles, are in use. The readings of these instru-ments are often quoted without reference to direct estimations asarbitrary units of turbidity, the word being used in an undefined
www.annualreviews.org/aronlineAnnual Reviews
Ann
u. R
ev. M
icro
biol
. 194
9.3:
371-
394.
Dow
nloa
ded
from
arj
ourn
als.
annu
alre
view
s.or
gby
Cal
ifor
nia
Inst
itute
of
Tec
hnol
ogy
on 0
9/17
/07.
For
per
sona
l use
onl
y.
GROWTH OF BACTERIAL CULTURES 377
sense, or as "galvanometer deflections" which is worse. Thispractice introduces no little confusion and indeterminacy in theinterpretation and comparison of data. It should be avoided.
Whatever instruments are used, the readings should be checkedagainst bacterial density or cell concentration determinations, andthe checks should be performed not only on different dilutions ofa bacterial suspension, but at various times during the growth ofa control culture. Only thus will the effects of variations of sizeof the cells be controlled. Without such controls it is impossibleto decide whether the readings can be interpreted in terms ofbacterial density or cell concentration, or both, or neither.
Actually, the instruments best fitted for the purpose appear tobe those which give readings in terms of optical density (log Io/I).With cultures well dispersed, it is generally found that opticaldensity remains proportional to bacterial density throughout thepositive phases of growth of the cultures (11). When this require-ment is fulfilled, optical density determinations provide an ade-quate and extremely convenient method of estimating bacterialdensity.
It is often convenient to express optical density measurementsin terms of cell concentrations. For this purpose, the two estima-tions should be compared during the exponential phase. The data,expressed as cell concentrations, may then be considered as refer-ring to "standard cells," equal in size to the real bacteria observedduring the exponential phase, larger than bacteria in the stationaryphase and probably smaller than those in the acceleration phase.
Cell concentration.--Cell concentration determinations are per-formed either by direct counts (total counts) or by indirect (viable)counts. The value of the first method depends very much ontechnical details which cannot be discussed here. Its interpretationdepends on the properties of the strains (and media) and unequivocal only with organisms which do not tend to remainassociated in chains or clumps. Total counts are evidently mean-ingless when there is even a slight tendency to clumping.
The same remarks apply to the indirect, so called viable, countsmade by plating out suitable dilutions of the culture on solid media.The method has an additional difficulty, as it gives only the num-ber of cells capable of giving rise to a colony on agar under condi-tions widely different from those prevailing in the culture. Manyorganisms, such as pneumococci (12), are extremely sensitive
www.annualreviews.org/aronlineAnnual Reviews
Ann
u. R
ev. M
icro
biol
. 194
9.3:
371-
394.
Dow
nloa
ded
from
arj
ourn
als.
annu
alre
view
s.or
gby
Cal
ifor
nia
Inst
itute
of
Tec
hnol
ogy
on 0
9/17
/07.
For
per
sona
l use
onl
y.
378 MONOD
sudden changes in the composition of the medium. The mereabsence of a carbon source will induce "flash lysis" of B~zcillussubtilis (13). Such effects may be, in part at least, responsible forthe discrepancies often found between total and viable counts.
In spite of these difficulties viable counts retain the undisputedprivilege of being by far the most sensitive method and of alonepermitting differential counting in the analysis of complex popula-tions. In the latter case, relative numbers are generally the signi-ficant variable, and whether or not the counts give a reasonablyaccurate estimation of absolute cell concentrations is unimportant.
METHODS OF CULTURE
Although the methods of culture will vary according to theproblems investigated, certain general requirements must be metin any case. The most important one is that the cultures shouldbe constantly mixed, homogenized, and in equilibrium with thegas phase. This is achieved either by shaking or by bubbling air(or other gas mixtures) or both. Bubbling is often found inefficient.unless very vigorous, when it may provoke foaming which shouldbe avoided. Slow rocking of a thin layer of liquid is the simplestand probably the best procedure. [For detailed descriptions oftechniques, see (14).]
Various techniques for the continuous renewal of the medium
have been described (15) and should be found useful for certaintypes of experiments (see p. 385).
The composition of the medium is largely determined by thenature of the experiment, and the properties of the strains. Onegeneral rule should however, so far as possible, be followed in theplanning of quantitative growth experiments. As a culture grows,the conditions in the medium alter in a largely uncontrollable andunknown way. Therefore, the observations should be performedwhile the departure from initial conditions may still be consideredinsignificant. The more dilute the cultures, the closer will this re-quirement be met. The sensitivity of optical density measurementsmakes it practicable to restrict most experiments to a range ofbacterial densities not exceeding 0.25 mg. dry weight per ml.
THE PHYSIOLOGICAL SIGNIFICANCE OF THEGROWTH CONSTANT
TOTAL GROWTIt
Limiting factors.--The metabolic activity of bacterial cells
www.annualreviews.org/aronlineAnnual Reviews
Ann
u. R
ev. M
icro
biol
. 194
9.3:
371-
394.
Dow
nloa
ded
from
arj
ourn
als.
annu
alre
view
s.or
gby
Cal
ifor
nia
Inst
itute
of
Tec
hnol
ogy
on 0
9/17
/07.
For
per
sona
l use
onl
y.
GROWTH OF BACTERIAL CULTURES 379
modifies the composition of the medium in which they grow.Depending on the initial conditions, and on the properties of thestrains, one or another, or several, of these changes will eventuallyresult in a decrease of the growth rate, bringing the exponentialphase to an end, and leading more or less rapidly to the completecessation of growth.
The factors most commonly found to be limiting can, as arule, be classified in one of the following groups: (a) exhaustion nutrients; (b) accumulation of toxic metabolic products; and(c) changes in ion equilibrium, especially pH.
The physiological significance of the constant G (total growth)depends on the nature of the limiting factor. It is uninterpretablewhen the limiting factor is unknown, or when several factorscooperate in limiting growth. The conditions of an experimentwhere G is to be estimated must therefore be such that a singlelimiting factor is at work. This may be considered to be the caseonly where it can be shown that no change, other than the oneconsidered, plays a significant part both in breaking the exponen-tial phase and in stopping the growth. Provided these requirementsare met, the utilization of G as a measure of the effect of a limitingfactor is warranted.
Actually, the estimation of G is especially useful when thelimiting factor is a single, known, essential nutrient. Under suchconditions, it can be a most convenient tool for the study of manyaspects of nutritional problems. The principles of this techniqueand some general results will be considered in the next paragraphs.
Nutrients as limiting factors.--The bacteria most commonlystudied are chemoorganotrophs3 requiring an organic compoundas carbon and energy source, a hydrogen acceptor, inorganic ions,and carbon dioxide. Most of the parasitic (and many saprophytic)bacteria are chemoorganoheterotrophs requiring, in addition to theabove diet, certain specific organic molecules (growth factors).
Any one of the essential nutritional requirements of an organ-ism is, by definition, a potential limiting factor. With organismsable to grow on simple defined media (whether they are organooautotrophs or organoheterotrophs), the composition of a mediumis easily adjusted so th&t the concentrations of all essential nutri-ents are in large excess compared to one of them, which then be-comes the sole limiting factor, provided its concentration is kept
The Cold Spring Harbor Nomenclature (16) is adopted here.
www.annualreviews.org/aronlineAnnual Reviews
Ann
u. R
ev. M
icro
biol
. 194
9.3:
371-
394.
Dow
nloa
ded
from
arj
ourn
als.
annu
alre
view
s.or
gby
Cal
ifor
nia
Inst
itute
of
Tec
hnol
ogy
on 0
9/17
/07.
For
per
sona
l use
onl
y.
380 MONOD
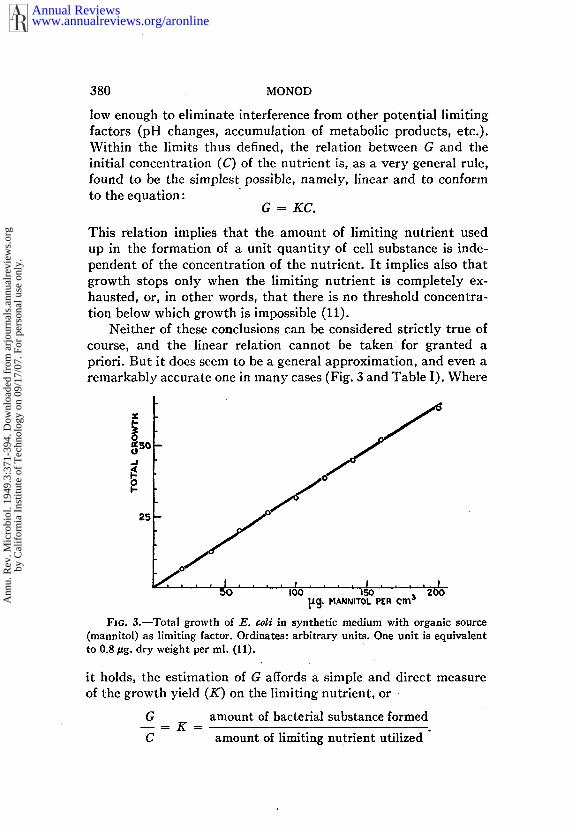
low enough to eliminate interference from other potential limitingfactors (pH changes, accumulation of metabolic products, etc.).Within the limits thus defined, the relation between G and theinitial concentration (C) of the nutrient is, as a very general rule,found to be the simplest possible, namely, linear and to conformto the equation:
G = KC.
This relation implies that the amount of limiting nutrient usedup in the formation of a unit quantity of cell substance is inde-pendent of the concentration of the nutrient. It implies also thatgrowth stops only when the limiting nutrient is completely ex-hausted, or, in other words, that there is no threshold concentra-tion below which growth is impossible (11).
Neither of these conclusions can be considered strictly true ofcourse, and the linear relation cannot be taken for granted apriori. But it does seem to be a general approximation, and even aremarkably accurate one in many cases (Fig. 3 and Table I). Where
L| ~ , , , | , , I
50 I00 15o 200[/~. I~IANNffOL PER cm$
FIG. 3.--Total growth of E. ¢oli in synthetic medium with organic source(mannltol) as limiting factor. Ordinates: arbitrary units. One unit is equivalentto 0.8/~g. dry weight per ml. (11).
it holds, the estimation of G affords a simple and direct measureof the growth yield (K) on the limiting nutrient,
G amount of bacterial substance formed
C amount of limiting nutrient utilized "
www.annualreviews.org/aronlineAnnual Reviews
Ann
u. R
ev. M
icro
biol
. 194
9.3:
371-
394.
Dow
nloa
ded
from
arj
ourn
als.
annu
alre
view
s.or
gby
Cal
ifor
nia
Inst
itute
of
Tec
hnol
ogy
on 0
9/17
/07.
For
per
sona
l use
onl
y.
GROWTH OF BACTERIAL CULTURES 381
When the proportion of the dry weight representing substancederived from the limiting nutrient is known, it is a measure ofthe fraction assimilated. If G is expressed as "standard" cellconcentration, IlK represents the amount of limiting nutrientused up in the formation of a "standard" cell. Thus, when de-termined under proper conditions, G is a constant of perfectly clearand fundamental significance; it is a measure of the efficiency ofassimilatory processes.
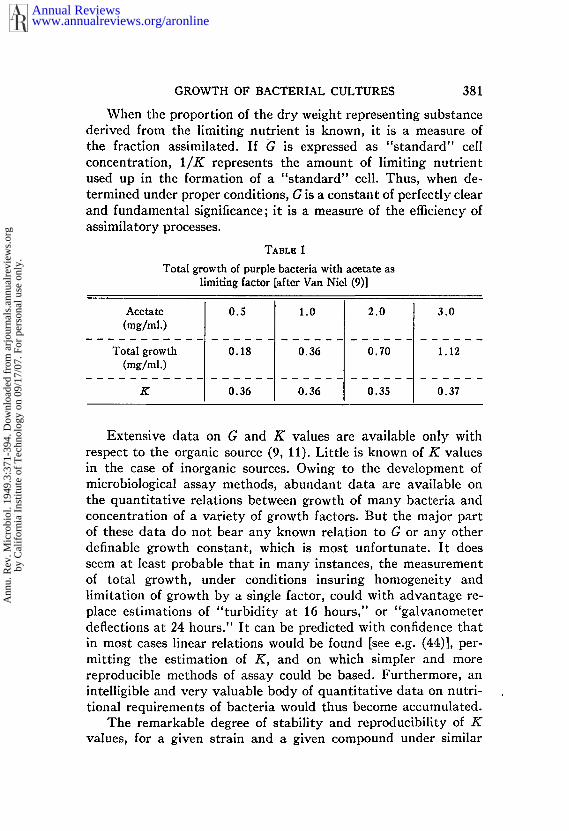
TABLE I
Total growth of purple baeterla with acetate as
limiting factor [after Van Niel (9)]
Acetate(mg/ml.)
0.5 1.0
Total growth 0.18 0.36(mg/ml.)
K 0.36 0.36
2.0 3.0
0.70 1.12
0.35 0.37
Extensive data on G and K values are available only withrespect to the organic source (9, 11). Little is known of K valuesin the case of inorganic sources. Owing to the development ofmicrobiological assay methods, abundant data are available onthe quantitative relations between growth of many bacteria andconcentration of a variety of growth factors. But the major partof these data do not bear any known relation to G or any otherdefinable growth constant, which is most unfortunate. It doesseem at least probable that in many instances, the measurementof total growth, under conditions insuring homogeneity andlimitation of growth by a single factor, could with advantage re-place estimations of "turbidity at 16 hours," or "galvanometerdeflections at 24 hours." It can be predicted with confidence thatin most cases linear relations would be found [see e.g. (44)], per-mitting the estimation of K, and on which simpler and morereproducible methods of assay could be based. Furthermore, anintelligible and very valuable body of quantitative data on nutri-tional requirements of bacteria would thus become accumulated.
The remarkable degree of stability and reproducibility of _Kvalues, for a given strain and a given compound under similar
www.annualreviews.org/aronlineAnnual Reviews
Ann
u. R
ev. M
icro
biol
. 194
9.3:
371-
394.
Dow
nloa
ded
from
arj
ourn
als.
annu
alre
view
s.or
gby
Cal
ifor
nia
Inst
itute
of
Tec
hnol
ogy
on 0
9/17
/07.
For
per
sona
l use
onl
y.
.382 MONOD
conditions, should be emphasized.. Contrary to the other growthconstants, it seems to be very little affected by hereditary vari-ability (45).
In general, of the three main growth constants, total growth isthe easiest to measure with accuracy and the most stable. Itsinterpretation is simple and straightforward, provided certainexperimental requirements are met. These are remarkable proper-ties, which could, it seems, be put to much wider use than hashitherto been done, especially with the focussing of attention onproblems of assimilatory and synthetic metabolism.
EXPONENTIAL GROWTI~ RATE
The exponential phase as a steady state: rate determining steps.-The rate of growth of a bacterial culture represents the over-allvelocity of the series of reactions by virtue of which cell substanceis synthesized. Most, if not all, of these reactions are enzymatic,the majority probably are reversible, at least potentially. The rateof each, considered alone, depends on the concentrations of thereactants (metabolites) and on the amount of the catalyst(enzyme).
During the exponential phase, the .growth rate is constant. Itis reasonable to consider that a steady state is established, wherethe relative concentrations of all the metabolites and all theenzymes are constant. It is in fact the only phase of the growthcycle when the properties of the cells may be considered constantand can be described by a numeric value, the exponential growthrate, corresponding to the over-all velocity of the steady statesystem.
It has often been assumed that the over-all rate of a system oflinked reactions may be governed by the slowest, or master,reaction. That this conception should be used, if at all, withextreme caution, has also been emphasized (17, 18). On theoreticalgrounds, it can be shown that the over-all rate of a system ofseveral consecutive reversible enzymatic reactions depends on therate and equilibrium constant of each. The reasons for this areobvious, and we need not go into the mathematics of the problem.A master reaction could take control only if its rate were verymuch slower than that of all the other reactions. Where hundreds,perhaps thousands, of reactions linked in a network rather thanas a chain are concerned, as in the growth of bacterial cells, such a
www.annualreviews.org/aronlineAnnual Reviews
Ann
u. R
ev. M
icro
biol
. 194
9.3:
371-
394.
Dow
nloa
ded
from
arj
ourn
als.
annu
alre
view
s.or
gby
Cal
ifor
nia
Inst
itute
of
Tec
hnol
ogy
on 0
9/17
/07.
For
per
sona
l use
onl
y.
GROWTH OF BACTERIAL CULTURES 383
situation is very improbable and, in general, the maximum growthrate should be expected to be controlled by a large number ofdifferent rate-determining steps. This makes it clear why ex-ponential growth rate measurements constitute a general andsensitive physiologic test which can be used for the study of a widevariety of effects, while, on the other hand, quantitative inter-pretations are subject to severe limitations. Even where the condi-tion or agent studied may reasonably be assumed to act primarilyon a single rate determining step, the over-all effect (i.e., the growthrate) will generally remain an unknown function of the primaryeffect.
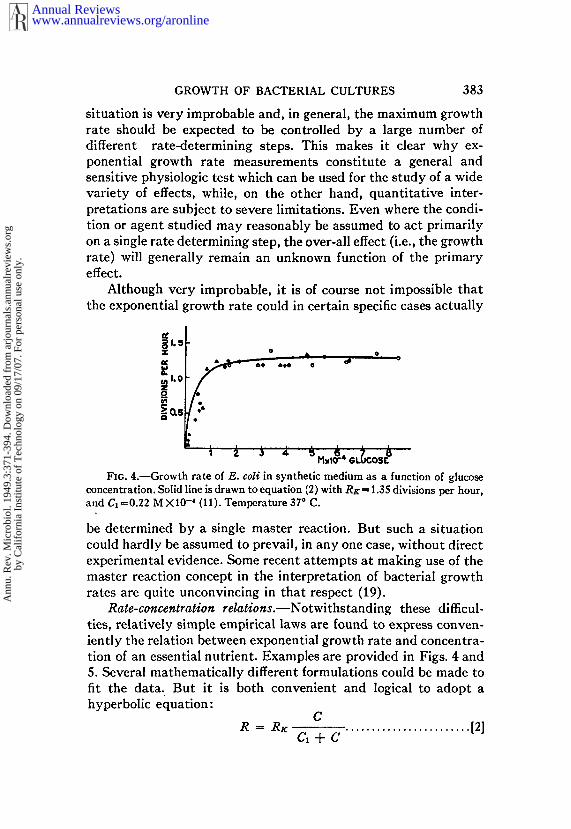
Although very improbable, it is of course not impossible thatthe exponential growth rate could in certain specific cases actually
~1o53:
~1.0
Fx6. 4.~Growth rate of E. col¢ in synthetic medium as a function of glucoseconcentration. Solid line is drawn to equation (2) with RK = 1.35 divisions per hour,and Ct =0.22 M X10-4 (11). Temperature ° C.
be determined by a single master reaction. But such a situationcould hardly be assumed to prevail, in any one case, without directexperimental evidence. Some recent attempts at making use of themaster reaction concept in the interpretation of bacterial growthrates are quite unconvincing in that respect (19).
Rate-concentration relations.--Notwithstanding these difficul-ties, relatively simple empirical laws are found to express conven-iently the relation between exponential growth rate and concentra-tion of an essential nutrient. Examples are provided in Figs. 4 and5. Several mathematically different formulations could be made tofit the data. But it is both convenient and logical to adopt ahyperbolic equation:
CR = RK ........................ [21Ct+C
www.annualreviews.org/aronlineAnnual Reviews
Ann
u. R
ev. M
icro
biol
. 194
9.3:
371-
394.
Dow
nloa
ded
from
arj
ourn
als.
annu
alre
view
s.or
gby
Cal
ifor
nia
Inst
itute
of
Tec
hnol
ogy
on 0
9/17
/07.
For
per
sona
l use
onl
y.
384 MONOD
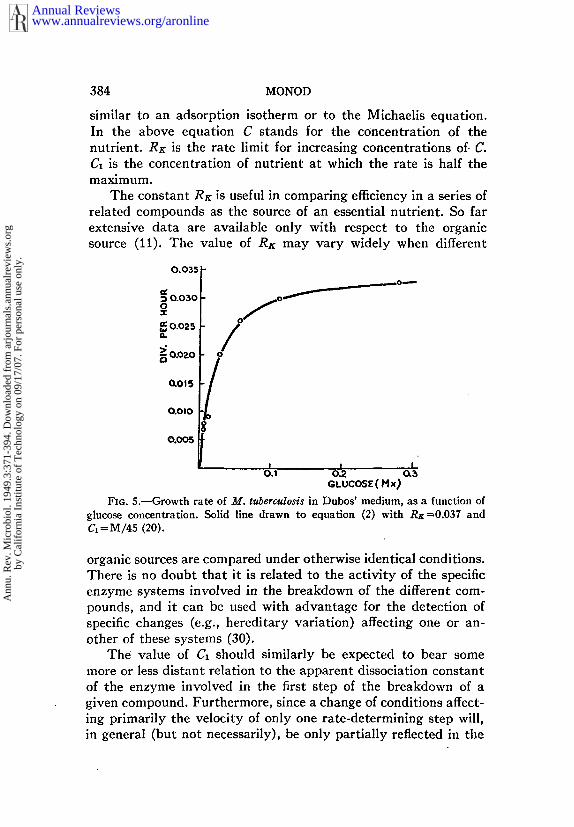
similar to an adsorption isotherm or to the Michaelis equation.In the above equation C stands for the concentration of thenutrient. RK is the rate limit for increasing concentrations of. C.Cz is the concentration of nutrient at which the rate is half themax~mumo
The constant RK is useful in comparing efficiency in a series ofrelated compounds as the source of an essential nutrient. So farextensive data are available only with respect to the organicsource (11). The value of R~ may vary widely when different
0.035
~o.o~o
~0.o2 s
-~ 0.o~o
o.o|o
! t IO.1 O~. O.~
GLUCOSE (Mx)
FI~. 5.~C-rowth rate of M. tuberculosis in Dubos’ medium, as a function ofglucose concentration. So|id llne drawn to eqt~ation (2) wil~ RK=0.037 and~--~/~5 (20~.
organic sources are compared under otherwise identical conditions.There is no doubt that it is related to the activity of the specificenzyme systems involved in the breakdown of the different com-pounds, and it can be used with advantage for the detection ofspecific changes (e.g., hereditary variation) affecting one or an-other of these systems (30).
The value of C~ should similarly be expected to bear somemore or less distant relation to the apparent dissociation constantof the enzyme involved in the first step of the breakdown of agiven compound. Furthermore, since a change of conditions affect-ing primarily the velocity of only one rate-determlning step will,in general (but not necessarily), be only partially reflected in the
www.annualreviews.org/aronlineAnnual Reviews
Ann
u. R
ev. M
icro
biol
. 194
9.3:
371-
394.
Dow
nloa
ded
from
arj
ourn
als.
annu
alre
view
s.or
gby
Cal
ifor
nia
Inst
itute
of
Tec
hnol
ogy
on 0
9/17
/07.
For
per
sona
l use
onl
y.
GROWTH OF BACTERIAL CULTURES 385
over-all rate, one might expect C1 values to be lower than thecorresponding values of the Michaelis constant of the enzymecatalysing the reaction. This may explain why C1 is often so small,compared to the concentrations required for visible growth, thatits value may be difficult to determine, and the exponentialgrowth rate appears practically independent of C (19).
It may be of interest to note that in a few instances exception-ally large values of C~ have been obtained. For instance forMycobacterium tuberculosis, on Dubos’ medium, the value of C~ forglucose is M/45, i.e., some 1,000 times its value for Escherichiacoll. Whether this is due to a very low affinity of an enzyme orwhether it reflects a peculiar permeability property of the mem-brane of this organism is not known (20).
Growth rate determinations as a null point method.--Althoughthe growth rate is an unknown function of a large number of vari-ables, quantitative comparisons of the effects of conditions oragents affecting it through the same rate-determining reaction(or system of reactions) are possible (at least in principle) by usinggrowth rate measurements as a null point method, that is to sayby determining the equivalent conditions at which a certain,conveniently chosen, value of R obtains. This general method issusceptible of many applications, especially in the study of antago-nistic effects. Here reliable and sensitive methods for distinguishingbetween various types of antagonistic effects, and determining therelative activities of different antagonists, are needed. Theoreticallythe most sensitive comparisons should be afforded by determining,at various absolute concentrations, the ratios of inhibitor andantagonist at which a given per cent decrease of R (over uninhibitedcontrols) occurs.
Although this may not always prove practicable, there is littledoubt that growth rate measurements do yield data, not only moreaccurate, but essentially more informative, than "turbidity at 16hours" or "galvanometer deflections at 72 hours." The studies ofMcIllwain on the pantoyl taurine-pantothenate antagonism (8)adequately illustrate this point. They clearly show, in particular,the importance of distinguishing between effects on growth rateand on total growth [see also (21 to 24)].
Linear growth.--Since we are discussing the interpretation ofexponential growth rates, it may be worthwhile to consider thecase when growth is linear with time, although, to the reviewer’s
www.annualreviews.org/aronlineAnnual Reviews
Ann
u. R
ev. M
icro
biol
. 194
9.3:
371-
394.
Dow
nloa
ded
from
arj
ourn
als.
annu
alre
view
s.or
gby
Cal
ifor
nia
Inst
itute
of
Tec
hnol
ogy
on 0
9/17
/07.
For
per
sona
l use
onl
y.

386 MONOD
knowledge, this has been clearly observed only once (25), actuallyduring the residual growth of a streptomycin-requiring B. subtilisin a medium containing no streptomycin (Fig. 6). The interpreta-tion is obvious, albeit surprising. Growth must be limited by oneenzyme or system of enzymes, the activity of which is constant. Inother words, in the absence of streptomycin, one rate-determiningenzyme ceases to be formed, so that by being outgrown by the
! , f I ~I00
~.OOMINUTF...S ~
FIG. 6.--Residual growth of a streptomycin requiring strain of Bacillus subtilis inthe absence of streptomycin. Growth ia linear for over 4 hr. (25).
other enzymes, it eventually achieves true mastery and sets thesystem at its own constant pace, disregarding the most funda-mental law of growth.
Similar systems could be artificially set up by establishing aconstant, limited supply of an essential metabolite (using anorganism incapable of synthesizing it), while all other nutrientswould be in excess. Such a technique should prove useful for certainstudies of metabolism (see p. 378).
LAG TIME
Types of lag.--The lag and acceleration phases correspond tothe gradual building up of a steady state. The growth lag (L)may be considered a measure of the physiological distance betweenthe initial and the steady state. Depending on the specific condi-tions and properties of the organism, one or several or a largenumber of reactions may determine the rate of this building up
www.annualreviews.org/aronlineAnnual Reviews
Ann
u. R
ev. M
icro
biol
. 194
9.3:
371-
394.
Dow
nloa
ded
from
arj
ourn
als.
annu
alre
view
s.or
gby
Cal
ifor
nia
Inst
itute
of
Tec
hnol
ogy
on 0
9/17
/07.
For
per
sona
l use
onl
y.
GROWTH OF BACTERIAL CULTURES 387
process. Furthermore each rate-determining reaction may beaffected in either or both of two ways: (a) change in the amountand activity of the catalyst; (b) change in the concentration of thereactants (metabolites).
When the phenomenon is associated with the previous ageing
¯ of the cells of the inoculum, the chances are that it involves atonce a large number of reactions, and specific interpretations areimpossible. Furthermore an apparent lag may be caused if a largefraction of the incoulated cells are not viable (18). When, however,the lag can be shown to be controlled primarily by only one re-action," or system of reactions, the measurement of lag timesbecomes a useful tool for the study of this reaction. This may oftenbe achieved by a careful preconditioning of the inoculated cells,and appropriate choice of media [see e.g. (26)]. In point of factthis technique amounts to artificially creating conditions whereone or a few rate limiting steps become true master reactions, atleast during the early stages of the lag.
Theoretically, the lagging of a reaction may be due either toinsufficient supply of a metabolite or to the state of inactivity ofthe enzyme. In the first case, the technique may be used for thestudy of certain essential metabolites synthesized by the cell itselfduring growth, and consequently difficult to detect and identifyotherwise. Few examples of this sort are available besides theglutamine effects studied by McIlwain et al. (27) and the detectionof metabolites able to replace carbon dioxide (26), but it is probablethat the method could be developed.
In the second case, the technique may be useful in the studyof enzyme activation or formation. The magnesium effects de-scribed by Lodge & Hinshelwood (28) and the sulfhydryl effectsdescribed by Morel (29) should probably be attributed to thereactivation of certain enzymes or group of enzymes. However,lag effects are especially interesting in connection with the studyof enzymatic adaptation.
Lag and enzymatic adaptation.--Enzymatic adaptation isdefined as the formation of a specific enzyme under the influenceof its substrate (30). If cells are transferred into a medium con-taining, as sole source of an essential nutrient, a compound whichwas not present in the previous medium, growth will be impossibleunless and until an enzyme system capable of handling the newsubstrate is developed. If other potential factors of lag are elimi-
www.annualreviews.org/aronlineAnnual Reviews
Ann
u. R
ev. M
icro
biol
. 194
9.3:
371-
394.
Dow
nloa
ded
from
arj
ourn
als.
annu
alre
view
s.or
gby
Cal
ifor
nia
Inst
itute
of
Tec
hnol
ogy
on 0
9/17
/07.
For
per
sona
l use
onl
y.

388 MONOD
nated, the determination of lag times becomes a means of studyingthe adaptive properties of the enzyme system involved (Fig. 7).
The technique has proved especially useful for the study ofadaptive enzymes attacking organic compounds serving as soleorganic source (11, 31). The work of Pollock (32) shows that can also be applied in the case of adaptive systems specific forcertain hydrogen acceptors (nitrate and tetrathionate). A furtherdevelopment of the technique is suggested by the work of Stanier
HOURS
FIG. 7.--Growth of E. toll in synthetic medium with glucose (circles) andxylose (squares) as organic source. Culture previously maintained on arabinosemedium, temperature 37° C. Growth on glucose proceeds without any lag. Lagtime (T;) on xylose is approximatlvely 2.5 hours (46).
(33) and Cohen (34) on the possibility of identifying metabolicpathways through a systematic study of cross adaptation.
In general, lag-time measurements may be especially useful inthe detection and preliminary identification of adaptive effects,but they could not, of course, replace more direct methods ofestimating enzymatic activities.
A broader approach to the problem of relations between lagand enzymatic adaptation should also be considered. As empha-sized by Hinshelwood (18), the lag and acceleration phases repre-sent essentially a process of equilibration, the functioning of aregulatory mechanism, by virtue of which a certain enzymebalance inside the cells is attained. That such a mechanism mustexist is obvious, since in its absence, the cells could not surviveeven slight variations of the external environment. However, thenature of the postulated mechanisms is still completely obscure.The kinetic speculations of HinsheIwood, aIthough interesting asempirical formulations of the problem, do not throw any light on,
www.annualreviews.org/aronlineAnnual Reviews
Ann
u. R
ev. M
icro
biol
. 194
9.3:
371-
394.
Dow
nloa
ded
from
arj
ourn
als.
annu
alre
view
s.or
gby
Cal
ifor
nia
Inst
itute
of
Tec
hnol
ogy
on 0
9/17
/07.
For
per
sona
l use
onl
y.
GROWTH OF BACTERIAL CULTURES 389
the nature of the basic mechanisms involved in the regulation ofenzyme formation by the cells.
The most promising hypothesis for the time being appears tobe that this regulation is insured through the same mechanismas the formation of adaptive enzymes, which implies the assump-tion that all the enzymes in a cell are more or less adaptive. Thecompetitive effects observed in enzymatic adaptation (11, 35, 36)agree with the view that the regulation may be the result of acontinuous process of selection of mutually interacting enzymesor enzyme-forming systems (30, 37). The kinetics of bacterialgrowth and, in particular, the lag and acceleration phases certainlyconstitute the best available material for the study of this funda-mental problem.
Division lag.--The largest discrepancies between increase inbacterial density and increase in cell concentration are generallyobserved during the lag and acceleration phases. This phenomenonhas been the subject of much confused discussion (38). Actually,it has been demonstrated by Hershey (39, 40) that a definite lagin cell concentration may occur even when there is no detectablelag in bacterial density. This must mean that cell division mecha-nisms may be partially inhibited under conditions which do notaffect the growth rate and general metabolism of the cell. A num-ber of interesting observations by Hinshelwood et al. (18) pointto the same conclusion. Further studies on the phenomenon aredesirable, as they should throw some light on the factors of celldivision in bacteria.
TEE INTERPRETATION OF COMPLEX GROWTH CYCLES
Multiple exponential phases.--In many cases, the growthcycle does not conform to the conventional scheme representedin Fig. 1. The interpretation of these complex growth cycles willbe briefly discussed here.
One of the most frequently encountered exceptions is the pres-ence of several successive exponential phases, characterized bydifferent values of R and separated by angular transition points.This should in general be interpreted as indicating the additionor rGmoval of one or more rate-determining steps in the steadystate system. This type of effect may result from a change in thecomposition of the medium, for instance from the exhaustion of acompound partially covering an essential nutritional requirement
www.annualreviews.org/aronlineAnnual Reviews
Ann
u. R
ev. M
icro
biol
. 194
9.3:
371-
394.
Dow
nloa
ded
from
arj
ourn
als.
annu
alre
view
s.or
gby
Cal
ifor
nia
Inst
itute
of
Tec
hnol
ogy
on 0
9/17
/07.
For
per
sona
l use
onl
y.

390 MONOD
(34), or from the transitory accumulation of a metabolite, whichwill eventually serve as a secondary nutritional source (41).
Interpretations are more delicate, and more interesting, whenthe cause is a change in the composition of the cells themselves.Such effects are frequently encountered with various bacteriostaticagents and have been discussed at length by Hinshelwood (18).But the deliberate confusion entertained by this author betweenselective and adaptive mechanisms has obscured, rather thanclarified, the interpretation of these effects.
/
~4 °~05 0
FIG. 8.---Growth of/~. coli in synthetic medium under suboptimal partial pressureof carbon dioxide (3 XI0-~). r =growth rate.
In some cases, the phenomenon can be reasonably ascribed tothe exhaustion of a reserve metabolite in the cells. An interestingexample is afforded by the growth of coli under suboptimal partialpressures of carbon dioxide (26). As seen in Fig. 8 as much three or four exponential phases can be clearly distinguished sug-gesting the successive exhaustion of several reserve metabolites,each independently synthesized with the participation of carbondioxide, a conclusion which is borne out by other lines of evidence.
Diauxie.--This phenomenon is characterized by a doublegrowth cycle consisting of two exponential phases separated by aphase during which the growth rate passes through a minimum,
www.annualreviews.org/aronlineAnnual Reviews
Ann
u. R
ev. M
icro
biol
. 194
9.3:
371-
394.
Dow
nloa
ded
from
arj
ourn
als.
annu
alre
view
s.or
gby
Cal
ifor
nia
Inst
itute
of
Tec
hnol
ogy
on 0
9/17
/07.
For
per
sona
l use
onl
y.
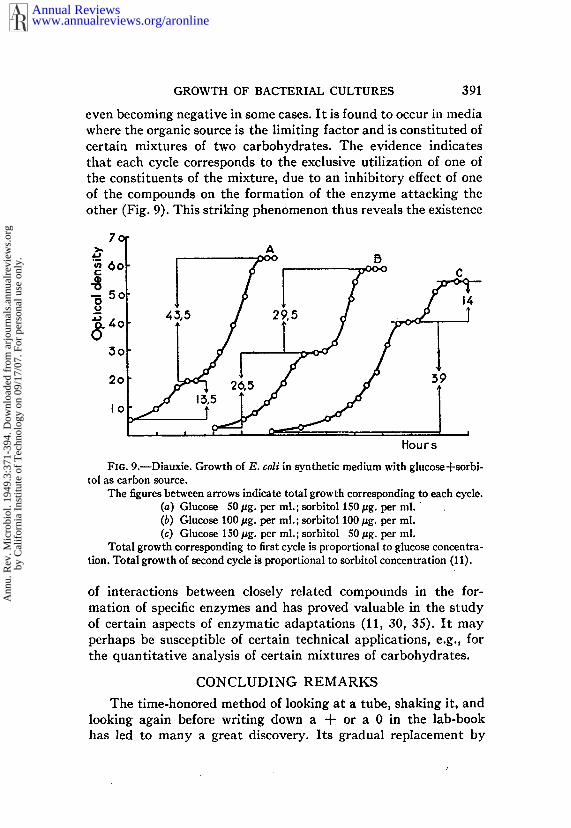
GROWTH OF BACTERIAL CULTURES 391
even becoming negative in some cases. It is found to occur in mediawhere the organic source is the limiting factor and is constituted ofcertain mixtures of two carbohydrates. The evidence indicatesthat each cycle corresponds to the exclusive utilization of one ofthe constituents of the mixture, due to an inhibitory effect of oneof the compounds on the formation of the enzyme attacking theother (Fig. 9). This striking phenomenon thus reveals the existence
7o
~6o
~.,~o0
~o
2o
Io
A
Hours
FI6. 9.--Diauxie. Growth of E. coli in synthetic medium with glucose+sorbi-tol as carbon source.
The figures between arrows indicate total growth corresponding to each cycle.(a) Glucose 50/zg. per ml.; sorbitol 150 #g. per ml. (b) Glucose 100/~g. per ml.; sorbitol 100/~g. per ml.(c) Glucose 150 #g. per ml.; sorbitol 50 #g. per ml.
Total growth corresponding to first cycle is proportional to glucose concentra-tion. Total growth of second cycle is proportional to sorbitol concentration (1 I).
of interactions between closely related compounds in the for-mation of specific enzymes and has proved valuable in the studyof certain aspects of enzymatic adaptations (11, 30, 35). It mayperhaps be susceptible of certain technical applications, e.g., forthe quantitative analysis of certain mixtures of carbohydrates.
CONCLUDING REMARKS
The time-honored method of looking at a tube, shaking it, andlooking again before writing down a + or a 0 in the lab-bookhas led to many a great discovery. Its gradual replacement by
www.annualreviews.org/aronlineAnnual Reviews
Ann
u. R
ev. M
icro
biol
. 194
9.3:
371-
394.
Dow
nloa
ded
from
arj
ourn
als.
annu
alre
view
s.or
gby
Cal
ifor
nia
Inst
itute
of
Tec
hnol
ogy
on 0
9/17
/07.
For
per
sona
l use
onl
y.
392 MONOD
determinations of "turbidity at 16 hours" testifies to technicalprogress, primarily in the manufacturing and advertising ofphotelectric instruments. This technique however is not, properlyspeaking, quantitative, since the quantity" measured is not defined.It might be a rate, or a yield, or a combination of both.
In any case, this technique does not take advantage of thefact that the growth of bacterial cultures, despite the immensecomplexity of the phenomena to which it testifies, generally obeysrelatively simple laws, which make it possible to define certainquantitative characteristics of the growth cycle, essentially thethree growth constants: total growth (G), exponential growthrate (R), and growth lag (L). That these definitions are not purelyarbitrary and do correspond to physiologically distinct elements ofthe growth cycle is shown by the fact that, under appropriatelychosen conditions, the value of any one of the three constants maychange widely without the other two being significantly altered.The accuracy, the ease, the reproducibility of bacterial growthconstant determinations is remarkable and probably unparallelled,so far as biological quantitativecharacteristics are concerned.
The general physiological significance of each of the growthconstants is clear, provided certain experimental requirementsare met. Under certain specific conditions, quantitative inter-pretations in terms of the primary effect of the agent studied mayeven be possible. The fallacy of considering certain naive mecha-nistic schemes, however, as appropriate interpretations of unknown,complex phenomena should be avoided.
There is little doubt that, as further advances are made towardsa more integrated picture of cell physiology, the determinationof growth constants should and will have a much greater place inthe experimental arsenal of microbiology.
www.annualreviews.org/aronlineAnnual Reviews
Ann
u. R
ev. M
icro
biol
. 194
9.3:
371-
394.
Dow
nloa
ded
from
arj
ourn
als.
annu
alre
view
s.or
gby
Cal
ifor
nia
Inst
itute
of
Tec
hnol
ogy
on 0
9/17
/07.
For
per
sona
l use
onl
y.
GROWTH OF BACTERIAL CULTURES 393
LITERATURE CITED
1. DELBR~CK, M., Ann. Missouri Botan. Garden, 32, 223-33 (1945)2. LURIA, S. E., Bact. Revs., 11, 1-40 (1947)3. HENRICI, A. T., Morphologi¢ Variation and the Rate of Growth "of Bacteria, 194
pp. (C. C Thomas, Springfield, Ill., 1928)4. WILSON, G. S., .d. Bact., 7, 405 (1922)5. I~LLy, C. D., AND RAHN, O., ar. Bact., 23, 147 (1932)6. LODGE, R. M., AND HINSHELWOOn, C. N., J. Chem. Sot., 213-219 (1943)7. FISHER, K. C., AND ARMSTRONG, F. H., ar. Gen. Physiol., 30, 263 (1947)8. MCILWAIN, H., Biochem. f., 38, 97-105 (1944)9. VAN NIEL, C. B., Bact. Revs., 8~ 1-118 (1944)
10. DOGNOI~, A., in Techni,~ues de laboratoire, 197-210 (Masson & Cie, Paris,1947)
11. MONOD, J., Recherches sur la croissanee des cultures bact~riennes, 211 pp. (Her-mann & Cie, Paris, 1942)
12. DtlBOS, R. J., ar. Exptl. Med., 65, 873-83 (1937)13. MONOD, J., Ann. inst. Pasteur, 68, 444 (1942)14. MoNoi), J., Ann. inst. Pasteur (In press)15. JORI)AI~, R. C., Am) JACOBS, S. E., d. Bact., 48, 579 (1944)16. LwovI~, A., VAN NIEL, C. B., RYAN, F. J., AN~) TATI~M, E. L., Cold Spring
Harbor Symposia Quant. Biol., 11, 302-3 (1946)17. Bt/RTOI~I, A. C., J. Cellular Comp. Physiol., 9~ 1 (1936)18. HINSHELWOOn, C. N., The Chemical Kinetics of the Bacterial Cell, 284 pp.
(Clarendor/Press, Oxford, 1946)19. JOHNSON, F. H., A~r~ LEWIN, I., dr. Cellular Comp. Physiol., 28, 47 (1946)20. SC~Am*ER, W., Ann. inst. Pasteur, 74, 458-63 (1948)21. MCILWAIN, H., Biol. Keys., 19, 135 (1944)22. McILwAII% H., Advances in Enzymol., 7~ 409-60 (1947)23. WYss, 0., Proc. Soc. Exptl. Biol. Med., 48, 122 (1941)24. KOHN, H. I., AND HARRIS, J. S., J. Pharmacol. Exptl. Therap., 73, 343 (1941)25. SCHAE~’VER, P., Compt. rend., 228, 277-79 (1949)26. LwoF~, A., AND MONOn, J., Ann. inst. Pasteur, 73, 323 (1947)27. MCILWAm, H., FrLDES, P., GL~t~SxOI~m, G. P., Am) K~IG~T, B. C. J. G., Bio-
chem. at., 33, 223 (1939)28. LODGE, R. M., AND HINSHELWOOD, C. N., ar. Chem. Soc., 1692-97 (1939)29. MOREL~ M., Ann. inst. Pasteur, 67, 449 (1941)30. MONOD, J., Growth, 11,223-89 (1947)31. MoNon, J., Ann. inst. Pasteur, 69, 179 (1943)32. POLLOCK, M. R., AND WAINWRIGHT, S. D., Brit. J. Exptl. Path., 29, 223-40
(1948)33. STANIER, R. Y., ar. Bact., ~4, 339 (1947)34. COHEN, S.’ S., ar. Biol. Chem., 177, 607-19 (1949)35. MoNon, J., Ann. inst. Pasteur, 71, 37 (1945)36. SPIEGELMAN, S., Am) DUNN, R., Y. Gen. Physiol., 31, 153-73 (1947)37. SPIE6ELM.~.~, S., Cold Spring Harbor Symposia Quant. Biol., 11, 256-77 (1946)38. WINSLOW, C. E., AND WALK~R, H. H., Bact. Revs., 3, 147-86 (1939)39. HERSHI~Y, A. D., ar. Bact., 37~ 290 (1939)
www.annualreviews.org/aronlineAnnual Reviews
Ann
u. R
ev. M
icro
biol
. 194
9.3:
371-
394.
Dow
nloa
ded
from
arj
ourn
als.
annu
alre
view
s.or
gby
Cal
ifor
nia
Inst
itute
of
Tec
hnol
ogy
on 0
9/17
/07.
For
per
sona
l use
onl
y.
394 MONOD
40. HERSHEY, A. D., Proc. Soc. Exptl. Biol. Med., 38, 127-28 (1938)41. LWOF~’, A., Cold Spring Harbor Symposia Quant. Biol., 11~ 139-55 (1946)42. LEMON, C. G., or. Hyg., 33, 495 (1937)43. TO~’LEY, W. W. C., AND WX~.SON, G. S., Principles of Bacteriology and Immu-
nity, 3rd Ed., 2054 pp. (Williams & Wilkins, 1946)44. LWoF~’, A., QUERmO, A., ~,N~ LATASTE, C., Compt. rend. soc. biol., 130~ 1580
(1939)45. MONOD~ J. (Unpublished data)46. MoNo~, J. (Unpublished data)
www.annualreviews.org/aronlineAnnual Reviews
Ann
u. R
ev. M
icro
biol
. 194
9.3:
371-
394.
Dow
nloa
ded
from
arj
ourn
als.
annu
alre
view
s.or
gby
Cal
ifor
nia
Inst
itute
of
Tec
hnol
ogy
on 0
9/17
/07.
For
per
sona
l use
onl
y.
Ann
u. R
ev. M
icro
biol
. 194
9.3:
371-
394.
Dow
nloa
ded
from
arj
ourn
als.
annu
alre
view
s.or
gby
Cal
ifor
nia
Inst
itute
of
Tec
hnol
ogy
on 0
9/17
/07.
For
per
sona
l use
onl
y.


![Hernan G. Garcia , Rob Phillips arXiv:0708.1899v1 [q-bio.QM] 14 … · 2018. 10. 24. · Hernan G. Garcia1, Jan e Kondev2, Nigel Orme3, Julie A. Theriot4, Rob Phillips5 1Department](https://img.pdfslide.us/doc/110x75/60c5b4375c157f7ee318d851/hernan-g-garcia-rob-phillips-arxiv07081899v1-q-bioqm-14-2018-10-24.jpg)