Embed Size (px)
Citation preview
Electron Transfer Process and Membrane Bioenergetics
APh/BE161: Physical Biology of the CellWinter 2009
Electron TransferRob Phillips
Announcements: nature of estimates, office hour changes, HW2.First part: electron transfer – phenomenology, simplest modelSecond part: membrane bioenergetics
Plan of Lecture
Schematic of the Electron Transfer Process
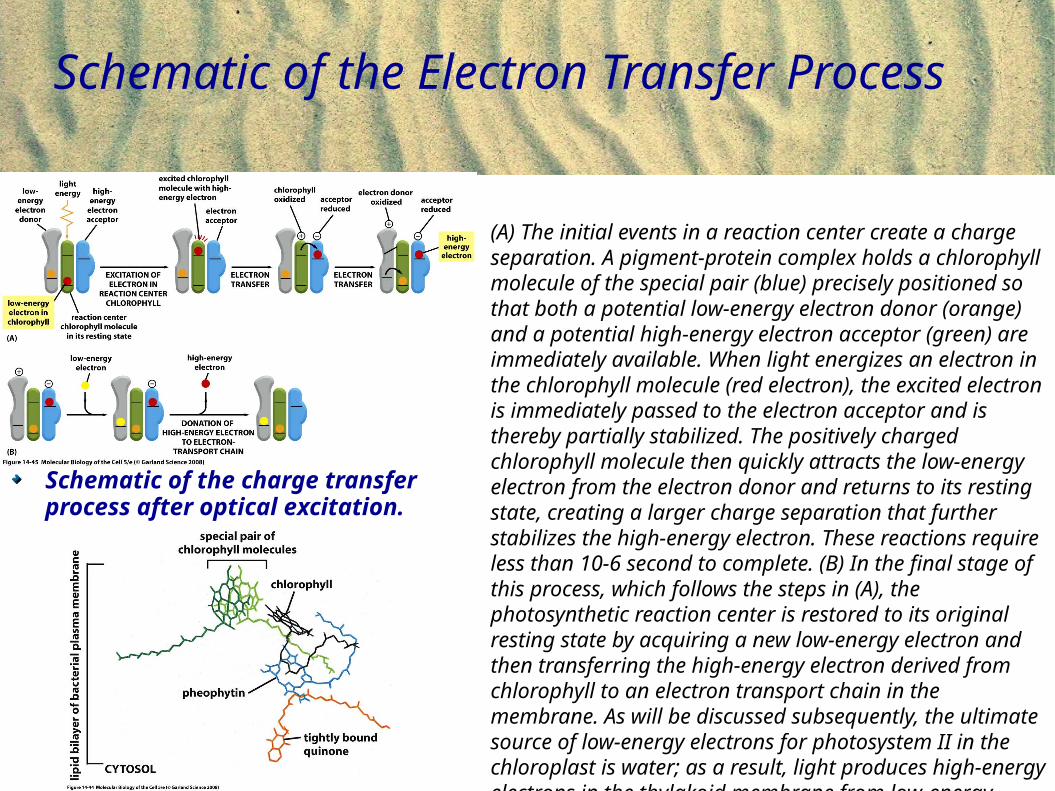
(A) The initial events in a reaction center create a charge separation. A pigment-protein complex holds a chlorophyll molecule of the special pair (blue) precisely positioned so that both a potential low-energy electron donor (orange) and a potential high-energy electron acceptor (green) are immediately available. When light energizes an electron in the chlorophyll molecule (red electron), the excited electron is immediately passed to the electron acceptor and is thereby partially stabilized. The positively charged chlorophyll molecule then quickly attracts the low-energy electron from the electron donor and returns to its resting state, creating a larger charge separation that further stabilizes the high-energy electron. These reactions require less than 10-6 second to complete. (B) In the final stage of this process, which follows the steps in (A), the photosynthetic reaction center is restored to its original resting state by acquiring a new low-energy electron and then transferring the high-energy electron derived from chlorophyll to an electron transport chain in the membrane. As will be discussed subsequently, the ultimate source of low-energy electrons for photosystem II in the chloroplast is water; as a result, light produces high-energy electrons in the thylakoid membrane from low-energy electrons in water.
Schematic of the charge transfer process after optical excitation.
Abstracting the Electron Transfer Process
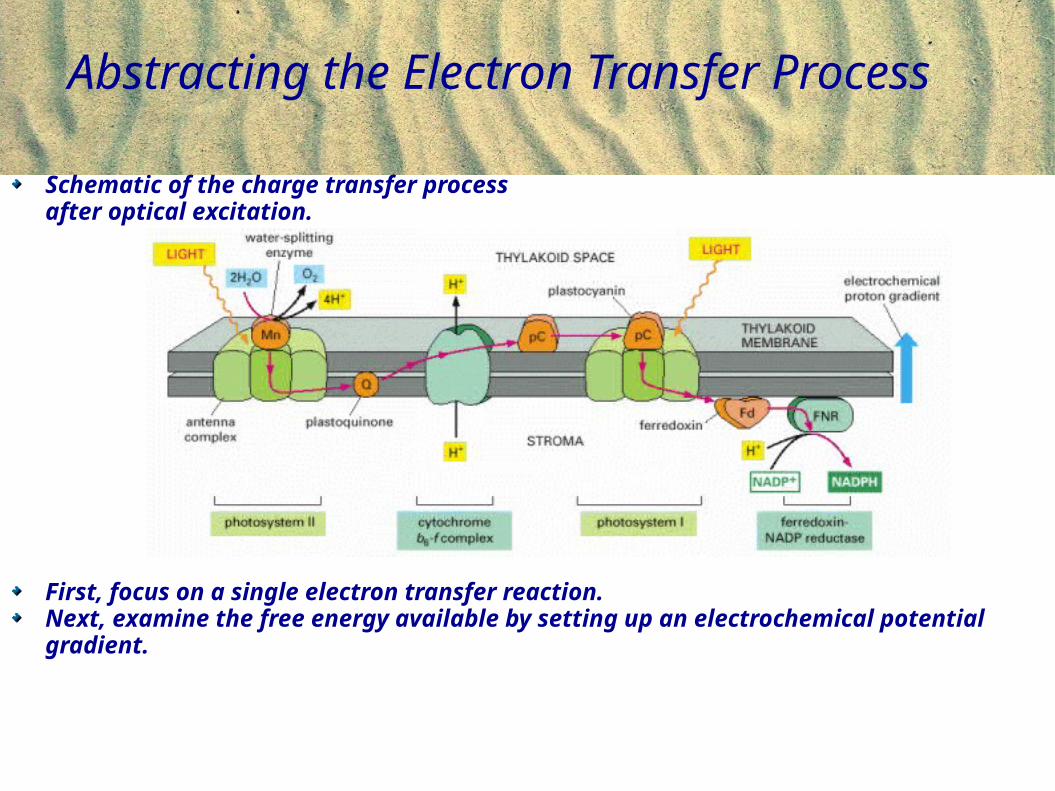
Schematic of the charge transfer process after optical excitation.
First, focus on a single electron transfer reaction. Next, examine the free energy available by setting up an electrochemical potential gradient.
The Machines of the Membrane
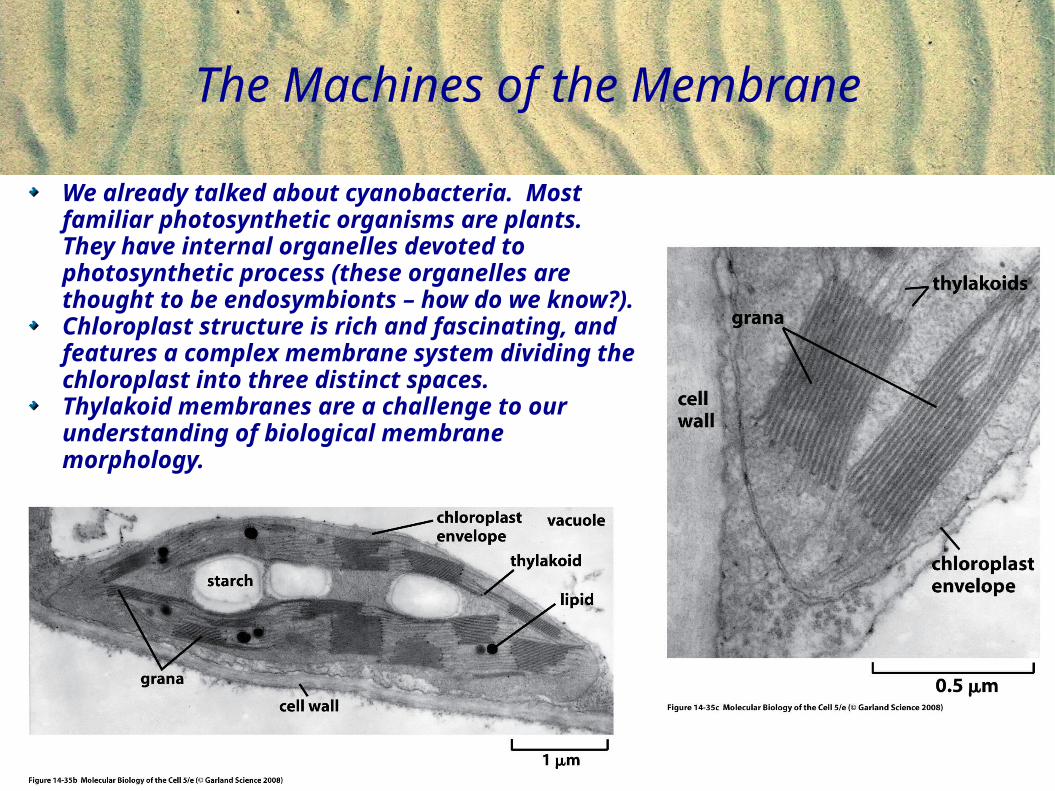
We already talked about cyanobacteria. Most familiar photosynthetic organisms are plants. They have internal organelles devoted to photosynthetic process (these organelles are thought to be endosymbionts – how do we know?).Chloroplast structure is rich and fascinating, and features a complex membrane system dividing the chloroplast into three distinct spaces.Thylakoid membranes are a challenge to our understanding of biological membrane morphology.
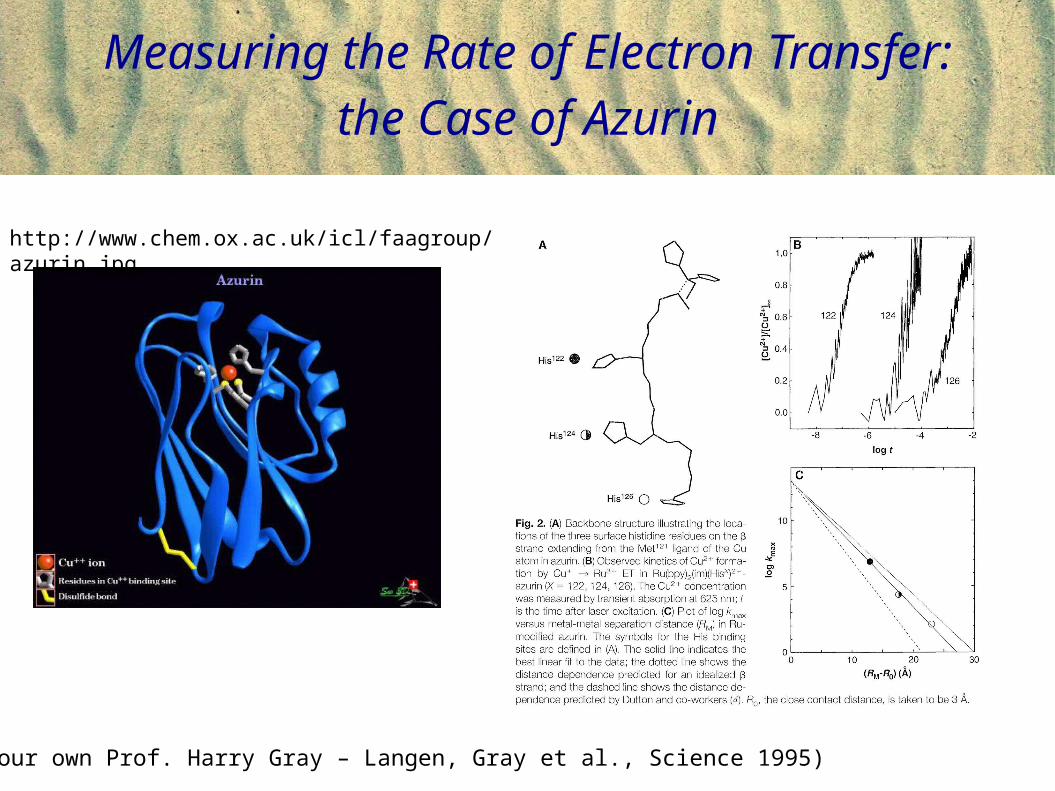
Measuring the Rate of Electron Transfer: the Case of Azurin
(From our own Prof. Harry Gray – Langen, Gray et al., Science 1995)
http://www.chem.ox.ac.uk/icl/faagroup/azurin.jpg
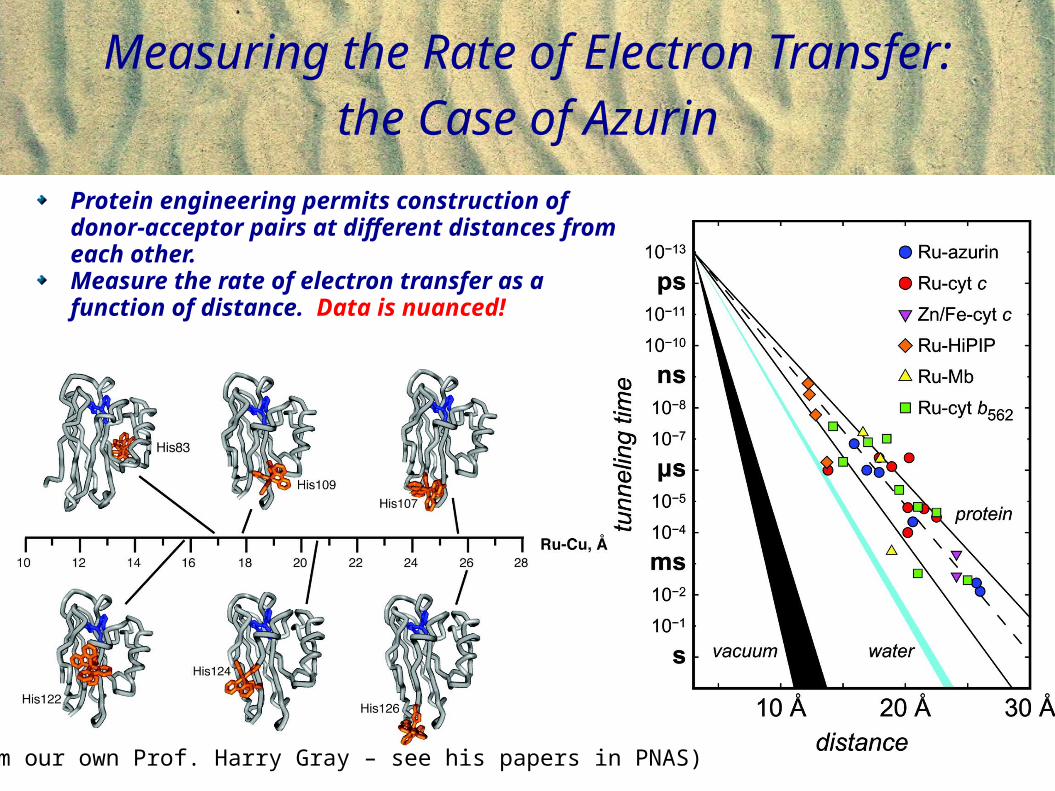
Measuring the Rate of Electron Transfer: the Case of Azurin
(From our own Prof. Harry Gray – see his papers in PNAS)
Protein engineering permits construction of donor-acceptor pairs at different distances from each other.Measure the rate of electron transfer as a function of distance. Data is nuanced!
The energetics of the light-induced reactions have been worked out.
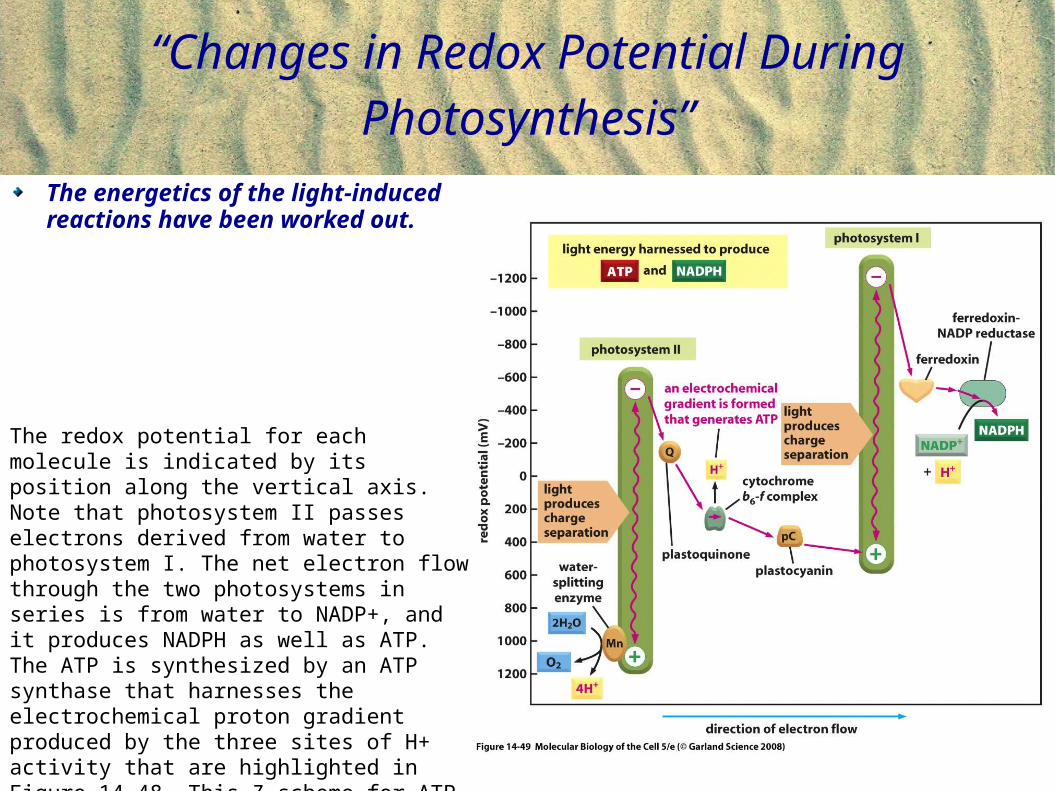
“Changes in Redox Potential During Photosynthesis”
The redox potential for each molecule is indicated by its position along the vertical axis. Note that photosystem II passes electrons derived from water to photosystem I. The net electron flow through the two photosystems in series is from water to NADP+, and it produces NADPH as well as ATP. The ATP is synthesized by an ATP synthase that harnesses the electrochemical proton gradient produced by the three sites of H+ activity that are highlighted in Figure 14-48. This Z scheme for ATP production is called noncyclic photophosphorylation, to distinguish it from a cyclic scheme that utilizes only photosystem I (see the text).
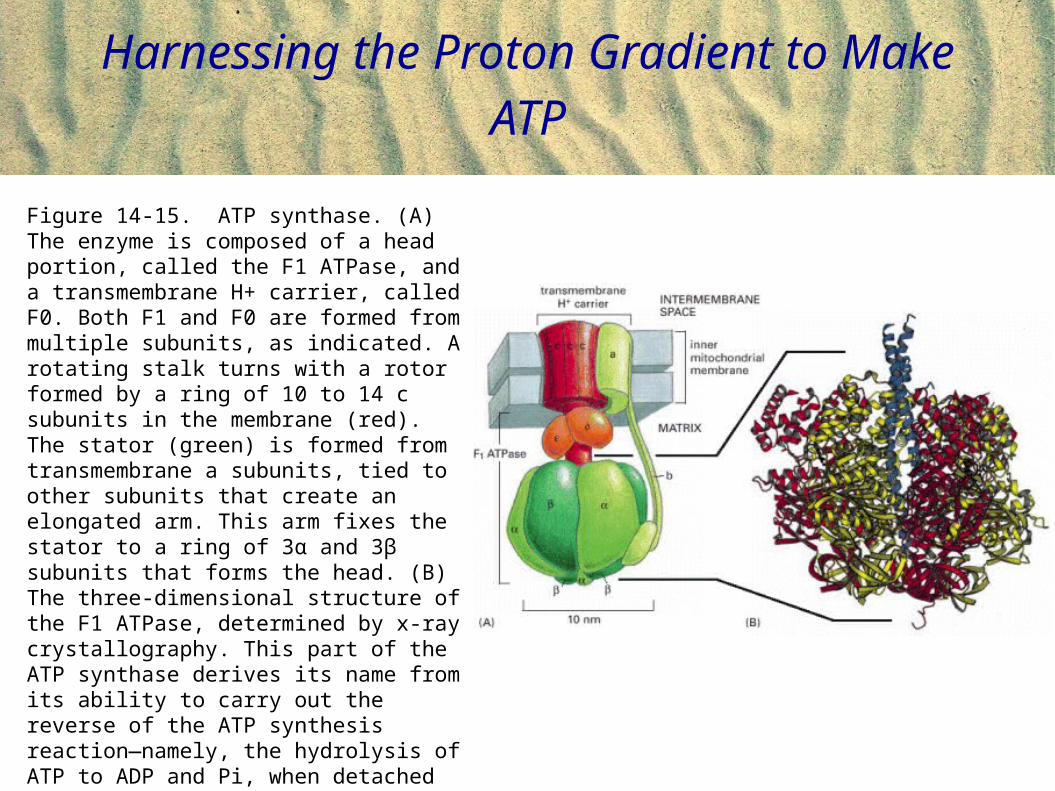
Harnessing the Proton Gradient to Make ATP
Figure 14-15. ATP synthase. (A) The enzyme is composed of a head portion, called the F1 ATPase, and a transmembrane H+ carrier, called F0. Both F1 and F0 are formed from multiple subunits, as indicated. A rotating stalk turns with a rotor formed by a ring of 10 to 14 c subunits in the membrane (red). The stator (green) is formed from transmembrane a subunits, tied to other subunits that create an elongated arm. This arm fixes the stator to a ring of 3α and 3β subunits that forms the head. (B) The three-dimensional structure of the F1 ATPase, determined by x-ray crystallography. This part of the ATP synthase derives its name from its ability to carry out the reverse of the ATP synthesis reaction—namely, the hydrolysis of ATP to ADP and Pi, when detached from the transmembrane portion. (B, courtesy of John Walker, from J.P. Abrahams et al., Nature 370:621–628, 1994. © Macmillan Magazines Ltd.)
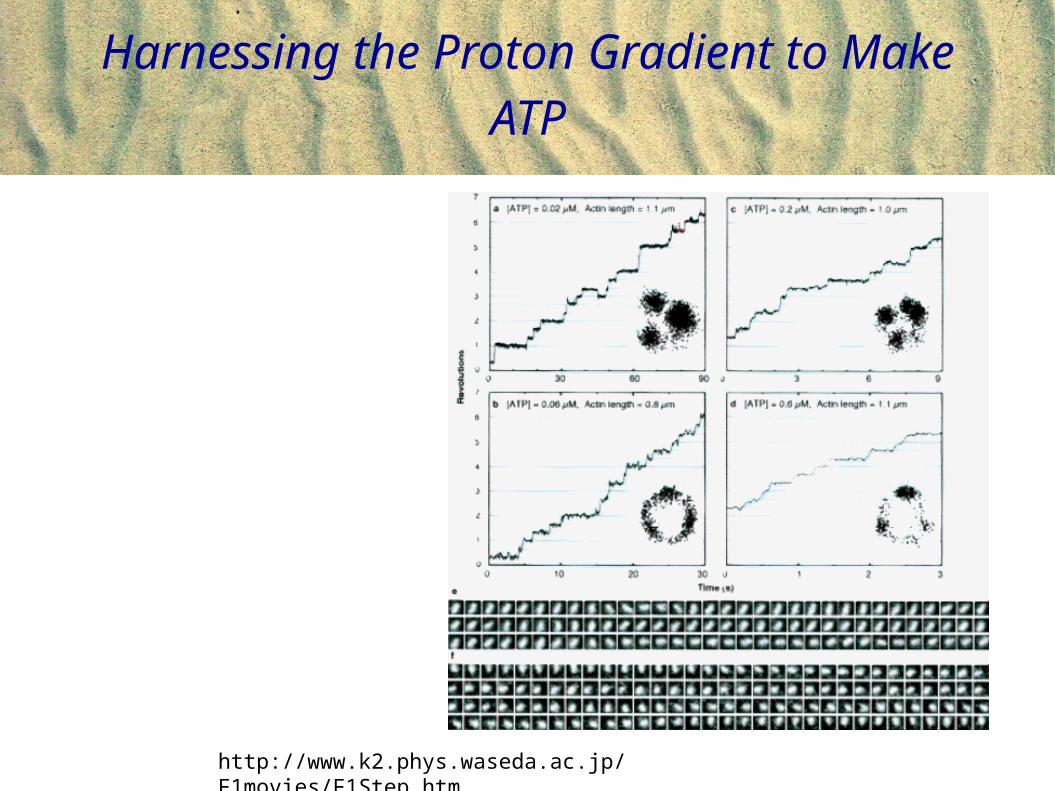
Harnessing the Proton Gradient to Make ATP
http://www.k2.phys.waseda.ac.jp/F1movies/F1Step.htm