Embed Size (px)
Citation preview
THE GLOBAL STATUS OF CCS | 2013

THE GLOBAL STATUS OF CCS | 2013B
© Global CCS Institute, 2013
Unless stated otherwise, copyright to this product is owned by the Global Carbon Capture and Storage Institute Ltd (Global CCS Institute) or used under licence.
Apart from any fair dealings for the purpose of study, research, reporting, criticism or review as permitted under the Copyright Act 1968 (Cth), no part may be reproduced by any process without the written permission of the Global CCS Institute.
For enquiries please contact:
BY TELEPHONE: +61 (0)3 8620 7300
BY EMAIL: [email protected]
BY MAIL: Global CCS Institute, PO Box 23335
Docklands VIC 8012 Australia
The Global CCS Institute has tried to make information in this
product as accurate as possible. However, it does not guarantee
that the information is totally accurate or complete. Therefore, the
information in this product should not be relied upon solely when
making commercial decisions. The Global CCS Institute has no
responsibility for the persistence or accuracy of URLs for external or
third-party internet websites referred to in this publication and does
not guarantee that any content on such websites is, or will remain,
accurate or appropriate.
Please use the following reference to the whole report: Global CCS Institute 2013, The Global Status of CCS: 2013, Melbourne, Australia.
The information in this report is current as at August 2013.
ISSN 1838-9473ISBN 978-0-9871863-2-4
Cover image courtesy of Aquistore.

THE GLOBAL STATUS OF CCS | 2013
CONTENTS
Tables .................................................................................................................4Figures ...............................................................................................................5Boxes .................................................................................................................7Executive summary .............................................................................................8
1 INTRODUCTION 16
Key fi ndings ............................................................................................. 171.1 The critical role of CCS in managing the risks of climate change ................ 171.2 Scope of the report ................................................................................... 20
2 PROJECTS 22
Key fi ndings ............................................................................................. 232.1 Overview .................................................................................................. 232.2 Key project developments in 2013 ............................................................ 302.3 Geographical LSIP trends ......................................................................... 342.4 Detailed project breakdown ...................................................................... 432.5 CCS demonstration compared to deployment goals ................................... 522.6 The potential of Notable Projects .............................................................. 55
3 BUSINESS CASE 58
Key fi ndings ............................................................................................. 593.1 Overview .................................................................................................. 593.2 Product and revenue diversifi cation .......................................................... 603.3 Improved fi nancing prospects through strategic alliances .......................... 633.4 Role and extent of government support ..................................................... 663.5 Recommendations and outlook ................................................................. 69
4 POLICY, LEGAL AND REGULATORY DEVELOPMENTS 70
Key fi ndings ............................................................................................. 714.1 Overview .................................................................................................. 714.2 Developments in international policy agendas ........................................... 724.3 CCS Policy Index ...................................................................................... 734.4 Status of government funding programs .................................................... 754.5 Progressive approaches of CCS regulators ................................................. 774.6 Survey fi ndings on policy, legal and regulation .......................................... 824.7 Recommendations and outlook ................................................................. 91

5 CAPTURE 92
Key fi ndings ............................................................................................. 935.1 Overview .................................................................................................. 935.2 CCS is happening in industrial processes .................................................. 955.3 CCS in power generation is progressing but more work is needed .............. 985.4 Methods to reduce capture costs ............................................................ 1025.5 Recommendations and outlook ............................................................... 105
6 TRANSPORT 106
Key fi ndings ........................................................................................... 1076.1 Overview ................................................................................................ 1076.2 Expanding CO2 transportation networks ................................................... 1086.3 Pipeline design – the ROAD project ........................................................ 1116.4 Permitting CO2 transport infrastructure – standards and codes ................ 1146.5 Financial and commercial models for CO2 transportation networks .......... 1156.6 Recommendations and outlook ............................................................... 117
7 STORAGE 118
Key fi ndings ........................................................................................... 1197.1 Overview ................................................................................................ 1197.2 CO2–EOR dominates geologic storage ..................................................... 1207.3 Dedicated storage activities (or non-EOR storage activities) ..................... 1247.4 Storage activities in developing countries ................................................ 1277.5 The important role of storage pilots and demonstration projects ............... 1327.6 Case study – Project Pioneer .................................................................. 1347.7 Recommendations and outlook ............................................................... 135
8 PUBLIC ENGAGEMENT 136
Key fi ndings ........................................................................................... 1378.1 Overview ................................................................................................ 1378.2 A growing awareness of public engagement best practices ...................... 1388.3 Using communication and education to explain risk and build capacity ... 1448.4 Improving communication and collaboration ........................................... 1498.5 Recommendations and outlook ............................................................... 153
APPENDIXES 154
Appendix A Projects ...................................................................................... 154Appendix B Business case fundamentals for CCS projects ............................. 170Appendix C Policy ......................................................................................... 173Appendix D Capture ...................................................................................... 179Appendix E Existing CO2 transport infrastructure............................................ 184Appendix F Storage ...................................................................................... 188Appendix G References ................................................................................. 190Appendix H Abbreviations and acronyms ....................................................... 196
THE GLOBAL STATUS OF CCS | 20134
TABLESTable 2.1 Active LSIPs ..............................................................................................................28
Table 2.2 Portfolio distribution of LSIPs .....................................................................................53
Table 3.1 Examples of potential sources of debt fi nance identifi ed for DVPP ..............................65
Table 3.2 Regional, national, and subnational government support provided to CCS projects under construction ..............................................................................................................67
Table 3.3 Extract of TCEP government support timetable ...........................................................67
Table 4.1 International CCS developments ................................................................................72
Table 4.2 Most important policy enablers ..................................................................................85
Table 5.1 Power generation LSIPs by capture process and overall lifecycle stage .......................99
Table 5.2 Range of large pilot facilities for power generation ....................................................100
Table 6.1 Impurities in the CO2 stream in parts per million by volume (ppmv) ..........................112
Table A.1 Capture, transport, and storage project lifecycle stages ............................................157
Table A.2 Reconciliation of LSIPs with those presented in The Global Status of CCS: 2012 .......160
Table A.3 The Institute’s 2013 LSIP list ...................................................................................162
Table B.1 Comparison of risks for a new build CCS demonstration power project relative to a new build conventional power project ..............................................................................171
Table B.2 Comparison of production cost increases with the addition of CO2 capture ................172
Table C.1 CCSPI weightings ....................................................................................................173
Table C.2 Mapping of policy options to policy type ...................................................................175
Table E.1 Existing major US CO2 pipelines ...............................................................................184
Table E.2 LSIPs as part of existing EOR networks in the US .....................................................186
Table E.3 CO2 network initiatives related to CCS .......................................................................187
FIGURESFigure 1.1 The CCS process .......................................................................................................16
Figure 1.2 Economic growth and energy consumption ................................................................18
Figure 1.3 Energy–related CO2 emissions reductions by technology .............................................19
Figure 2.1 Project lifecycle model ...............................................................................................24
Figure 2.2 LSIPs by project lifecycle and year .............................................................................25
Figure 2.3 World map of LSIPs ...................................................................................................26
Figure 2.4 LSIPs by project lifecycle and region/country ..............................................................27

THE GLOBAL STATUS OF CCS | 2013 5
Figure 2.5 LSIPs proceeding to Operate and Execute since 2010, including in 2013 projects that are close to an FID ..........................................................................................................29
Figure 2.6 Changes in the LSIPs since 2011 ...............................................................................30
Figure 2.7 Changes within the lifecycle stages of the LSIPs since 2011 .......................................31
Figure 2.8 LSIPs removed from the 2013 project listing ..............................................................33
Figure 2.9 LSIPs by region and year ...........................................................................................35
Figure 2.10 Mass of CO2 potentially stored by region or country ....................................................35
Figure 2.11 Map of LSIPs in North America ..................................................................................37
Figure 2.12 Map of LSIPs in Europe .............................................................................................39
Figure 2.13 Map of LSIPs in China ...............................................................................................41
Figure 2.14 LSIPs by industry sector and year ..............................................................................44
Figure 2.15 Planned year for operation by industry (not including operating projects) ....................44
Figure 2.16 LSIPs by industry type and region ..............................................................................45
Figure 2.17 Mass of CO2 captured by industry sector and year ......................................................46
Figure 2.18 LSIPs by capture type and industry ............................................................................47
Figure 2.19 LSIPs by capture type and region ...............................................................................47
Figure 2.20 LSIPs by capture technology and project structure .....................................................48
Figure 2.21 Mass of CO2 potentially stored by primary storage type and region ..............................50
Figure 2.22 Comparison of capture and storage progress ..............................................................51
Figure 2.23 Mass of CO2 potentially stored by LSIPs .....................................................................52
Figure 2.24 Notable Projects by stage and region .........................................................................55
Figure 2.25 Spread of Notable Projects by the focus of the project, stage and size ........................56
Figure 3.1 Commodity price differentials (2011–12) ...................................................................62
Figure 3.2 Contracting strategies by region and number of projects .............................................63
Figure 4.1 Composite CCS Policy Index ......................................................................................74
Figure 4.2 Public funding support for LSIPs under construction or in planning ............................67
Figure 4.3 Have there been material changes to the CCS policy environment over the past 12 months? ...............................................................................................................82
Figure 4.4 How valuable is the prevailing suite of policy settings in supporting your CCS project business case? ..........................................................................................................83
Figure 4.5 How dependent is your project’s future viability on new government settings? .............84
Figure 4.6 Do you agree that incentives are adequate to avoid commercially stranding your project over the next 12 months? ...........................................................................................85
Figure 4.7 Do you agree that the importance of CCS to mitigate emissions will increase this decade? ....................................................................................................................86
Figure 4.8 Do you agree that policy uncertainty is a major risk to your project? ............................86

THE GLOBAL STATUS OF CCS | 20136
Figure 4.9 Do you agree that the greatest funding challenge is securing capital expenditure? (refers to the 2013 results) To what extent do you agree that the funding challenge of CAPEX is much less than OPEX? (refers to the 2012 results) .....................................................87
Figure 4.10 Whether a project can proceed to FID within the current regulatory requirements .......87
Figure 4.11 Changes to the regulatory environment since 2012 ....................................................88
Figure 4.12 Project appraisals of the domestic regulatory environment ..........................................90
Figure 5.1 CO2 capture overview .................................................................................................92
Figure 5.2 Breakdown of LSIPs by sector ....................................................................................94
Figure 5.3 Boryeong Power Station ...........................................................................................101
Figure 5.4 Cost reduction of selective catalytic reduction to remove NOX from fl ue gases ...........103
Figure 6.1 Transport overview ...................................................................................................106
Figure 6.2 Pipeline transportation distances provided by LSIPs .................................................108
Figure 6.3 Onshore CO2 transportation – pipeline construction ..................................................109
Figure 6.4 Offshore CO2 transportation – shipping .....................................................................110
Figure 6.5 Proposed location of capture unit: Maasvlakte Power Plant 3 ...................................111
Figure 6.6 Pipeline terrain for LSIPs .........................................................................................114
Figure 6.7 Sharing capacity–independent costs between infrastructure users ............................117
Figure 7.1 Storage overview ......................................................................................................118
Figure 7.2 LSIP storage types according to region and country ..................................................120
Figure 7.3 The CO2 enhanced oil recovery process ...................................................................121
Figure 7.4 Relative increase in recycled CO2 being used compared to newly purchased CO2 during the course of a CO2–EOR operation ..........................................................................122
Figure 7.5 Potential mass of CO2 stored by LSIPs according to storage type and project lifecycle stage ..........................................................................................................123
Figure 7.6 Mass of CO2 that could be stored by LSIPs ...............................................................125
Figure 7.7 Aquistore well drill rig, Saskatchewan, Canada .........................................................127
Figure 7.8 Map of CCOP countries ...........................................................................................128
Figure 7.9 Professor John Kaldi, CO2CRC, leads a discussion during the CCOP workshop on geological storage in Bali, Indonesia .........................................................................129
Figure 7.10 Diagram of CO2 storage and example of a core .........................................................132
Figure 8.1 Status of public engagement strategy development ..................................................138
Figure 8.2 Type of community in which CCS projects are taking place by geographic region (respondents could select more than one type of community) ..................................140
Figure 8.3 A framework of interactions for CCS projects ............................................................143
Figure 8.4 A 3D geological model of the Weyburn oil fi eld created from characterisation data and showing barriers to vertical movement on the left, aquifers on the right, and wellbores stretching into the formation ....................................................................................146
Figure 8.5 Train-the-trainer course in Malaysia .........................................................................148

THE GLOBAL STATUS OF CCS | 2013 7
Figure 8.6 A meeting of the Australian Stakeholder and Strategy Network .................................150
Figure A.1 Project Lifecycle Model ............................................................................................155
Figure B.1 Costs of CO2 avoided ...............................................................................................172
Figure C.1 Preference for specifi c policy options over time ........................................................174
Figure C.2 Current UNFCCC architecture ..................................................................................178
Figure D.1 Post-combustion capture .........................................................................................180
Figure D.2 Pre-combustion capture ..........................................................................................182
Figure D.3 Oxyfuel capture .......................................................................................................183
BOXESBox 2.1 Short description of the CCS project lifecycle model ...................................................24
Box 2.2 CCS in developing countries – Projects ......................................................................54
Box 2.3 CCS in developing countries – Notable Projects ..........................................................56
Box 3.1 An example of poly-generation at the Texas Clean Energy Project ...............................61
Box 3.2 Challenging traditional industry patterns at the North West Sturgeon Refi nery CO2 Project ......................................................................................................................62
Box 3.3 TCEP adapts to a fi nancially constrained world ...........................................................64
Box 3.4 Strategic equity participation at the Don Valley Power Project .....................................65
Box 4.1 Developing framework legislation – the New Zealand approach ..................................79
Box 4.2 CCS in developing countries – Legal and regulatory frameworks .................................81
Box 5.1 Boryeong Power Station, Korea ................................................................................101
Box 6.1 Cost allocation approaches to multi-user CO2 transportation infrastructure ................116
Box 7.1 CCS in developing countries – Storage .....................................................................128
Box 8.1 Key public engagement principles in practice ..........................................................141
Box 8.2 Key themes and recommendations from a synthesis of CSIRO–led social research ...142
Box 8.3 Creating core messages ...........................................................................................146
Box 8.4 CCS in developing countries – Education .................................................................147
Box 8.5 Networks in action ...................................................................................................150
Box 8.6 Interview with the International ENGO Network on CCS ............................................152
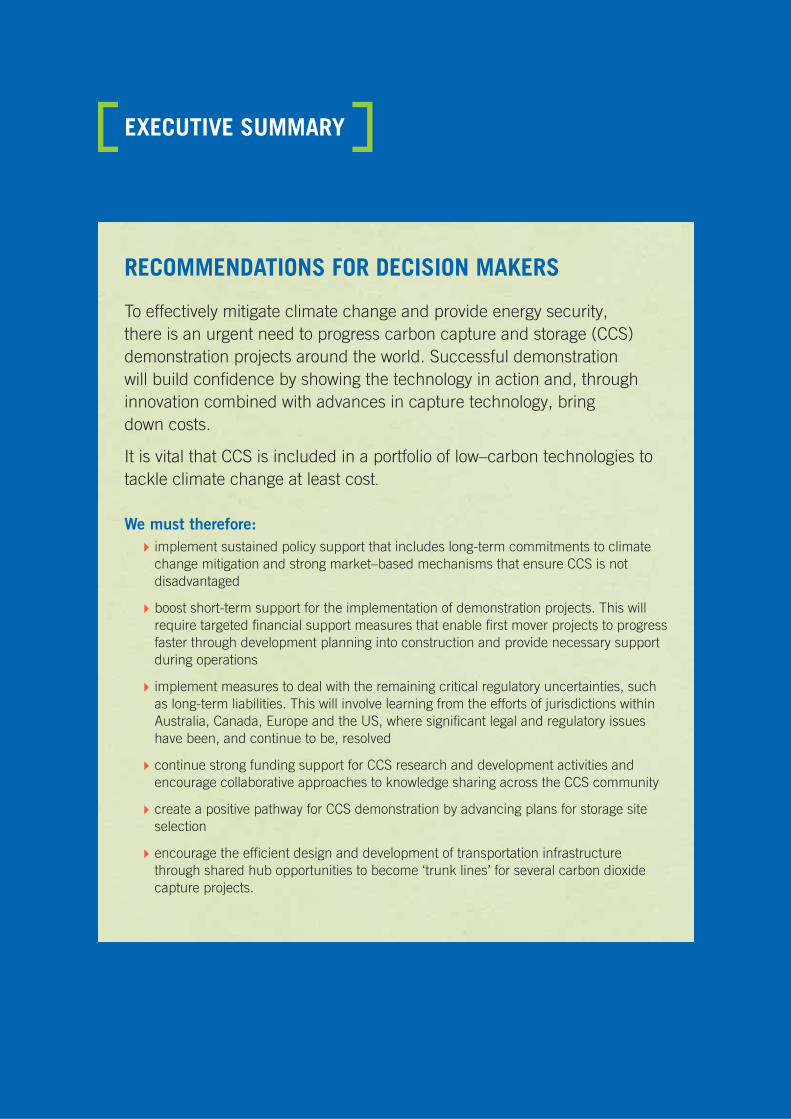
RECOMMENDATIONS FOR DECISION MAKERS
To effectively mitigate climate change and provide energy security, there is an urgent need to progress carbon capture and storage (CCS) demonstration projects around the world. Successful demonstration will build confi dence by showing the technology in action and, through innovation combined with advances in capture technology, bring down costs.
It is vital that CCS is included in a portfolio of low–carbon technologies to tackle climate change at least cost.
We must therefore: implement sustained policy support that includes long-term commitments to climate change mitigation and strong market–based mechanisms that ensure CCS is not disadvantaged
boost short-term support for the implementation of demonstration projects. This will require targeted fi nancial support measures that enable fi rst mover projects to progress faster through development planning into construction and provide necessary support during operations
implement measures to deal with the remaining critical regulatory uncertainties, such as long-term liabilities. This will involve learning from the efforts of jurisdictions within Australia, Canada, Europe and the US, where signifi cant legal and regulatory issues have been, and continue to be, resolved
continue strong funding support for CCS research and development activities and encourage collaborative approaches to knowledge sharing across the CCS community
create a positive pathway for CCS demonstration by advancing plans for storage site selection
encourage the effi cient design and development of transportation infrastructure through shared hub opportunities to become ‘trunk lines’ for several carbon dioxide capture projects.
EXECUTIVE SUMMARY

EX
EC
UT
IVE
SU
MM
AR
Y
THE GLOBAL STATUS OF CCS | 2013 9
OVERVIEW
Fossil fuels will remain a signifi cant part of the global energy mixThe world depends on energy, for which we rely predominantly on fossil fuels. Forecasts of global energy demand growth indicate this reliance will continue for many decades to come. The energy sector accounts for around two-thirds of greenhouse gas emissions. Increasing quantities of greenhouse gases in the atmosphere – carbon dioxide (CO2), in particular – are contributing to a signifi cant increase in the temperature of the Earth, which is causing climate change.
Taking a ‘business as usual’ approach, the scientifi c evidence suggests the world is heading toward an increase in average global temperature of between 3.6 and 5.3 degrees Celsius (°C) (compared with pre-industrial levels), with most of the increase happening this century (IEA 2013). The President of the World Bank Group has expressed concern about how this will affect our environment, prosperity and progress in sustainable development:
… a 4°C world is so different from the current one that it comes with high uncertainty and new risks that threaten our ability to anticipate and plan for future adaptation needs
World Bank Group President Jim Yong Kim
November 2012
More than 100 countries have endorsed a goal for deep cuts in global emissions to hold the increase in global temperature to below 2°C (UNFCCC, 2009). To achieve this goal and create a low–carbon future, we should be moving much more quickly to transform the way we generate and use energy. Energy–related CO2 emissions continue to rise and, in 2012, reached a record 31.6 gigatonnes (IEA 2013).
The urgency for action to reduce CO2 emissions continues to grow as each year passes.
A vital component of a portfolio of least cost, low–carbon technologiesAchieving decarbonisation, while delivering more energy and growth, is a challenge to be met by a number of clean energy solutions. Solutions include energy effi ciency and demand management measures, renewables and other low–carbon energy sources, and the use of fossil fuels and biomass with carbon capture and storage (CCS).
CCS has strong potential to be cost competitive in a low–carbon future.
The International Energy Agency (IEA) has estimated that the exclusion of CCS as a technology option in the electricity sector alone would increase mitigation costs by around US$2 trillion by 2050 (IEA 2012a). This is because many alternatives to CCS as a low–emissions technology in the electricity sector are more expensive. The addition of CCS facilities to existing or new build power plants will increase overall costs, quite often by a considerable margin. While it may be possible to reduce emissions in the electricity sector by the amount needed to limit the global temperature increase to below 2°C without using CCS, this would necessarily involve using more expensive technologies
Beyond the electricity sector, it is unlikely that energy–related and process CO2 emissions can be eliminated without CCS. This is because CCS is the only large–scale technology available to make deep emissions cuts in several industrial sectors (such as iron and steel and cement). Industrial sector emissions account for more than 20 per cent of current global CO2 emissions.
It follows that the widespread deployment of CCS in the power and industrial sectors in the coming decades is imperative to achieving a low–carbon energy future at least cost.
Much attention is focused on the environmental benefi ts of fuel switching from coal– to gas–fi red power generation. However, natural gas is not carbon free and, to meet longer term emissions reduction goals, both coal– and gas–fi red generating capacity will need to be fi tted with CCS.

EX
EC
UT
IVE
SU
MM
AR
Y
THE GLOBAL STATUS OF CCS | 201310
Meeting the energy needs of developing countriesDeveloping countries are consuming energy at increasing rates as their economies industrialise and standards of living continue to improve. These countries are often working to bring electricity to a large number of people who are without it today. Accordingly, there is a pressing need to quickly build large amounts of generating capacity.
The IEA has estimated that non-OECD (Organisation for Economic Cooperation and Development) countries will account for more than 90 per cent of the growth in primary energy demand to 2035 (IEA 2012b). Many of these countries will have access to relatively cheap sources of fossil fuels, so it is likely that CO2 emissions will increase dramatically without the application of CCS.
It is important therefore to work with developing countries as they further industrialise, by encouraging them to consider CCS technology as part of the low–carbon options portfolio and providing support for its implementation (including the necessary capacity development tools).
CCS technology is well understood, and a realityCCS is often mistakenly perceived as an unproven or experimental technology. In reality, the technology is generally well understood and has been used for decades at a large scale in certain applications. For example:
large–scale CO2 separation is undertaken as a matter of routine in gas processing and many industrial processes
CO2 pipelines are an established technology, on land and under the sea
large–scale injection and geological storage of CO2 has been safely performed in saline reservoirs for more than 15 years, and in oil and gas reservoirs for decades.
There are currently 12 operational large–scale CCS projects around the world, which have the capacity to prevent 25 million tonnes a year (Mtpa) of CO2 from reaching the atmosphere.
The key technical challenge for widespread CCS deployment is the integration of component technologies into successful large–scale demonstration projects in new applications such as power generation and additional industrial processes.
There is growing confi dence that the technical challenges of integrating CCS at large scale in these new applications will be overcome with time. This is based on the combination of experiences gained over many years from existing CCS facilities, ‘learning-by-doing’ benefi ts that will come from large–scale demonstration projects, and continued investment and collaboration in global research and development (R&D) activities.
Insuffi cient policy support is a key barrierWhile CCS projects are progressing, the pace is well below the level required for CCS to make a substantial contribution to climate change mitigation. The major impediment to CCS progress is not considered to be technical uncertainties but, rather, insuffi cient policy support exacerbated by poor public understanding of the technology.
There is an important co-dependency here. Without suffi cient policy incentives to attract private funding, it is diffi cult to create the economic or market conditions required for broadbased CCS demonstration (and deployment). Successful CCS demonstration projects in power and broader industrial applications are vital to establish a positive perception of CCS as a cost effective, environmentally friendly technology among investors and the general community.

EX
EC
UT
IVE
SU
MM
AR
Y
THE GLOBAL STATUS OF CCS | 2013 11
For CCS to achieve its full mitigation potential, a substantial increase in the number of large–scale projects is required. For this to happen, action needs to be taken on several fronts:
policy support must be strengthened to improve the business case for CCS projects
robust, globally coordinated research and development efforts must be maintained to reduce costs
early support for transportation and storage infrastructure is necessary to reduce the time to market for new projects.
In addition to these policy actions, greater efforts are needed to increase public understanding and acceptance of CCS technology and the importance of its development, demonstration and deployment. Informed discussions are required with a broad range of infl uential stakeholders on the value and need for CCS as a vital part of a low–carbon future (along with other technologies). The organisations comprising the International ENGO Network on CCS made an important contribution last year, with a report arguing for CCS to be included in a portfolio of technologies needed to meet climate targets. As the urgency to act increases, so too does the need to widen and strengthen this dialogue on the imperative role of CCS.
PROJECTS, POLICY AND MARKETSThe Institute has identifi ed 65 large–scale integrated projects (LSIP) in 2013 compared to the 75 reported in The Global Status of CCS: 2012. Importantly, there are now 12 projects in operation, an increase from eight in 2012. During the past year, three new projects were identifi ed, one in each of Brazil and Saudi Arabia – the fi rst for both of these countries – and one in China. Five projects were cancelled, one downscaled and seven put on hold for various reasons, including investment reprioritisation and insuffi cient fi nancing and legislative support.
Key observations include:
More projects are entering operation and construction and China’s importance is growing Twenty large–scale projects are in operation or construction, four more than in 2012 and eight
more than in 2010. Eight projects are in construction: a signifi cant milestone is that the fi rst two power projects – both in North America – are scheduled for operation in 2014. Nearly all the remaining projects in construction are expected to be operational by the end of 2015.
Four projects have commenced operation in 2013 – Air Products Steam Methane Reformer Enhanced Oil Recovery (EOR) Project, Coffeyville Gasifi cation Plant, Lost Cabin Gas Plant, all in the United States (US) and Petrobras Lula Oil Field CCS Project in Brazil.
The next tranche of dedicated geological storage projects under construction will signifi cantly increase saline formation storage (from 1.5 to 7 Mtpa) and provide additional demonstrations of large–scale injection and storage of CO2 in different geologic settings.
There are signals that the steady progress of large–scale CCS projects into construction will continue. Five projects may be in a position to make a fi nal investment decision in the coming year. Four of these projects are in the power sector (of which two, in Europe, use deep saline or depleted oil and gas fi eld storage) and one in iron and steel.
China now has 12 projects spread across all stages of development planning compared to fi ve in 2010, ranking second to the US (20 projects). China is well positioned to infl uence the future success of CCS. The inclusion of CCS in China’s 12th Five–Year Plan refl ects a strong commitment to develop and deploy the technology.

EX
EC
UT
IVE
SU
MM
AR
Y
THE GLOBAL STATUS OF CCS | 201312
Signifi cant gaps remain and progress on CCS must be acceleratedNotwithstanding the steady progress in CCS projects entering operation and construction, momentum is too slow to support the widespread commercial deployment needed to underpin climate change risk mitigation scenarios. A very substantial increase in new projects entering construction is required.
There is a notable absence of advanced projects in industrial applications, with only two iron and steel projects in development planning and none in cement. Considerable work is still needed to encourage capture demonstrations and CCS technology developments in these and other industries.
While signifi cant progress is being made to advance CO2 storage programs in many developing countries, overall levels of CCS activity are at early stages. To achieve global emission targets, 70 per cent of the cumulative mass of captured CO2 by 2050 will need to occur in non-OECD countries (IEA 2012a).
Outside China, there are few projects in the Identify stage, indicating that replenishment of the project pipeline has stalled. Furthermore, the progress of projects through development planning is slow. In the past two years, only two projects have moved from early scoping (the Identify stage) into the Evaluate stage, and only fi ve have moved into the most advanced planning stage (Defi ne).
Existing policy support alone is not enough; current market opportunities can provide added impetus for only a limited number of fi rst mover projects Of the projects in operation, under construction or that may make a fi nal investment decision within
the coming 12 months, around 70 per cent (17 of 25) are using or intend to use the captured CO2 for enhanced oil recovery (CO2–EOR).
This approach is most evident in North America, where such market opportunities to utilise CO2 as a commodity with value are strongest.
Outside these regions, CCS progress has been very limited. In Europe, for example, where there have been considerable policy initiatives, no new large–scale CCS project has entered operation since 2008.
Overall, public policy for CCS during the past fi ve years has not succeeded in generating the necessary breadth and depth to the CCS demonstration effort necessary to allow it to play its full part in mitigating the predicted rise in global temperature. This is evidenced by slow project progression, the absence of project replenishment outside China, and a development bias toward projects with access to additional revenue opportunities, such as EOR.
An urgent policy response is required to ensure the successful global large–scale demonstration of CCS in the next fi ve to 10 years.
Policy and regulatory framework enhancements are criticalThe international climate change policy dialogue consistently acknowledges the important future mitigation role of CCS. Solid progress continues within the United Nations Framework Convention on Climate Change (UNFCCC), and in agendas of the Clean Energy Ministerial (CEM), Carbon Sequestration Leadership Forum (CSLF), and International Organization for Standardization (ISO).
Paradoxically, progress in the international dialogue on CCS, and the criticality of CCS in climate change mitigation continually identifi ed in energy roadmaps, have not been translated into policy settings that have delivered a sustainable pipeline of CCS projects in individual countries.

EX
EC
UT
IVE
SU
MM
AR
Y
THE GLOBAL STATUS OF CCS | 2013 13
Policy and regulatory actions to accelerate the momentum of CCS projects must address the following issues:
Strong, sustainable emissions reduction policies to support longer term deploymentProject proponents strongly highlight that there is too much policy uncertainty to support a business case for large–scale CCS projects. CCS projects have large capital costs and long development times. Investors require long-term predictability if they are to invest in CCS.
Thoughtfully developed emission reduction policies that encourage CCS and other low–carbon technologies are urgently needed and necessary for longer term deployment. Continued uncertainty about the timing, nature, extent and durability of such policies is stalling the development of CCS.
Strengthened incentive mechanisms to support the immediate demonstration effortMost public funding programs for large–scale CCS projects have been exhausted or have not delivered funds commensurate with former commitments. Since 2009, funding support for CCS has fallen by more than US$7 billion from earlier commitments, refl ecting either changing government priorities or a reliance on carbon price support that has subsequently collapsed. Moreover, this fi gure excludes funding received by projects that were subsequently suspended or cancelled and is no longer available.
While some countries are considering approaches to reinvigorate funding programs, no fi rm initiatives have been announced. In the short-term, fi nancial support measures must be introduced to enable ‘robust’ projects to progress faster through the development pipeline and enter construction. This is especially the case in Europe, where no large–scale CCS demonstration projects have progressed into construction since the Snøhvit CO2 Injection project in the early 2000s. A broad, successful demonstration program is vital to improve community understanding of CCS as an environmentally friendly technology and reinforce the important role of CCS in reducing global CO2 emissions.
It is important that the value and benefi ts of CCS are continually asserted and that CCS is not disadvantaged in relation to other low–carbon technologies in policy considerations and government support. First mover projects incur higher risks and upfront costs than later projects; appropriate recognition of this should be taken into consideration in the framing of fi nancial and policy support for fi rst movers.
Direct fi nancial support through grants, preferential loans, investment tax credits, and public–private partnerships can help project development. Other incentive mechanisms such as feed-in tariffs, performance–based subsidies, contract for difference and purchase agreements can provide direct support for operations. The combination of support mechanisms used may vary globally, depending on jurisdictional factors.
Regulation uncertainties still need to be addressedA core group of jurisdictions – Australia, Canada, Europe and the US – are early movers that have progressed the development and implementation of law and regulation for CCS. These jurisdictions have remained at the forefront in recent years. There has also been welcome increased activity from second generation regulators in countries with high levels of CCS interest but less well developed policy frameworks (for example, Malaysia and South Africa).
Despite these developments, however, several legal and regulatory issues persist. Almost all jurisdictions must address issues arising from post-closure stewardship (transfer of responsibilities, liabilities) in a way that accommodates the risk profi les of governments and fi rst mover project developers. This must begin immediately to remove a key impediment to the progression of CCS.

EX
EC
UT
IVE
SU
MM
AR
Y
THE GLOBAL STATUS OF CCS | 201314
TECHNOLOGY DEVELOPMENTSuccessful CCS demonstrations in the power sector and additional industrial applications are essential to gain valuable design, construction and operational experience. The knowledge or ‘learning’ from demonstrating CCS technology in new applications at different sites and different settings is critical for reducing costs and strengthening investor and stakeholder confi dence.
Current CCS demonstration projects are vital for these ‘learning curve’ achievements.
Just like any other industry, a vibrant R&D effort is important for CCS. R&D efforts across CCS (and especially capture) technologies, higher effi ciency power generation cycles and industrial processes are important to accelerate the longer term deployment of CCS technology.
In power generation, for example, the capture element of CCS accounts for more than 90 per cent of the cost of the entire CCS chain. Signifi cant progress is being made with several promising capture technologies, but the development and maturation of these and other capture (and related) technologies must be accelerated. The technologies cover a broad spectrum of options. For example, novel approaches and techniques have been identifi ed in the use of solvents, membranes and sorbents that can improve the effi ciency of CO2 capture and reduce costs.
Cost effective capture R&D is achievable through globally coordinated efforts. It is promising that capture centres around the globe have formed networks to coordinate pilot–scale testing and development of new capture technologies, as evidenced by groups such as TCM Mongstad in Norway and the National Carbon Capture Center in the US.
It is important to connect this pipeline of new technology development with the learning obtained from demonstration projects using current generation technologies. This continuous development pipeline assures a smooth transition of new capture (and related) technologies into the market place.
Lessons from the current generation of capture technologies (as applied to new applications) will be realised in the 2020 time frame. When this occurs, we must be ready to transition from current to next generation capture systems, higher effi ciency power generation cycles and industrial processes to accelerate CCS deployment on a global basis.
EX
EC
UT
IVE
SU
MM
AR
Y
THE GLOBAL STATUS OF CCS | 2013 15
INFRASTRUCTURE DEVELOPMENT
Storage exploration needs urgent attentionThe estimated lead time for a greenfi eld storage assessment can be 10 or more years. This is a much longer time frame than is generally required for the engineering and construction of a large–scale capture facility. The characteristics of a particular storage site may have important infl uences on the design of the CO2 capture and transportation elements.
These co-dependencies mean that the exploration and appraisal needed for storage assurance must be scheduled in advance of major CO2 source and transport assessment expenditure. This may involve the investigation of several storage targets to mitigate the exploration risk.
Many countries have undertaken storage screening and identifi ed the opportunity for adequate storage within their jurisdictions. While national screening is important, there is an increasing need to focus on maturing demonstration project storage sites and investing the tens to hundreds of millions of dollars to prove up storage sites that can store large amounts of CO2.
There is currently no incentive for industry to undertake costly exploration programs and governments have generally not stepped in to fi ll the void (with some exceptions, like the Regional Carbon Sequestration Partnerships in the US).
To lessen the risk of CCS demonstration and deployment being slowed by uncertainty over available storage, there is an urgent need for policies and funded programs that encourage the exploration and appraisal of signifi cant CO2 storage capacity.
Linked transportation and storage solutions can reduce costs and timelinesFor CCS to meet the longer term climate challenge of restricting global warming to less than 2°C, the estimated magnitude of the CO2 transportation infrastructure that will need to be built in the coming 30–40 years is 100 times larger than currently operating CO2 pipeline networks.
The development of new large capacity CO2 ‘trunk lines’ that connect one or more large–scale CO2 capture projects with identifi ed storage formations could lower barriers to entry for other CCS projects and lead to the establishment of integrated CCS networks. An example of such is the Alberta Carbon Trunk Line (ACTL). The initial supply of CO2 (nearly 2 Mtpa) will come from North West Upgrading Inc. and Agrium Inc., but at full capacity the trunk line will be able to transport up to 14.6 Mtpa of CO2 from various industrial sources.
The development of linked transport and storage infrastructure is being considered in several parts of the world. However, there are signifi cant challenges involved in linking CO2 source clusters with pipeline networks that may cross national boundaries to access lower cost storage opportunities. The greater amounts of CO2 envisaged to be handled in these transport and storage networks increases the imperative for governments to support work that encourages strategic linking opportunities. This includes incentivising investments in large CO2 transport and storage infrastructure where it can lead to optimal development of projects.

THE GLOBAL STATUS OF CCS | 201316
1
INTRODUCTION
FIGURE 1.1 The CCS process
1.1 The critical role of CCS in managing the risks of climate change .....................17
1.2 Scope of the report...............................................................................................................................20

THE GLOBAL STATUS OF CCS | 2013 17
KEY FINDINGS
1.1 THE CRITICAL ROLE OF CCS IN MANAGING THE RISKS OF CLIMATE CHANGEEnergy is a key input into almost all activity and fundamental to societal wellbeing. Fossil fuels currently supply 81 per cent of energy consumed globally, and energy-related carbon dioxide (CO2) emissions account for more than two-thirds of total greenhouse gas (GHG) emissions. Continued global economic growth, together with ongoing strong improvement in individual wellbeing in non-OECD and OECD countries, will further increase energy consumption needs.
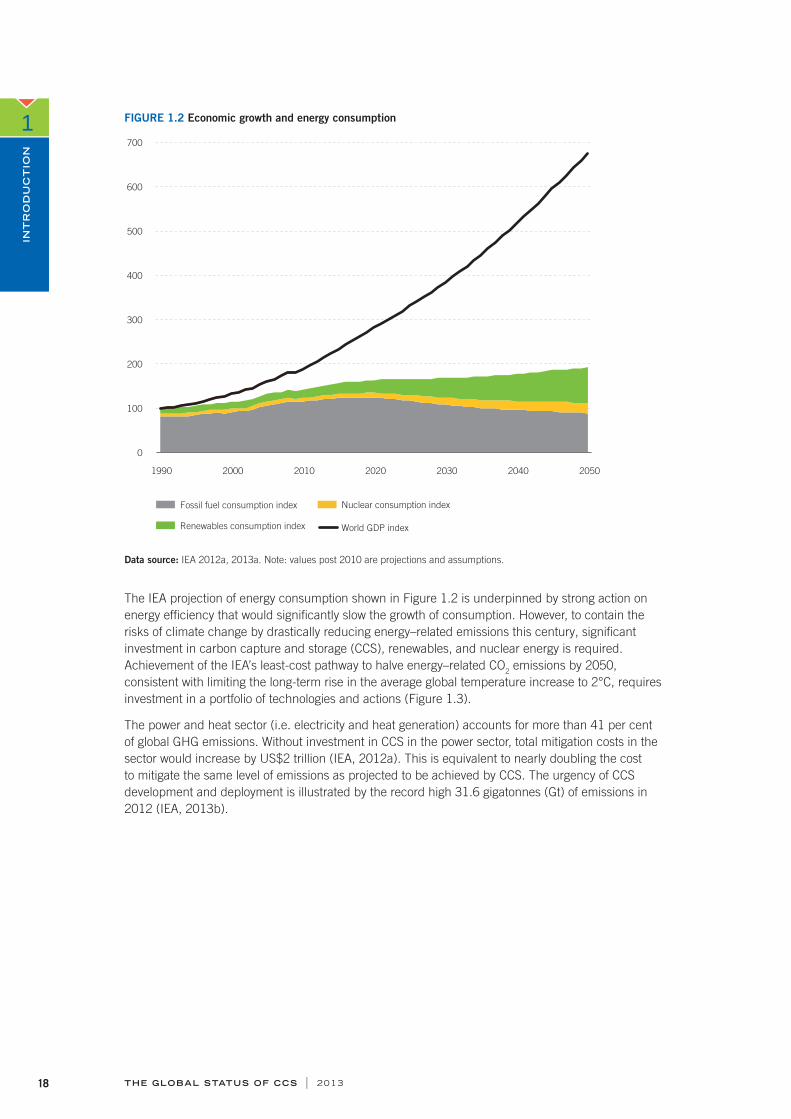
Consequently, to manage the risks of climate change through signifi cantly reduced GHG emissions will require changes in energy consumption patterns and the technologies used to produce energy. All credible climate and economic modelling of responses to manage the risks of climate change demonstrate that this can be done, with continuing steady economic growth. For example, long-term energy projections by the International Energy Agency (IEA) show that, compared to 1990, primary energy consumption could increase nearly 90 per cent by 2050, while the total value of global output increases nearly seven-fold over the same period (Figure 1.2) (IEA, 2012a).
CCS is a critical element in a portfolio of climate change technologies; applications in the industrial and power sectors are equally important.
Proper policy support to develop, demonstrate, and deploy CCS technologies will reduce the cost of managing climate change risks.
Without CCS, current climate change mitigation goals may not be achievable.
THE GLOBAL STATUS OF CCS | 201318
INT
RO
DU
CT
ION
1 FIGURE 1.2 Economic growth and energy consumption
0
100
200
300
400
500
600
700
1990 2000 2010 2020 2030 2040 2050
Fossil fuel consumption index Nuclear consumption index
Renewables consumption index World GDP index
Data source: IEA 2012a, 2013a. Note: values post 2010 are projections and assumptions.
The IEA projection of energy consumption shown in Figure 1.2 is underpinned by strong action on energy effi ciency that would signifi cantly slow the growth of consumption. However, to contain the risks of climate change by drastically reducing energy–related emissions this century, signifi cant investment in carbon capture and storage (CCS), renewables, and nuclear energy is required. Achievement of the IEA’s least-cost pathway to halve energy–related CO2 emissions by 2050, consistent with limiting the long-term rise in the average global temperature increase to 2°C, requires investment in a portfolio of technologies and actions (Figure 1.3).
The power and heat sector (i.e. electricity and heat generation) accounts for more than 41 per cent of global GHG emissions. Without investment in CCS in the power sector, total mitigation costs in the sector would increase by US$2 trillion (IEA, 2012a). This is equivalent to nearly doubling the cost to mitigate the same level of emissions as projected to be achieved by CCS. The urgency of CCS development and deployment is illustrated by the record high 31.6 gigatonnes (Gt) of emissions in 2012 (IEA, 2013b).

THE GLOBAL STATUS OF CCS | 2013 19
INT
RO
DU
CT
ION
1FIGURE 1.3 Energy–related CO2 emissions reductions by technology
10
0
20
30
40
50
60
2009 2015 20252020 2030 2035 2040 2045 2050
End-use fuel switching 12% (12%)
End-use energy efficiency 42% (39%)
CCS 14% (17%)
Nuclear 8% (8%)
Renewables 21% (23%)
Power generation efficiency and fuel switching 3% (1%)
Gt
CO
2
Source: IEA 2012a. Note: Percentages represent the share of cumulative emissions reductions to 2050. Percentages in brackets represent the share of emissions reductions in the year 2050.
Further, without CCS, it is unlikely that the 2°C target is achievable. Industrial sector emissions, including from cement, iron and steel, chemical, and refi ning industries, account for more than 20 per cent of current global emissions. CCS is the only large–scale technology available to make deep emission cuts in these sectors (IEA, 2013c). Without strong action to accelerate CCS activities, the continued industrialisation of non- OECD countries, and the shift in manufacturing output to these countries, will cause industrial emissions to grow. For this reason, the IEA recently stated that “CCS will be a critical component in a portfolio of low–carbon energy technologies if governments undertake ambitious measures to combat climate change” (IEA, 2013d, p.5).
If the 2°C target cannot be achieved, the economic damage associated with more frequent and intense storms, together with changes in rainfall patterns, will increase signifi cantly. To avoid this outcome, and to ensure mitigation costs are sustainable, CCS must be developed and deployed with due speed. And all countries must commit and act to reduce emissions.
I For more information on how CO2 is captured and stored, see Appendixes D and F respectively.

THE GLOBAL STATUS OF CCS | 201320
INT
RO
DU
CT
ION
11.2
SCOPE OF THE REPORTThe Global CCS Institute advocates for CCS as a crucial component in a portfolio of low–carbon technologies required to reduce greenhouse gas emissions. The Institute’s mission is to accelerate the development, demonstration and deployment of CCS globally. The annual global status of CCS report provides a comprehensive overview of the development of CCS projects and technologies, and of actions taken to enable the demonstration of these technologies at a large scale. This includes showcasing project, policy and other developments, as well as highlighting challenges to be addressed.
The Global Status of CCS: 2013 covers the key aspects of CCS, as described below.
Chapter 1 outlines why CCS is needed, and when, to meet climate change mitigation goals.
Chapter 2 provides the results of the Global CCS Institute’s annual projects survey. The Institute undertakes the world’s most comprehensive annual global survey of CCS projects to identify and provide an overview of those intended to demonstrate the technology at a large scale. A critical mass of these large–scale projects is needed in the short-term to demonstrate the integrated application of CCS technologies.
Chapter 3, on the business case for a CCS project, highlights key factors successful projects have in common that could be replicated in other projects. These include: product and revenue diversifi cation obtained through an innovative approach to technology integration; fi nancing prospects (notably access to export credit agency funding) improved by strategic alliances and contracting decisions; and access to targeted support provided as part of a consistent, results oriented government strategy.
Chapter 4 covers CCS policy, legislation and regulation. It provides an overview of international policy agenda developments and introduces the Institute’s CCS Policy Index (CCSPI). The CCSPI is an analytical framework for comparing domestic CCS policy actions. In addition, the chapter examines: the status of government funding programs for CCS; progressive approaches undertaken by CCS regulators; and the Institute’s survey fi ndings on the policy, legal, and regulatory issues that affect CCS projects.
Chapter 5 is dedicated to issues relating to the capture of CO2. It provides an overview of the industrial processing sectors in which CO2 capture is already happening, and identifi es CCS progress in the power generation sector, noting where more work is needed. Capture is the most costly element of a CCS project; the chapter describes ongoing activities to reduce costs.
Chapter 6 focuses on the transportation of CO2. It considers expanding CO2 transport networks, as well as design issues faced by projects dealing with challenging pipeline operating conditions. It highlights recent progress toward an international standard for CO2 pipelines, and introduces some innovative commercial and management approaches to CO2 transportation.
Chapter 7 is devoted to CO2 storage. It examines the role of CO2 enhanced oil recovery (EOR), which currently dominates geologic storage, and brings into focus efforts being made in dedicated (non-EOR) storage activities. Also highlighted are storage activities in developing countries, and the importance of pilot and demonstration projects. The chapter concludes with a case study; Project Pioneer is not proceeding, but the lessons learnt provide valuable insights for future projects.
Chapter 8 is about public engagement. It identifi es and considers trends in the annual survey data for public engagement, using examples of project best practice. In addition, it sets out the key themes and recommendations from a recent review of applied social research into CCS. And it considers the development of a CCS narrative to encourage stakeholder interest in the technology.
Opposite: The Callide Oxyfuel Project under construction. Courtesy of the Callide Oxyfuel Project. Photographer: Murray Ware.

THE GLOBAL STATUS OF CCS | 2013 21
INT
RO
DU
CT
ION
1

2
THE GLOBAL STATUS OF CCS | 2013
PROJECTS
22
2.1 Overview .......................................................................................................................................................23
2.2 Key project developments in 2013 ..........................................................................................30
2.3 Geographical LSIP trends ................................................................................................................34
2.4 Detailed project breakdown ...........................................................................................................43
2.5 CCS demonstration compared to deployment goals .....................................................52
2.6 The potential of Notable Projects ..............................................................................................55

KEY FINDINGS
THE GLOBAL STATUS OF CCS | 2013 23
2.1 OVERVIEWThe Institute monitors LSIPs as a method of tracking the progress of CCS development. LSIPs are CCS projects considered to be at a suffi ciently large scale to be representative of commercial–scale process streams (see Appendix A.1 for a full defi nition). Appendix A.3 provides an overview of the annual project survey and analysis process. The Institute tracks the development of projects as they move through the project lifecycle (Box 2.1).
As of August 2013, the Institute had identifi ed 65 large–scale integrated CCS projects (LSIPs).
This includes three new LSIPs, which are located in Brazil, China and Saudi Arabia.
Thirteen LSIPs have been removed from the Institute’s list since 2012: fi ve cancelled, seven ‘on hold’, and one downscaled.
Four projects have commenced operation since 2012, making a total of 12 CCS projects in operation.
Two projects have commenced construction since 2012, making a total of eight CCS projects under construction. Since 2010, two projects have reached this stage each year.
Due to the reduced number of LSIPs, the total mass of CO2 potentially captured and stored by all LSIPs has decreased from 148 million tonnes per annum (Mtpa) in 2012 to 122 Mtpa in 2013.
In addition to LSIPs, progress in CCS is being made at the pilot scale.
Opposite: The Quest Project’s Scotford Upgrader; a retrofi t to incorporate CO2 capture is currently under construction. Image courtesy of Shell Canada.

THE GLOBAL STATUS OF CCS | 201324
PR
OJE
CT
S
2
BOX 2.1
Short description of the CCS project lifecycle modelIn the Planning stages o f a CCS project (Identify, Evaluate, and Defi ne), the project moves from conception through to front-end engineering design (FEED) studies to gain a full understanding of its technical and economic potential. At the end of the Defi ne stage, the project defi nition is suffi cient to make a fi nal investment decision (FID). A positive FID is a key milestone that, along with the necessary permits, enables the project to commence construction (Execute stage). When construction is complete and acceptance testing has been successful, the project moves to the Operate stage. It reaches the Closure stage when injection ceases, and moves to Post-closure when decommissioning is complete and a post-closure monitoring plan is implemented. At the Execute, Operate and Closure stages, the project is considered Active. Appendix A.2 has a full explanation of the project lifecycle.
FIGURE 2.1 Project lifecycle model
Since 2012, there has been a signifi cant drop in the total number of LSIPs, down to 65 as of August 2013 compared to the 75 reported in The Global Status of CCS: 2012 (Global CCS Institute, 2012). Thirteen projects have been removed from the LSIP listing and three new projects added to it. In the short-term, without new policies and additional funding to support early stage project development, the Institute does not envision a rapid increase in the number of projects. However, it is encouraging that the number of Active projects has increased by four, bringing the total to 20. Together, these projects have the combined capacity to store more than 38 Mtpa of CO2. In contrast, the number of projects in Planning has decreased to 45, down from the 59 reported in 2012. The remaining projects in Planning have the potential to store 84 Mtpa of CO2.
IDENTIFY EVALUATEEVALUATE DEFINE
PLANNING
EXECUTE OPERATEOPERATE CLOSURE
ACTIVE
POST-CLOSURE
CLOSED
FINAL INVESTMENT DECISION DECOMMISSIONED
Pro
ject
phase
and s
tage
Single option selected Handover to owner for operations Post-closure arrangements

THE GLOBAL STATUS OF CCS | 2013 25
PR
OJE
CT
S
2
Projects in the Operate stage have the capacity to store more than 25 Mtpa of CO2. The increase of four projects in the Operate stage refl ects four new projects commencing operation in 2013 – Air Products Steam Methane Reformer EOR Project, Coffeyville Gasifi cation Plant, Lost Cabin Gas Plant, all in the United States (US) and Petrobras Lula Oil Field CCS Project in Brazil. The 12 operational projects include the In Salah CO2 Storage project, which suspended injection in June 2011. While In Salah's future injection strategy is under review a comprehensive monitoring program continues. As it is not actually injecting CO2 In Salah project data is not refl ected in the fi gures that display the capture capacity of projects in terms of mass. Two projects have also made a positive FID, however, there is no net increase in projects at the Execute stage as the increase was offset by two projects previously at the Execute stage commencing operation. The increased number of projects under construction is a key area of progress since 2010 (Figure 2.2).
A map of LSIPs is provided at Figure 2.3; projects are identifi ed by a reference number that corresponds to the detailed project listing in Appendix A.5.
FIGURE 2.2 LSIPs by project lifecycle and year
0 5 10 15 20 25 30
Identify
Evaluate
Define
Execute
Operate
Number of projects
2013 2012 2011 2010
Planning
Active
FID

THE GLOBAL STATUS OF CCS | 201326
PR
OJE
CT
S
2
FIGURE 2.3 World map of LSIPs
51
5717 46
52 22
161
47
65
10
See
Nor
th A
mer
ican
map
for
det
ail
See
Eur
ope
map
for
det
ail
See
Chi
na m
ap f
or d
etai
l
Indust
ry s
ecto
rS
tora
ge t
ype
LS
IPs:
GLO
BA
L
Pow
er
genera
tion
Syn
thetic n
atu
ral gas
Natu
ral gas
pro
cess
ing
Fert
ilise
r pro
duction
Coal-to
-liq
uid
s (C
TL)
Hyd
rogen p
roduction
Deep
salin
e form
ation
s
Ch
em
ical p
rod
uction
Oil
refin
ery
Iron
an
d s
teel p
rod
uction
En
han
ced
oil
recove
ry (
EO
R)
Variou
s op
tion
s con
sid
ere
d/
not sp
ecifi
ed
Dep
lete
d o
il an
d g
as
rese
rvoirs
Not sp
ecifi
ed

THE GLOBAL STATUS OF CCS | 2013 27
PR
OJE
CT
S
2
Figure 2.4 identifi es LSIP lifecycle stages reached by region or country. The US has the largest number of projects overall, including nine Active projects. In terms of Active projects, Canada comes next with fi ve projects.
All 12 projects in operation are in industries that separate CO2 as part of their normal procedures – natural gas processing, fertiliser production, hydrogen production, and synthetic natural gas – and therefore incur fewer additional costs than would a CCS project in the power sector. Nine of these projects use the captured CO2 for enhanced oil recovery (EOR) (Table 2.1). Hydrogen production is new to the mix of operating projects, represented by Air Products in the US; the hydrogen is later used for oil refi ning. All the new operational projects highlight the role that CO2–EOR is currently playing in enabling CCS. Operational projects that inject CO2 solely for dedicated storage are Statoil’s projects in Norway and In Salah in Algeria. It is important to note that the carbon tax in Norway is a key economic driver for these projects.
FIGURE 2.4 LSIPs by project lifecycle and region/country
Identify Evaluate Define Execute Operate
United States 0 5 6 2 7
Europe 1 7 5 0 2
China 6 3 3 0 0
Canada 0 1 1 4 1
Australia 0 3 0 1 0
Middle East 0 1 1 1 0
Other Asia 1 1 0 0 0
South America 0 0 0 0 1
Africa 0 0 0 0 1
Total 8 21 16 8 12
Total
20
15
12
7
4
3
2
1
1
65
0
5
10
15
20
Num
ber o
f pro
ject
s
The next eight projects, which are in construction (Execute), are expected to commence operation between 2014 and 2016, mostly by 2015. These projects will change the mix of operational projects, with two in power generation and one in ethanol production (Figure 2.5). And three more will store CO2 in deep saline formations.
In 2012, the Institute reported that fi ve projects were on the verge of taking an FID and transitioning from Defi ne to Execute. One project has made the transition, the Alberta Carbon Trunk Line with the North West Sturgeon Refi nery CO2 Stream in Canada. The remaining four are still close to making a decision, along with one addition, Compostilla. They are:
NRG Energy Parish Project, a planned post-combustion capture (PCC) project at a US power plant coupled with the use of the CO2 for EOR
Rotterdam Opslag en Afvang Demonstratie Project (ROAD), a planned PCC project at a power plant in The Netherlands coupled with storage of the CO2 in an offshore depleted gas reservoir
Texas Clean Energy Project, a planned pre-combustion capture project at a power plant in the US that includes a polygeneration (urea and CO2) project coupled with the use of the CO2 for EOR

THE GLOBAL STATUS OF CCS | 201328
PR
OJE
CT
S
2
Emirates Steel Industries, a planned CO2 capture project from a steel plant in the United Arab Emirates (UAE) coupled with the use of CO2 for EOR
OXY300 Compostilla, an oxyfuel combustion capture project at a power plant in Spain coupled with storage of the CO2 in an onshore deep saline formation.
In addition, several projects in China that are at the Defi ne stage have pilots that are either operational or under construction and likely to make an FID in the next few years. The increased level of government support for CCS in China is likely to sustain the current level of CCS activity in the Asia Pacifi c region.
TABLE 2.1 Active LSIPs
PROJECT NAME COUNTRY MASS CO2 (MTPA)
OPERATION DATE
CAPTURE TYPE STORAGE TYPE
Operate stage
Val Verde Natural Gas Plants US 1.3 1972 Pre-combustion (natural gas processing)
EOR
Enid Fertilizer CO2–EOR Project US 0.68 1982 Industrial separation EOR
Shute Creek Gas Processing Facility
US 7 1986 Pre-combustion (natural gas processing)
EOR
Sleipner CO2 Injection Norway 0.85 1996 Pre-combustion (natural gas processing)
Deep saline formations
Great Plains Synfuel Plant and Weyburn–Midale Project
Canada 3 2000 Pre-combustion (gasifi cation)
EOR
In Salah CO2 storage Algeria Injection suspended
2004 Pre-combustion (natural gas processing)
Deep saline formations
Snøhvit CO2 Injection Norway 0.6–0.8 2008 Pre-combustion (natural gas processing)
Deep saline formations
Century Plant US 8.4 2010 Pre-combustion (natural gas processing)
EOR
Air Products Steam Methane Reformer EOR Project
US 1 2013 Pre-combustion (gasifi cation)
EOR
Petrobras Lula Oil Field CCS Project
Brazil 0.7 2013 Pre-combustion (natural gas processing)
EOR
Coffeyville Gasifi cation Plant US 1 2013 Industrial seperation EOR
Lost Cabin Gas Plant US 1 2013 Pre-combustion (natural gas processing)
EOR
Execute stage
Boundary Dam Integrated CCS Demonstration Project
Canada 1 2014 Post-combustion EOR
Illinois Industrial CCS Project US 1 2014 Industrial separation Deep saline formations
Kemper County IGCC Project US 3.5 2014 Pre-combustion (gasifi cation)
EOR
Uthmaniyah CO2–EOR Project Saudi Arabia
0.8 2014 Pre-combustion (natural gas processing)
EOR
ACTL with Agrium CO2 Stream Canada 0.4–0.6 2015 Industrial separation EOR
Gorgon Carbon Dioxide Injection Project
Australia 3.6–4.1 2015 Pre-combustion (natural gas processing)
Deep saline formations
Quest Canada 1.08 2015 Pre-combustion (gasifi cation)
Deep saline formations
ACTL with North West Sturgeon Refi nery CO2 Stream
Canada 1.2–1.4 2016 Pre-combustion (gasifi cation)
EOR

THE GLOBAL STATUS OF CCS | 2013 29
PR
OJE
CT
S
2
FIGURE 2.5 LSIPs proceeding to Operate and Execute since 2010, including in 2013 projects that are close to an FID
Execute
EUROPEEOR
NON-EOR
EOR
NON-EOR
EOR
NON-EOR
NORTH AMERICA
REST OF THE WORLD
20
10
EUROPEEOR
NON-EOR
EOR
NON-EOR
EOR
NON-EOR
NORTH AMERICA
REST OF THE WORLD
20
13
Possible FID in next 12 monthsOperate
Natural gas processing Power Generation Other industries Iron and steel production
THE GLOBAL STATUS OF CCS | 201330
PR
OJE
CT
S
2
2.2 KEY PROJECT DEVELOPMENTS IN 2013
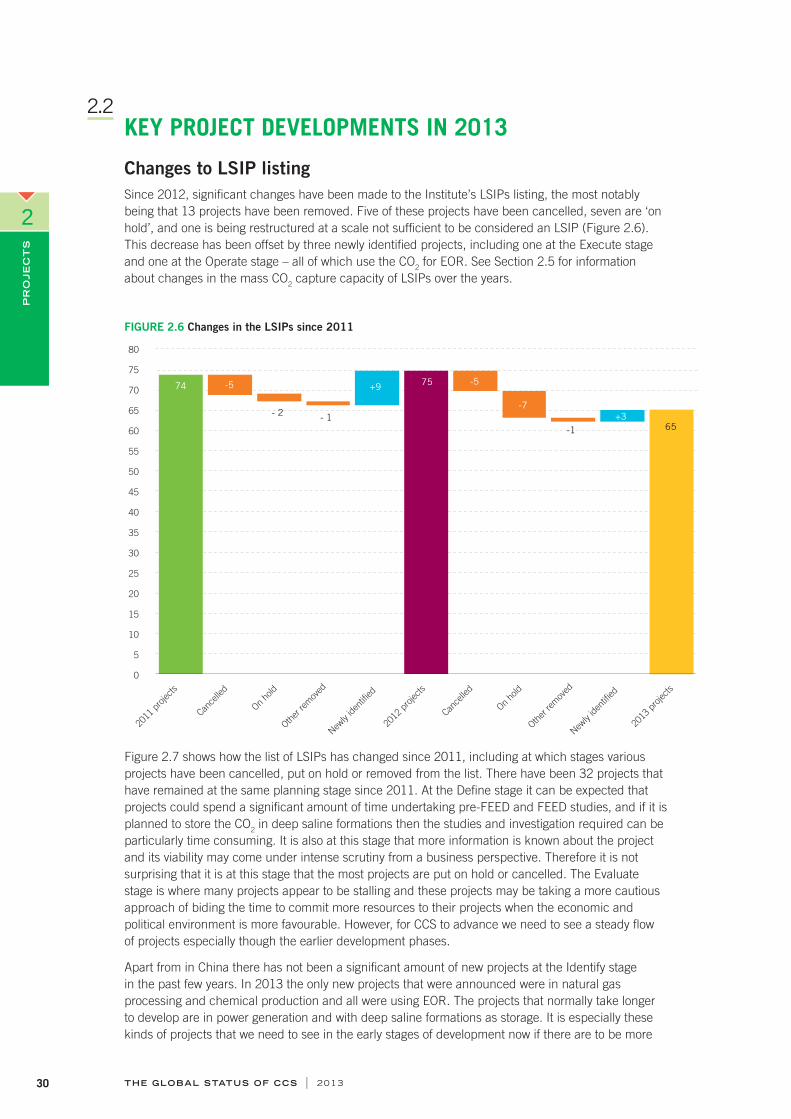
Changes to LSIP listingSince 2012, signifi cant changes have been made to the Institute’s LSIPs listing, the most notably being that 13 projects have been removed. Five of these projects have been cancelled, seven are ‘on hold’, and one is being restructured at a scale not suffi cient to be considered an LSIP (Figure 2.6). This decrease has been offset by three newly identifi ed projects, including one at the Execute stage and one at the Operate stage – all of which use the CO2 for EOR. See Section 2.5 for information about changes in the mass CO2 capture capacity of LSIPs over the years.
FIGURE 2.6 Changes in the LSIPs since 2011
0
5
10
15
20
25
30
35
40
45
50
55
60
65
70
75
80
2011
pro
jects
2012
pro
jects
Cance
lled
On ho
ld
Other
rem
oved
New
ly iden
tified
2013
pro
jects
Cance
lled
On ho
ld
Other
rem
oved
New
ly iden
tified
- 2 - 1
-5
-7
-5
-1 +3
74 75
65
+9
Figure 2.7 shows how the list of LSIPs has changed since 2011, including at which stages various projects have been cancelled, put on hold or removed from the list. There have been 32 projects that have remained at the same planning stage since 2011. At the Defi ne stage it can be expected that projects could spend a signifi cant amount of time undertaking pre-FEED and FEED studies, and if it is planned to store the CO2 in deep saline formations then the studies and investigation required can be particularly time consuming. It is also at this stage that more information is known about the project and its viability may come under intense scrutiny from a business perspective. Therefore it is not surprising that it is at this stage that the most projects are put on hold or cancelled. The Evaluate stage is where many projects appear to be stalling and these projects may be taking a more cautious approach of biding the time to commit more resources to their projects when the economic and political environment is more favourable. However, for CCS to advance we need to see a steady fl ow of projects especially though the earlier development phases.
Apart from in China there has not been a signifi cant amount of new projects at the Identify stage in the past few years. In 2013 the only new projects that were announced were in natural gas processing and chemical production and all were using EOR. The projects that normally take longer to develop are in power generation and with deep saline formations as storage. It is especially these kinds of projects that we need to see in the early stages of development now if there are to be more

THE GLOBAL STATUS OF CCS | 2013 31
PR
OJE
CT
S
2
projects reaching operation in the near term. Much of the progress that can be seen in this chart refl ects developments in China – in 2013, three projects in the Identify or Evaluate stages were reassessed and moved into the Defi ne stage, and one Identify project moved to Evaluate. Three are driven by EOR and all will be using the CO2 from industrial sources.
FIGURE 2.7 Changes within the lifecycle stages of the LSIPs since 2011
-10 -5 0 5 10 15 20 25
Identify
Evaluate
Define
Execute
Operate
Common between 2011–13
New since 2011
Cancelled/ On hold/ Removed since 2011
Progressed to stage since 2011
Newly identifi ed LSIPsThree new LSIPs were identifi ed this year: Petrobras Lula in Brazil, Uthmaniyah CO2–EOR Project in Saudi Arabia, and Yanchang Jingbian CCS Project (Phase 2) in China. Two of these projects originated from natural gas processing, and one is related to chemical production. All want the captured CO2 for EOR.
As part of developing the Lula project, Petrobras conducted studies and determined that CO2–EOR provided an attractive means to cost effectively recover hydrocarbon reserves. The main drivers for developing a CCS project were the naturally occurring CO2 content in the hydrocarbon resource and the strategic decision not to vent this CO2 to the atmosphere (Pizarro and Branco, 2012). The Brazilian project commenced operation as an LSIP in June 2013 and captures 0.7 Mtpa of CO2 from offshore gas processing. The captured CO2 is then injected for EOR. The Lula fi eld is located in the Santos Basin, about 300 km off the coast of Rio de Janeiro. The project is conducted as a fl oating production, storage, and offl oading (FPSO) facility with CO2 separation; a 2 km injection riser delivers the CO2 for injection. The depth of the oil reservoir varies from 2 to 5 km below the ocean fl oor. Injection commenced at a smaller scale in 2011 and used tracers and pressure monitors to assess the CO2 behaviour.
The Uthmaniyah project is under construction in the Eastern Province of Saudi Arabia; it is the fi rst in Saudi Arabia. The plan is to capture 0.8 Mtpa of CO2 at the Hawiyah natural gas processing plant and transport it by pipeline to the depleted Uthmaniyah area of the Ghawar fi eld. The project objectives are to: recover oil previously not accessible via water-fl ooding means; estimate the amount of CO2 stored; assess the risks and uncertainties of managing CO2 at these large scales; and identify general operational concerns of a CCS project (CSLF, 2013). The project is of special interest because it will provide a test bed for monitoring and surveillance technologies. It is expected to commence operation in 2014 with a total duration of three to fi ve years.
Yanchang (Phase 2) is an industrial CCS project located in the Shaanxi Province of China. Phase 1 commenced operation in 2012 and captures 50,000 tpa of CO2 from coal-to-chemical plants for EOR in the Jingbian oil fi eld. Phase 2 will develop a 360,000 tpa CO2 capture facility by July 2014 and will also use CO2 from coal–chemical plants for EOR. The CO2 is currently transported by truck, but by 2016 an estimated 200–250 km of pipeline is expected to transport the CO2. Around six to eight million tonnes of CO2 is expected to be captured over the life of the project.

THE GLOBAL STATUS OF CCS | 201332
PR
OJE
CT
S
2
Projects removed from LSIP listingThirteen projects have been removed from the Institute’s LSIP listing, mainly because they have been cancelled or put on hold. The following projects have been cancelled:
PurGen One project in the US, at the Defi ne stage. In October 2012, SCS Energy announced it was prioritising investment in its Hydrogen Energy California (HECA) project.
Bełchatów project in Poland, at the Defi ne stage. In April 2013, the Polish Power Group (PGE), operator of the power plant and project proponent, announced the company was unable to secure the necessary fi nancing for the project.
Taylorville Energy Center in the US, in the Defi ne stage. Tenaska announced in June 2013 that its CCS projects are being discontinued due to changing economics and the lack of legislation to provide a suffi cient foundation to pursue advanced coal projects.
Tenaska Trailblazer Energy Center in the US, in the Defi ne stage. The same rationale as for Taylorville Energy Center.
Cash Creek in the US, in the Evaluate stage. The proponent advised the Institute that it no longer intends to construct a CCS project. The intent is to now build a natural gas combined cycle facility at the site.
The following projects are on hold:
Green Hydrogen in The Netherlands, in the Defi ne stage. This project is considered on hold after being considered not eligible for New Entrants Reserve 300 (NER300) funding in late 2012.
Swan Hills Synfuels project in Canada, at the Defi ne stage. In February 2013, Swan Hills Synfuels indicated that it was deferring its CCS project. It said it would proceed with a CCS program when natural gas prices reached a value that would enable the project to provide a reasonable return on investment.
Hydrogen Power Abu Dhabi (HPAD) in the UAE, in the Defi ne stage. Masdar has advised that this project can be considered on hold; it is focusing on the delivery of the Emirates Steel Industries (ESI) project.
Eemshaven CCS project in The Netherlands, at the Evaluate stage. This project is considered on hold following the Dutch Government’s decision to not support its submission in the NER300’s fi rst round.
Pegasus Rotterdam project in The Netherlands, at the Evaluate stage. As with Eemshaven, this project is considered on hold following the Dutch Government’s decision to not support its submission in the NER300’s fi rst round.
Southland Coal and Fertiliser in New Zealand, at the Evaluate stage. The proponent has advised that Solid Energy is prioritising investment in other projects; no active work is being undertaken on this project.
Maritsa in Bulgaria, at the Identify stage. This project is not currently being pursued.
The following project has also been removed from the LSIP listing:
Sargas in Malta, in the Identify stage. This project has been restructured to a scale that is no longer suffi cient to be counted as an LSIP. It is now included in the Institute’s list of Notable Projects.
Overall, power generation projects were most commonly cancelled or put on hold (Figure 2.8).

THE GLOBAL STATUS OF CCS | 2013 33
PR
OJE
CT
S
2
FIGURE 2.8 LSIPs removed from the 2013 project listing
1 2 3 4 5 6
On hold
On hold
On hold
Removed
On hold
Cancelled
Fert
ilise
r
pro
du
ction
Hyd
rogen
pro
du
ction
Syn
thetic
natu
ral
gas
Pow
er
gen
era
tion
Number of projects
United States Europe Canada New Zealand Middle East
0
Project progress In 2013, Air Products, Coffeyville and Lost Cabin, all in the US and Petrobras Lula in Brazil began operating. The Petrobras Lula project was added to the LSIP list in June 2013, when Petrobras confi rmed the project was active and CO2 monitoring was being conducted.
Two projects moved to the Execute stage in 2013: Alberta Carbon Trunk Line with North West Sturgeon Refi nery CO2 Stream in Canada, and Uthmaniyah CO2–EOR Project in Saudi Arabia. Construction commenced on the North West Project in the fi rst half of 2013 and will take three years to complete; it is expected to be operational in 2016.
There have also been some developments in the planning stages, mostly in China. They include:
Sinopec Shengli Oil Field EOR Project (Phase 2) in China, from Evaluate to Defi ne
FutureGen 2.0 in the US, from Evaluate to Defi ne
Sinopec Shengli Dongying in China, from Identify to Defi ne
PetroChina Jilin Oil Field EOR Project (Phase 2) in China, from Identify to Defi ne
Captain Clean Energy in the United Kingdom (UK), from Identify to Evaluate
Shenhua Ordos CTL Project (Phase 2) in China, from Identify to Evaluate.

THE GLOBAL STATUS OF CCS | 201334
PR
OJE
CT
S
2
2.3 GEOGRAPHICAL LSIP TRENDSOverall, LSIP numbers are expected to continue to decrease globally as outcomes of funding programs are determined. Moreover, it is not guaranteed that the level of government funding support offered to projects will be suffi cient for some of them to move ahead. New incentives for developing CCS projects are needed to offset the decrease in project numbers.
In the Americas, the US continues to have the largest number of LSIPs at 20 (Figure 2.9), including nine in construction or operation, although 2013 has seen the biggest decrease in US projects since 2010, with a total of four cancelled. In Canada, four projects are in construction, and one, the Great Plains Synfuels Weyburn–Midale project, has been in operation for some time. But Swan Hills, which was in the advanced stages of planning (Defi ne), has been put on hold due to low natural gas prices, making a business case for some projects diffi cult to justify. Brazil is leading in South America, with the Petrobras Lula CCS project now in operation.
The number of projects in Europe has also decreased, from 21 to 15. In previous years, the number of projects in Europe remained stable because any projects that were removed were offset by newly announced projects. It should be noted that in Europe projects are more likely to be put on hold than cancelled. Of the six projects removed from the LSIP listing, four are on hold, one has been downsized in scale, and only one cancelled. Project proponents in these cases may be hopeful that more incentives will emerge in the future to enable their projects to be reinstated.
However, some projects are making progress. A country with much promise is the UK, where two of its six LSIPs are likely to be awarded funds under the CCS Commercialisation Programme. Other mechanisms, like the Contracts for Difference (CfD), are available for projects not awarded funding, but the benefi ts will depend on how these other mechanisms are implemented. The 15 projects in Europe are either operational, restructuring their value chain, or looking for additional fi nancial support, with ROAD and Compostilla expected to make an FID before the end of 2013.
While there has been no change to the total number of LSIPs in the Middle East, one project, HPAD in the UAE, has been put on hold. This has been offset by the newly identifi ed project, Uthmaniyah, Saudi Arabia’s fi rst LSIP.
China continues to make progress, with 12 LSIPs – one more than in 2012. Three projects in China have advanced from Identify or Evaluate to Defi ne, and a further project has advanced from Identify to Evaluate. While these projects are all still in the planning stages (Figure 2.10), four have pilot projects that are already in operation. This approach is typical in China, where pilot projects are considered important for companies to build confi dence before scaling up.
In Australia, the number of LSIPs and project stages remains steady. However, New Zealand’s only project, the Southland CTF Project, has been put on hold at the Evaluate stage. As a result, there are no LSIPs in New Zealand.
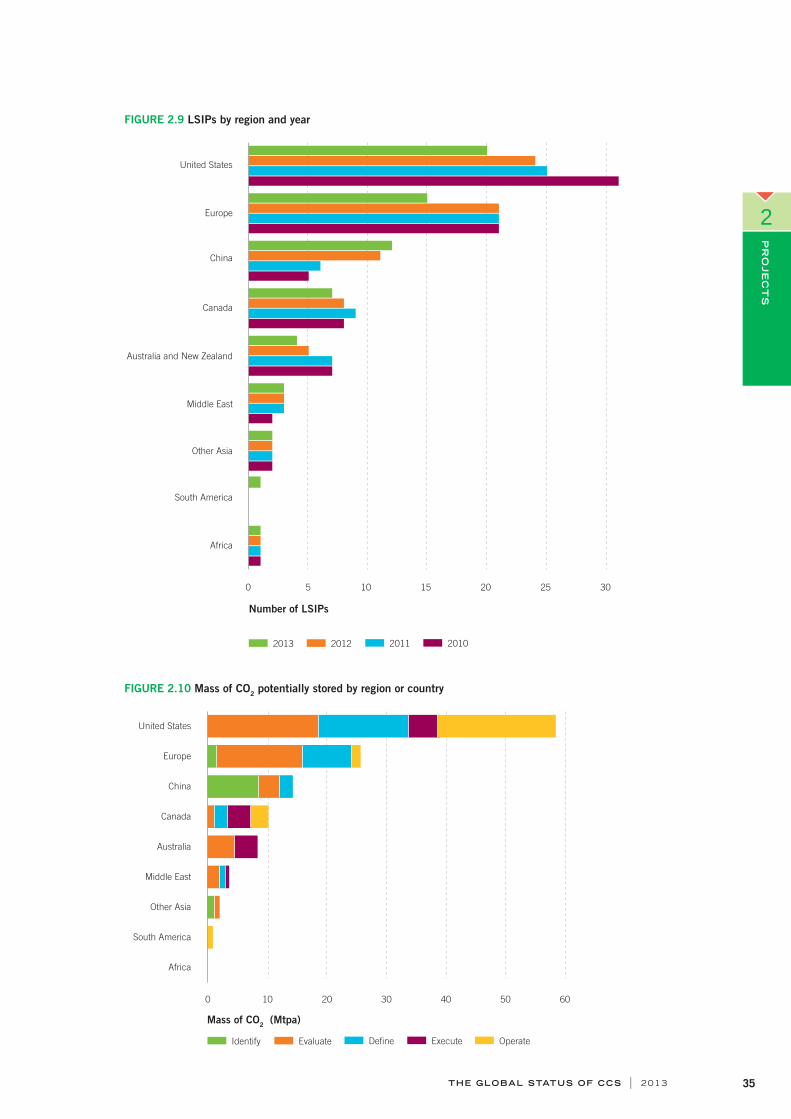
THE GLOBAL STATUS OF CCS | 2013 35
PR
OJE
CT
S
2
FIGURE 2.9 LSIPs by region and year
0 5 10 15 20 25 30
Africa
South America
Other Asia
Middle East
Australia and New Zealand
Canada
China
Europe
United States
Number of LSIPs
2013 2012 2011 2010
FIGURE 2.10 Mass of CO2 potentially stored by region or country
0 10 20 30 40 50 60
South America
Africa
Other Asia
Middle East
Australia
Canada
China
Europe
United States
Mass of CO2 (Mtpa)
Identify Evaluate Define Execute Operate

THE GLOBAL STATUS OF CCS | 201336
PR
OJE
CT
S
2
The Americas
UNITED STATES
The US leads the world in the number of CCS and carbon capture utilisation and storage (CCUS) projects being pursued at various scales (Figure 2.11). As with any fi rst-of-a-kind technology, a variety of challenges has arisen and been resolved. Southern Company’s Kemper County Project is on schedule to complete construction in May 2014. It is both a demonstration project and one of the fi rst two power plants in the world integrated with a CCS system that will go into full commercial service (the other is Boundary Dam in Saskatchewan, Canada). The FutureGen 2.0 Project is continuing to move forward – Phase I was completed earlier this year and the US Department of Energy (DOE) has approved Phase II. More recently, the FutureGen Alliance completed the purchase of a portion of the Meredosia Power Plant. Indiana Gasifi cation, a subsidiary of Leucadia, has received its construction permit. And Texas Clean Energy Project (TCEP) and the NRG Parish Project continue to move forward, with FID expected in the near future. Three of the four LSIPs that have commenced operation in 2013 are in the US, Air Products in Texas, Coffeyville in Kansas and Lost Cabin in Wyoming.
Project developers who announced they would not be proceeding with their LSIPs primarily cited as the reason diffi culty in making the business case for a fi rst-of-a-kind demonstration project under the current economic, market, and regulatory environment. The decision to cancel two Tenaska projects was based on changing economics (increase in the supply of natural gas, with a decrease in natural gas price, and the reduced cost of renewable power) and the lack of legislation. For its Taylorville Energy Center, these factors included a lack of state legislation to implement the long-term sale of an initial clean coal project’s electric output. And for the Trailblazer Energy Center, it was a lack of federal law or regulatory policies that would provide a suffi cient foundation for the commercial–scale clean coal project to move forward. Tenaska has announced that it will now focus on developing natural gas–fuelled and renewable facilities across the US.
It is important to note that even though projects have been cancelled, the outputs they produced can still be of assistance to other CCS projects. For example, the Trailblazer FEED study with Fluor Enterprises (Tenaska, 2012) confi rmed the carbon capture plant capital cost through an open book estimation process.
CANADA
Much of the project activity in Canada is in the western provinces of Alberta and Saskatchewan (Figure 2.11). The governments of both provinces have continued to make signifi cant investments in CCS research and development (R&D), as well as viable integrated CCS demonstrations, and look forward to sharing their knowledge broadly. Economic challenges, including an abundance of low price natural gas, led to the decision to not proceed with Swan Hills in Canada, but several other projects have proceeded to construction.
One project in operation for some time and that is continuing is the Great Plains Gasifi cation Synfuels Weyburn–Midale project, where CO2 from Great Plains is supplied for EOR operations at Weyburn–Midale in Saskatchewan. Among the projects proceeding with construction is the Alberta Carbon Trunk Line Project, which will connect to two other projects, Agrium CO2 Stream and North West Sturgeon Refi nery CO2 Stream, as sources of CO2. Commissioning of the Alberta Carbon Trunk Line pipeline is expected to occur in 2014 and the start of operations in 2015. When in full operation, it will be the world’s largest CCS trunk line in terms of capacity. Construction of Shell’s Quest hydrogen production with CCS project is also proceeding.
SaskPower’s Boundary Dam Unit 3 in Canada and Southern Energy's Kemper Integrated Gasifi cation Combined Cycle (IGCC) CCS Project in the US are the fi rst two LSIP power projects with CCS in the world under construction. Boundary Dam's power unit is scheduled to start operations in late 2013, with capture operational in 2014. It has also indicated it plans to fi t CCS to the other Boundary Dam plant units. Based on the knowledge and experience it has gained from the fi rst Boundary Dam CCS project, SaskPower estimates that the next retrofi t unit will be 30 per cent less in capital cost and 20 per cent less in operating cost.

THE GLOBAL STATUS OF CCS | 2013 37
PR
OJE
CT
S
2
FIGURE 2.11 Map of LSIPs in North America
Industry sector Storage type
LSIPs: NORTH AMERICA
Power generation
Synthetic natural gas
Natural gas processing
Fertiliser production
Coal-to-liquids (CTL)
Hydrogen production
Deep saline formations
Chemical production
Oil refinery
Enhanced oil recovery (EOR)
37
1529
28
1920
18
546
13
45
1248
4
27
33
231
8
311
26
9
21 38
14
50
British
Columbia
Alberta
Saskatchewan
CANADA
UNITED STATES OF AMERICA
California
Texas
North Dakota
Wyoming
Kansas
Illinois
Indiana
Kentucky
Louisiana
Mississippi
Oklahoma
MEXICO
BRAZIL
South America’s Petrobras Lula project was a very positive new development in 2013. The project’s decision not to vent the CO2 from natural gas processing operations and use the CO2 for EOR shows the potential for EOR projects to store CO2 while maximising oil production. Many industries currently vent almost pure CO2 streams as part of normal processing procedures; like this project they would be excellent candidates for demonstrating CCS, especially infrastructure set up and CO2 transport and storage.
There are also several CCS research and demonstration projects in Brazil. One notable project is the Miranga pilot, which is testing different storage technologies with a view to developing technologies for use in the Santos Basin.

THE GLOBAL STATUS OF CCS | 201338
PR
OJE
CT
S
2
Europe, Middle East, and Africa (EMEA)The EMEA region has successfully demonstrated dedicated CO2 storage since 1996. It hosts a wide portfolio of CCS projects and is developing a complete range of capture technologies (pre- and post-combustion, as well as oxyfuel), transport options, and a diverse variety of onshore and offshore storage options (deep saline formations, depleted gas reservoirs, and CO2–EOR).
Two large–scale projects in the steel and iron sector are being developed in Europe and the Middle East. Their successful deployment will be of global signifi cance, as CCS is the only technology able to substantially decrease CO2 emissions in this sector.
EUROPE
Signifi cant changes in Europe clearly illustrate the role public policy, the economy, and fi nances can play in the progress of a technology.
Until recently, the number of projects in Europe appeared relatively constant. In 2013, however, six European projects were cancelled or put on hold and no new projects were announced. This refl ects the dynamism of CCS activity in Europe and the ongoing diffi culty for project proponents to assemble a viable business case or make a positive FID to move into construction. The decreased number of projects since 2012 can be linked to several causes.
In December 2012, no CCS project was awarded funding under the much anticipated fi rst round of the European Commission’s (EC) NER300 funding program. Only the Ultra-Low CO2 Steelmaking (ULCOS) Blast Furnace project passed the selection and secured the mandated co-funding agreement from its member state (France), but it was subsequently withdrawn by the project developer. This was a signifi cant setback to the original plan announced by European governments in 2008 to fund up to 12 CCS projects over the two phases of the NER300 program. More than €1.2 billion (US$1.6 billion) was awarded to 23 renewable energy demonstration projects in the fi rst round. The EC expressed its regrets at the absence of CCS projects under the fi rst call. It commented that member states had not confi rmed their projects due to reported funding gaps or lack of CCS project maturity.
Much of Europe’s focus has been directed toward restructuring or cancelling projects; preparing for the second round of the NER300; and the UK’s CCS Commercialisation Programme. Four projects are not proceeding because they have been cancelled or put on hold. They are: Bełchatów in Poland, and, in The Netherlands, Eemshaven, Pegasus, and Green Hydrogen.
In October 2012, the UK Department of Energy and Climate Change (DECC) announced the four projects shortlisted to compete for GB£1 billion (US$1.61 billion) in funding for upfront costs and additional support through the UK Electricity Market Reforms investment in low–carbon technologies CfD tool. In March 2013, the UK Government announced the two preferred bidders, Peterhead Gas CCS Project and White Rose. The Government has since undertaken discussions with the preferred bidders to agree terms for FEED studies that will take about 18 months. In early 2015, it will make an FID on the construction of up to two projects. DECC also announced two reserve projects: Captain Clean Energy Project (formerly Caledonia Clean Energy Project) and Teesside Low Carbon Project.
In April 2013, the EC launched the NER300 second call for proposals. By the 3 July deadline, of the nine projects announced, only White Rose had applied. The NER300 program’s second call will be funded with proceeds from the sale of 100 million European Union (EU) Emissions Trading System (ETS) allowances, as well as approximately €288 million that remains unspent from the fi rst call. Although the total amount of funding will only be known once the sale of allowances has been completed, the Institute estimates that no more than €290 million will be available for any single project.
Other major LSIPs in Europe continue to make progress, despite the challenges discussed. They include:
The Don Valley project in the UK, which is receiving European Energy Programme for Recovery (EEPR) funding, applied for the fi rst round of the NER300 and bid for the UK Government’s CCS commercialisation competition. However, as the UK government did not guarantee the project fi nancial support in October 2012 the project was therefore not confi rmed for NER300 funds. The project sponsors are evaluating options to restructure the value chain with reduced

THE GLOBAL STATUS OF CCS | 2013 39
PR
OJE
CT
S
2
FIGURE 2.12 Map of LSIPs in Europe
FranceRomania
Italy
NetherlandsUnited
Kingdom
Spain
Norway
Industry sector Storage type
LSIPs: EUROPE
Power generation
Natural gas processing
Iron and steel production
Deep saline formations
Enhanced oil recovery (EOR)
Various options considered/
not specified
Depleted oil and gas reservoirs
544
35
30
32
36
41
34
53
49
39
42
55
61
7

THE GLOBAL STATUS OF CCS | 201340
PR
OJE
CT
S
2
capital, reduced CO2 supply, and a later FID. The initial CO2 supply from a smaller plant would be insuffi cient for offshore EOR, so the fi rst storage option would be the Southern North Sea site, where development continues to investigate a deep saline formation.
The ROAD Project in The Netherlands, which is receiving EEPR funding, is still pursuing additional fi nancial support. An FID is expected at the end of 2013.
The OXYCFB 300 Compostilla project in Spain, which is receiving EEPR funding, is the only remaining onshore project, and the only project with oxyfuel capture that is in a position to make an FID by the end of 2013.
The ULCOS Blast Furnace project, established by a consortium of iron and steel producers to develop one major demonstration project, was the only project eligible for fi rst call NER300 funding. Unfortunately, it was withdrawn from the competition. Development of the project is continuing with direct support from the French Government and ArcelorMittal of at least €180 million over fi ve years to the host plant. An undisclosed fraction is expected to be allocated to the CCS project at the site, which is being restructured, with priority given to CO2 capture and valorisation. The project’s new name is LIS (Low-Impact Steel project).
Signifi cant developments continue to take place in Norway, the clear leader in CCS in Europe. The Sleipner and Snøhvit projects continue to safely store CO2. The Technology Center in Mongstad is progressing and several storage sites have been pre-identifi ed for the full–scale project.
MIDDLE EAST AND AFRICA
The Middle East, which has some of the highest CO2 emissions per capita, possesses a signifi cant level of expertise and infrastructure, as well as good storage potential through its oil and gas sector. There is currently a high level of interest in CCS in this region and the Institute is currently investigating potential new LSIPs.
The Abu Dhabi Future Energy Company CCS Network (Masdar) in the UAE has seen some changes in scope. Initially, the network included the following projects:
ESI: capture of 0.8 Mtpa of CO2 from a dehydration and compression unit at an existing steel plant
Emirates Aluminium (EMAL): capture of 2 Mtpa of CO2 from an existing natural gas–based power plant at an aluminium smelter complex
HPAD: a hydrogen combined cycle power plant designed to capture 1.7 Mtpa of CO2 (90 per cent of the plant's emissions).
Masdar has moved to a staged CCS strategy approach, focusing on the delivery of the ESI project as the fi rst step in the rollout of the broader strategy. This project is close to making an FID and so could start construction soon; the steel plant is already in operation. The HPAD project is currently on hold.
The ESI project produces CO2–rich gas from a direct iron oxide reduction reaction as a byproduct from the amine absorption units. It will capture the CO2, which will not require process removal of impurities apart from water because it is a very pure stream of CO2, then compress, dehydrate, and pump it through 50 km of 8 inch pipeline. Abu Dhabi National Oil Company (ADNOC) will use the CO2 for EOR in the Rumaitha onshore fi eld. The project is due to start in 2015.
In Saudi Arabia, Saudi Aramco is constructing its fi rst CO2–EOR injection and storage test site. The CO2 will be captured at the Hawiyah natural gas processing (NGL) plant and transported by pipeline to the depleted Uthmaniyah area of the Ghawar fi eld. Starting in 2014, the pilot phase will inject 0.8 Mt of CO2 for three to fi ve years. An extensive range of monitoring and surveillance technology will be tested.
At In Salah in Algeria, the In Salah Joint Industry Project (JIP) has achieved its objective to test and deploy routine monitoring of storage integrity. With the JIP completed, injection has been suspended while the In Salah Gas Joint Venture (JV) reviews technical and commercial data to make a decision about the future operations at the Krechba Gas Field CO2 storage site. Further details are available in the paper presented at the GHGT-11 conference in Kyoto, 2012.

THE GLOBAL STATUS OF CCS | 2013 41
PR
OJE
CT
S
2
Asia Pacifi c
CHINA
China’s 12 LSIPs are steadily progressing through the project lifecycle, with six projects now in the Identify stage, three in Evaluate and three in Defi ne. The more advanced projects are dominated by China’s large state–owned petroleum companies. Sinopec and PetroChina are responsible for the three projects in Defi ne stage: Sinopec Shengli Oil Field EOR Project (Phase 2), Sinopec Shengli Dongying CCS Project, and PetroChina Jilin Oil Field EOR Project (Phase 2). Petroleum company Yanchang Petroleum Group is responsible for a project in Evaluate stage, Yanchang (Phase 2). These petroleum companies tend to own the full CCS chain, from CO2 source to sink, which reduces the complications associated with third party involvement and allows them to move much more swiftly. While these projects vary from power generation to chemical production and natural gas processing, they all involve pipeline transport and EOR as their primary storage option. Another trend is that most of these advanced projects are being developed in multiple phases. Sinopec Shengli Oil Field EOR Project (Phase 2) and PetroChina Jilin Oil Field EOR Project (Phase 2) have had pilot projects operating successfully for several years, and Yanchang (Phase 2) is currently operating a 50 kilo-tonnes per annum (ktpa) capture facility.
FIGURE 2.13 Map of LSIPs in China
Ningxia
Beijing
Heilongjiang
Shanghai
Jilin
Tianjin
Inner Mongolia
Guangdong
Shaanxi
Shanxi
Shandong
Jiangsu
CHINA
Industry sector Storage type
LSIPs: CHINA
Power generation
Natural gas processing
Coal-to-liquids (CTL)
Deep saline formations
Chemical production
Enhanced oil recovery (EOR)
Various options considered/
not specified
Depleted oil and gas reservoirs
63
64
2423
40
59
25
62
5658
6043

THE GLOBAL STATUS OF CCS | 201342
PR
OJE
CT
S
2
AUSTRALIA AND NEW ZEALAND
The number of LSIPs in Australia/New Zealand (NZ) decreased from fi ve projects in 2012 to four in 2013, when NZ’s Southlands Coal to Fertiliser project was put on hold following major restructuring of Solid Energy, the project’s proponent.
Four LSIPs are progressing in Australia. The Gorgon Carbon Dioxide Injection Project is continuing construction. It is part of the Gorgon LNG project and includes a three-train liquefi ed natural gas (LNG) facility on Barrow Island (off Western Australia (WA)) that will produce 15.6 million metric tonnes of LNG a year. The fi rst of three amine absorber columns has been placed in position on the plant site. The project will sequester more than three million tonnes of the CO2 it produces every year. The project is expected to commence capturing and storing CO2 in 2015.
Three of Australia’s LSIPs remain eligible for funding under the CCS Flagship Program:
The South West CO2 Geosequestration Hub project in WA is continuing to characterise the storage site. Early results from the stratigraphic well drilled in 2012 have been assessed and indicate that further development work is warranted. The project is working toward completing a 3D seismic survey of the region.
The CarbonNet Project is developing its business case. It has identifi ed three potential storage sites and is continuing work to identify a CO2 source, which may include power generation, industrial processes, or gas production, therefore they are not included in some charts that need to specify capture type. Work has also commenced to identify the pipeline route from the Latrobe Valley to the potential storage sites.
In Queensland, the Surat Basin CCS Project (also known as CTSCo project) has passed all the technical and assessment hurdles, but it is not known when funding for the next stage of the project will be approved.
Two major research infrastructure grants from the Australian Government were awarded during the year. The National Geosequestration Laboratory (a collaboration between Australia’s Commonwealth Scientifi c and Industrial Research Organisation (CSIRO), The University of Western Australia, and Curtin University) received AU$48.4 million. And AU$51.6 million was announced for CCSNET, an initiative led by the Cooperative Research Centre for Greenhouse Gas Technologies (CO2CRC). The aim of these grants is to develop research infrastructure necessary to support the CCS Flagship projects in Australia.
The Australian Government has commenced a national project to provide project proponents easy access to CO2 infrastructure information. The project will include preparation of a pipeline and corridor database that identifi es easement and access issues that may be of environmental and social concern.
Other notable projects in Australia are continuing work to progress CCS. The Callide Oxyfuel project was formally launched in December 2012 and will undergo an 18–24 month test period. The CO2CRC celebrated its 10th anniversary in 2013 and is continuing geological storage research at its Otway project.
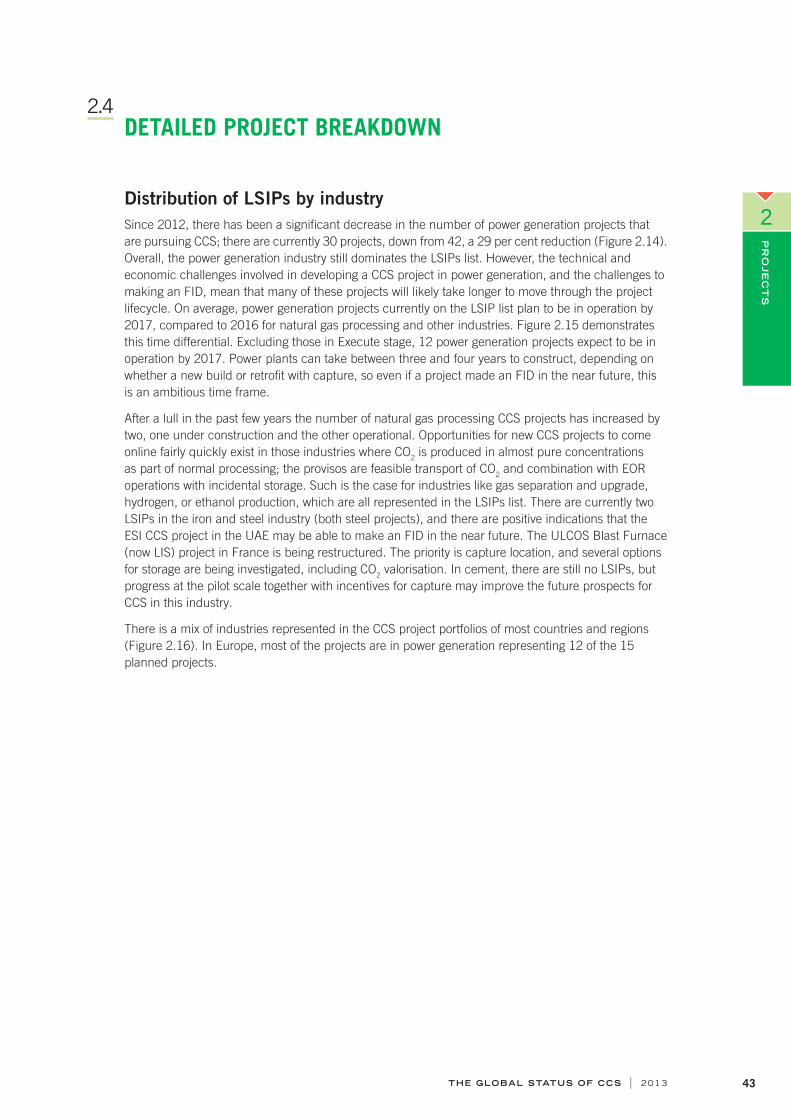
THE GLOBAL STATUS OF CCS | 2013 43
PR
OJE
CT
S
2
2.4 DETAILED PROJECT BREAKDOWN
Distribution of LSIPs by industrySince 2012, there has been a signifi cant decrease in the number of power generation projects that are pursuing CCS; there are currently 30 projects, down from 42, a 29 per cent reduction (Figure 2.14). Overall, the power generation industry still dominates the LSIPs list. However, the technical and economic challenges involved in developing a CCS project in power generation, and the challenges to making an FID, mean that many of these projects will likely take longer to move through the project lifecycle. On average, power generation projects currently on the LSIP list plan to be in operation by 2017, compared to 2016 for natural gas processing and other industries. Figure 2.15 demonstrates this time differential. Excluding those in Execute stage, 12 power generation projects expect to be in operation by 2017. Power plants can take between three and four years to construct, depending on whether a new build or retrofi t with capture, so even if a project made an FID in the near future, this is an ambitious time frame.
After a lull in the past few years the number of natural gas processing CCS projects has increased by two, one under construction and the other operational. Opportunities for new CCS projects to come online fairly quickly exist in those industries where CO2 is produced in almost pure concentrations as part of normal processing; the provisos are feasible transport of CO2 and combination with EOR operations with incidental storage. Such is the case for industries like gas separation and upgrade, hydrogen, or ethanol production, which are all represented in the LSIPs list. There are currently two LSIPs in the iron and steel industry (both steel projects), and there are positive indications that the ESI CCS project in the UAE may be able to make an FID in the near future. The ULCOS Blast Furnace (now LIS) project in France is being restructured. The priority is capture location, and several options for storage are being investigated, including CO2 valorisation. In cement, there are still no LSIPs, but progress at the pilot scale together with incentives for capture may improve the future prospects for CCS in this industry.
There is a mix of industries represented in the CCS project portfolios of most countries and regions (Figure 2.16). In Europe, most of the projects are in power generation representing 12 of the 15 planned projects.
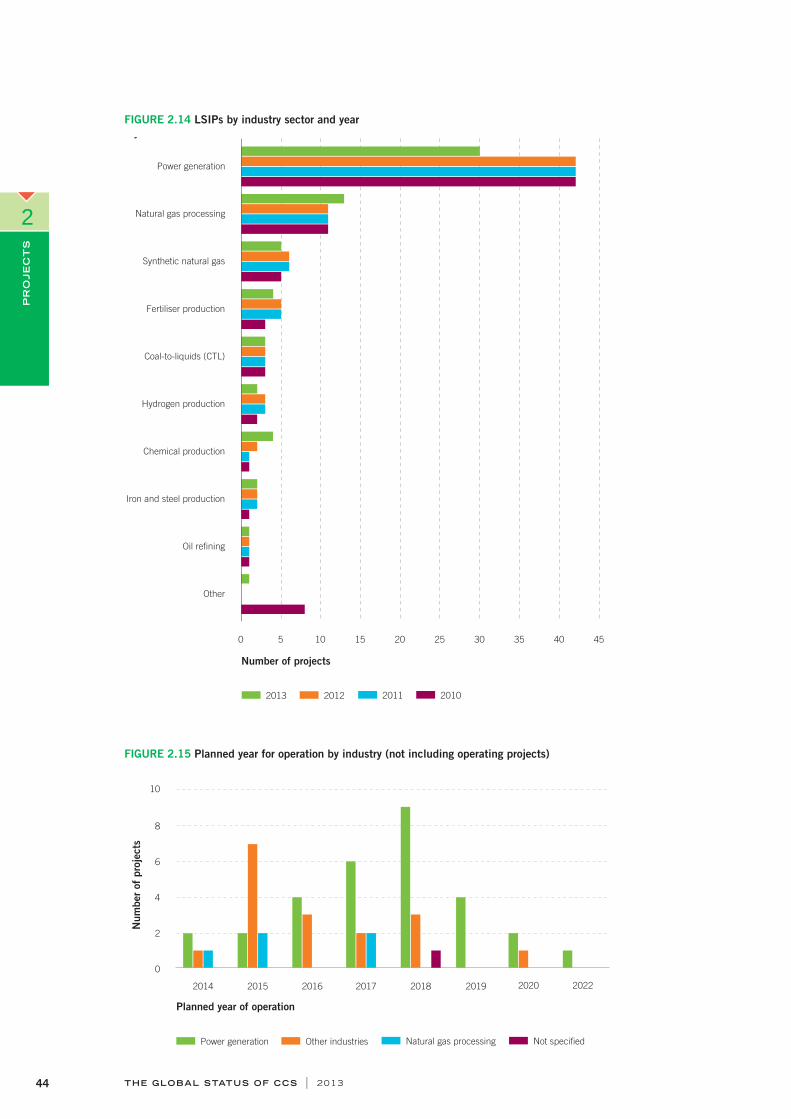
THE GLOBAL STATUS OF CCS | 201344
PR
OJE
CT
S
2
FIGURE 2.14 LSIPs by industry sector and yeary
Oil refining
Iron and steel production
Chemical production
Hydrogen production
Coal-to-liquids (CTL)
Fertiliser production
Synthetic natural gas
Natural gas processing
Power generation
0 5 10 15 20 25 30 35 40 45
Number of projects
2013 2012 2011 2010
Other
FIGURE 2.15 Planned year for operation by industry (not including operating projects)
0
2
4
6
8
10
2014 2015 2016 2017 2018 20202019 2022
Num
ber
of
pro
jects
Planned year of operation
Power generation Other industries Natural gas processing Not specified

THE GLOBAL STATUS OF CCS | 2013 45
PR
OJE
CT
S
2
FIGURE 2.16 LSIPs by industry type and region
Number of projects
Power generation Other industries
Natural gas processing Not specified
0 5 10 15 20
Africa
South America
Other Asia
Middle East
Australia
Canada
China
Europe
United States
Figure 2.17 shows how the total mass of CO2 that could be captured by the LSIPs has changed over the past four years. Changes have not been uniform across sectors with industrial applications and natural gas processing remaining relatively steady in comparison to the decreases seen in power generation.
For power generation the biggest decrease in mass of capture capacity has occurred at the Evaluate and Defi ne stages (Figure 2.17), due in part to a lack of funding incentives and other support. In addition, much more information is understood at the Defi ne stage, when the outcomes of pre-FEED studies become available and decisions are made about whether or not to continue with costly FEED studies. As more cost information becomes known, project proponents can better evaluate feasibility and make more informed decisions about the viability of the project.

THE GLOBAL STATUS OF CCS | 201346
PR
OJE
CT
S
2
FIGURE 2.17 Mass of CO2 captured by industry sector and year
0 20 40 60 80 100
2010
2011
2012
2013
2010
2011
2012
2013
2010
2011
2012
2013 O
ther
ind
ust
ries
Natu
ral gas
pro
cess
ing
Pow
er
gen
era
tion
Mass of CO2 (Mtpa)
Identify Evaluate Define Execute Operate
Distribution of LSIPs by capture technology
Many industries use a single, predominant carbon capture technology. The gasifi cation of hydrocarbons – such as for hydrogen production, coal-to-liquids (CTL), coal gasifi cation, and synthetic natural gas production – all make products that are normally subsequently combusted as a fuel. This is defi ned as pre-combustion (gasifi cation). In industrial separation, which is used to defi ne iron and steel, fertiliser and other chemical production, the products are not principally used for combustion.
There are very different technologies for capturing CO2 in power generation. The two principal types of capture are post-combustion, for conventional power plants, and pre-combustion, in the case of IGCC projects. Post-combustion is still the most widely chosen capture technology, representing 43 per cent of all power projects in the 2013 LSIP list, while the share of pre-combustion capture (gasifi cation) represents 37 per cent of all power generation LSIPs. The remaining capture technology for power generation is oxyfuel combustion – fi ve LSIPs, down from six in 2012 (Figure 2.18).
The selection of capture technology for power generation depends on several considerations specifi c to each power generation project, such as percentage capture, cost, plant location, water requirements and availability, and plant characteristics such as effi ciency, capacity, space and confi guration of existing plant, or whether it is a new build.
Figure 2.19 shows the breakdown of capture type across countries and regions. In the US, four out of the six power projects use pre-combustion (gasifi cation), one uses post-combustion and one oxyfuel combustion. China has three out of the six power projects using pre-combustion (gasifi cation), two oxyfuel combustion, and one post-combustion. However, post-combustion is more common in Europe, where six out of the 12 projects use this type of capture technology. Canada has two post-combustion projects, including Boundary Dam, which is expected to commence operation in 2014.

THE GLOBAL STATUS OF CCS | 2013 47
PR
OJE
CT
S
2
FIGURE 2.18 LSIPs by capture type and industry
Ind
ust
rial
ap
plic
ation
s
Pow
er
gen
era
tion
0 5 10 15 20 25 30 35 40 45
2010
2011
2012
2013
2010
2011
2012
2013
Number of projects
Pre-combustion (gasification) Pre-combustion (natural gas processing) Post-combustion
Oxy-fuel combustion Industrial separation Various/Not decided
FIGURE 2.19 LSIPs by capture type and region
Number of projects
Pre-combustion (gasification) Pre-combustion (natural gas processing)
Post-combustion Oxy-fuel combustion
Industrial separation Various/Not decided
Africa
South America
Other Asia
Middle East
Australia
Canada
China
Europe
United States
0 5 10 15 20
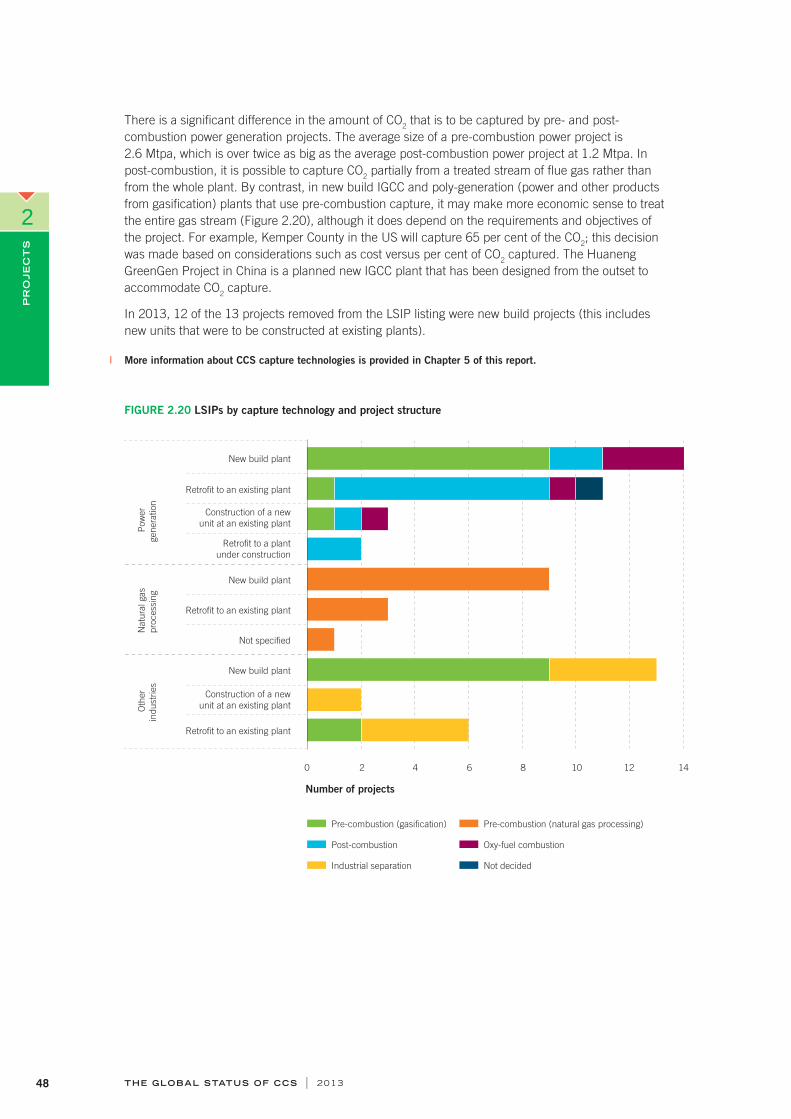
THE GLOBAL STATUS OF CCS | 201348
PR
OJE
CT
S
2
There is a signifi cant difference in the amount of CO2 that is to be captured by pre- and post-combustion power generation projects. The average size of a pre-combustion power project is 2.6 Mtpa, which is over twice as big as the average post-combustion power project at 1.2 Mtpa. In post-combustion, it is possible to capture CO2 partially from a treated stream of fl ue gas rather than from the whole plant. By contrast, in new build IGCC and poly-generation (power and other products from gasifi cation) plants that use pre-combustion capture, it may make more economic sense to treat the entire gas stream (Figure 2.20), although it does depend on the requirements and objectives of the project. For example, Kemper County in the US will capture 65 per cent of the CO2; this decision was made based on considerations such as cost versus per cent of CO2 captured. The Huaneng GreenGen Project in China is a planned new IGCC plant that has been designed from the outset to accommodate CO2 capture.
In 2013, 12 of the 13 projects removed from the LSIP listing were new build projects (this includes new units that were to be constructed at existing plants).
I More information about CCS capture technologies is provided in Chapter 5 of this report.
FIGURE 2.20 LSIPs by capture technology and project structure
Retrofit to an existing plant
Pre-combustion (gasification) Pre-combustion (natural gas processing)
Post-combustion Oxy-fuel combustion
Industrial separation Not decided
0 2 4 6 8 10 12 14
Construction of a new
unit at an existing plant
New build plant
Not specified
Retrofit to an existing plant
New build plant
Retrofit to a plant
under construction
Construction of a new
unit at an existing plant
Retrofit to an existing plant
Oth
er
indust
ries
Natu
ral gas
pro
cess
ing
Pow
er
genera
tion
Number of projects
New build plant

THE GLOBAL STATUS OF CCS | 2013 49
PR
OJE
CT
S
2
Distribution of LSIPs by transport typePipelines continue to be the primary method chosen for the transport of the high quantities of CO2 associated with CCS. Pipeline transport has been identifi ed in 94 per cent of all LSIPs in 2013. Eighty per cent of CO2 pipelines are entirely onshore, 20 per cent are onshore-to-offshore pipelines. Offshore pipelines are mostly used or considered in Europe; one is being planned in Australia (CarbonNet).
Three projects have indicated that transport will occur by ship, down by one since 2012. Two of the projects planning to ship the CO2 are Korea–CCS 1 and Korea–CCS 2. The third is the Dongguan Taiyangzhou IGCC with CCS Project in China, which changed its transport plans from pipeline to shipping in 2013. Eemshaven CCS in The Netherlands and Sargas in Malta planned to use shipping, but they have been removed from the LSIP list. Two projects, Sleipner in Norway and Petrobras Lula in Brazil, do not use pipelines or shipping but directly inject the CO2 into the reservoir from an offshore platform.
I More information about the transport of CO2 is provided in Chapter 6 of this report.
Distribution of LSIPs by storage typeIn terms of mass of CO2 potentially stored each year, the US has more than double that of any other region, with most projects pursuing CO2–EOR for storage (Figure 2.21). The total mass of CO2 potentially stored by all projects in the US is 72 Mtpa, representing 48 per cent of the potential amount of all LSIPs (the US has 31 per cent of LSIPs). This is partly because the average EOR project injects larger quantities of CO2 than projects that use dedicated geologic storage (when the sole objective is the permanent storage of CO2). The average size of an EOR project is about 2.2 Mtpa compared to 1.7 Mtpa for projects using deep saline formations.
The type of storage selected by those projects removed from the LSIP listing was fairly evenly split: six planned to use EOR, and seven dedicated geologic storage. However, the fi nal two projects in Europe pursuing EOR as a primary storage type have been put on hold; all remaining projects have now selected dedicated geologic storage as the primary storage type. To date, about 20 Mt of CO2 has effectively been stored by LSIPs injecting CO2 into dedicated geological formations (14 Mt by Sleipner, 1.9 Mt by Snøhvit in Norway, and 3.8 Mt by In Salah in Algeria).
In China, four projects are pursuing dedicated geologic storage as the primary storage type, double the number reported in 2012.
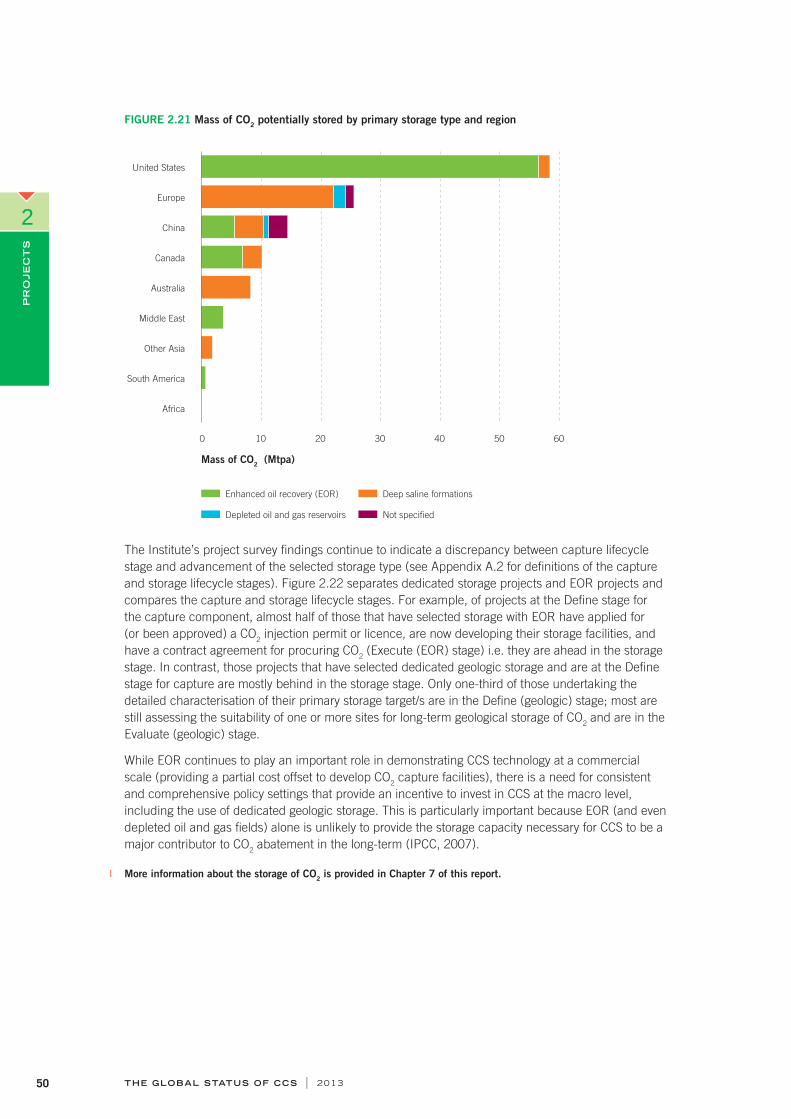
THE GLOBAL STATUS OF CCS | 201350
PR
OJE
CT
S
2
FIGURE 2.21 Mass of CO2 potentially stored by primary storage type and region
0 10 20 30 40 50 60
Africa
South America
Other Asia
Middle East
Australia
Canada
China
Europe
United States
Mass of CO2 (Mtpa)
Enhanced oil recovery (EOR) Deep saline formations
Depleted oil and gas reservoirs Not specified
The Institute’s project survey fi ndings continue to indicate a discrepancy between capture lifecycle stage and advancement of the selected storage type (see Appendix A.2 for defi nitions of the capture and storage lifecycle stages). Figure 2.22 separates dedicated storage projects and EOR projects and compares the capture and storage lifecycle stages. For example, of projects at the Defi ne stage for the capture component, almost half of those that have selected storage with EOR have applied for (or been approved) a CO2 injection permit or licence, are now developing their storage facilities, and have a contract agreement for procuring CO2 (Execute (EOR) stage) i.e. they are ahead in the storage stage. In contrast, those projects that have selected dedicated geologic storage and are at the Defi ne stage for capture are mostly behind in the storage stage. Only one-third of those undertaking the detailed characterisation of their primary storage target/s are in the Defi ne (geologic) stage; most are still assessing the suitability of one or more sites for long-term geological storage of CO2 and are in the Evaluate (geologic) stage.
While EOR continues to play an important role in demonstrating CCS technology at a commercial scale (providing a partial cost offset to develop CO2 capture facilities), there is a need for consistent and comprehensive policy settings that provide an incentive to invest in CCS at the macro level, including the use of dedicated geologic storage. This is particularly important because EOR (and even depleted oil and gas fi elds) alone is unlikely to provide the storage capacity necessary for CCS to be a major contributor to CO2 abatement in the long-term (IPCC, 2007).
I More information about the storage of CO2 is provided in Chapter 7 of this report.

THE GLOBAL STATUS OF CCS | 2013 51
PR
OJE
CT
S
2
FIGURE 2.22 Comparison of capture and storage progress
0 2 4 6 8 10 12
Identify
Evaluate
Define
Execute
Captu
re lif
ecyc
le s
tage
Projects with enhanced oil recovery (EOR)
Projects with storage in deep saline formations or depleted oil and gas fields
Number of projects
0 2 4 6 8 10 12
Identify
Evaluate
Define
Execute
Captu
re lif
ecyc
le s
tage
Number of projects
Identify (geological) Evaluate (geological)
Define (geological) Execute (geological)
Identify (EOR) Evaluate (EOR)
Define (EOR) Execute (EOR)
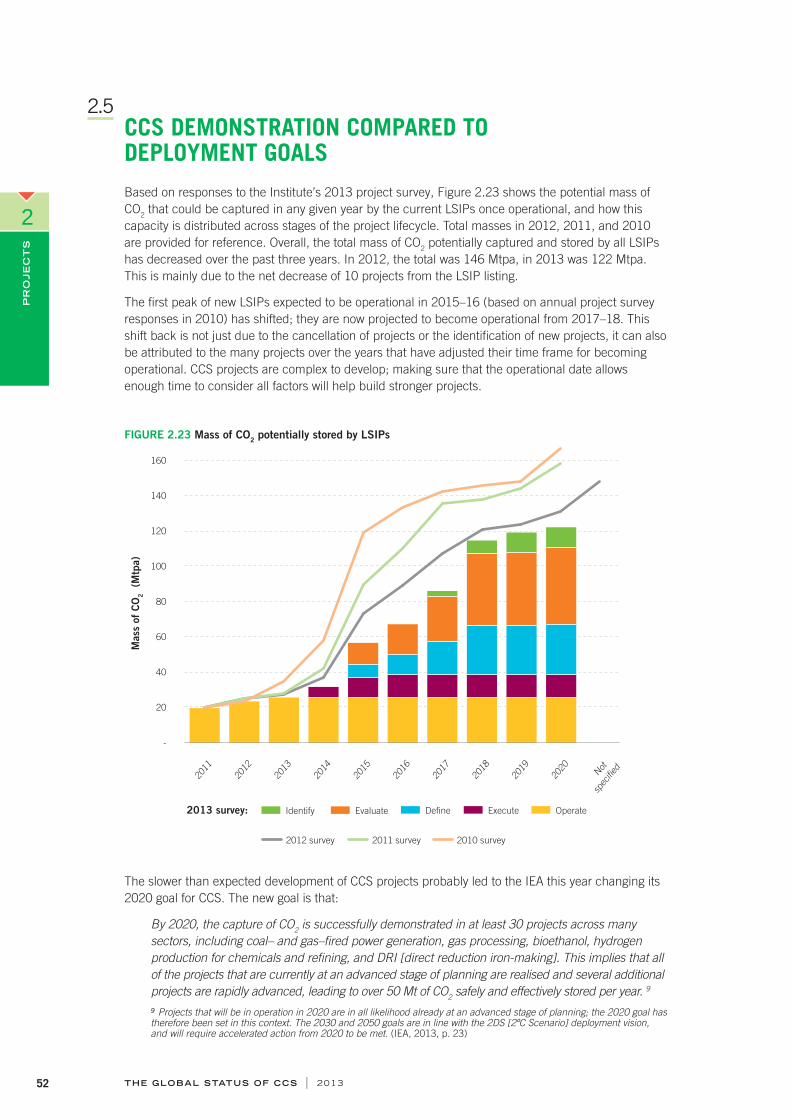
THE GLOBAL STATUS OF CCS | 201352
PR
OJE
CT
S
2
2.5 CCS DEMONSTRATION COMPARED TO DEPLOYMENT GOALSBased on responses to the Institute’s 2013 project survey, Figure 2.23 shows the potential mass of CO2 that could be captured in any given year by the current LSIPs once operational, and how this capacity is distributed across stages of the project lifecycle. Total masses in 2012, 2011, and 2010 are provided for reference. Overall, the total mass of CO2 potentially captured and stored by all LSIPs has decreased over the past three years. In 2012, the total was 146 Mtpa, in 2013 was 122 Mtpa. This is mainly due to the net decrease of 10 projects from the LSIP listing.
The fi rst peak of new LSIPs expected to be operational in 2015–16 (based on annual project survey responses in 2010) has shifted; they are now projected to become operational from 2017–18. This shift back is not just due to the cancellation of projects or the identifi cation of new projects, it can also be attributed to the many projects over the years that have adjusted their time frame for becoming operational. CCS projects are complex to develop; making sure that the operational date allows enough time to consider all factors will help build stronger projects.
FIGURE 2.23 Mass of CO2 potentially stored by LSIPs
2014
-
20
40
60
80
100
120
140
160
2011
2012
2013
2015
2016
2017
2018
2019
2020
Not
spec
ified
Mass
of
CO
2
(Mtp
a)
2013 survey: Identify Evaluate Define Execute Operate
2012 survey 2011 survey 2010 survey
The slower than expected development of CCS projects probably led to the IEA this year changing its 2020 goal for CCS. The new goal is that:
By 2020, the capture of CO2 is successfully demonstrated in at least 30 projects across many sectors, including coal– and gas–fi red power generation, gas processing, bioethanol, hydrogen production for chemicals and refi ning, and DRI [direct reduction iron-making]. This implies that all of the projects that are currently at an advanced stage of planning are realised and several additional projects are rapidly advanced, leading to over 50 Mt of CO2 safely and effectively stored per year. 9 9 Projects that will be in operation in 2020 are in all likelihood already at an advanced stage of planning; the 2020 goal has therefore been set in this context. The 2030 and 2050 goals are in line with the 2DS [2ºC Scenario] deployment vision, and will require accelerated action from 2020 to be met. (IEA, 2013, p. 23)

THE GLOBAL STATUS OF CCS | 2013 53
PR
OJE
CT
S
2
While the new 2020 goal is more achievable, it is important to note that the 2030 and 2050 goals remain the same. A massive ramp-up of CCS projects will be needed for these longer term goals to be met. The focus must remain on demonstration projects that will bring down the cost of CCS and build up public confi dence in CCS. On a portfolio basis, the current list of LSIPs covers all storage types and most industries, with the exception of cement (Table 2.2). As most future CCS deployment needs to occur in developing countries if climate change mitigation goals are to be met, these countries need to remain a focus (see Box 2.2).
TABLE 2.2 Portfolio distribution of LSIPs
THE
AMER
ICAS
EURO
PE
ASIA
AUST
RALI
A
MID
DLE
EAST
AN
D AF
RICA
SUB-
TOTA
L
CAPT
URE
Pow
er
Pre-combustion (gasifi cation) 4 4 3 11
Post-combustion 3 6 2 1 1 13
Oxyfuel combustion 1 2 2 5
Not decided 1 1
Oth
er
Natural gas processing 7 2 1 1 2 13
Iron and steel production 1 1 2
Cement production 0
Other industries 13 5 1 19
Not decided 1 1
TRAN
SPOR
T Onshore to onshore pipeline 27 3 11 3 4 48
Onshore to offshore pipeline 11 1 12
Ship/tanker 3 3
Direct injection 1 1 2
STOR
AGE
Geolo
gic
Onshore deep saline formations 4 3 3 3 1 14
Offshore deep saline formations 9 2 1 12
Onshore depleted oil and gas reservoirs 0
Offshore depleted oil and gas reservoirs 2 1 3
Oth
er
Enhanced oil recovery 24 6 3 33
Enhanced gas recovery 0
Not specifi ed 1 2 3
KEY: ≥ 10 projects 3–9 projects 1–2 projects No projects

THE GLOBAL STATUS OF CCS | 201354
PR
OJE
CT
S
2
BOX 2.2
CCS IN DEVELOPING COUNTRIES – PROJECTS
Developing countries making their contribution to CCSThe IEA estimates that 70 per cent of CCS deployment will need to happen in non-OECD countries by 2050 to achieve the 2°C global emission scenario (IEA, 2012). It makes sense for developing countries dominated by fossil fuel–based emissions to start laying the groundwork for CCS now. Many of the essential enabling and pre-investment activities are country specifi c and can take years to realise. It is important to start these activities early so that a country can benefi t from CCS in the years ahead.
Encouragingly, some developing countries are preparing the groundwork for CCS by, for example:
developing pilot–scale, or even demonstration–scale, projects to start the process of ‘learning by doing’ and contributing to innovation developments
undertaking geologic storage assessments, focusing on country-level, then basin-level and eventually site-specifi c characterisation
analysing existing legal and regulatory frameworks to understand the issues as they pertain to CCS and designing new frameworks for the future
educating current and future CCS stakeholders, either to facilitate understanding and acceptance of the technology or up-skill the workforce.
The ‘CCS in developing countries’ case studies throughout this report provide examples and explore various aspects of how developing countries are laying the groundwork for, and therefore contributing to the development and deployment of, CCS.
Projects in developing countriesThere are 14 LSIPs in developing countries: 12 are in the planning stages in China; and two are operational in Brazil and in Algeria. It is clear that China is becoming a signifi cant CCS player. Brazil is also serious about CCS, with its new Petrobras Lula CO2–EOR project already injecting CO2 below 2,100 metres (m) of water, making it the deepest CO2 injection well in operation.
While LSIPs are essential to demonstrate CCS at a large scale, the importance of smaller, notable projects should not be underestimated. It is often more feasible for a country to start with a pilot project and scale up. The Institute is tracking some 'notable projects' between pilot and small demonstration scale that are contributing to the global understanding of CCS technology and that will help drive innovations in, and improvements to, its implementation. Of these notable projects, eight are in China and one is in Brazil – mirroring LSIP developments.

THE GLOBAL STATUS OF CCS | 2013 55
PR
OJE
CT
S
2
2.6 THE POTENTIAL OF NOTABLE PROJECTS In 2013, the Institute developed a survey for notable pilot and demonstration projects that did not meet the strict LSIP defi nition. These tended to be projects that were either not of a suffi cient scale or not fully integrated, but had the potential to provide signifi cant lessons directly relevant to LSIPs. The Notable Projects list is non-exhaustive and will continue to be updated as new information becomes available.
Projects at these smaller scales are likely to become increasingly important in an environment in which the level of capital funds needed for LSIPs is diffi cult to secure. In many countries, these demonstration projects provide an important platform for stakeholders to test legislation, build capacity, and test and optimise technologies. Consistent with its number of LSIPs, China is highly represented in the Notable Projects list, as shown in Figure 2.24. Importantly, this chart shows that Japan has several Notable Projects. While there are currently no LSIPs located in Japan it is signifi cant to note that Japan is involved in several LSIPs, including as a project partner or technology provider.
Figure 2.25 shows the breakdown of the Notable Projects in terms project focus which can be storage or capture only as well as integrated CCS chains. Twelve of the 19 Notable Projects that have a capture component are in power generation. Section 5.3 of this report considers large–scale CCS test facilities in power generation, and includes many of the Notable Projects. These capture projects are providing valuable information to assist in the design and development of commercial–scale plants. In addition, eight out of the 16 Notable Projects that have a storage component are investigating deep saline formation storage. Section 7.5 of this report highlights four examples of storage pilot and demonstration projects and programs that demonstrate how these kinds of injection programs have contributed enormously to advancing the understanding of the behaviour of CO2 in the subsurface.
As a case study, Box 2.3 details the Shanghai Shidongkou project, which is a notable project in China that captures and utilises 120 ktpa of CO2.
FIGURE 2.24 Notable Projects by stage and region
0 1 2 3 4 5 6 7 8
Spain
Germany
France
Canada
Brazil
Australia
Japan
United States
China
Responding projects
Identify Evaluate Define Execute Operate Closure
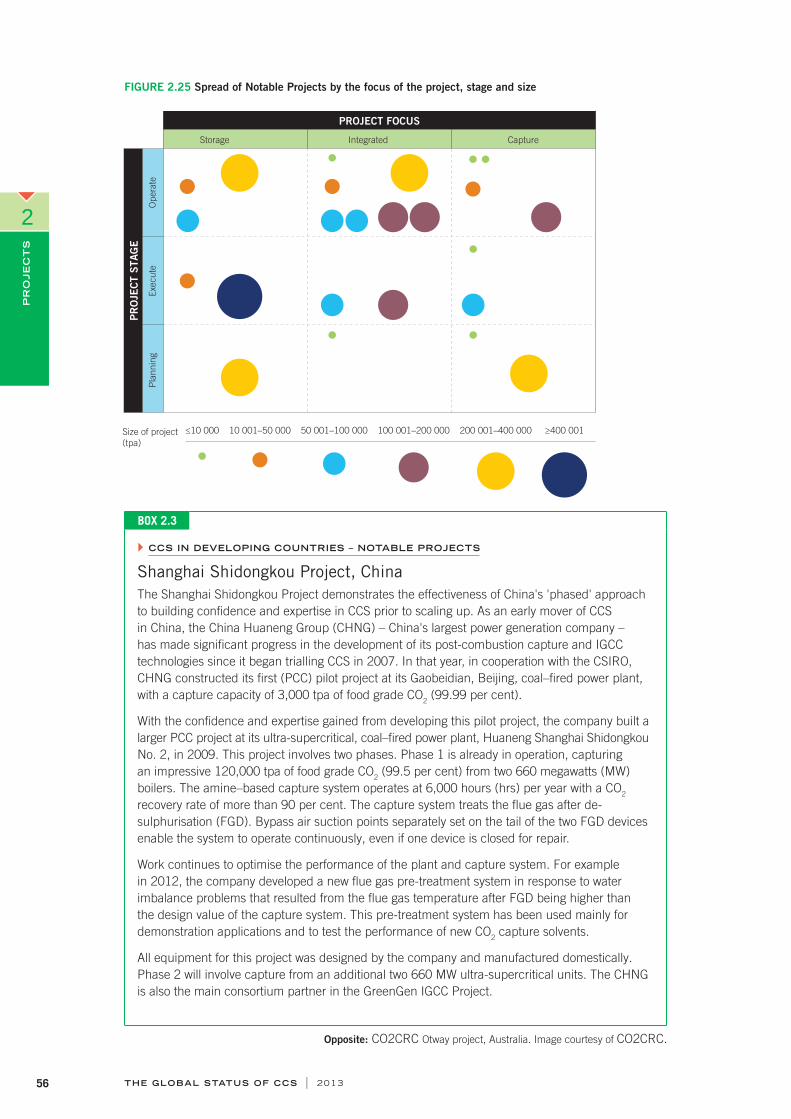
THE GLOBAL STATUS OF CCS | 201356
PR
OJE
CT
S
2
FIGURE 2.25 Spread of Notable Projects by the focus of the project, stage and size
PROJECT FOCUSP
RO
JEC
T S
TA
GE
Op
era
teE
xecu
te
Pla
nn
ing
Size of project
(tpa)
Storage Integrated Capture
≤10 000 10 001–50 000 100 001–200 00050 001–100 000 200 001–400 000 ≥400 001
BOX 2.3
CCS IN DEVELOPING COUNTRIES – NOTABLE PROJECTS
Shanghai Shidongkou Project, ChinaThe Shanghai Shidongkou Project demonstrates the effectiveness of China's 'phased' approach to building confi dence and expertise in CCS prior to scaling up. As an early mover of CCS in China, the China Huaneng Group (CHNG) – China's largest power generation company – has made signifi cant progress in the development of its post-combustion capture and IGCC technologies since it began trialling CCS in 2007. In that year, in cooperation with the CSIRO, CHNG constructed its fi rst (PCC) pilot project at its Gaobeidian, Beijing, coal–fi red power plant, with a capture capacity of 3,000 tpa of food grade CO2 (99.99 per cent).
With the confi dence and expertise gained from developing this pilot project, the company built a larger PCC project at its ultra-supercritical, coal–fi red power plant, Huaneng Shanghai Shidongkou No. 2, in 2009. This project involves two phases. Phase 1 is already in operation, capturing an impressive 120,000 tpa of food grade CO2 (99.5 per cent) from two 660 megawatts (MW) boilers. The amine–based capture system operates at 6,000 hours (hrs) per year with a CO2 recovery rate of more than 90 per cent. The capture system treats the fl ue gas after de-sulphurisation (FGD). Bypass air suction points separately set on the tail of the two FGD devices enable the system to operate continuously, even if one device is closed for repair.
Work continues to optimise the performance of the plant and capture system. For example in 2012, the company developed a new fl ue gas pre-treatment system in response to water imbalance problems that resulted from the fl ue gas temperature after FGD being higher than the design value of the capture system. This pre-treatment system has been used mainly for demonstration applications and to test the performance of new CO2 capture solvents.
All equipment for this project was designed by the company and manufactured domestically. Phase 2 will involve capture from an additional two 660 MW ultra-supercritical units. The CHNG is also the main consortium partner in the GreenGen IGCC Project.
Opposite: CO2CRC Otway project, Australia. Image courtesy of CO2CRC.
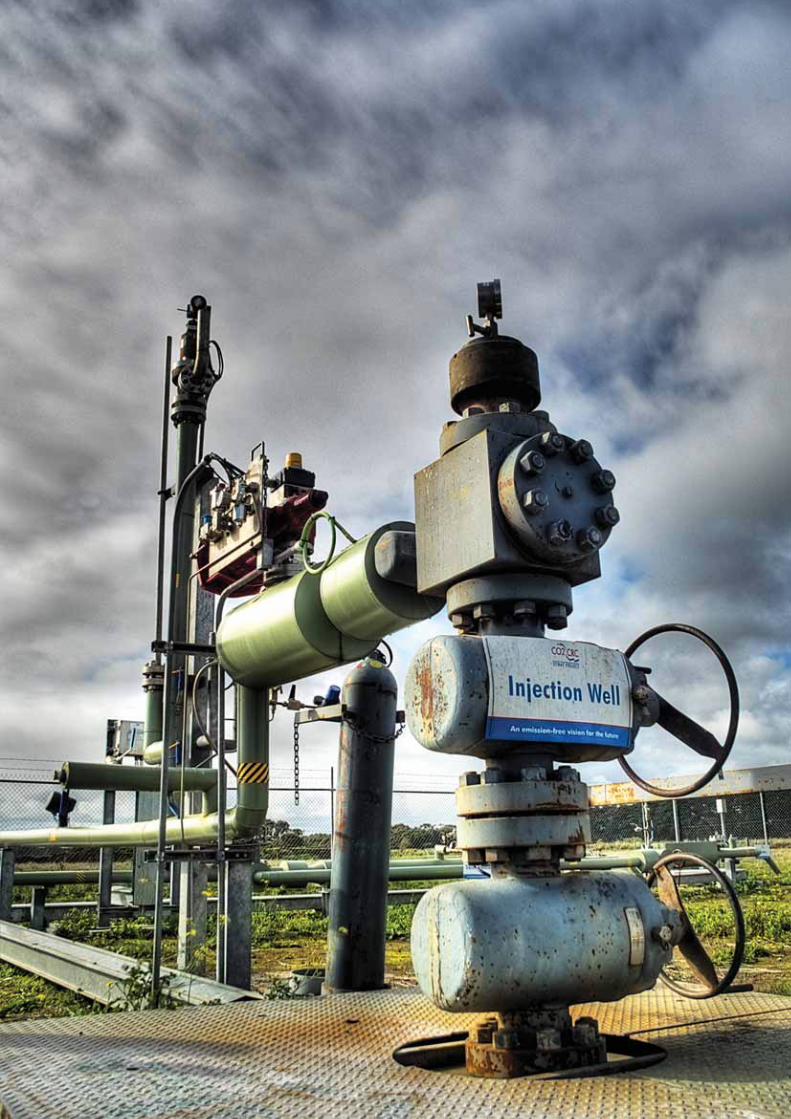
THE GLOBAL STATUS OF CCS | 2013 57
PR
OJE
CT
S
2
THE GLOBAL STATUS OF CCS | 201358
3
Business objectives
and project drivers
Project scope and
Project delivery plan
Bridging the
MAKING THE BUSINESS CASE
BUSINESS CASE
3.1 Overview .......................................................................................................................................................59
3.2 Product and revenue diversification ........................................................................................60
3.3 Improved financing prospects through strategic alliances ......................................63
3.4 Role and extent of government support ................................................................................66
3.5 Recommendations and outlook ...................................................................................................69

THE GLOBAL STATUS OF CCS | 2013 59
KEY FINDINGS
3.1 OVERVIEWThe business case provides the information and analysis necessary to make an FID on a project, explaining, in particular, how it aligns with organisational objectives. In addition to achieving a target return, other objectives built into an LSIP business case may include:
technology development
commercialisation opportunities (e.g. technology licensing or diversifi cation)
market leadership
compliance with expected regulatory changes
protecting the value of an existing portfolio.
These different objectives translate into different development criteria and fi nancial risk profi les for CCS projects. For example, projects that focus on commercialisation opportunities will be more strongly return driven, while projects that focus on technology development may accept a return that is lower than the benchmark, or even a neutral or negative net present value (NPV), if the technology objectives are achieved. This divergence of objectives is apparent across the CCS spectrum. For instance, the ROAD project in The Netherlands is focused on technology demonstration and, ultimately, protection of portfolio value, so only intends to be operational for a relatively short period. In contrast, the Texas Clean Energy Project (TCEP) is focused on delivering a market–based return over a typical infrastructure time frame of 20–30 years.
In all cases, the challenge of integrating the additional elements of the CCS chain makes the development of a business case for a CCS project more complex and challenging than for conventional infrastructure assets in established industries.
Business cases for CCS projects may pursue different objectives, from technology demonstration to commercialisation opportunities and protecting portfolio value. However, all share similar challenges regarding the management of additional costs, increased fi nancial risks, and complex fi nancing plans.
The slower than anticipated progress of CCS projects into construction during the past three years refl ects the diffi culty for project proponents to address the fi nancial and commercial challenges inherent in CCS integration. This is expected to continue in the coming year.
Major factors contributing to a project’s fi nancial and commercial deliverability include: the diversifi cation of products and revenues through an innovative approach to technology integration; strategic alliances and contracting decisions that widen fi nancing prospects (notably by granting access to export credit agency funding); and access to targeted support provided as part of a consistent, results oriented government strategy.

THE GLOBAL STATUS OF CCS | 201360
BU
SIN
ES
S C
AS
E
3
These integration challenges have a particular impact on the following aspects of the business case:
costs and revenues: integrating CCS technologies in a commercial–scale project adds signifi cant costs to the capital expenditure at the start of the project and the operating expenditure throughout its lifetime. Additional costs are often not counterbalanced by increased or additional revenues, as most markets have either failed to put a price on CO2 emissions or set the price at levels insuffi cient to offset the additional costs of CCS.
fi nancial risk management: the atypical fi nancial risk profi le of a CCS project makes it diffi cult for project owners to adequately manage the risks on their own or share them with construction and maintenance contractors or technology providers.
private fi nancing: to reach fi nancial closure, CCS projects cannot rely exclusively on current government funding programs; they require private sector fi nance. To date, CCS projects have struggled to access commercial debt in a context of limited credit availability and tightened lending conditions (Rumble, 2012).
These hurdles constrain project proponents so they develop innovative technical, commercial, and fi nancial solutions to complete the business case for their CCS project. The diffi culty is demonstrated by the slow growth rate in large–scale CCS projects reaching an FID in recent years. Two projects achieved an FID in 2011–12 and two have made an FID since October 2012, the North West Sturgeon Refi nery CO2 Project in Canada and Uthmaniyah in Saudi Arabia. Some progress of projects into construction is expected in the coming year, as only fi ve projects at the most advanced stage of development planning (Defi ne) have been identifi ed as having developed prospective business case propositions that may enable them to reach an FID in 2013–14. See Chapter 2 for more detail on project developments.
The following sections highlight some of the key factors successful projects have in common and that may be replicated in other projects, including:
product and revenue diversifi cation obtained through an innovative approach to technology integration
fi nancing prospects (notably access to export credit agency funding) improved by strategic alliances and contracting decisions
access to targeted support provided as part of a consistent, results oriented government strategy.
3.2 PRODUCT AND REVENUE DIVERSIFICATIONThe signifi cant increase in capital and operating costs that comes from adding CCS technologies to power generation and other industrial processes can translate into higher cost outputs (e.g. electricity, synthetic natural gas, hydrogen, etc.) that cannot be viably sold at current market prices.
Proponents of CCS projects have limited means to fully bridge the resulting commercial gap. On the cost side, substantial technology cost reductions remain to be achieved through R&D and early demonstration projects (see Section 5.5 for more information on capture cost reduction opportunities). On the revenue side, current energy and climate policy settings in most countries do not provide suffi cient levels of compensation, such as a price on CO2 emissions that refl ects actual abatement costs. This is particularly problematic for CCS projects, which typically operate in highly competitive international markets (chemicals, oil refi ning, iron and steel) or highly regulated domestic and regional markets (electricity), where the proponents’ margins for negotiation are very low. As a result, the commercial gap continues to be a major barrier to the development of CCS projects around the world.
An important factor so far in the success of CCS projects in a high capture cost environment has been the ability to secure revenue from multiple sources. This has been refl ected in the Institute’s

THE GLOBAL STATUS OF CCS | 2013 61
BU
SIN
ES
S C
AS
E
3
annual project survey by the growing importance of planned utilisation of CO2 for EOR: in 2010, 44 per cent of all identifi ed LSIPs included the planned use of CO2 for EOR, either as a primary or secondary storage option, increasing to close to 60 per cent in 2013. Similarly, a growing number of surveyed projects are 'poly-generation' projects that integrate upstream or downstream processes with their primary industrial process, and seek to maximise the transformation and valorisation of their industrial waste products.
The following case studies (Boxes 3.1 and 3.2) demonstrate how two proponents of CCS projects in Canada and the US have successfully leveraged product diversifi cation to support their business cases.
BOX 3.1
An example of poly-generation at the Texas Clean Energy ProjectThe Texas Clean Energy Project (TCEP) combines industrial processes to diversify the project’s revenue sources while maximising value generation.
Summit Power's TCEP is a planned, coal–based IGCC facility in the US that will incorporate CCS technology to capture around 2.2 Mtpa of CO2. The project is in the fi nal stages of development planning, with an FID expected by the forth quarter of 2013.
TCEP’s major product streams will include:
electrical power: about 200 megawatts of electrical output (MWe) of the project's 400 MWe gross capacity will be sold under a long-term contract to CPS Energy, the municipal electric utility of San Antonio, Texas. An additional 100 MWe will be used onsite to power the CO2 compressor and the urea production facility. The remaining 100 MWe represents a combination of auxiliary load and reserve capacity.
CO2 for EOR: about 2.5 Mtpa of CO2 will be compressed onsite and delivered via a short (1 km) connecting pipeline into the existing Central Basin Pipeline owned and operated by Kinder Morgan Inc. Transport costs from the Kinder Morgan pipeline to the EOR site will be borne by the buyers of TCEP's CO2.
urea: the project will produce about 900,000 tpa of urea, which is widely used as a major feedstock for fertiliser and other chemical production. The entire output has been purchased under a 15–year contract.
These three products are projected to account for more than 90 per cent of TCEP's total revenues. The remaining 10 per cent will be obtained from the sale of minor products, including sulphuric acid, argon gas, inert non-leachable vitrifi ed slag (suitable for road building and cement production, among other uses), and, potentially, excess nitrogen and oxygen. All outputs from the project will be sold at market prices, in a large part due to the leveraging of government capital grants and other tax incentives awarded to the project.
The poly-generation aspect of TCEP results in the expected ability of the project to cover all its costs, including debt service, while achieving potential net rates of return high enough to attract equity investors.

THE GLOBAL STATUS OF CCS | 201362
BU
SIN
ES
S C
AS
E
3
Challenging traditional industry patterns at the North West Sturgeon Refinery CO2 Project The North West Sturgeon Refi nery CO2 Project (NWSR) in Alberta, Canada, achieved a positive FID in 2013. The NWSR example is both unconventional and instructive, in that the addition of CCS to the project is part of a revenue–enhancing system, rather than a substantial added cost that is diffi cult to compensate. Its success demonstrates how technology innovation and product diversifi cation at the project level can be leveraged to deliver a viable CCS business case.
The owner of the project, the North West Redwater Partnership (NWRP), challenged the traditional Canadian approach to upgrading, in which bitumen is partially upgraded to synthetic crude oil then sent to the US to be processed into fi nished fuel products, such as distillate. Instead, the NWSR concept is that of an integrated bitumen upgrader that can effi ciently operate on all of Alberta’s non-mined bitumen sources to produce a range of fi nished fuel products within a single facility. This will allow NWRP to capture the full price spread between heavy bitumen blend crude oil and high value fi nished products (Figure 3.1).
FIGURE 3.1 Commodity price differentials (2011–12)
132%
117%
100%
80%75%
62%
0%
20%
40%
60%
80%
100%
120%
140%
Diesel Brent WTI
(West Texas
Intermediate)
WCS
(Western
Canadian
Select)
Dilbit
(diluted
bitumen)
Bitumen
Perc
enta
ge o
f W
TI
Price spread captured by the NWSR project
Source: North West Redwater Partnership
To maximise value generation, NWRP decided to produce hydrogen at the site through gasifi cation using the waste residue bottoms from the upgrading process. The onsite production of hydrogen is advantageous because it avoids dependency on natural gas as a feedstock and co-produces a high-purity CO2 stream that can be captured at a lower cost and monetised in the local CO2–EOR market.
By approaching the upgrading/refi ning of bitumen from a different perspective, an interrelated number of benefi ts can be aligned that provide a superior economic and environmental result over conventional coking processes …(North West Redwater Partnership, 2013, p. iv.)
BOX 3.2

THE GLOBAL STATUS OF CCS | 2013 63
BU
SIN
ES
S C
AS
E
3
3.3 IMPROVED FINANCING PROSPECTS THROUGH STRATEGIC ALLIANCES As CCS moves toward commercial deployment, it is expected that increasing amounts of funding will be raised in the form of institutional equity and commercial bank debt. However, current demonstration projects generally require a customised and sophisticated fi nancing structure that may comprise a combination of government funding and private debt and equity, as well as export credit agency (ECA) and multilateral funding institution (MFI) fi nance. Raising fi nance is particularly diffi cult for projects with high capital costs and high CO2 capture costs (such as power generation projects) in the context of limited credit availability and tightened lending conditions following the global fi nancial crisis.
In the two cases where private sector fi nancing has been committed for commercial–scale CCS projects in the power sector (Kemper County in the US and Boundary Dam in Canada), the funds were secured via equity or debt contributions from key project sponsors. Such balance sheet fi nancing is inevitably limited by the risk appetite and ability of project sponsors to contribute a signifi cant proportion of their capital budgets to an activity that may not currently deliver a fi nancial return commensurate with the risks of project development.
Proponents of large–scale CCS projects have limited options to adequately manage the increased fi nancial risks, inherent in such projects, to raise the substantial funds required to close a project fi nancing plan. One option is the development and implementation of an ad hoc contracting strategy. Results from the Institute’s 2013 project survey highlight the use of owner-managed contracting, which occurs in a signifi cantly greater proportion than usually observed in utilities, where the tendency is for traditional, externally managed turnkey engineering, procurement, and construction (EPC) contracts (Figure 3.2). Typically, companies involved in the design, construction, and operation of CCS projects have some level of equity in the project, corresponding to their technological objectives and own risk appetite. However, external contracting options such as lump sum turnkey (LSTK) and design & construct/engineer & construct (D&C/E&C), where the risks pertaining to the cost and time of completion are typically passed to the contractor, are more prevalent in North America. In addition, their use overall increased slightly from 25 per cent in 2012 to 33 per cent in 2013. This indicates an increasing willingness for contractors to bear the project delivery risks and provide performance guarantees, and a maturing of the CCS sector. The existence of equity investment and performance guarantees from contractors is a particularly valuable argument when seeking debt fi nance from commercial lenders, and a decisive factor in the fi nancial closure of the current generation of CCS projects.
FIGURE 3.2 Contracting strategies by region and number of projects
The Americas Asia Pacific EMEA
Combination Design and construct
Lump sum turnkey (LSTK)
Proponent–managed engineer and construct
External engineer, procure, construct and manage (EPCM)

THE GLOBAL STATUS OF CCS | 201364
BU
SIN
ES
S C
AS
E
3
By leveraging contracting and other technology decisions, project proponents may be able to gain access to international fi nance providers such as MFIs and ECAs. Support from ECAs can help fi ll a large part of the fi nancing gap that results from limits on commercial bank funds available to individual projects. However, such funding often comes with terms and conditions that may outweigh the benefi ts. For example, to meet the eligibility requirements to secure direct debt from an ECA will usually depend on technology selection and project structuring decisions (usually sourcing of technology from the country of domicile of the ECA). Similarly, the concessional lending rates usually applicable to MFI loans, such as those provided by the Asian Development Bank (ADB) or the European Investment Bank (EIB), will come at the price of constraints regarding the location of the project that may not be acceptable to the project proponent.
The following case studies (Boxes 3.3 and 3.4) illustrate how some project proponents leveraged strategic contracting and technology decisions or equity participation to access additional debt from international fi nancial institutions, thus alleviating some of the fi nancing constraints typically faced by CCS demonstration projects.
BOX 3.3
TCEP adapts to a financially constrained worldFrom the outset, it was envisioned that Summit Power's Texas Clean Energy Project (TCEP) would be project fi nanced, rather than fi nanced on the utility's balance sheet. In 2008, due to economic considerations (economies of scale) and equipment constraints, TCEP's intended size was twice what it is now, with four rather than its current two 500 megawatt thermal (MWth) gasifi ers and two combustion turbines, rather than its current one. However, the size of the project and its fi nancing plan had to be revised in the aftermath of the global fi nancial crisis, when it was determined that the project would need to borrow from at least 20 banks to obtain the US$2 billion required to fi nance the project.
After TCEP was downsized to its current confi guration, the maximum debt it could incur while maintaining satisfactory debt service cover ratios was US$1.2–1.3 billion. It was expected that this amount would include funds from German and Korean ECAs to support the German and Korean content (including equipment and engineering studies). The remaining US$1 billion was to be raised in the form of project equity or debt convertible to equity and was expected to be obtained via a bank lending syndicate, with Royal Bank of Scotland (RBS) acting as the lead debt arranger and one of the lending banks. However, due to diffi culties completing the fi nancing plan for this early mover project in the more 'traditional way', Summit Power decided in mid-2012 to offer China's Sinopec Engineering Group (SEG) the lead EPC contractor role for the project's chemical block. This strategic technology decision substantially improved TCEP's fi nancing prospects; the China Export–Import Bank (Chexim) subsequently agreed to provide a larger amount of project debt in the form of a direct loan in support of SEG's participation as EPC contractor.
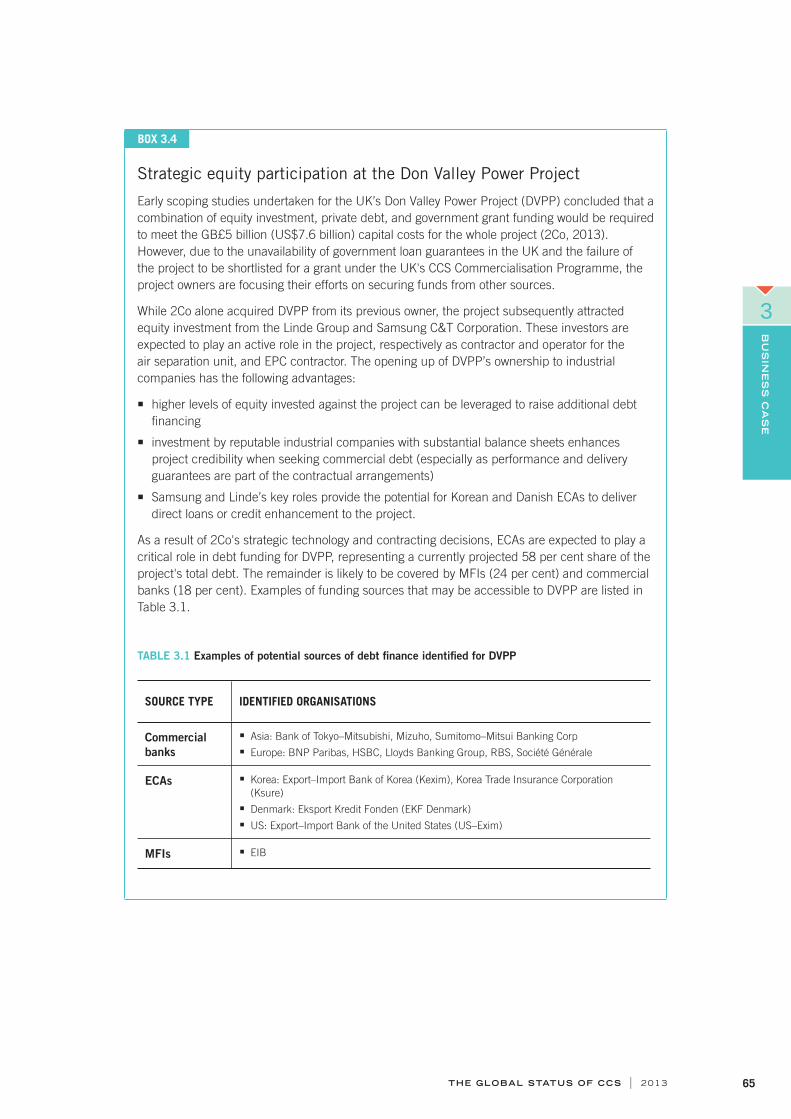
THE GLOBAL STATUS OF CCS | 2013 65
BU
SIN
ES
S C
AS
E
3
BOX 3.4
Strategic equity participation at the Don Valley Power Project
Early scoping studies undertaken for the UK’s Don Valley Power Project (DVPP) concluded that a combination of equity investment, private debt, and government grant funding would be required to meet the GB£5 billion (US$7.6 billion) capital costs for the whole project (2Co, 2013). However, due to the unavailability of government loan guarantees in the UK and the failure of the project to be shortlisted for a grant under the UK's CCS Commercialisation Programme, the project owners are focusing their efforts on securing funds from other sources.
While 2Co alone acquired DVPP from its previous owner, the project subsequently attracted equity investment from the Linde Group and Samsung C&T Corporation. These investors are expected to play an active role in the project, respectively as contractor and operator for the air separation unit, and EPC contractor. The opening up of DVPP’s ownership to industrial companies has the following advantages:
higher levels of equity invested against the project can be leveraged to raise additional debt fi nancing
investment by reputable industrial companies with substantial balance sheets enhances project credibility when seeking commercial debt (especially as performance and delivery guarantees are part of the contractual arrangements)
Samsung and Linde’s key roles provide the potential for Korean and Danish ECAs to deliver direct loans or credit enhancement to the project.
As a result of 2Co's strategic technology and contracting decisions, ECAs are expected to play a critical role in debt funding for DVPP, representing a currently projected 58 per cent share of the project's total debt. The remainder is likely to be covered by MFIs (24 per cent) and commercial banks (18 per cent). Examples of funding sources that may be accessible to DVPP are listed in Table 3.1.
TABLE 3.1 Examples of potential sources of debt fi nance identifi ed for DVPP
SOURCE TYPE IDENTIFIED ORGANISATIONS
Commercial banks
Asia: Bank of Tokyo–Mitsubishi, Mizuho, Sumitomo–Mitsui Banking Corp
Europe: BNP Paribas, HSBC, Lloyds Banking Group, RBS, Société Générale
ECAs Korea: Export–Import Bank of Korea (Kexim), Korea Trade Insurance Corporation (Ksure)
Denmark: Eksport Kredit Fonden (EKF Denmark)
US: Export–Import Bank of the United States (US–Exim)
MFIs EIB
THE GLOBAL STATUS OF CCS | 201366
BU
SIN
ES
S C
AS
E
3
3.4 ROLE AND EXTENT OF GOVERNMENT SUPPORT While prevailing industry and climate policy and regulatory settings may provide a structural incentive for companies to invest in early mover CCS projects, the ability to successfully deliver such projects will usually depend on specifi c initiatives that address the major barriers faced by CCS projects. This is particularly true in the absence of a CO2 price that refl ects abatement costs and is consistently applied across industries.
A wide range of targeted government actions exist that have proven effective in spurring investment into other early-stage technologies, and which may be used to enable the fi nancial and commercial deliverability of early mover CCS projects. Examples of options that have been successfully used to support the CCS projects currently under construction include: capital grants, performance–based operational subsidies, purchase agreements, public–private partnerships, ratepayer cost recovery agreements, investments in transport and storage infrastructure, or bearing some or all of the storage liability costs (Table 3.2).
The combination of support mechanisms retained may vary across jurisdictions, and will depend on issues such as portfolio objectives, prevailing trade laws, customary government involvement, or multilateral agreements in place. For example, in The Netherlands, the Dutch Government and the City of Rotterdam chose to lead the development of CO2 transport and storage infrastructure (RCI, 2013). This substantially reduced the associated costs individually borne by the fi rst projects to join the network while allowing extra capacity to accommodate project growth in the area (see Section 6.2 of this report for more information on transport and storage networks). In the case of TCEP in the US, a combination of capital grants and tax credits was leveraged to allow the viable sale of all of the plant’s products and by-products at normal market prices. In TCEP’s case, the swift processing of grant and tax credit applications was of tremendous help in supporting the project’s progression through the stages of development planning. Within eight months, Summit Power secured around US$760 million in federal government support (Table 3.3), which was later supplemented by operational tax credits provided by local and state governments.

THE GLOBAL STATUS OF CCS | 2013 67
BU
SIN
ES
S C
AS
E
3
TABLE 3.2 Regional, national, and subnational government support provided to CCS projects under construction
GOVERNMENT SUPPORT (REGIONAL, NATIONAL, SUBNATIONAL)
Cap
ital
gra
nts
Ope
rati
onal
sub
sidi
es
Car
bon
cred
its
Pur
chas
e ag
reem
ents
Pub
lic–p
riva
te P
artn
ersh
ips
Rat
e pa
yer
cost
rec
over
y
Loan
gua
rant
ees
Oth
er t
ax in
cent
ives
Tran
spor
t in
fras
truc
ture
Sto
rage
infr
astr
uctu
re
Sto
rage
liab
ility
cos
ts
INDUSTRY PRIMARY STORAGE OPTION
PROJECTS
Natural gas processing
Dedicated storage
Gorgon
EOR Uthmaniyah
Chemical production
Dedicated storage
Illinois ICCS
Fertiliser production
EOR ACTL–Agrium
Hydrogen production (oil refi ning)
EOR ACTL–NWSR
Dedicated storage
Quest
Power generation
EOR Boundary Dam Kemper County
TABLE 3.3 Extract of TCEP government support timetable
TIMELINE CLEAN COAL POWER INITIATIVE – ROUND 3 (CCPI-3) INVESTMENT TAX CREDIT (ITC)
Q3 2009 Application for cost reimbursement award lodged
Q4 2009 US$350 million award announced Application for special investment tax credit lodged
Q1 2010 Cooperative agreement signed
Q2 2010 US$313 million tax credit announced with joint approval from US DOE and Internal Revenue Service (IRS)
Q3 2010 Award increased to US$450 million

THE GLOBAL STATUS OF CCS | 201368
BU
SIN
ES
S C
AS
E
3
During interviews undertaken by the Institute in 2013, most LSIP proponents indicated their preference for an approach whereby projects that are to be supported by public funding are selected early on the basis of a small number of commercial and technical parameters. A close relationship is then established between selected projects and governments that can continue throughout the life of the project. Such an approach markedly improves the chance of the selected projects reaching a positive FID, as demonstrated by the success of the Quest and Boundary Dam projects in Canada. Throughout their development, these projects have benefi ted from the direct involvement of the respective provincial governments. Government involvement provides greater certainty to equity investors and lenders while allowing the governments access to the knowledge generated, thereby driving cost reductions for the next generation of projects. However, this approach may not align with some jurisdictions’ customs and objectives. In particular, a government’s close involvement in an LSIP implies that it bears some or all of the fi nancial and political consequences of the project’s delivery risk, which may not be acceptable to some governments.
In all cases, a government’s approach to direct and indirect support has a decisive impact on the commercial and fi nancial structuring of early mover CCS projects. As such, it is critical that national and subnational governments have a well-defi ned strategy for supporting CCS deployment that is not threatened by short political cycles and frequent changes in policy settings, regulatory requirements, and budget allocations. Such changes are particularly detrimental to the business case of CCS projects, compared to smaller scale CO2 abatement options that benefi t from shorter development lead times and the ability to be fi nanced in more traditional ways, using funds from fewer sources.
[US] DOE provided signifi cant early funding and other forms of support, and has continued to do so with patience over a prolonged period with many ups and downs and some setbacks and delays. DOE seems motivated to make clean coal a reality for various policy reasons and to believe that TCEP offered a model for doing so with greater chances of fi nancing and commercial success than some other alternatives.
(Summit Power, 2013, in press)
I More information on government support mechanisms is provided in Section 4.4 of this report.

THE GLOBAL STATUS OF CCS | 2013 69
BU
SIN
ES
S C
AS
E
3
3.5 RECOMMENDATIONS AND OUTLOOKThe slower than anticipated progression of large–scale CCS projects into construction, which has characterised the past three years, is expected to continue. Only fi ve projects are expected to be in a position to achieve an FID in the coming year.
The modest growth rate of the CCS industry refl ects persisting barriers faced by project proponents around the world. The margin for proponents to compensate for their project’s commercial gap is limited due to pricing constraints that affect many industries where CCS is needed. And raising the required fi nance remains a major hurdle in the global context of limited credit availability and tightened lending conditions. However, the increasing willingness of contractors and technology providers to provide performance guarantees in commercial–scale projects is a positive trend that shows an (albeit slowly) growing maturity of the CCS sector.
The business case for an LSIP may be greatly improved by a product diversifi cation or poly-generation approach that seeks to integrate CO2 capture and other high-value processes into an otherwise conventional plant. In addition, well-considered contracting strategies (including ownership sharing) may be leveraged to signifi cantly increase the amount of debt fi nance accessible to the project from commercial lenders and ECAs.
In the absence of a CO2 price that is consistently set at a level that refl ects actual abatement costs, the commercial and fi nancial deliverability of early mover CCS projects depends on governments devising and implementing initiatives that specifi cally address the major barriers to CCS. The combination of initiatives selected will vary depending on jurisdictional factors and must be driven by deliberate portfolio objectives. Due to the long development lead times of large–scale CCS projects, and the size and complexity of the fi nancing required, it is critical that the strategy retained remains consistent over a corresponding period of time.
THE GLOBAL STATUS OF CCS | 201370
POLICY, LEGAL AND REGULATORY DEVELOPMENTS
4
4.1 Overview .......................................................................................................................................................71
4.2 Developments in international policy agendas .................................................................72
4.3 CCS Policy Index....................................................................................................................................73
4.4 Status of government funding programs ...............................................................................75
4.5 Progressive approaches of CCS regulators ..........................................................................77
4.6 Survey findings on policy, legal and regulation ...............................................................82
4.7 Recommendations and outlook ...................................................................................................91

THE GLOBAL STATUS OF CCS | 2013 71
KEY FINDINGS
4.1 OVERVIEWThe challenge remains of how to make CCS economically feasible and ready for deployment so that it can contribute to national emission reduction targets and pledges. A number of policy pathways may assist. A key pathway involves government policy intervention in the form of carbon pricing, regulations, and/or the provision of subsidies to specifi c stages of the technology lifecycle, as well as options to exploit additional revenue streams to offset the costs of CCS.
An essential driver of CCS will ultimately be ‘learning by doing’, generated by robust demonstration results, strong investor expectations for targeted and deepening policy settings over the short- to medium-term, and increasing carbon prices over the longer term. This relies in part on robust in-country demonstration programs that provide for further technological breakthroughs, operational effi ciencies, and scope for third parties to service nascent market opportunities, such as engineering performance guarantees.
Policy and project demonstration activities are happening in countries identifi ed as policy leaders, but much more needs to be done to exploit longer term cost reduction potential. The cost of producing output with CCS, be it power and/or other industrial commodities, can be highly competitive with many of the renewable energy options being developed through dedicated support schemes, such as renewable obligations, feed-in tariffs, and innovative subsidy schemes.
In practical terms, for CCS to meet its global climate change mitigation targets in a timely manner, arguably, requires one of the world’s largest public/private collaborative efforts. In this regard, an interesting result from the survey is a 25 per cent year on year rise in the share of respondents agreeing that CCS fi rst movers do have a high propensity to accept the associated commercial project risk. While this is yet to translate into tangible investment decisions, it may indicate a growing sense of frustration within the CCS community with the pace of CCS developments, status of public sector decision making in providing the right policy enablers, and increasing sense of assumed responsibility to ensure that early demonstration projects proceed.
The Institute’s CCS Policy Index (CCSPI) identifi es that early mover countries, such as Canada, Norway and the US, continue to show policy leadership in supporting CCS demonstration efforts. China is also now strongly positioned to infl uence the future success of CCS.
Despite this, overall the government effort directed towards CCS demonstration is stagnating. Without reform or enhancement, most funding programs for LSIPs will be exhausted on current projects. Nonetheless, certain governments are considering approaches to reinvigorate funding programs.
More positively, there have been regulatory developments in some countries. However, it is critical that issues like long-term liability and cross-border movement of CO2 are fully addressed in a timely manner to support early demonstration projects.
Countries with strong interest in CCS must ramp up their policy development efforts if CCS is to achieve its global potential to manage the risks of climate change in an effi cient and effective manner.

THE GLOBAL STATUS OF CCS | 201372
PO
LIC
Y,
LE
GA
L A
ND
RE
GU
LA
TO
RY
DE
VE
LO
PM
EN
TS
4
4.2 DEVELOPMENTS IN INTERNATIONAL POLICY AGENDASThe international effort to address climate change has been in earnest for more than 20 years; international support for CCS as a major mitigation technology really only commenced a decade ago.
While few major CCS policy developments have been reported at the national level since 2012, government support for internationally relevant CCS agendas, such as those of the UNFCCC, ISO, CEM, and CSLF, remain strong.
While they adopt their own work programs, there are linkages between the agendas of these organisations that represent efforts to harmonise global action in support of CCS. All but the ISO initiative are government–led processes, and so, in an effort to avoid duplication, government members try to address CCS policy and technology challenges in a consistent manner across all dialogues. For example, the CEM was established by the Major Economies Forum (MEF) to help increase the global supply of clean energy and generate the political leadership necessary to progress the UNFCCC negotiations. The milestones recorded in 2013 are outlined in Table 4.1.
TABLE 4.1 International CCS developments
INTERNATIONAL BODIES
DEVELOPMENT
UNFCCC Formal adoption of the Clean Development Mechanism’s (CDM) rules of inclusion for CCS projects. The CDM is an offset-crediting scheme established under the Kyoto Protocol to the UNFCCC; it was recently extended to operate over the period 2013 to 2020.
Tasking of the UNFCCC’s Subsidiary Body for Scientifi c and Technological Advice (SBSTA) to consider in 2016 the two outstanding CCS–related CDM issues of transboundary movement of CO2 and the possible establishment of a global reserve of Certifi ed Emission Reduction units (CERs) – decisions on these issues will inevitably be informed by experiences during the preceding period.
Establishment of a CCS Expert Working Group (WG) by the CDM Executive Board (EB) to assist it with methodological issues; the CDM EB also recently approved a CCS work program for 2013–14 to implement the UNFCCC’s adoption of the rules.
CCS Expert WG’s public call for views on a series of concept notes to operationalise CCS within the CDM, for consideration by the EB.
The UNFCCC’s Technology Mechanism is a step closer to being fully and practically operational. Its policy arm, the Technology Executive Committee (TEC), and its implementation arm, the Climate Technology Centre and Network (CTCN), have been successfully launched and are actively considering how the UNFCCC architecture can assist technology transfer (including CCS) to developing countries. The Institute has been actively engaged in all related processes and has provided formal and informal submissions to both bodies.
The UNFCCC’s Ad Hoc Working Group on the Durban Platform, which is responsible for negotiating the 2015 climate change regime, held a workshop at the 38th Subsidiary Body meeting in Bonn in June 2013 that explicitly recognised the important role of CCS.
ISO The ISO’s CCS Technical Committee (TC 265), which was established in 2011 to progress the standardisation of CCS across its entire chain, has met twice since 2012. It is in the process of fi nalising expert members to join fi ve working groups and commence in earnest their respective work programs.
CEM The CEM CCUS Action Group at the 4th CEM meeting released two reports – ‘Global Action to Advance Carbon Capture and Storage: A Focus on Industrial Applications’ and ‘Making the case for funding carbon capture and storage in developing countries’.
Under the UNFCCC, many countries have made conditional and unconditional emission reduction pledges and commitments for 2020, either through the Convention itself or the second commitment period of the Kyoto Protocol, or through nationally appropriate mitigation actions (NAMA) for developing countries. It is widely recognised that these will be insuffi cient to remain on an emissions

THE GLOBAL STATUS OF CCS | 2013 73
PO
LIC
Y, L
EG
AL
AN
D R
EG
UL
AT
OR
Y D
EV
EL
OP
ME
NT
S
4
reduction pathway capable of holding the increase in global average temperature to below 2°C above pre-industrial levels. The estimated emission gap accepted by most countries in negotiating forums is between eight and 13 billion tonnes of CO2eq per year in 2020. The UNFCCC’s Ad hoc Working Group on the Durban Platform for Enhanced Action formally noted in June 2013, at the 38th meeting of the Subsidiary Bodies, the important role that CCS can potentially play in providing fossil fuel energy dependent countries with an enhanced opportunity to commit to ambitious mitigation aspirations within a pre-2020 period. It also acknowledged the potential of CCS to deliver large–scale mitigation in the post-2020 period. See Appendix C.3 for further information on the UNFCCC organisation.
4.3 CCS POLICY INDEXThe Institute has developed an analytical framework to compare domestic policy actions on CCS. The framework embodies several sub-indicators, which will evolve in time to provide an indicator of parity between a country’s CCS policy initiatives and the policy support offered to alternative clean energy options.
Not every country will demonstrate an equal ambition to develop, demonstrate, or even deploy CCS. In some cases, it is sensible for countries to wait until the technology is well demonstrated as technically and fi nancially viable in other locations before considering its adoption.
The Institute continuously monitors CCS–related policies across countries of interest, and this effort reveals a richly diverse array of policy approaches. The constituent policy options identifi ed have been mapped to various policy types and assessed for their relevance to both demonstration and deployment applications (see Appendix C.2). The CCSPI ascribes country policy environments to one of the following categories: lower tier; lower mid-tier; upper mid-tier; or upper tier. These categories are then mapped against the number of LSIPs in both the active and planning stages by country, as illustrated in Figure 4.1.
Some countries are already demonstrating a preparedness to adopt substantial unilateral and multi-lateral action to encourage a localised CCS footprint; they tend to populate quadrants 2 and 4 of the index matrix in Figure 4.1. The governments of these countries often share the view that international efforts to address CCS development barriers are either insuffi cient or proceeding too slowly. They consider it to be in their national interest to accelerate domestic CCS developments so that technology advantages can be optimised.
They demonstrate policy environments that will position them well to capitalise on the benefi ts CCS offers in terms of the economics of large–scale mitigation action. Many have substantial public funding programs, regulatory provisions in place, and/or have implemented or are trialling various carbon pricing arrangements. Australia, for example, has funding, regulatory, and carbon pricing arrangements in place, while China is embarking on ambitious demonstration projects as well as a rollout of arguably the world’s largest pilot system of emissions trading schemes. This does not mean that more should not be done to support CCS, but these countries have the most infl uence on (and perhaps responsibility for) the future success of CCS demonstrations over the medium-term. This group of countries shares the characteristic of having in place a broad range of predictable and deepening policy approaches to support CCS.
Those governments preferring to provide policy environments that give effect to quick adoption of CCS (when considered appropriate or commercially attractive to do so) tend to be located in quadrants 1 and 2 of the policy matrix. They place strong strategic value on CCS developments, but often fi nd it diffi cult to justify dedicating additional scarce domestic resources to supplement international developments by pioneering initiatives at home.
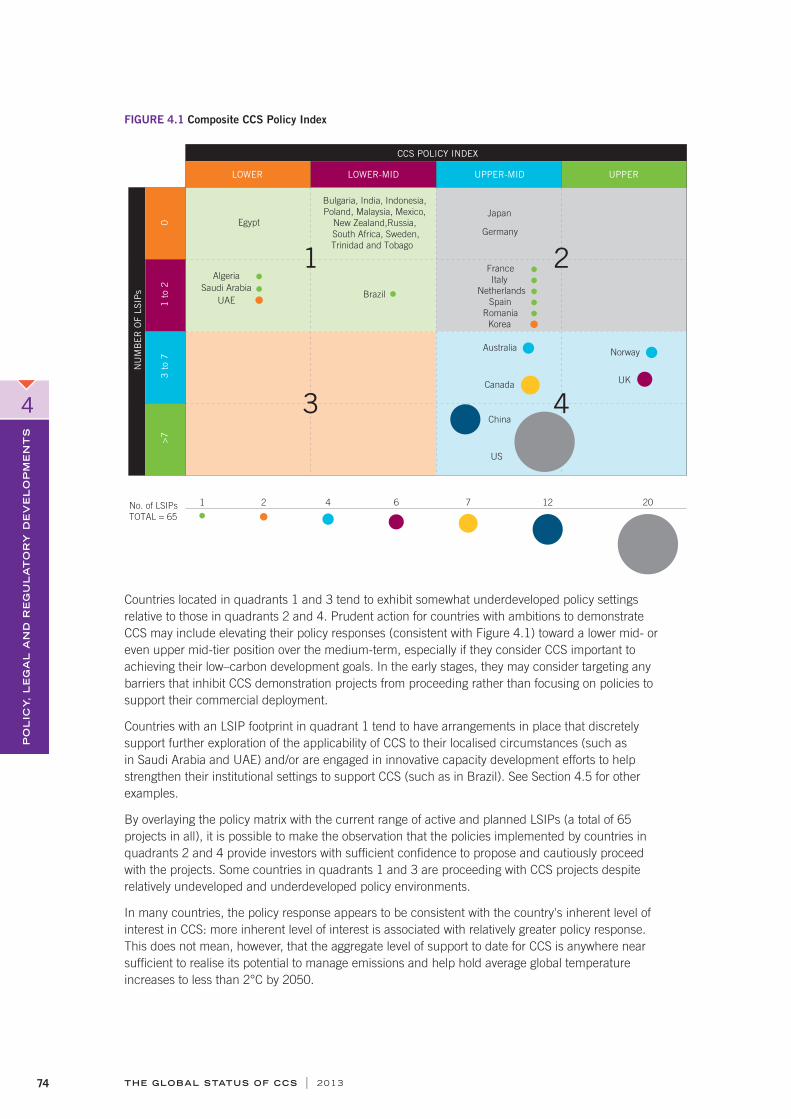
THE GLOBAL STATUS OF CCS | 201374
PO
LIC
Y,
LE
GA
L A
ND
RE
GU
LA
TO
RY
DE
VE
LO
PM
EN
TS
4
FIGURE 4.1 Composite CCS Policy Index
CCS POLICY INDEX
NU
MB
ER
OF
LSIP
s
01
to
23
to
7>7
No. of LSIPs
TOTAL = 65
China
US
Egypt
Bulgaria, India, Indonesia,
Poland, Malaysia, Mexico,
New Zealand,Russia,
South Africa, Sweden,
Trinidad and Tobago
Japan
Germany
France Italy
NetherlandsSpain
RomaniaKorea
LOWER LOWER-MID UPPER-MID UPPER
2 4 76 12 201
Brazil
AustraliaNorway
UK Canada
1 2
3 4
Algeria
Saudi Arabia
UAE
Countries located in quadrants 1 and 3 tend to exhibit somewhat underdeveloped policy settings relative to those in quadrants 2 and 4. Prudent action for countries with ambitions to demonstrate CCS may include elevating their policy responses (consistent with Figure 4.1) toward a lower mid- or even upper mid-tier position over the medium-term, especially if they consider CCS important to achieving their low–carbon development goals. In the early stages, they may consider targeting any barriers that inhibit CCS demonstration projects from proceeding rather than focusing on policies to support their commercial deployment.
Countries with an LSIP footprint in quadrant 1 tend to have arrangements in place that discretely support further exploration of the applicability of CCS to their localised circumstances (such as in Saudi Arabia and UAE) and/or are engaged in innovative capacity development efforts to help strengthen their institutional settings to support CCS (such as in Brazil). See Section 4.5 for other examples.
By overlaying the policy matrix with the current range of active and planned LSIPs (a total of 65 projects in all), it is possible to make the observation that the policies implemented by countries in quadrants 2 and 4 provide investors with suffi cient confi dence to propose and cautiously proceed with the projects. Some countries in quadrants 1 and 3 are proceeding with CCS projects despite relatively undeveloped and underdeveloped policy environments.
In many countries, the policy response appears to be consistent with the country's inherent level of interest in CCS: more inherent level of interest is associated with relatively greater policy response. This does not mean, however, that the aggregate level of support to date for CCS is anywhere near suffi cient to realise its potential to manage emissions and help hold average global temperature increases to less than 2°C by 2050.

THE GLOBAL STATUS OF CCS | 2013 75
PO
LIC
Y, L
EG
AL
AN
D R
EG
UL
AT
OR
Y D
EV
EL
OP
ME
NT
S
4
4.4 STATUS OF GOVERNMENT FUNDING PROGRAMSTargeted project subsidies, including grants, constitute one of the most effi cient policy mechanisms for supporting technology demonstration activities. Between 2008 and 2012, 'policy leader' governments committed more than US$22 billion in direct funding to large–scale CCS demonstration projects. Funding programs are predominantly in the form of grants, although the allocation mechanism or nature of the grant varies across jurisdictions. In late 2009, the scale of funding support being considered globally exceeded US$30 billion. However, as the global fi nancial crisis deepened, some funding mechanisms were cancelled before they could be legislated, such as the UK's proposed electricity levy.
To date, not all of the available funding has been taken up. In several jurisdictions, some of the funding is no longer available due to legislative limits or changing government priorities. In some situations, the value of available government commitments has decreased due to the structure of funding mechanism or the funding is diffi cult to access due to the design of programs. In total, funding commitments have been reduced by more than US$7 billion – and this excludes funding received by projects that were subsequently suspended or cancelled and is no longer available. For example, the Institute estimates that the highest amount of funding any single CCS project could receive from the European NER300 program is €290 million (this includes carryover from the fi rst round and takes into account estimated EIB fees). Given the NER300 rules and the total funding likely to be available in the second round, at most two CCS demonstration projects could be funded. This represents less than 10 per cent of the €6–9 billion proposed by the EC when the program was initially designed. The fall in funding value is largely due to the decreased carbon price in Europe; the NER300 program is funded by the forward sale of carbon allowances. As of the 3 July 2013 deadline for the second round of the program, the UK's White Rose CCS project was the only applicant put forward to the EIB by its national government.
In the US, the Sequestration Tax Credit for CO2 disposal or use (under section 45Q of the Internal Revenue Code) is not optimally designed to support project fi nancing for early mover projects. The mechanism provides for a US$20 per tonne tax credit for the disposal of CO2 in secure geological storage, and a US$10 per tonne tax credit for use in enhanced hydrocarbon recovery. The Institute estimates that this could provide up to US$1 billion in support to projects. However, project proponents in the US have indicated that the scheme does not support raising debt or equity capital because there is no guarantee that the funding will be available at the time the tax credit is requested, especially given other producers may also seek the credits. Consequently, 45Q tax credits, as structured, are of limited value in project fi nancing considerations. However, for an operating project, they do offer some support and certain projects are taking advantage of their availability. To date, 21 Mt of the 75 Mt credits allocated under section 45Q have been allocated.
Overall, of the funding currently available to support LSIPs, the Institute estimates six governments are collectively providing US$12.4 billion. Of this, nearly US$7 billion has been provided to 17 LSIPs in planning or construction, and US$5.4 billion is yet to be allocated (Figure 4.2). In addition to the ongoing allocation decisions across programs, in some cases unallocated funding is being re-offered either because not all the funding was applied for or the initial applicants did not meet all the funding requirements.
For example, in October 2012 the US made available US$685 million for Phase III of the investment tax credits program to support advanced coal projects with CCS. In January 2013, US$104 million was allocated to the Hydrogen Energy California Project under Phase II of the program. In March 2013, the UK Government provided funds from the GB£1 billion CCS Commercialisation Programme to the Peterhead Project in Scotland and the White Rose Project in England to undertake FEED studies over the next 18 months. The expected outcome in the UK is that an FID will be made by early 2015 to support the construction of up to two projects.

THE GLOBAL STATUS OF CCS | 201376
PO
LIC
Y,
LE
GA
L A
ND
RE
GU
LA
TO
RY
DE
VE
LO
PM
EN
TS
4
FIGURE 4.2 Public funding support for LSIPs under construction or in planning
European Union
United Kingdom
Netherlands
Canada1
Australia
United States
US$ billion
Allocated Unallocated
1 0 2 3 4 5 6
1 Includes programs from the Government of Alberta and the Canadian Government
Funding opportunities to support additional or new CCS projects are relatively limited without renewed funding commitments or changes to the structure of programs. In Australia, early stage development for two projects, South West Hub and CarbonNet, is being supported under the Australian Government’s CCS Flagship Program. The release of further monies from the program’s remaining ‘unallocated’ funds (Figure 4.2) is conditional on these projects proving to be viable.
In the US, an estimated US$790 million of the unallocated US$1.4 billion CCS funds identifi ed in Figure 4.2 is attributable to section 45Q tax credits; yet in this program there is no mechanism for project proponents to reserve credits in advance. In 2012, the National Enhanced Oil Recovery Initiative (NEORI) recommended expansion and reform of the program to improve its role in supporting investment in projects. The modifi cation would establish an allocation process to reserve credits, thereby providing a measure of certainty for project fi nancing purposes. In late 2012, a Bill (S.3581) was introduced in the US Senate to reform the 45Q credit in line with the recommendations of the NEORI study. Not included in direct funding commitments by the US government was the announcement earlier in 2013 of a reallocation of up to US$8 billion to support loan guarantees for CCS and other advanced fossil fuel technologies in the US. Loan guarantees can attract private funding through leveraging private investment. However, to date, the US DOE has not entered into loan guarantees with CCS project applicants selected under previous loan guarantee solicitations.
In early 2013, the EC initiated a debate on the options available to support CCS projects, acknowledging that overall ‘available funding is not suffi cient’ in Europe to support an effective demonstration program (European Commission, 2013). The EC is currently considering a range of options and mechanisms to increase funding.
To realise the mitigation potential of CCS in managing the risks of climate change, increased government support for near-term projects is essential. Without additional policies and incentives, the number of LSIPs that can emerge from the current international demonstration programs will likely be limited.

THE GLOBAL STATUS OF CCS | 2013 77
PO
LIC
Y, L
EG
AL
AN
D R
EG
UL
AT
OR
Y D
EV
EL
OP
ME
NT
S
4
4.5 PROGRESSIVE APPROACHES OF CCS REGULATORSThe position a country adopts in relation to developing a CCS legal and regulatory framework is likely to refl ect its 'classifi cation', as identifi ed under the policy index in Section 4.2. Many of the jurisdictions identifi ed in quadrants 2 and 4 of the policy index are 'early movers' in the development of CCS regulatory frameworks. The development of regulatory pathways, removal of discrete legal and regulatory obstacles, and ratifi cation of international and regional agreements for the technology have all been undertaken by these jurisdictions as a part of their broader policy ambitions for CCS.
Many of the countries identifi ed in quadrant 1 of the policy index appear to be second generation regulators. Consistent with their high level of interest in CCS, but less well developed policy frameworks, these countries have only just begun to analyse legal and regulatory requirements for the technology. In future years, it is to be expected that many of these jurisdictions will choose to hone their legal and regulatory models as they increasingly focus on policy responses to the technology.
Early movers are close to completing the regulatory pictureA core group of jurisdictions – Australia, Canada, the EU and US – may be considered leaders or early movers in the development and implementation of law and regulation for CCS. These jurisdictions have remained at the forefront in recent years; all have advanced CCS regulatory regimes and some sponsor change under regional and international agreements.
The rate of legal and regulatory development in many of these jurisdictions, however, appears to have slowed since 2012, for which regulators, policymakers, and industry observers have suggested several reasons. One factor in the change of pace is the fi nalisation of secondary legislation, which completes the implementation of many domestic regulatory framework models. Regulators in several jurisdictions have reported that their regulatory models are complete and they do not expect further amendments or new legislation in the forthcoming year. Another factor may be the continued political indecision surrounding climate change policy in some countries.
AUSTRALIA
The Australian Government has advised that its offshore regulatory regime for geological storage is largely complete; no major federal regulatory developments are expected in the foreseeable future. It is now focused on establishing ‘a nationally consistent approach to clean energy technology development and deployment, including carbon capture and storage’ (SCER, 2013). This is being progressed under the auspices of the Standing Council of Energy and Resources (SCER). Representatives of the SCER CCS Working Group are working toward this goal, having already identifi ed inconsistencies in CCS legislation in place throughout Australia relating to long-term liability and the regulation of cross-jurisdictional storage formations.
Primary and secondary legislation is now in force to regulate CCS onshore in the states of Queensland, Victoria, and South Australia, as well as offshore in Victorian coastal waters. Regulators in these jurisdictions have also advised that their regulatory frameworks are largely complete and no further signifi cant regulatory activities are expected. Legislative developments in the states of New South Wales and Western Australia have also progressed; both states anticipate the introduction of CCS legislation in 2013.
Australia’s legal and regulatory framework is largely complete, with very few gaps and obstacles remaining. Regulators and policymakers appear confi dent in the design of their regulatory frameworks.

THE GLOBAL STATUS OF CCS | 201378
PO
LIC
Y,
LE
GA
L A
ND
RE
GU
LA
TO
RY
DE
VE
LO
PM
EN
TS
4
EUROPE
In Europe, a recent EC Communication on the future of CCS in the region has highlighted substantial improvement with regard to member state transposition of the EU Storage Directive (European Commission, 2013). The formal transposition deadline of 25 June 2011 was missed by all but one member state and the EC commenced infringement cases for non-communication against 26 member states. The Communication reports that, with the exception of one, all member states have now notifi ed the Commission of their transposition measures. And further correspondence reveals that the Commission is in the process of verifying the conformity of these measures.
Notwithstanding this increased activity, the picture portrayed by projects and proponents of the regulatory environment at a member state level remains mixed. It is apparent that some jurisdictions have adopted a comprehensive approach to transposing the Directive’s requirements, which in some instances has been augmented by a favourable and supportive policy environment for the technology. The divergent approaches adopted by individual member states are refl ected in project responses to the Institute’s annual survey (discussed in Section 4.6), which continue to highlight gaps in transposed regulatory regimes.
UNITED STATES
The policy, legal, and regulatory environment for CCS in the US continues to provide some uncertainties for those seeking to undertake capture and CO2 storage operations. State support for the technology generally remains strong, and individual states continue to address legal and regulatory barriers within their authorities. There have been no new federal statutory developments since the Institute reported in 2012. The Environmental Protection Agency (EPA) continues to develop regulations for emissions control and storage control under its existing Clean Air Act and Safe Drinking Water Act authorities. At the regulatory level, the EPA released further guidance documents on the Class VI Injection Well Rule, but several important aspects of the federal regulatory regime remain unanswered. The anticipated EPA draft guidance on transition from Class II CO2–EOR operations to Class VI geologic storage has not yet been released. The EPA will issue a new proposal as a consequence of the millions of consultation responses received on its proposed new source performance standards (NSPS) for GHG emissions from fossil fueled electric utility generating units, published in April 2012. The US President has directed the EPA to issue the proposal by no later than 20 September 2013, and to issue a fi nal rule in a timely fashion after consideration of public comments. The President has also directed the EPA to:
issue proposed carbon pollution standards, regulations, or guidelines, as appropriate, for modifi ed, reconstructed, and existing power plants by no later than 1 June 2014
issue fi nal standards, regulations, or guidelines, as appropriate, for modifi ed, reconstructed, and existing power plants by no later than 1 June 2015
include in the guidelines addressing existing power plants a requirement that the states submit to the EPA the implementation plans required under section 111(d) of the Clean Air Act and its implementing regulations by no later than 30 June 2016.
Unlike standards for new facilities set by the EPA, standards for existing plants under the federal Clean Air Act are established through a federal/state process whereby a state may develop implementation plans that satisfy EPA guidelines as well as tailored to the state’s particular situation. The President encouraged the EPA to engage directly with the states to develop approaches that allow the use of market–based instruments and other regulatory fl exibilities.
CANADA
In Canada, regulatory developments have principally occurred at the provincial level, with several of the provinces enacting, or in the process of developing, legislation. In recent years, the provinces of Saskatchewan, British Columbia, and Nova Scotia have all taken steps to clarify their legal position and develop legislation, but the province of Alberta has remained the most active. Alberta continued to support its multi-stakeholder Regulatory Framework Assessment (RFA) process throughout 2012, with the fi nal report submitted to the Minister of Energy in late 2012.

THE GLOBAL STATUS OF CCS | 2013 79
PO
LIC
Y, L
EG
AL
AN
D R
EG
UL
AT
OR
Y D
EV
EL
OP
ME
NT
S
4
Second generation regulators are laying the legal and regulatory foundations for CCSThe Institute’s 2011 status report identifi ed a new category of country, one in which regulators and policymakers have instated a variety of domestic activities to reduce legal and regulatory uncertainty surrounding CCS. The report categorised these jurisdictions as second generation regulators, a classifi cation that included a wide geographical spread of developed and developing nations and incorporated a broad range of legal and regulatory activities, plans, and programs.
In the intervening period, the number of countries in this category has increased, with the further development and subsequent completion of several early projects and activities. It is clear that while policymakers around the world have sought to incorporate CCS as a policy option into their climate change mitigation strategies, the focus has inevitably shifted toward the ability of domestic legal regimes to legitimise, regulate, and support the activity. This has been the case in 2013, with legal and regulatory activities proposed and underway in countries throughout the Asia Pacifi c, Americas, Middle East, and Africa.
The approach adopted by jurisdictions in this category stands in contrast to many of the early mover countries discussed in Section 4.2. The transition from policy to full–scale regulation of the technology is less pronounced, with the majority of jurisdictions undertaking scoping activities aimed at laying the foundations for future legislation and regulation.
The regulatory basis for current and proposed activities appears to vary between second generation regulators. Pre-existing regulatory regimes governing EOR and other oil and gas operations have underpinned work in some jurisdictions, with regulators and policymakers seeking to utilise existing pathways and legislative frameworks to include storage as a part of ongoing or proposed extractive operations. For other jurisdictions, climate change policies have proven to be the driver, with current or anticipated climate change commitments providing the impetus for legislative and regulatory activity. In both situations, however, second generation regulators have sought to rely upon the experiences and lessons garnered by those in early mover jurisdictions.
ASIA PACIFIC
Several countries in the Asia Pacifi c region have remained committed to addressing the challenges posed by legal and regulatory issues, embarking upon activities aimed at assessing the capacity of their domestic legal regimes to accommodate, and subsequently regulate, the technology. In recent years, Indonesia, Japan and Korea have undertaken activities ranging from amendments to primary legislation and commissioning studies, through to the hosting of legal and regulatory workshops. The pace of development in the region would appear undiminished, with China, Malaysia, and New Zealand (see Box 4.1) also taking steps in recent months to address legal and regulatory issues.
BOX 4.1
Developing framework legislation – the New Zealand approach In July 2012, the NZ government issued a request for proposals to address several priority issues, with a view to:
Understanding the options, risks, opportunities and feasibility of carbon capture and storage for New Zealand including technical, economic, environmental, social and regulatory issues in order to be ready and able to adopt and deploy carbon capture and storage technologies in New Zealand.Ministry of Business Innovation and Employment, NZ, 2013, p.3.
An analysis of legal and regulatory institutional frameworks was highlighted by the government as an essential component of this broader research agenda, and proposals to address the topic were required to consider and provide 'a comprehensive framework for the development
I Box 4.1 continued next page

THE GLOBAL STATUS OF CCS | 201380
PO
LIC
Y,
LE
GA
L A
ND
RE
GU
LA
TO
RY
DE
VE
LO
PM
EN
TS
4CHINA
China continues to signal a strong policy commitment to reducing national carbon and energy intensity, with CCUS increasingly recognised as an important technology for realising this ambition. The National Development and Reform Commission (NDRC) released a Notice entitled Promoting Carbon Capture, Utilisation and Storage Pilot and Demonstration in April 2013, which highlighted several near-term tasks to assist in the promotion of CCUS pilot and demonstration plants in China. One of the key tasks identifi ed in the document is the promotion of CCUS standards and regulation to strengthen ‘the impact assessment of CCUS, assess the health, safety and environment impacts, strengthen long-term security, environmental risk assessment and control, build up and improve related safety standards and a system of environmental regulations’.
In late 2012, the Administrative Centre for China's Agenda 21, together with the CSLF and Chinese Ministry of Science and Technology (MOST), hosted a workshop dedicated to the design of CCUS legal and regulatory frameworks. The workshop, held in Beijing, addressed a range of issues and regulatory models, and reached several conclusions about the role of law and regulation for CCUS in China. In particular, the workshop determined a clear need to develop further programs of study and continue working with international organisations to consider policy, legal, and regulatory frameworks for the technology.
MALAYSIA
In Malaysia, where the government is investigating a range of climate change mitigation options, the Institute has been working with the Ministry of Energy, Green Technology and Water (KeTTHA) to work out whether or not a CCS project there could be regulated under existing regulatory pathways. The analysis will help identify regulatory gaps, overlaps, and areas to be improved for a future potential CCS project to go ahead in Malaysia. Accordingly, the Institute and KeTTHA hosted a CCS Legal and Regulatory Framework Workshop in March 2013, which was attended by representatives from the Malaysian government, industry, academic organisations, and non-government organisations (NGO). The workshop report is available on the Institute’s website.
MIDDLE EAST, AMERICAS, AND AFRICA
Governments, academics, and industry groups across the Middle East, Americas, and Africa have continued to engage with each other on legal and regulatory issues and consider the scope and necessity of CCS law and regulation within their domestic regimes. For example, see Box 4.2 on the efforts of Trinidad and Tobago. While activity within these regions has varied considerably since 2012, regulators and policymakers have proposed and undertaken a range of actions, from expressions of policy ambition to the commissioning of full–scale research endeavours aimed at developing model or draft legislation.
In the Middle East, Arab states comprising the Gulf Cooperation Council (GCC) have recently emphasised the critical nature of law and regulation for the region. At a strategy workshop hosted by the Global CCS Institute and UAE Ministry of Foreign Affairs, GCC members highlighted the need
BOX 4.1 (continued from previous page)
of law and policy to govern carbon capture and storage in New Zealand'. In November 2012, upon completion of the tender process, the University of Waikato was awarded NZ$250,000 to undertake the legal and regulatory component of the study.
Starting from an initial premise that domestic legislation did not address CCS, the study sought to examine existing NZ law and policy, as well as any potential barriers that may preclude the technology’s deployment. In addition to the university’s in-house expertise, advisory panels to provide international legal context, domestic policy and industry expertise were established.
The fi nal report, including suggestions for a NZ legislation/regulatory framework, is scheduled to be submitted to government in September 2013.

THE GLOBAL STATUS OF CCS | 2013 81
PO
LIC
Y, L
EG
AL
AN
D R
EG
UL
AT
OR
Y D
EV
EL
OP
ME
NT
S
4
for a pan-GCC approach to legislation to enable benchmarking and cooperative learning throughout the region. A representative of Qatar Petroleum reiterated the need for comprehensive policy and regulatory models in the region, as well as indicating Qatar Petroleum’s ongoing involvement in developing a legal and regulatory framework for the technology.
The South African Government has undertaken several CCS legal and regulatory activities in recent years. In February 2012, the Department of Energy (DoE), together with the World Bank, issued a tender for a consultancy contract to develop a regulatory framework for the technology. Also in 2012, a study entitled Carbon Capture and Storage: Towards a regulatory and legal regime in South Africa was undertaken by the University of Cape Town’s Institute of Marine and Environmental Law. The fi nal report provides a comprehensive review of legal and policy developments to enable CCS in South Africa, as well as the technology’s interaction with existing national legislation.
BOX 4.2
CCS IN DEVELOPING COUNTRIES – LEGAL AND REGULATORY FRAMEWORKS
Trinidad and Tobago – a good example of second generation policymaking In 2013, the Institute has observed an expansion in the number of second generation regulators, many of whom are in developing countries. Trinidad and Tobago is one country where policymakers are joining this group and laying the groundwork for CCS through legal and regulatory analysis.
In mid-2011, the Government of Trinidad and Tobago released its National Climate Change Policy, which states that the use of cleaner technology will increase in all sectors through the development of regulatory approaches and technology standards. It also discusses the feasibility of cap and trade schemes within and across emitting entities, and explores CCS and CCUS (among other approaches).
The Inter-American Development Bank (IDB) provided a grant to Trinidad and Tobago to assist it to consider the impact of climate change on national policies and institutions. The grant program, Mainstreaming of Climate Change into National Development and Capacity Building for Participation in Carbon Markets, includes a study to examine the feasibility of a CCS project in Trinidad and Tobago. The country fi rst piloted CO2 for EOR in 1973 and continued its use throughout the 1980s, so it is well placed to consider CCUS projects.
As part of this process, and in partnership with the Ministry of Environment and Water Resources, the Institute completed a CCS regulatory review to consider how a CCS project could be regulated – from concept and design through to decommissioning – within Trinidad and Tobago’s current legal and regulatory framework. A local law fi rm, Narinesingh, Ramlogan, and Company, identifi ed all potential permit requirements and approval timelines that a CCS project would encounter under Trinidad and Tobago’s existing laws and regulations. The review also drew on rich feedback from government, industry, and academic stakeholders provided through a series of workshops and meetings.
In light of the review fi ndings in the recently completed report, Feasibility of CCS Projects within Trinidad and Tobago, the Government is now considering the development of CCS standards.
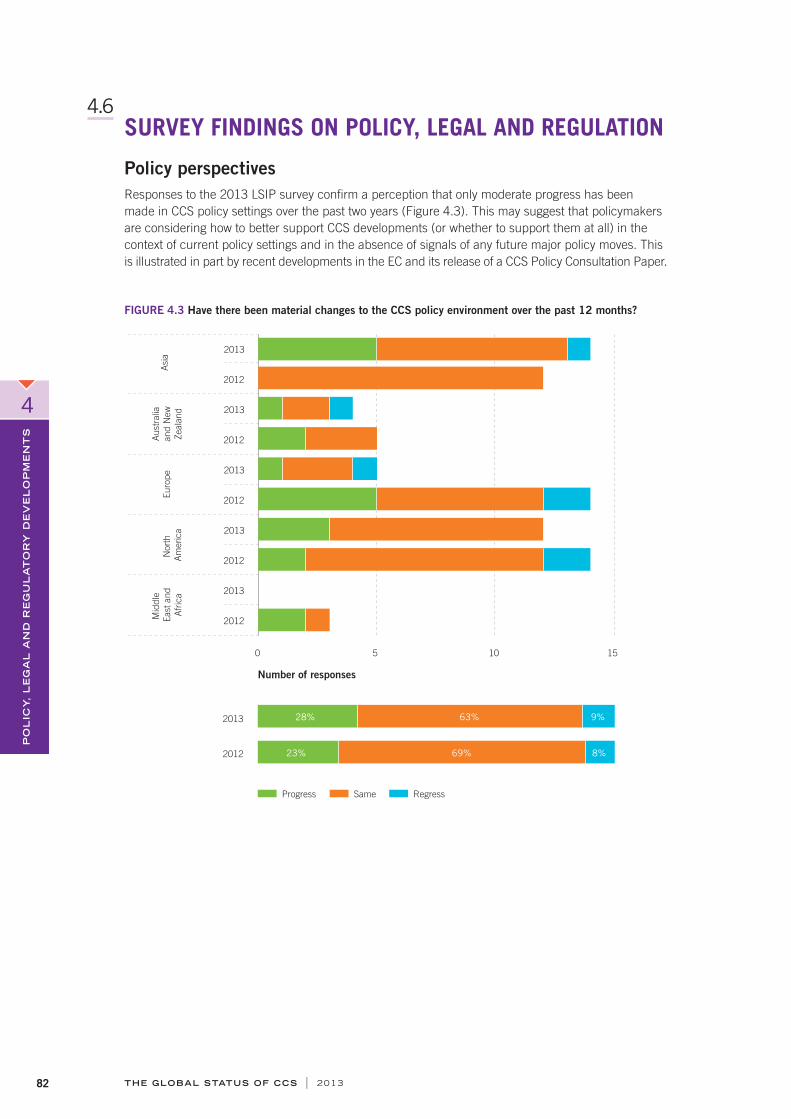
THE GLOBAL STATUS OF CCS | 201382
PO
LIC
Y,
LE
GA
L A
ND
RE
GU
LA
TO
RY
DE
VE
LO
PM
EN
TS
4
4.6 SURVEY FINDINGS ON POLICY, LEGAL AND REGULATION
Policy perspectivesResponses to the 2013 LSIP survey confi rm a perception that only moderate progress has been made in CCS policy settings over the past two years (Figure 4.3). This may suggest that policymakers are considering how to better support CCS developments (or whether to support them at all) in the context of current policy settings and in the absence of signals of any future major policy moves. This is illustrated in part by recent developments in the EC and its release of a CCS Policy Consultation Paper.
FIGURE 4.3 Have there been material changes to the CCS policy environment over the past 12 months?
2012
2013
2012
2013
2012
2013
2012
2013
2012
2013
Nort
h
Am
erica
Mid
dle
East
and
Afr
ica
Euro
pe
Asi
a
Number of responses
Au
stra
lia
an
d N
ew
Zeala
nd
Progress Same Regress
2012
2013
0 5 10 15
23% 69% 8%
28% 63% 9%

THE GLOBAL STATUS OF CCS | 2013 83
PO
LIC
Y, L
EG
AL
AN
D R
EG
UL
AT
OR
Y D
EV
EL
OP
ME
NT
S
4
There is a slight weakening in the perception that existing policy settings are essential to service the requirements of a CCS project business cases. More than 50 per cent of projects surveyed in 2012 considered their current policy settings substantively contributed to their business cases, growing to almost 60 per cent in 2013. While about the same proportion of respondents consider current policy settings moderately support their business case (Figure 4.4), the suffi ciency of these settings needs to be tempered by the fact that the majority of projects surveyed still see a need for additional future policy settings to substantiate their business cases.
FIGURE 4.4 How valuable is the prevailing suite of policy settings in supporting your CCS project business case?
0
2012
2013
2012
2013
2012
2013
2012
2013
2012
2013
Nort
h
Am
erica
Mid
dle
East
and
Afr
ica
Euro
pe
Asi
a
Number of responses
Au
stra
lia
an
d N
ew
Zeala
nd
Essential Very Moderate Negligible
2012
2013 22% 36% 32% 10%
24% 27% 34% 15%
2 4 6 8 10 12 14
A greater focus on policy settings is required to specifi cally provide for the fi nancial needs of CCS demonstration projects and signal to prospective investors that governments hold a strong belief in the future viability of CCS projects to help deliver their climate change ambitions. This is illustrated in Figure 4.5, which shows an overwhelming number of respondents (about 85 per cent) consider yet to be revealed and/or implemented policy decisions important to their future project investment decisions. The share of those indicating that they consider this factor to be at least a non-negligible issue grew by 10 percentage points.

THE GLOBAL STATUS OF CCS | 201384
PO
LIC
Y,
LE
GA
L A
ND
RE
GU
LA
TO
RY
DE
VE
LO
PM
EN
TS
4
FIGURE 4.5 How dependent is your project’s future viability on new government settings?
2 4 6 8 10 12 140
2012
2013
2012
2013
2012
2013
2012
2013
2012
2013N
ort
h
Am
erica
Mid
dle
East
an
d
Afr
ica
Eu
rop
eA
sia
Number of responses
Au
stra
lia
an
d N
ew
Zeala
nd
Essential Very Moderate Negligible
2012
2013 26% 28% 31% 15%
28% 19% 28% 25%
Project preferences for particular policy options remained constant over time, as illustrated in Table 4.2. CCS practitioners still consider the mainstream policy instruments to be direct subsidies, carbon pricing arrangements, off-take agreements, streamlined regulatory processes, regulated returns for their output (i.e. power), and access to viable storage solutions (i.e. to allow sink-to-source matching). In fact, there was an increase year on year in the proportion of projects preferring direct subsidies to support the early stages of their own project’s development, and a corresponding decrease in the proportion of projects expressing preference for a carbon price as the preferred mechanism for their own project.
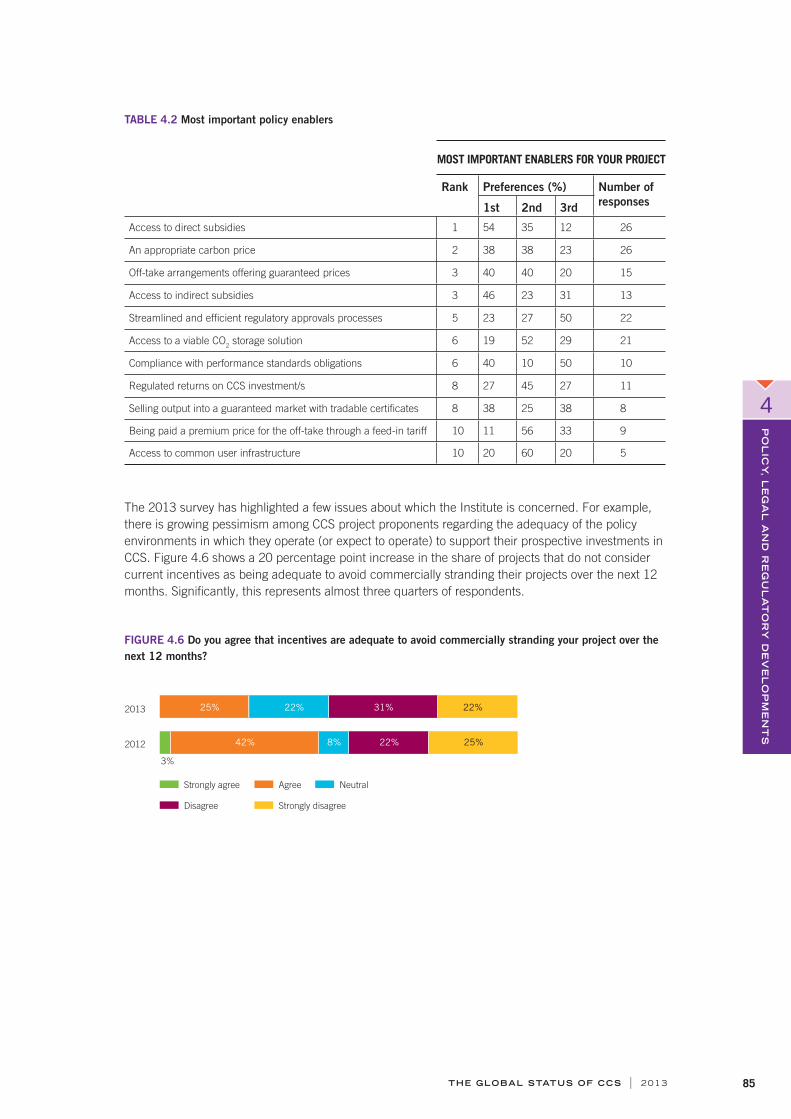
THE GLOBAL STATUS OF CCS | 2013 85
PO
LIC
Y, L
EG
AL
AN
D R
EG
UL
AT
OR
Y D
EV
EL
OP
ME
NT
S
4
TABLE 4.2 Most important policy enablers
MOST IMPORTANT ENABLERS FOR YOUR PROJECT
Rank Preferences (%) Number of responses1st 2nd 3rd
Access to direct subsidies 1 54 35 12 26
An appropriate carbon price 2 38 38 23 26
Off-take arrangements offering guaranteed prices 3 40 40 20 15
Access to indirect subsidies 3 46 23 31 13
Streamlined and effi cient regulatory approvals processes 5 23 27 50 22
Access to a viable CO2 storage solution 6 19 52 29 21
Compliance with performance standards obligations 6 40 10 50 10
Regulated returns on CCS investment/s 8 27 45 27 11
Selling output into a guaranteed market with tradable certifi cates 8 38 25 38 8
Being paid a premium price for the off-take through a feed-in tariff 10 11 56 33 9
Access to common user infrastructure 10 20 60 20 5
The 2013 survey has highlighted a few issues about which the Institute is concerned. For example, there is growing pessimism among CCS project proponents regarding the adequacy of the policy environments in which they operate (or expect to operate) to support their prospective investments in CCS. Figure 4.6 shows a 20 percentage point increase in the share of projects that do not consider current incentives as being adequate to avoid commercially stranding their projects over the next 12 months. Signifi cantly, this represents almost three quarters of respondents.
FIGURE 4.6 Do you agree that incentives are adequate to avoid commercially stranding your project over the next 12 months?
Strongly agree Agree Neutral
Disagree Strongly disagree
2012
2013 25% 22% 31% 22%
3%
42% 8% 22% 25%

THE GLOBAL STATUS OF CCS | 201386
PO
LIC
Y,
LE
GA
L A
ND
RE
GU
LA
TO
RY
DE
VE
LO
PM
EN
TS
4
Another concern is a consistent lack of confi dence by some members of the CCS community in CCS playing an increasingly important role in mitigating future global emissions. Figure 4.7 indicates that there is still some 20 per cent of those surveyed who do not share a positive view possibly due to a perception of future policy uncertainty and/or have little confi dence that the right enabling environments will be in place to support the broader deployment of CCS. This refl ects the commercial reality that there is currently no real indication that any particular large–scale clean energy technology solution, or even one within the stable of CCS capture options, will emerge as the most attractive from a least cost abatement perspective, given that most are still being demonstrated.
FIGURE 4.7 Do you agree that the importance of CCS to mitigate emissions will increase this decade?
Strongly agree Agree Neutral
Disagree Strongly disagree
2012
2013 31% 47% 19% 3%
41% 16% 13%30%
The survey results send a strong message to global policymakers about how others perceive the effectiveness of their policy support, and the need for predictable and stable policy developments. Figure 4.8 indicates that policy uncertainty and ambiguity remains a major concern to 70 per cent of the CCS project practitioners surveyed, coupled with a 14 percentage point increase in those who consider it of paramount concern. It can impose unmanageable risk premiums on top of the already substantial yet manageable conventional risk elements that typically make up industrial activities.
FIGURE 4.8 Do you agree that policy uncertainty is a major risk to your project?
Strongly agree Agree Neutral
Disagree Strongly disagree
2012
2013 26% 44% 24% 6%
12% 60% 12% 8% 8%
Securing the funding on a commercial basis to meet the upfront capital (CAPEX) requirements of CCS projects was identifi ed by 64 per cent of survey respondents as the greatest funding challenge they face (Figure 4.9). This is supported by the 2012 survey results; in response to a differently worded question, where about 34 per cent responded that they considered the CAPEX challenge to be more important than the operating expenditure (OPEX) challenge and 28 per cent considered it to be at least as important.

THE GLOBAL STATUS OF CCS | 2013 87
PO
LIC
Y, L
EG
AL
AN
D R
EG
UL
AT
OR
Y D
EV
EL
OP
ME
NT
S
4
FIGURE 4.9 Do you agree that the greatest funding challenge is securing capital expenditure? (refers to the 2013 results) To what extent do you agree that the funding challenge of CAPEX is much less than OPEX? (refers to the 2012 results)
Strongly agree Agree Neutral
Disagree Strongly disagree
2012
2013 27% 37% 26% 7% 3%
3%
31% 28% 20% 18%
While very few governments appear to have implemented new policies in 2013, echoing the fi ndings of the 2012 survey, it seems that many are conscientiously refl ecting on the state of their current policy settings (e.g. the EC’s CCS Consultative Communication, UK Energy Reforms, and the impact of Australia’s legislated carbon pricing arrangements on CCS commitments). A realisation that more needs to be done to implement enabling policies for large–scale CCS demonstration is consistent with the international dialogue currently taking place in the UNFCCC generally. More specifi cally, the Ad hoc Working Group on the Durban Platform for Enhanced Action, which is the negotiating track responsible for the 2015 climate agreement, is focused on the need and ability of all countries to enhance their mitigation action pre- and post-2020.
Legal and regulatory perspectivesMany projects around the world realised in 2013 that their current regulatory environment supports the making of an FID (Figure 4.10). In particular, projects in the US and Canada again indicated that their regulatory environments are strongly supportive of making an FID, while across Asia the signals are also largely optimistic. In these regions, the positive responses far exceed the number of negative responses.
In Australia, there has been no change in 2013; project proponents are still divided about whether their regulatory regimes offer a supportive investment environment. In Europe, the number of projects indicating a supportive regulatory environment has decreased noticeably since 2012; the majority of project responses now suggest that, based on current regulatory requirements, they are unable to make an FID.
FIGURE 4.10 Whether a project can proceed to FID within the current regulatory requirements
0 10 155
Middle East and Africa
North America
Australia
Asia
Number of responses
55% 45%
Yes No
Europe

THE GLOBAL STATUS OF CCS | 201388
PO
LIC
Y,
LE
GA
L A
ND
RE
GU
LA
TO
RY
DE
VE
LO
PM
EN
TS
4
Responses to the survey question about perceived changes in the regulatory environment since 2012 (Figure 4.11) provide some context regarding whether the regulatory requirements support an FID. In general, the only jurisdictions where a project reported progress in regulatory requirements were in North America, Australia, and Asia. Respondents in these countries were most positive about the supportiveness of regulations. However, the overall picture was one characterised by a perceived lack of regulatory activity.
In Europe, project responses indicated little regulatory change in 2013. Of particular concern, given the regulatory efforts of many member state regulators since 2012, is that none of the project responses indicated that progress may have assisted in the making of an FID. This suggests that, despite the development (and in some instances, completion) of regulatory models in Europe, there are underlying issues yet to be addressed in domestic regimes.
Australian project responses to this question may also refl ect their views about their ability to make an FID, with the majority of projects suggesting there had been no change to the regulatory environment since 2012. Notwithstanding the regulatory framework is largely in place across Australia, it would appear that projects remain cautious with regard to some aspects of their regulatory regimes.
Project responses from the US and Canada remained largely unchanged from the 2012 survey, although a small number indicated progress. In light of the earlier suggestion that the regulatory environment is strongly supportive of making an FID, these responses indicate a dichotomy between those projects likely to be regulated under proposed legal and regulatory models for CCS and those permitted under the pre-existing models governing EOR.
Particularly encouraging for regulators are those responses from proponents suggesting that there has been regulatory progress in both US and Canadian jurisdictions that assist the making of FIDs.
Project responses in China overwhelmingly indicate that project proponents’ consider their regulatory situation has not changed since 2012. Although in stark contrast to responses by projects regarding the taking of an FID, this most likely indicates a strong focus on EOR activities and the nascent stage of CCS law and regulation in the country.
FIGURE 4.11 Changes to the regulatory environment since 2012
Europe
5 10 15
Middle East and Africa
North America
Australia
Asia
Number of responses
Progress No change Regression
13% 84% 3%
0

THE GLOBAL STATUS OF CCS | 2013 89
PO
LIC
Y, L
EG
AL
AN
D R
EG
UL
AT
OR
Y D
EV
EL
OP
ME
NT
S
4
The annual survey once again requested projects consider several key legal and regulatory issues, many of which may be integral to the design of CCS legal and regulatory frameworks. Figure 4.12 details consolidated project assessments for each issue; respondents determined whether an issue had been ‘addressed’, ‘partially addressed’, or ‘not addressed’ in their respective regulatory regimes.
Project developers regard several issues as ostensibly ‘addressed’ by the regulatory models in place in their jurisdictions. Responses to the 2013 survey suggest regulators have established legislation that largely addresses the following issues:
selection and evaluation of storage sites
identifi cation of access and property rights
how CCS activities are to be considered under existing planning and permitting regimes.
There remain several issues that projects do not believe have been addressed under current regulatory models. Most noticeable is that, when compared to the results for the 2012 survey, many of the same issues remain unaddressed in regulatory regimes worldwide. The responses indicate the following issues have yet to be adequately addressed by regulators around the globe:
rules to accommodate CCS within market–based mechanisms
standards for the cross-border movement of CO2
the broad issue of long-term liability for storage operations.
One encouraging fi nding is the increased number of issues identifi ed in this year’s survey as ‘partially addressed’. While it is possible to view these responses as less than encouraging and possibly symptomatic of incomplete regulatory models, they may also be viewed as indicative of a transition period. Over time, as regulators further develop and refi ne their regulatory models and a greater number of projects is permitted under the early regimes, it may be expected that project responses will trend away from wholly negative replies and move toward responses that suggest the near completion of models. Project responses from the 2013 survey perhaps lend credence to this assumption, with the ‘partially addressed’ and ‘addressed’ issues outweighing those identifi ed as ‘not addressed’ in all but two areas. These assumptions would appear to be borne out in relation to domestic and regional legislative activities, especially in those jurisdictions where legal and regulatory activities are in the formative stage or projects are in the early stages of the project lifecycle.
A regional analysis of the responses offers further context to these conclusions, particularly for those issues that appear to be ‘not addressed’ by regulators.
Rules to accommodate CCS within market–based mechanisms remains critical for projects globally, with the majority of projects in each region responding the issue was ‘not addressed’, rather than ‘partially addressed’ by domestic legislation. Only project responses in North America went against the trend, with the majority of Canadian projects considering the issue ‘partially addressed’ and some projects in the US suggesting it had been ‘addressed’. These responses are perhaps indicative once again of the strong role EOR plays in supporting and sustaining project development in North America. The high level of responses from Chinese projects suggesting that the issue had not been addressed demonstrate the nascent stage of policy, legal, and regulatory development in the country. Projects in Australia and Europe, for the second year, highlighted the issue as only ‘partially addressed’ or ‘not addressed’ in their domestic regimes. This fi nding will likely concern many policymakers and regulators in these jurisdictions, who have made considerable efforts to establish frameworks to support CCS deployment.
In several jurisdictions, issues relating to the broader theme of long-term liability also appear to be viewed as ‘not addressed’. These responses may prove less of a concern in jurisdictions that are still developing CCS policy and legislation, or indeed those utilising existing legislative models to regulate the technology. For some regulators in Australia and Europe, these responses are also likely to be disappointing, particularly given the substantial programs of legislative development in recent years aimed at reducing the uncertainties surrounding regulation of the more novel aspects of the technology.

THE GLOBAL STATUS OF CCS | 201390
PO
LIC
Y,
LE
GA
L A
ND
RE
GU
LA
TO
RY
DE
VE
LO
PM
EN
TS
4
FIGURE 4.12 Project appraisals of the domestic regulatory environment
61
11
4
10
15
6
81
11
1
10
91
2
18
64
14
12
6
12
16
3
21
81
14
15
2
15
12
2
14
12
4
12
14
5
12
98
30
20
10
0
10
2
0
30
Sele
ction a
nd e
valu
ation o
f a s
tora
ge s
ite
Perf
orm
an
ce s
tandard
s fo
r th
e b
ehavi
our
of
the inje
cte
d p
lum
e (
CO
2 c
om
posi
tion,
leakage,
seepage,
etc
.)
Definitio
n o
f pro
ject
boundaries
Identification o
f pro
pert
y and a
ccess
rig
hts
(inclu
din
g c
om
peting t
enem
ents
and inte
rest
s)
Sta
ndard
s to
account fo
r cro
ss-b
ord
er
move
ment
of
store
d C
O2
Dra
ftin
g a
nd im
ple
menta
tion o
f a m
onitoring p
lan
Definitio
n o
f w
hat const
itute
s si
gnifi
cant
irre
gula
rities
(inclu
din
g leakage a
nd/o
r se
epage)
Rule
s to
accom
modate
CC
S o
utc
om
es
within
mark
et
mechanis
ms
Rem
edia
tion a
ctivi
ties
to b
e u
ndert
aken
by
the o
pera
tor
in t
he e
vent
of
leakage
Post
-opera
tional tr
ansf
er
of
opera
tor’s
liabili
ty
Fin
ancia
l se
curity
requirem
ents
for
opera
tors
Success
ful re
gula
tion o
f th
e C
CS
pro
cess
thro
ughout
the p
roje
ct
lifecyc
le
How
CC
S a
ctivi
ties
are
to b
e a
dequate
ly a
ddre
ssed
in p
re-e
xist
ing p
lannin
g a
nd p
erm
itting r
egim
es
Resp
onse
s
Not
addre
ssed
Part
ially
addre
ssed
A
dd
ress
ed

THE GLOBAL STATUS OF CCS | 2013 91
PO
LIC
Y, L
EG
AL
AN
D R
EG
UL
AT
OR
Y D
EV
EL
OP
ME
NT
S
4
4.7 RECOMMENDATIONS AND OUTLOOK The Institute strongly advocates governments accept an equitable share of the fi nancial burden affl icting fi rst mover CCS demonstration projects on the grounds that there are positive socio-economic and technical spill over effects, as well as traditional market failures and barriers. This does not mean that governments should ration the current level of support offered to low emissions technologies (LETs), but rather that governments should consider broadening their coverage and scope to deliver a higher level of policy parity for all LETs (improving the project economics of each). While the exact nature of government support differs between countries, such parity can generally be achieved by establishing new schemes or redesigning and/or harmonising existing ones. Approaches whereby different technologies can compete on a relatively level playing fi eld for mitigation funding will assist their deployment, and could quickly help drive down construction and operational costs.
There is no credible emissions reduction scenario in the public domain indicating that without CCS global emissions can be suffi ciently reduced in time to limit the global average temperature increase to 2°C. The overall cost to suffi ciently support CCS is likely comparable to the costs currently being borne by taxpayers to support schemes to drive alternative forms of large–scale clean energy. When such costs are compared to the potential damage wrought by dangerous climate change, a policy environment that supports the global demonstration of CCS should be regarded more as an ‘insurance premium’ to safeguard climate, life, and natural and manmade assets, than a competing claim for government resources.
BP's Statistical Review of World Energy June 2013 estimates that the proven reserves of oil, gas, and coal amount to about 1.3 trillion tonnes. If consumed without the application of CCS, this could result in more than a trillion tonnes of greenhouse gases being emitted into the atmosphere. It is reasonable to expect that this stock of energy will be utilised by both developed and developing countries. CCS remains the only mitigation solution that can prevent the associated CO2 emissions from entering the atmosphere and underpins the global ambition to hold average temperature rises to below 2°C.
The availability of suffi cient public funds to support an appropriate number of large–scale demonstration projects remains a challenge. Signifi cant fi nancial support from governments over the past fi ve years has been eroded due to mechanism design issues (such as the NER300 program in Europe and certain tax credits in the US), or removed from commitments as some funded projects have been cancelled or put on hold. Policymakers acknowledge these challenges and are seeking appropriate mechanisms to provide additional support. However, funding mechanisms represent only one form of support for key CO2 mitigation technologies. Clear and credible commitments regarding the level of abatement to be achieved over the next 40 years – underpinned by policies that directly price carbon, place increasingly stringent limits on CO2 emissions, or directly mandate the technology – are also required to create a demand for the use of CCS and similar technologies. Given the absence of credible emissions reduction scenarios, funding policies alone present a signifi cant challenge to any CCS project proponent trying to establish an effective business case without support from other revenue sources.
Although development and refi nement of law and regulation for CCS is continuing in an increasing number of jurisdictions globally, it is clear that some issues still need to be addressed, both in relation to these models and their wider policy context. This is particularly evident in jurisdictions that have declared their legal frameworks for CCS complete – a position not borne out in project responses to the Institute’s 2013 survey. Several issues remain unresolved and they will need to be addressed urgently if projects are to take investment decisions and move toward operation; only then will CCS be able to help meet climate change mitigation goals.

THE GLOBAL STATUS OF CCS | 201392
5
CAPTURE
FIGURE 5.1 CO2 capture overview
5.1 Overview .......................................................................................................................................................93
5.2 CCS is happening in industrial processes ...........................................................................95
5.3 CCS in power generation is progressing but more work is needed ....................98
5.4 Methods to reduce capture costs ............................................................................................ 102
5.5 Recommendations and outlook ................................................................................................ 105
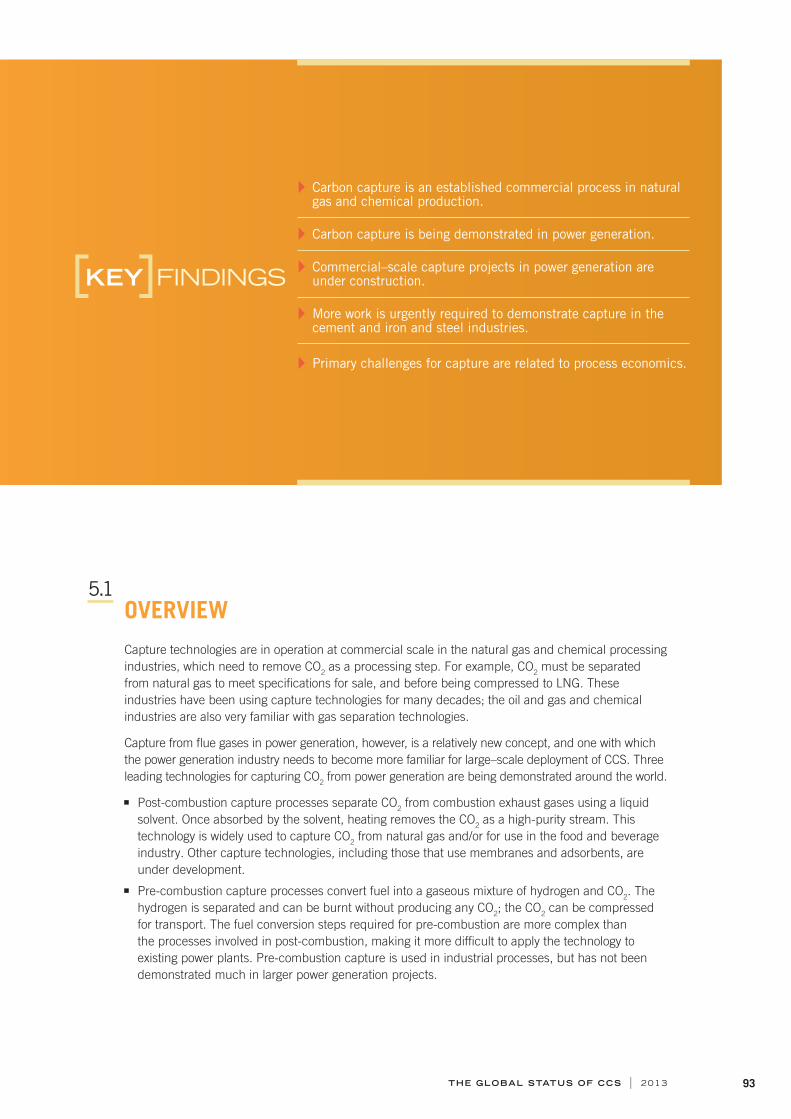
THE GLOBAL STATUS OF CCS | 2013 93
KEY FINDINGS
5.1 OVERVIEWCapture technologies are in operation at commercial scale in the natural gas and chemical processing industries, which need to remove CO2 as a processing step. For example, CO2 must be separated from natural gas to meet specifi cations for sale, and before being compressed to LNG. These industries have been using capture technologies for many decades; the oil and gas and chemical industries are also very familiar with gas separation technologies.
Capture from fl ue gases in power generation, however, is a relatively new concept, and one with which the power generation industry needs to become more familiar for large–scale deployment of CCS. Three leading technologies for capturing CO2 from power generation are being demonstrated around the world.
Post-combustion capture processes separate CO2 from combustion exhaust gases using a liquid solvent. Once absorbed by the solvent, heating removes the CO2 as a high-purity stream. This technology is widely used to capture CO2 from natural gas and/or for use in the food and beverage industry. Other capture technologies, including those that use membranes and adsorbents, are under development.
Pre-combustion capture processes convert fuel into a gaseous mixture of hydrogen and CO2. The hydrogen is separated and can be burnt without producing any CO2; the CO2 can be compressed for transport. The fuel conversion steps required for pre-combustion are more complex than the processes involved in post-combustion, making it more diffi cult to apply the technology to existing power plants. Pre-combustion capture is used in industrial processes, but has not been demonstrated much in larger power generation projects.
Carbon capture is an established commercial process in natural gas and chemical production.
Carbon capture is being demonstrated in power generation.
Commercial–scale capture projects in power generation are under construction.
More work is urgently required to demonstrate capture in the cement and iron and steel industries.
Primary challenges for capture are related to process economics.

THE GLOBAL STATUS OF CCS | 201394
CA
PT
UR
E
5
Oxyfuel capture processes use oxygen rather than air for combustion of fuel. This produces an exhaust gas comprising mainly water vapour and CO2 that can be easily separated to produce a high-purity CO2 stream.
LSIPs demonstrate technology that may operate at a commercial scale in the next decade. The breakdown of projects by industry is shown in Figure 5.2. Capture is operational in gas processing and high-purity industries such as hydrogen production, but lagging behind in power generation and other industrial processes. Nevertheless, the two power generation LSIPs under construction are expected to be fully operational in 2014. It is notable that there are at least nine large pilot facilities operating and demonstrating post-combustion capture from coal–fi red power generation. In total, these facilities can capture more than 500,000 tonnes per annum (tpa) of CO2.
FIGURE 5.2 Breakdown of LSIPs by sector
0
5
10
15
20
25
30
Planning Execute Operate
Num
ber
of
LS
IPs
Power generation Industrial processing

THE GLOBAL STATUS OF CCS | 2013 95
CA
PT
UR
E
5
5.2 CCS IS HAPPENING IN INDUSTRIAL PROCESSESReductions in emissions from industrial processes are essential to achieve agreed climate change mitigation targets. In its 2013 edition of the Technology Roadmap: Carbon Capture and Storage (IEA, 2013a), the IEA indicates that 45 per cent of the CO2 captured between 2015 and 2050 will be from industrial processes. The IEA makes the point that:
… in contrast to the power sector, several of the world’s most carbon-intensive industries have no alternatives to CCS for deep emissions reduction because much of the CO2 is unavoidably generated by their production processes, and not from fuel use. CCS will thus be essential for these sectors.
To achieve this level of deployment, capture technologies must be demonstrated by 2020, especially in the iron and steelmaking and cement production industries. CCS is particularly important in this sector because there is limited potential to move away from fossil fuels.
The industrial processes sector comprises natural gas processing and other industries. Other industries with high-purity sources of CO2 include:
chemical production
coal gasifi cation
CTL
ethanol production
fertiliser production
hydrogen production
synthetic natural gas.
The remaining industrial processes, in which CO2 streams are much more dilute, are:
cement production
iron and steel production (blast furnace gas)
oil refi ning.
The effort required for capture is proportional to the purity of the gas stream; it requires less additional energy to capture CO2 from high-purity sources. In many instances (e.g. ethanol production), capture from high-purity sources – where the gas stream is nearly 100 per cent CO2 – simply involves capturing the fl ue gas, removing the water, and compressing the resulting gas. Capture from a cement plant is similar to capture from a coal–fi red power plant, in that the gases are a mixture of CO2, oxygen, nitrogen, and others, making the capture process more diffi cult.
In April 2013, a report was provided to the CEM (IEA, 2013b) to update it on the application of CCS to industrial processes and make policy recommendations. CCS from high-purity sources is already commercially deployed. This generally refl ects the low additional cost of compressing and transporting the CO2, and the benefi cial use of CO2 for EOR. However, there are technical and commercial challenges for other industry sectors. In general, the main commercial challenge is that many of these industries compete internationally, in contrast to the power generation market, which tends to operate at a domestic/regional level. There is also the need to customise capture technologies to different industry sectors, which requires an active and funded program for pilot testing, right through to demonstration, at a commercial scale. Funding programs to date have focused on the power generation sector; there are not many pilot projects in other industries.
Nevertheless, these sectors are making some progress.

THE GLOBAL STATUS OF CCS | 201396
CA
PT
UR
E
5
High-purity sourcesHigh-purity CO2 source industries include natural gas, fertiliser, synthetic natural gas, and hydrogen. Twelve LSIPs – eight in natural gas processing and four in high-purity industries – were in operation during 2013, including four new operational projects, Air Products, Coffeyville and Lost Cabin, all in the US, and Petrobras Lula in Brazil. Air Products captures CO2 from a steam methane reformer to produce hydrogen, which is then used at the refi nery for producing liquid fuels. The other three high-purity projects are in fertiliser production and synthetic gas production.
Additional industrial projects are under construction and will become operational in the next couple of years, as follows:
Agrium is an existing project producing fertiliser. Pre-combustion capture will be retrofi tted to the plant to capture around 585,000 tpa of CO2. The CO2 capture is expected to become operational in 2015.
The Illinois Industrial Carbon Capture and Storage Project builds on the Decatur demonstration project; the construction of additional capture facilities is underway. When operational in 2014, the project will capture 1 Mtpa of CO2 from ethanol manufacturing.
The Gorgon project has constructed the fi rst of three amine absorber columns on the plant site. This project will capture CO2 from natural gas processing. The natural gas will be liquefi ed to LNG and exported. The project is expected to be operational by 2015.
The NorthWest Redwater project will capture CO2 from a gasifi er that uses refi nery waste from the North West Sturgeon Refi nery to produce hydrogen. The CO2 will be captured using the Lurgi Rectisol process from this hydrogen production process; the hydrogen will be used for processing bitumen into liquid fuels. The project is expected to be operational in 2015.
The Quest project commenced construction in late 2012. This project will capture CO2 from a steam methane reformer from the Scotford Upgrader to produce hydrogen. The project will use a proprietary technology from Shell Global Solutions. The hydrogen will be used to produce liquid fuels from oil sands.
The Uthmaniyah project is under construction in the Eastern Province of Saudi Arabia. The plan is to capture 0.8 Mtpa of CO2 at the Hawiyah natural gas processing plant and transport it by pipeline to the depleted Uthmaniyah area of the Ghawar fi eld. It is expected to commence operation in 2014 with a total duration of three to fi ve years.
Two LSIPs in planning in the iron and steel production are discussed later in this chapter.
Cement productionCapture of CO2 from cement production can be achieved using either post-combustion capture or oxyfuel combustion. The advantage of post-combustion capture technology is that it can be readily retrofi tted to the fl ue gases from a kiln, but an additional energy source is required to reclaim the solvent. Desktop studies indicate that oxyfuel combustion may be more effi cient, although there are operational issues that will need to be resolved, such as the effect of air leakage into the kiln. There are currently no LSIPs in the cement sector, but several pilot–scale activities are demonstrating CCS for cement production.
Post-combustion capture is being trialled in the US, Norway, and Taiwan. Construction began on the Skyonic project in Texas, US, in 2013. This project aims to directly capture up to 83,000 tpa of CO2 from a cement kiln and use it to produce sodium bicarbonate and hydrochloric acid. When operational, it will be the largest capture facility applied to a cement plant in the world.
A pilot–scale test is currently underway at a cement plant in Brevik, Norway. This will test Aker Solutions' amine-scrubbing capture technology. An alternative process, which uses calcium looping, is operational in Taiwan at the Taiwan Cement Corp and capturing approximately one tonne of CO2 per hour.
The European Cement Research Academy (ECRA) is completing a range of desktop and feasibility studies for demonstrating oxyfuel combustion at a cement plant. The aim is to develop and design a

THE GLOBAL STATUS OF CCS | 2013 97
CA
PT
UR
E
5
3,000 tonnes per day (tpd) cement plant using oxyfuel combustion technology. The work is expected to be completed in mid-2015; ECRA’s technical advisory board will then decide whether or not to build a demonstration plant.
Capture activity in the cement industry is currently limited to desktop studies and early-stage pilot projects. These are necessary steps to ensure that capture is ready for deployment in the cement sector beyond 2020.
Iron and steel productionThe iron and steel industry has adopted a different approach to demonstrating CCS. Many iron and steel producers have joined together to establish a consortium – ULCOS – to develop one major CCS demonstration that is applicable to iron and steelmaking. Most of the opportunities for CO2 capture in the iron and steel sector come from use of the top gas from the blast furnace. Another opportunity involves capturing CO2 from the onsite power generation plant, but this uses the same technology as capture from coal– and/or gas–fi red power generation.
In Europe, LIS (formally ULCOS Blast Furnace) is operated by the ULCOS consortium and led by ArcelorMittal, while in the UAE, the Emirates Steel Industries project is part of the Masdar Network. If both projects are operational by 2020, they will capture a total of 1.5 Mtpa of CO2.
The ULCOS Blast Furnace project (now restructured and named LIS) will capture CO2 from the top gas of a blast furnace and explore a range of storage options. The project is currently at the Defi ne stage.
The Emirates Steel Industries project uses the direct reduction iron-making process instead of a blast furnace. The advantage of this process is that it produces a very pure stream of CO2 (>98 per cent), so capture only involves dehydration and compression of the gas. The steel plant is in operation; it is expected that the capture plant could be operational by 2015. The CO2 will be used for EOR.
Other research activities in the iron and steel industry include the POSCO capture trial in Korea and the COURSE50 project in Japan. Both have completed trials using different capture technologies on the exhaust gases from blast furnaces.
Biomass conversionA single CCS project captures CO2 from biofuel. This is the Illinois Industrial Carbon Capture and Storage Project in the US. The plant produces ethanol and, in so doing, removes CO2 from a process stream. The project has been operational at around 300,000 tpa of CO2, planned to increase to 1 Mtpa of CO2 in 2014, which will make it an LSIP.
Refi neriesIn the refi nery industry one project is operational, Air Products, and two projects are under construction – NorthWest Redwater, and Quest. These projects focus on removing CO2 from the hydrogen production processes that are part of the broader refi nery of bitumen and/or oil sands. Combined, they will capture 3.4 Mtpa of CO2 by 2016. These LSIPs will not capture CO2 from the more traditional processes in a refi nery, such as crackers and reformers.
The Carbon Capture Project (CCP) was established in 2000 and has an active program looking at capture from a refi nery process. The current phase of CCP plans two demonstration projects. The fi rst is a pilot plant facility using oxyfuel combustion on a fl uid catalytic cracker located at the Petrobras research complex in Brazil. The aim is to show that capture technology can reduce CO2 emissions from the cracker by up to 95 per cent, which may reduce the total emissions at a refi nery by 20–30 per cent. The second project is considering the use of oxyfuel combustion in a once-through steam generator in Canada. The results from these projects are currently restricted to CCP members.

THE GLOBAL STATUS OF CCS | 201398
CA
PT
UR
E
5
A larger demonstration project using fl ue gases from an oil refi nery is the CO2 Technology Centre Mongstad (TCM) in Norway. This facility is able to use gases from a residue catalytic cracker (with a CO2 concentration of approximately 13 per cent) and fl ue gases from a gas–fi red combined heat and power plant (with a CO2 concentration of around four per cent). TCM has three separate areas for different capture technologies, two of which are currently utilised. The plants available are amine and chilled ammonia. The third site is still to be developed. The facility has been operational since May 2011 and is specifi cally designed for vendors to test their solvents and the impact of the solvents on the capture facility.
5.3 CCS IN POWER GENERATION IS PROGRESSING BUT MORE WORK IS NEEDEDThe high costs associated with commercial–scale projects in power generation has resulted in the deferral or cancellation of many projects. The completion of feasibility and FEED studies are instructive but also illustrate that more innovative solutions need to be considered. For example, the TCEP project uses a combination of revenue streams to make the commercial case.
Large–scale integrated projects (LSIP)There are 30 power generation projects (Table 5.1), including two under construction (Execute stage) and nine at advanced stages of design (Defi ne stage). Of the power generation LSIPs under construction, one will demonstrate post-combustion capture, the other will demonstrate pre-combustion capture. Both are expected to be fully operational in 2014. The majority of projects are at the early stages of Identify and Evaluate.
It would appear that pre- and post-combustion are the preferred technologies for power generation, as a high number of projects have selected these technologies. This refl ects the fact that PCC can be readily retrofi tted to an existing power station and that IGCC units are expected to be more effi cient. Moreover, gasifi cation may provide alternative sources of revenue because a plant can be confi gured to produce both chemicals and power.
Oxyfuel combustion technology is being demonstrated at power stations, for example in Australia’s Callide project. Oxyfuel capture technology can be retrofi tted to existing power stations but may require a substantial rebuild of the existing boiler. There are currently fi ve power generation projects proposing to use oxyfuel combustion technologies.
Overall, there has been a signifi cant decrease in the number of active LSIPs in power generation in 2013, mainly refl ecting a lack of fi nancial incentives for these projects to progress. Funding has been used effectively across the globe to complete feasibility and FEED studies on these projects, and the knowledge gained is being shared. But funding is generally not available to enable projects to proceed beyond an FID and enter construction. However, two projects have been able to make this step, Boundary Dam in Canada, and Kemper County in the US.
The Boundary Dam power plant retrofi t includes an upgrade of the power generation process and capture of the CO2 produced, which will mainly be used for EOR. Currently under construction, the power plant is expected to be operational by the end of 2013, but the capture part of the plant will not be fully operational until the early part of 2014. This plant uses Cansolv technologies.

THE GLOBAL STATUS OF CCS | 2013 99
CA
PT
UR
E
5
The Kemper County project is a new 582 MW IGCC power station under construction in Mississippi, US. The project aims to capture 65 per cent of emissions, equivalent to 3.5 Mtpa of CO2, and is expected to be operational in 2014. The capture process is a Selexol separation process. Once operational the Kemper County project will demonstrate commercial–scale IGCC combined with CCS.
TABLE 5.1 Power generation LSIPs by capture process and overall lifecycle stage
CAPTURE PROCESS OVERALL PROJECT LIFECYCLE STAGE
Identify Evaluate Defi ne Execute Operate Total
Post-combustion 1 7 4 1 13
Pre-combustion 2 5 3 1 11
Oxyfuel combustion 2 1 2 5
Not yet decided 1 1
Total 6 13 9 2 0 30
Large–scale test facilitiesProgress of commercial–scale CCS projects in the power generation sector is slow, as plants take many years to construct. For example, construction of the Kemper County project commenced in 2010, but the plant will only become operational in 2014. The use of large pilot facilities, however, does allow demonstration of capture technology applied to coal–fi red power generation in a shorter time frame. Often, these test projects provide valuable information to assist in the design and development of commercial–scale plants and offer a range of lessons. Indeed, a wide range of pilot test facilities have similar objectives, which can be grouped as follows:
demonstrating the technical feasibility of a particular technology
obtaining economic data
evaluating the process and how it can be integrated into a power plant
gaining operational experience
gathering data to support large–scale projects.
Most of these facilities are driven by capture technology vendors, whose objective is to confi rm the capture technology at an industrially appropriate scale. While partly funded from public sources, the vendors are very active in these projects because the results will assist in improving the technologies and readying them for commercial deployment. These types of projects also allow power generators and the broader industry sector to gain access to, and become familiar with, capture technology.
Table 5.2 shows the range of large pilot facilities for power generation around the world. While not exhaustive, the list illustrates that there are diverse PCC facilities, indicating the relative maturity of this capture technology. This is also refl ected in the number of LSIPs that propose to use PCC as their capture technology. There are many other projects at a smaller scale (e.g. 1,000 tpa), which are mainly pilot plants used for researching new capture materials and processes to confi rm that the capture technology can be used at an industrially appropriate scale.
The main purpose of these projects is to demonstrate the technology at a scale relevant to the industry and learn more about how capture can be applied to power generation. The capture facility at the Boryeong Power Station is featured in Box 5.1.

THE GLOBAL STATUS OF CCS | 2013100
CA
PT
UR
E
5
TABLE 5.2 Range of large pilot facilities for power generation
PLANT COUNTRY APPROX. CAPACITY (TPA CO2)
STATUS
Under construction
Operational Completed
Post-combustion Capture
Aberthaw UK 15,000 Y
Boryeong Korea 80,000 Y
Ferrybridge UK 15,000 Y
Guodian China 10,000 Y by 2015
Hazelwood Australia 15,000 Y
Mountaineer US 100,000 Y
Plant Barry US 167,000 Y
Shand Canada 36,000 Y by 2014
Shanghai Shidongkou China 120,000 Y
Shengli China 40,000 Y
Technology Centre Mongstad*
Norway 100,000 Y
Wilhelmshaven Germany 25,000 Y
Pre-combustion Capture
HuaNeng GreenGen China 80,000 Y by 2015
Nuon Buggenum The Netherlands
10,000 Y
Puertollano Spain 35,000 Y
Osaki CoolGen Japan 200,000 Y by 2017
Wakamatsu EAGLE Japan 8,000 Y
Oxyfuel Combustion Capture
Callide Australia 25,000 Y
CUIDEN Spain <10,000 Y
Huazhong China 50,000 Y by 2014
Lacq Pilot CCS Project France 75,000 Y
Schwarze Pumpe Germany 60,000 Y
* Note: TCM has two sources of CO2: a 20,000 tpa gas stream from a gas–fi red combined heat and power plant, and an 80,000 tpa stream from a refi nery. This demonstrates how PCC can be applied to oil refi ning.

THE GLOBAL STATUS OF CCS | 2013 101
CA
PT
UR
E
5
Boryeong Power Station, Korea
Korea, through the KEPCO Research Institute (KEPRI), is actively involved in CCS research, development, and demonstration. KEPRI commenced demonstrating a new solvent at a nominal 80,000 tpa power plant at Boryeong in 2013. Boryeong Power Station is located approximately 150 km southwest of Seoul and consists of eight 500 MW supercritical units fi red on bituminous coal, and nine 150 MW combined cycle power plants.
The post-combustion capture pilot plant is able to process a slipstream equivalent to 10 MW (approximately 200 tpd) from the Boryeong power station (unit 8). The plant was constructed between March 2012 and May 2013. KEPCO is testing a proprietary solvent (KoSol-4) in this pilot plant and aims to capture more than 90 per cent of the CO2 from the slipstream at a purity in excess of 99 per cent. The target of between 2.5 and 3.0 gigajoule per tonne (GJ/t) of CO2 means a reduction in regeneration energy of greater than 30 per cent compared to monoethanolamine (MEA).
During design and commissioning of the pilot plant, KEPCO learnt some lessons that they have shared:
solvent performance combined with process improvement are key factors in deciding the energy consumption of the CO2 capture process
testing at the 0.1 MW test bed has been very helpful to the 10 MW project
key parameters, such as CO2 removal rate and steam consumption, remained stable during the operation.
The pilot plant began operating on 24 May 2013.
The project is fi nancially supported by the Korean Government and participating companies, including KEPCO, KOMIPO, KOSEP, KOWEPO, KOSPO, EWP, POSCO E&C, POSCO Engineering, Daelim, and KEPCO E&C.
BOX 5.1
FIGURE 5.3 Boryeong Power Station
Image courtesy of KEPCO.

THE GLOBAL STATUS OF CCS | 2013102
CA
PT
UR
E
5
5.4 METHODS TO REDUCE CAPTURE COSTSMore than 90 per cent of the overall cost of CCS can be driven by expenses related to the capture process. This has led to a variety of efforts to reduce costs through structured research, development and demonstration (RD&D) programs. Cost reductions in capture may be accomplished by the development of new capture technologies and lessons learnt through the experiences of end users. The fi rst focuses on research and development activities, the second on deployment and engineering.
Developing new cost-effective capture technologiesGenerically, energy technologies undergo a common maturation process, transitioning from the bench–scale phase to pilot phase, demonstration phase, and then full deployment. The transition involves an increase in total cost as the project size increases. At the same time, however, the relative cost (i.e. $/MW) decreases as the project size increases.
There is a variety of R&D programs focused on developing new and more cost-effective capture technologies. For example, the US DOE’s National Energy Technology Laboratory (NETL) has R&D programs designed to explore new solvents, membranes, and sorbents that could be used for CO2 capture. These programs focus strongly on developing technologies at the bench scale, and then funding their transition through to pilot scale. The transition from bench–scale to pilot–scale is especially critical from a development perspective, as many new and sometimes unanticipated technical challenges surface during pilot–scale testing. This represents one of the major technical hurdles for new capture technologies.
Because the transition is so critical, it would be useful to have a series of facilities to coordinate pilot testing variables, methods, and procedures. This standardised methodology could reduce overall costs of developing new technologies and provide a more rapid and effi cient means to commercialise new capture technologies. Accordingly, CCS ‘test networks’ – vital to accelerating the development of new capture technologies – have formed, comprising members from across the globe.
The nodes of these networks are the capture centres; the networks and their accompanying centres provide the ability to share performance data within various parameters. For example, the impact of different fuel types and fuel sources on the performance of the capture process can be evaluated. The networks also enable the establishment of global best practices and standards across the industry.
TCM, launched in 2012, is one of the pilot–scale facilities established to evaluate novel capture processes. To share knowledge, in January 2013 TCM launched an international test centre network for carbon capture test facilities. The purpose of the network is not only to share knowledge globally, but to facilitate the development and deployment of new capture technologies. The key aims of the network are to:
gain public confi dence: enabling test centres to build on good practice from around the world and communicate successes to the public and the wider CCS community
address regulator concerns: enabling test centres to individually address concerns of regulators and infl uence regulatory arenas by using the collective thinking and experience of network members
improve organisational effi ciency: by providing members with a global network of expertise to facilitate mutual problem solving of organisational issues
safeguard people: by sharing good practice in health, safety, and environment (HSE) so as to protect staff, assets, and the environment
accelerate technology development: by harmonising testing requirements, the network will create a level playing fi eld to help break down barriers to the successful uptake of novel capture technologies.

THE GLOBAL STATUS OF CCS | 2013 103
CA
PT
UR
E
5
The eight founding members of this network are TCM (Norway), National Carbon Capture Center (US), Southern Company’s Plant Barry (US), SaskPower (Canada), J-Power (Japan), ENEL Engineering and Research (Italy), E·ON (Germany), and Doosan Power Systems (UK). It is anticipated that, in the long-term, knowledge sharing will reduce RD&D costs and accelerate the development and deployment of capture technologies.
One of the US centres that is part of the network is the National Carbon Capture Center (NCCC). The NCCC, located in Wilsonville, Alabama, is operated by Southern Company Services under a cooperative agreement with the US DOE and NETL. The NCCC has the capability to design, engineer, scale-up, construct, and operate pilot plant and engineering–scale carbon capture technologies for power generation. The facility tests and evaluates CO2 control technologies including CO2 capture solvents, mass transfer devices, low–cost water–gas shift reactors, scaled-up membrane technologies, and improved means of CO2 compression. Because it is able to operate under a wide range of fl ow rates and process conditions, research at the NCCC can effectively evaluate technologies at various levels of maturity. The NCCC is primarily focused on post- and pre-combustion approaches.
Cost reductions in the demonstration and deployment phasesAs new technologies transition from the pilot phase to demonstration and deployment, a new series of cost reductions begins to appear. As full–scale deployment of the technologies progresses, end-users are able to benefi t from the experience gained through deployment of the technologies at multiple sites. This experience (or learning) gained from deployment reveals ways to more effi ciently integrate new technologies, thereby resulting in cost reductions. The concept of learning curves and their impact on cost reduction for new energy technologies has been extensively described in the literature. Reductions in both capital and operating costs have been observed to follow the trend illustrated in Figure 5.4. Similar learning curves have been obtained for low-NOX burner deployment, SOX abatement technologies, and even renewable technologies. The knowledge gained through deployment of full–scale capture facilities will create more opportunities to reduce integration costs and thereby drive down overall capture costs.
FIGURE 5.4 Cost reduction of selective catalytic reduction to remove NOx from fl ue gases
1%
1 100010010
10%
100%
Norm
alise
d c
ost
Worldwide installed capacity (GWe)
Operations and maintenance cost Capital cost
Source: Yeh et al. 2005.

THE GLOBAL STATUS OF CCS | 2013104
CA
PT
UR
E
5
As CCS moves toward large–scale commercialisation, stakeholders along the CCS chain will need to address and resolve design and operability details to ensure an integrated project. These range from generation to capture and include transport and storage at a commercial scale. Process simulation and modelling are key tools used by engineers for performing design calculations and analysing operations. Many tools exist for individual CCS chain components and for integration along the CCS chain.
For example, WorleyParsons developed a methodology for the Institute during 2013 to investigate the effect of installing a post-combustion capture facility at a coal–fi red power station. This work provided an independent validation of the vendor’s claims and gave the project proponent additional information to make investment decisions. These types of engineering studies and process tools can allow integration options to be easily identifi ed and assessed.
However, there are still signifi cant challenges in the commercial implementation of CCS. These arise principally from the fact that the whole CCS chain – and, eventually, the whole CO2 transport network – needs to be considered a single system. This will enable design and operation decisions that satisfactorily address the commercial imperatives and risks of the various stakeholders along the chain.
Modelling that uses high-fi delity process models provides a way of rapidly and accurately (depending on the quality of the available cost data) assessing the costs of each option, and an ability to rank and screen options while taking into account technical feasibility. The current set of simulation tools partially addresses these types of problems. Perhaps the most severe limitation is that there is currently no simulation or modelling tool that covers the whole chain to the required level of fi delity and within a single software environment. This necessitates clumsy data transfers between environments and severely limits the opportunity to perform system wide techno-economic analysis and optimisation.
One tool currently in development – gCCS, supported by the UK Energy Technologies Institute – will contain a full complement of models for conventional generation (pulverised coal and combined cycle gas turbine), new-style generation (gasifi cation and oxyfuel), solvent–based carbon capture, compression, transmission, and injection. In addition, it will be possible to incorporate models of other plants, such as air separation units, using existing commercially available capabilities or create custom models that can be incorporated within the environment.
The principal benefi ts of process simulation and modelling are derived from an ability to provide accurate numbers upon which to base techno-economic decisions, such as integration options or assessment of a new capture technology. Many design decisions come down to trade-offs between diverse stakeholders, each of whom is attempting to maximise their revenue or minimise their cost, fi nd an appropriate balance between capital and operating expenditure, and minimise their risk (or at least manage it effectively). Model-based engineering analysis also provides a deep process understanding that can be used to develop or verify new capture technologies.

THE GLOBAL STATUS OF CCS | 2013 105
CA
PT
UR
E
5
5.5 RECOMMENDATIONS AND OUTLOOKCapture in both industrial processes and power generation is progressing, albeit slowly.
Within the industrial processes sector, capture is well established in a range of industries such as natural gas processing, but more activity is needed in sectors such as iron and steel and cement production.
Signifi cant progress will be made in the power generation sector when the two LSIPs currently under construction proceed to commercial operation. This is expected to occur in 2014 and will build on the successes of large pilot facilities, such as Plant Barry's 25 MW plant, and demonstrate commercial–scale CCS from coal–fi red power generation.
Knowledge sharing across the globe and across sectors will be critical to accelerate RD&D and reduce costs, enabling capture to penetrate more sectors. The continued collaboration of large pilot facilities and system simulation tools will assist in knowledge sharing.

THE GLOBAL STATUS OF CCS | 2013106
6
TRANSPORT
FIGURE 6.1 Transport overview
6.1 Overview .................................................................................................................................................... 107
6.2 Expanding CO2 transportation networks ............................................................................. 108
6.3 Pipeline design – the ROAD project ..................................................................................... 111
6.4 Permitting CO2 transport infrastructure – standards and codes ....................... 114
6.5 Financial and commercial models for CO2 transportation networks .............. 115
6.6 Recommendations and outlook ................................................................................................ 117

THE GLOBAL STATUS OF CCS | 2013 107
KEY FINDINGSKEY FINDINGS
6.1 OVERVIEW Safely and reliably transporting CO2 from where it is captured to a storage site is an important stage in the CCS process. Transport of CO2 by pipelines, trucks, trains, and ships is already a reality, occurring daily in many parts of the world. Nevertheless, the scale of transportation infrastructure and investment required to enable large–scale deployment of CCS will be extensive. The total length of pipeline transport to be developed for the 65 LSIPs will be around 6,000 km (Figure 6.2). This is approximately the same size as the existing network of dedicated CO2–EOR pipelines in the US, which transports 48–58 Mtpa of CO2 (DiPietro et al., 2012). However, for CCS to contribute to meeting the IEA 2DS, the estimated distance of CO2 transportation infrastructure to be built in the coming 30–40 years is 100 times larger than currently exists.
Given the scale of CO2 transportation infrastructure required, and the likelihood that pipelines will be responsible for transporting most of CO2, it is important to learn from existing CO2 pipeline operational experience. In this way, best industry practice can be refl ected in new standards for CO2 pipeline design, construction, and operation.
This chapter will examine the expanding CO2 transport networks, as well as the design challenges faced by projects that have to deal with more challenging pipeline operating conditions. It will highlight some of the recent progress made since 2012 in developing an international standard for CO2 pipelines, and introduce some innovative commercial and management aspects associated with these new CO2 transportation developments.
The technology for CO2 pipelines is well established, both on land and under the sea, and CO2 transportation infrastructure continues to be commissioned and built, particularly in the US and Canada. Carbon dioxide pipelines and ships pose no higher risk than is already managed for transporting natural gas and oil.
For CCS to help fulfi l the ambitions of the IEA 2DS, the estimated magnitude of the CO2 transportation infrastructure that will need to be built in the coming 30–40 years is 100 times larger than that of currently operating CO2 pipeline networks. Therefore, the scale of transportation infrastructure and investment required to enable large–scale deployment will be extensive.
Adequate incentives are needed for fi rst mover projects to invest in oversized CCS transport solutions capable of accommodating future CCS projects and large CO2 transport networks.
The construction and operational experience that exists for CO2 transport needs to be shared globally by industry as best practice guidelines and standards, especially given the unique engineering and operating conditions for fi rst-of-a-kind CCS plants.
New international standards are being developed to further embed safe and effi cient operation of CO2 transport infrastructure.

THE GLOBAL STATUS OF CCS | 2013108
TR
AN
SP
OR
T
6
FIGURE 6.2 Pipeline transportation distances provided by LSIPs
Australia
Africa
Number of projects
≤ 50 km 51–150 km 151–250 km 251–350 km >351 km
0 2 4 6 8 10 12 14
On
shore
to
offsh
ore
p
ipelin
e
On
shore
to o
nsh
ore
pip
elin
e
China
Australia
Europe
Canada
Europe
Middle East
United States
6.2 EXPANDING CO2 TRANSPORTATION NETWORKS One of the key milestones achieved in 2013 was by a project that plans to develop shared CO2 transport infrastructure, the Alberta Carbon Trunk Line. With two projects moving into Execute and feeding into the pipeline, the 240 km pipeline network is becoming a reality. The initial supply of CO2 will come from North West Sturgeon Refi nery CO2 Stream and Agrium CO2 Stream, but the Alberta Carbon Trunk Line will be able to collect CO2 from more sources in the Alberta industrial heartland and transport it to existing mature oil fi elds throughout South-Central Alberta. At full capacity, the Alberta Carbon Trunk Line will compress, transport, and store up to 14.6 Mtpa of CO2. This is the equivalent to taking 2.6 million cars off the road annually (Enhance Energy, 2013a).
Prior to commencing the Alberta Carbon Trunk Line project, various local, provincial, and federal permits were acquired. These permits address and protect the interests of the general public, as well as the environment. The Alberta Carbon Trunk Line project is currently working with landowners along the pipeline route to address special construction concerns, compensation, and future use of the land. Once all the land access rights have been secured, the individual lengths of pipe will be laid out along the ‘right of way’ after the topsoil has been removed and put aside for later recovering (see Figure 6.3). The individual joints of pipe will be welded together to form 400–500 m sections, coated to minimise corrosion, and lowered into the ground. Each section will then be welded together to form a complete pipeline. The trench will be backfi lled with the same material that was excavated, and the topsoil replaced once the subsoil surface has been de-compacted. Finally, all pasturelands, native, and previously wooded areas will be seeded to regenerate the original vegetation (Enhance Energy, 2013b).

THE GLOBAL STATUS OF CCS | 2013 109
TR
AN
SP
OR
T
6
FIGURE 6.3 Onshore CO2 transportation – pipeline construction
Another project in Alberta, Canada, that has obtained the necessary permits for its CO2 pipeline is the Shell Quest project. Since 2012, Shell has sought landowner input to determine the fi nal route of the pipeline that will transport CO2 from the Scotford Upgrader to the injection location/s up to 80 km north of the facility (Shell Canada, 2013). In the neighbouring province of Saskatchewan, Cenovus is proposing to build and operate the Rafferty 66 km pipeline that will transport CO2 from SaskPower’s Boundary Dam power station near Estevan to the Cenovus Weyburn unit for EOR. The CO2 from the Boundary Dam CCS project will supplement Cenovus’ current CO2 supply from a coal gasifi cation plant in Beulah, North Dakota (US). Open-house events and individual meetings were held with community members between February and June 2013 and, following receipt of all approvals, construction of the Rafferty pipeline should be complete within a year (Cenovus Energy, 2013).
In the US, much of the existing CO2 pipeline infrastructure was built in the 1980s and 1990s. However, there has been signifi cant new investment over recent years. This includes the 373 km Greencore pipeline, sanctioned at the end of 2012, and the 112 km Coffeyville – Burbank pipe line, sanctioned in mid-2013. A proposal exists to extend the Greencore pipeline further south to access additional CO2 supplies, as well as north into Montana to provide CO2 for more EOR projects. Several LSIPs in the US could be considered extensions to, or components of, existing CO2–EOR pipeline networks, as they are driven mainly by opportunities to increase oil production based on access to new sources of CO2. For example, Summit Power's Texas Clean Energy Project plans to build a 1.6 km pipeline that will connect to the Kinder–Morgan Central Basin Pipeline network, and Air Products is looking to connect to Denbury's 411 km Greenline in Texas. A complete list of the major US CO2 pipelines, as well as the LSIPs that are planning to link into the existing infrastructure, is provided in Appendix E.
In Australia, two projects have made progress on their ‘hub concept’. The South West Hub in Western Australia is preparing its 3D seismic survey and planning for the transportation infrastructure required to connect various sources of CO2 in the area to the designated storage location. The CarbonNet project in Victoria is undergoing a similar process of proving-up storage locations and designing the technical and commercial foundations for its shared transportation infrastructure.
In the Middle East, the Masdar project has made major progress. It has completed its pipeline FEED study and is working toward an FID in order to connect various sources of CO2 in the UAE to an onshore EOR site.
In Europe, particularly in countries around the North Sea, the focus has changed from realising ambitious CO2 networks (in which CO2 from multiple sources is collected and transported by a

THE GLOBAL STATUS OF CCS | 2013110
TR
AN
SP
OR
T
6
shared infrastructure system to one or more CO2 storage or EOR sites) to getting individual projects ‘over the line’. For example, in 2012 the Rotterdam CO2 Hub aimed to capture and store 5 Mtpa of CO2 from anchor projects like ROAD, Green Hydrogen, and Pegasus by 2015, with a vision to expand to 20 Mtpa in 2020–25. Although the longer term vision has not changed, the reality is that ROAD is currently the only project under development in Rotterdam with an FID within reach, and stakeholders in the region are focusing their efforts on getting it over the line. It is understood that the success of these fi rst projects, and related investments in the initial CO2 transportation infrastructure, are key to realising future visions of CO2 networks and hubs. A complete overview of the CO2 network projects that are being planned around the world is provided in Appendix E.
Transporting CO2 offshore Transportation by ship may be an alternative to pipelines in some parts of the world, particularly in regions where there is limited access to nearby CO2 storage reservoirs (Figure 6.4). In March 2013, Chiyoda, in partnership with the University of Tokyo, completed a study on the shipping of CO2. The project looked at using shuttle-ships with an individual capacity of 3,000 tonnes to transport CO2 to offshore storage facilities over distances ranging from 200 km to 1,600 km. The researchers considered common industry practices for transporting liquid CO2, and incorporated sites where CO2 storage in Japan is likely to be pursued for a demonstration of CCS (Chiyoda, 2013).
Three active LSIPs are currently considering shipping their CO2 to offshore storage locations. These include the two CCS projects developed by the Korean Electric Power Corporation, and the Dongguan Taiyangzhou IGCC with CCS Project in the Chinese province of Guangdong. Several European projects around the North Sea are considering CO2 ships as a secondary transport option, but the main focus is on offshore pipelines (see Figure 6.2). The only offshore pipeline for CO2 currently in use is part of the Snøhvit project (Norway), which has been operational since 2008 and covers some 153 km to link Hammerfest to the Snøhvit fi eld under the Barents Sea.
New offshore pipelines are being considered by projects in The Netherlands, Norway, and UK to transport CO2 via pipeline to various offshore storage locations in the North Sea. Projects in Europe that have recently completed FEED studies or detailed designs of their offshore pipeline systems include the 'transport and storage network' developed by National Grid for the Yorkshire & Humber region in the UK; Teesside, developed by Progressive Energy in the UK; Peterhead in the North East of Scotland, developed by SSE and Shell; and ROAD in The Netherlands, which has obtained a permit for its 25 km subsea pipeline.
FIGURE 6.4 Offshore CO2 transportation – shipping

THE GLOBAL STATUS OF CCS | 2013 111
TR
AN
SP
OR
T
6
6.3 PIPELINE DESIGN – THE ROAD PROJECTPipeline engineering is a mature fi eld. However, there are several issues that must be taken into account when dealing with fi rst-of-a-kind projects that have unique operating conditions or cross challenging terrain. One of the key challenges for a CCS demonstration project is safely and effi ciently operating the CO2 stream from an integrated CCS chain. This section will share insights into pipeline design and CO2 stream operation philosophy from one of the fi rst LSIPs in the power sector, ROAD in The Netherlands.
Pipeline routeThe ROAD pipeline system is 25 km long, of which 20 km is offshore. The pipeline starts at the discharge of the CO2 compressor located at the site of the capture plant operated by energy company E·ON. This capture plant is adjacent to the new Maasvlakte Power Plant 3 (MPP3) (Figure 6.5). At the boundary of the E·ON site, the 16 inch pipeline with 50 millimetre (mm) insulation is equipped with a metering station, block valves, and a connection to removable inspection gauges (‘pigs’) to inspect the pipeline condition. The pipeline runs into an existing pipeline corridor of the Rotterdam Port. In this trajectory the harbour railroad is crossed through a fi breglass reinforced protective pipe to avoid damage to the railroad in case of leakage. Next, the pipeline crosses Yangtze Harbour and the Maasgeul waterway by means of horizontal directional drilling (HDD) using a ‘steel in steel’ system. This means that the steel carrying pipe is constructed within a steel outer pipe. After the Maasgeul crossing, the pipeline runs 1 m under the seabed of the North Sea to the injection platform, located in block section P18-A of the Dutch continental shelf, from where the CO2 will be injected into the reservoir 3.5 km below the seabed.
FIGURE 6.5 Proposed location of capture unit: Maasvlakte Power Plant 3
Design parameters and dataA full fl ow assurance study (FAS) of the ROAD system has been performed to analyse the CO2 fl ow regimes and determine the operating and boundary conditions of transport and storage. Simulations of the entire system were performed, from the inlet of the transport pipeline onshore to the offshore reservoir. Based on data from the engineering contractor and platform operator the design parameters for the transport system were determined.
Image courtesy of E.ON.

THE GLOBAL STATUS OF CCS | 2013112
TR
AN
SP
OR
T
6
CO2 COMPOSITION
An analysis was conducted to fi nd out the effects of gas composition on the thermodynamic behaviour of the CO2 stream compared to pure CO2. Impurities or by-products such as nitrogen, methane, and hydrogen may change the density of the CO2 stream, which could, for example, affect the pressure needed to transport CO2 in a dense phase (as opposed to a gaseous phase). Moreover, combinations of impurities might infl uence the physical properties of the CO2 stream differently to impurities from a single component. Knowing the characteristics of a gas mixture that comprises CO2 and impurities is therefore important to properly engineer a CO2 transport system. The impurities expected for ROAD, based on the data provided by the engineering contractor, are presented in Table 6.1.
TABLE 6.1 Impurities in the CO2 stream in parts per million by volume (ppmv)
NITROGEN (N2) WATER (H2O) OXYGEN (O2) ACETALDEHYDE (C2H4O)
ARGON (Ar)
≤350 ppmv ≤50 ppmv ≤50 ppmv ≤10 ppmv ≤7 ppmv
Effects found were minor and within the range of accuracy, so simulations for the fl ow assurance studies were performed based on 100 per cent CO2.
SYSTEM FLOW RATES, TEMPERATURES, AND PRESSURES
ROAD is designed to deliver 90 per cent capture effi ciency on 250 MWe equivalent of the fl ue gas (EEPR grant requirements), which equates to a fl ow rate of 47 kilograms per second (kg/s) of CO2. With a 40 per cent minimum operating fl ow of the compressor, this means a minimum operating fl ow of 18.8 kg/s; based on average operating hours, this equates to approximately 1.1 Mtpa.
Based on equipment already at the platform and in the well, the minimum temperature of the CO2 at the wellhead is set at -10°C. To avoid hydrate formation at the bottom hole, the minimum CO2 temperature during injection has to stay above 15°C. The storage system has to fi ll the reservoir until the pressure is approximately 300 bar starting from a pressure of approximately 20 bar. The maximum fi lling pressure has to be below the pressure of the surroundings to make sure the CO2 will never leave the formation.
The maximum operating pressure at the pipeline inlet is determined by the compressor and is initially set at an absolute pressure of 125 bar. The minimum operating pressure is also set by the compressor and is 40 bar. At the platform, the compressor has to be able to increase the CO2 pressure above the pressure at the entrance of the well piping, as the density of the CO2 is such that the CO2 is 'falling' into the well piping. No additional compression is required for fl ow into the well until the pressure reaches 300 bar.
The ROAD transport system will transport the CO2 by a pressure drop that is generated between the compressor discharge and the reservoir. At every stage of the process, the only variables available to the operator are the temperature of the CO2 entering the pipeline (in the range of 40–80°C, limited by cooling water availability) and the absolute pressure (in the range 40–125 bar, determined by the compressor).

THE GLOBAL STATUS OF CCS | 2013 113
TR
AN
SP
OR
T
6
Control and operating philosophy The FAS carried out for the ROAD project has shown that under most of the operating conditions the fl ow in the pipeline is homogeneous and stable. In the fi rst phase of the operation (for well pressures from 30–73 bar) the CO2 is transported in the gas phase and the required pipeline entrance temperatures run initially at 80°C, decreasing to 60°C.
As the reservoir pressure increases, the CO2 in the pipeline moves into a dense phase, increasing the possibility of a two-phase fl ow (gas and liquid CO2). Under certain operating conditions, gas and liquid may not be evenly distributed throughout the pipeline, but instead travel as large plugs (or ‘slugs’) of mostly liquid or mostly gas. To avoid slugs, the CO2 temperature at the pipeline entrance should be below 60°C and up to 200 bar reservoir pressure, decreasing to 40°C at an absolute reservoir pressure of 300 bar.
To lower the required operating pressure and save considerable amounts of compression energy, the FAS investigated the use of a control valve at the injection platform. This valve increases the pipeline pressure without changing the pressure/density regime in the well piping. The increased pipeline pressure forces the CO2 fl ow into single phase operation, thus avoiding two-phase fl ow and unstable slugs.
SYSTEM FLEXIBILITY – START-UP AND SHUTDOWN
The operation of the MPP3 power plant and the CO2 capture and storage system of ROAD are largely governed by economic parameters, so it is likely that frequent start-ups and shutdowns will be necessary. The frequency of these non-steady-state operations cannot be predicted, but because of their critical nature, they need special attention.
Basically, there are two modes of start-up. The fi rst mode involves using the compressor to pressurise the pipeline to a level at which single phase is obtained. After the single phase is reached in the pipeline, the valves at the platform are opened to allow the gas to enter the well piping. The disadvantage of this method is that the fl ow in the well piping tail will reach very high velocities, possibly causing vibration and damage to the pipe.
The second, more preferable, mode involves opening the well pressure control valve at the platform as soon as the pressure in the pipeline reaches the wellhead pressure. Even though the pipeline may then still contain a considerable amount of liquid CO2, it has been calculated that liquid slugs in the two-phase CO2 stream will not cause dangerously high pressure spikes (the maximum will be about 115 bar, well below the 140 bar mechanical design pressure of the system). Operational staff will carefully monitor temperatures and pressures both at the wellhead and control valve on the platform; as soon as the pipeline content is in a single phase, the fl ow rates and pressures can be adjusted to ensure a stable operating regime.
The start-up will be quicker if the pipeline is pressurised and heated with reduced contents. It is therefore an advantage to heat the pipeline contents to the highest possible temperature (close to 80°C) before a planned shutdown. After the pipeline has reached the most favourable conditions for shutdown and cooled down, the compressor discharge valve is closed. The pipeline then empties into the well as long as a positive fl ow is maintained. When the pipeline pressure comes close to the wellhead pressure, the platform control valve should be closed, as the pipeline pressure at the platform should always stay above the wellhead pressure to avoid backfl ow.
These start-up and shutdown procedures, as well as variations of them, are described in more detail in a special report, ‘Flow Assurance and Control’, prepared by the ROAD team for the Global CCS Institute (see ROAD, 2013).
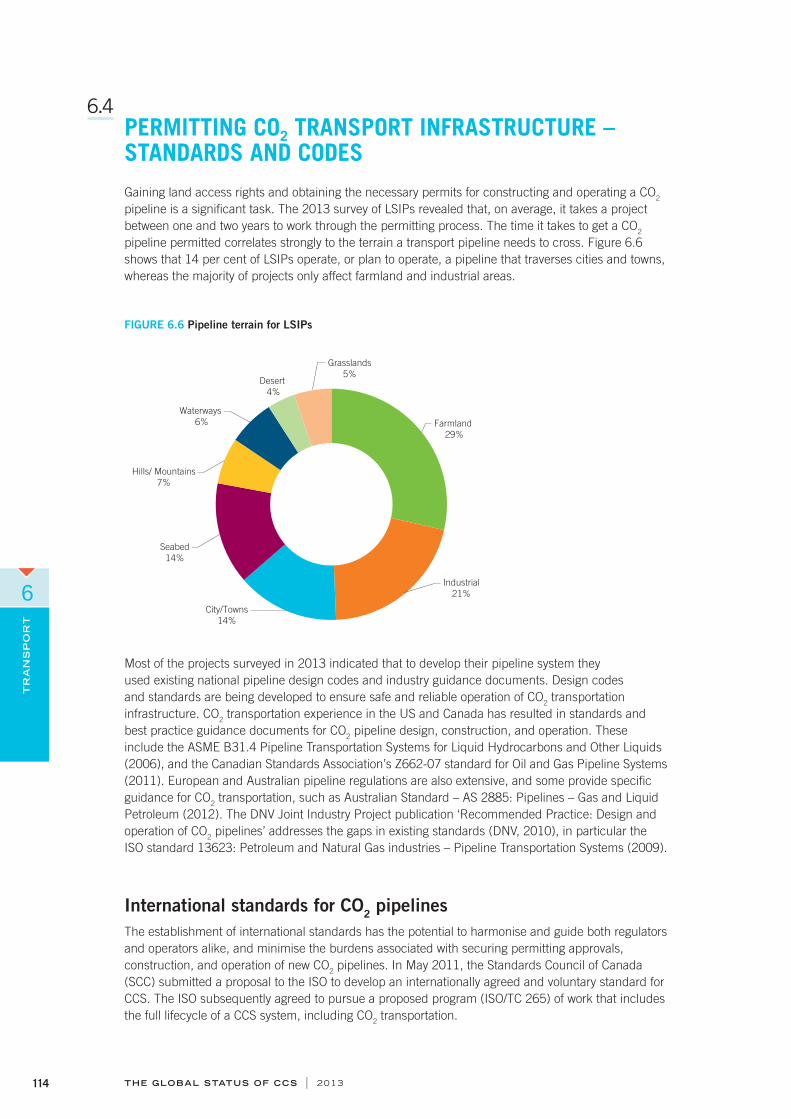
THE GLOBAL STATUS OF CCS | 2013114
TR
AN
SP
OR
T
6
6.4 PERMITTING CO2 TRANSPORT INFRASTRUCTURE – STANDARDS AND CODESGaining land access rights and obtaining the necessary permits for constructing and operating a CO2 pipeline is a signifi cant task. The 2013 survey of LSIPs revealed that, on average, it takes a project between one and two years to work through the permitting process. The time it takes to get a CO2 pipeline permitted correlates strongly to the terrain a transport pipeline needs to cross. Figure 6.6 shows that 14 per cent of LSIPs operate, or plan to operate, a pipeline that traverses cities and towns, whereas the majority of projects only affect farmland and industrial areas.
FIGURE 6.6 Pipeline terrain for LSIPs
Farmland
29%
Industrial
21%
City/Towns
14%
Seabed
14%
Hills/ Mountains
7%
Waterways
6%
Desert
4%
Grasslands
5%
Most of the projects surveyed in 2013 indicated that to develop their pipeline system they used existing national pipeline design codes and industry guidance documents. Design codes and standards are being developed to ensure safe and reliable operation of CO2 transportation infrastructure. CO2 transportation experience in the US and Canada has resulted in standards and best practice guidance documents for CO2 pipeline design, construction, and operation. These include the ASME B31.4 Pipeline Transportation Systems for Liquid Hydrocarbons and Other Liquids (2006), and the Canadian Standards Association’s Z662-07 standard for Oil and Gas Pipeline Systems (2011). European and Australian pipeline regulations are also extensive, and some provide specifi c guidance for CO2 transportation, such as Australian Standard – AS 2885: Pipelines – Gas and Liquid Petroleum (2012). The DNV Joint Industry Project publication ‘Recommended Practice: Design and operation of CO2 pipelines’ addresses the gaps in existing standards (DNV, 2010), in particular the ISO standard 13623: Petroleum and Natural Gas industries – Pipeline Transportation Systems (2009).
International standards for CO2 pipelines The establishment of international standards has the potential to harmonise and guide both regulators and operators alike, and minimise the burdens associated with securing permitting approvals, construction, and operation of new CO2 pipelines. In May 2011, the Standards Council of Canada (SCC) submitted a proposal to the ISO to develop an internationally agreed and voluntary standard for CCS. The ISO subsequently agreed to pursue a proposed program (ISO/TC 265) of work that includes the full lifecycle of a CCS system, including CO2 transportation.

THE GLOBAL STATUS OF CCS | 2013 115
TR
AN
SP
OR
T
6
The working group on CO2 transport (IS/TC 265/ WG2 ‘CO2 Transportation’) met for the fi rst time in June 2013 and defi ned the scope of work as follows.
Based on existing standards for transportation of gaseous or liquid media the new CO2 standard will defi ne additional requirements or recommendations for CO2 transportation by pipelines. Special care has to be taken in the design phase to select the right material, wall thickness, internal corrosion protection etc. Construction, testing, operation, maintenance and abandonment of pipeline systems used for transportation of CO2 have also to be taken into account. This International Standard will include aspects of CO2 stream quality assurance as well as converging CO2 streams from different sources. There is also a need to specify the purity, composition and concentration of the CO2 stream delivered to the pipeline system boundary. It is also important to take into account the thermodynamics and phase behaviour of the CO2 stream during design and operation of the pipeline system. Health, safety and environment specifi c to CO2 transport and monitoring will also be considered.
Although ISO standards can take a long time to develop, several CCS project developers expect that the outcome of the ISO work will have a signifi cant impact on current and future project development practices. The work on international standards for CO2 pipelines is expected to be completed in 2015. It is not uncommon for regulators to implement ISO standards in regulations or to oblige industries to take them up. Furthermore, standardisation of CCS practices may increase public acceptance of CCS operations if they are certifi ed.
6.5 FINANCIAL AND COMMERCIAL MODELS FOR CO2 TRANSPORTATION NETWORKSTechnical and legal barriers to CCS and risks associated with the technology are diminishing. A serious obstacle to growth of the CCS industry, however, is diffi culty in building a sound commercial case for the development and operation of CCS infrastructure. CO2 transport costs may be in the order of two to fi ve per cent of the investment needed for a complete CCS facility, but they are still signifi cant in the demonstration phase, ranging from US$2–7 per tonne of CO2 for transport up to 200 km.
The costs of CO2 transportation differ from project to project due to factors such as expected volumes of CO2 and the corresponding pipe diameters, cost of labour, and economic life of the infrastructure. However, one way to signifi cantly reduce the cost of CCS is to realise economies of scale by sharing a single CO2 transportation and storage infrastructure system among several operators of separate CO2 generating plants. This reduces the cost of transportation and storage services for each plant operator because the costs per unit capacity associated with the development and operation of a single, large capacity infrastructure asset are lower than those associated with multiple, small capacity assets of the same aggregate capacity (NGC, 2013).
The premise that shared transport and storage infrastructure could lead to signifi cant cost savings has been confi rmed by a recent study, guided by a group of major emitters in The Netherlands and Belgium with advanced plans for CCS. The aim of the study, led by the Rotterdam Climate Initiative, was to develop a fi nancial model to assess the economics of alternative CO2 transport and storage options in the North Sea, based on common user infrastructure. The study showed that shared infrastructure development and use was much more benefi cial than multiple ‘point-to-point’ solutions and that tariffs for CO2 transport and storage for emitters in Rotterdam and Antwerp ranged from €5.6 to €20.2 per tonne of CO2 (RCI, 2013).
Another study, commissioned by the Global CCS Institute in 2013, specifi cally aimed to develop capacity charging mechanisms for multi-user CO2 transportation infrastructure. The report, prepared

THE GLOBAL STATUS OF CCS | 2013116
TR
AN
SP
OR
T
6
by National Grid Carbon in the UK, sets out a commercial charging mechanism for the development of, access to, and subsequent use of, a shared CCS infrastructure system. The study also explored options for allocating the proportion of system development and operational costs between members of a shared CCS infrastructure (NGC, 2013). Box 6.1 provides a brief overview of two basic cost allocation models for multi-user CO2 infrastructure.
BOX 6.1
Cost allocation approaches to multi-user CO2 transportation infrastructure In any scenario in which two or more users share an infrastructure system, such as a network of pipelines for transporting CO2, a question arises concerning how the costs and liabilities of developing, operating, and decommissioning the system should be distributed.
In answering this question, it is useful to consider two groups: the users who fi rst commit to the shared capacity (meaning volume of CO2 that may move through a pipeline during a given period), as the ‘fi rst comer’ or ‘anchor tenant’, and those who commit later, as ‘second comers’ or ‘follow-on users’.
Figure 6.7 illustrates a situation whereby part of the ‘capacity–independent costs’ (those not affected by the size of the system actually developed – for example, construction labour), are borne entirely by the anchor tenant alone or, alternatively, shared with follow-on users. In contrast, capacity–dependent costs (for example, construction materials), and therefore total system cost, are affected by the actual constructed system.
If capacity–independent costs were borne entirely by the anchor tenant, follow-on users could purchase additional system capacity at its true incremental cost. This would be signifi cantly lower than the cost allocated to the anchor tenant for the same quantity (see Figure 6.6).
A signifi cant drawback to this cost distribution approach is that a reduction in capacity price, in concert with increasing system capacity, creates a disincentive to early procurement. An alternative approach would be to share capacity–independent costs between all users in exact proportion to the amount owned. This would remove the early mover disincentive and, through the economies of scale associated with increasing system capacity across all users, should incentivise early movers to actively encourage others to participate in the shared system arrangement.
However, the second approach would create a market signal likely to lead to development of a shared infrastructure system with less than optimum capacity. This is because the marginal price of capacity would be higher than that achieved by the fi rst approach. Consequently, the opportunity to secure the investment of potential system users willing to buy capacity at a price somewhere between the prices set by these two approaches would be lost.
To develop an optimal capacity charging mechanism, it is therefore necessary to strike a balance between the need to drive down the marginal price (to enable as many system users as possible to buy capacity), while avoiding disincentives for potential anchor tenants and early mover follow-on users.
Options and formulas for doing this are considered in the report prepared by National Grid Carbon (2013). The report also notes there may be legal requirements for potential users of CO2 transport and storage infrastructure to be provided access to infrastructure in a transparent and non-discriminatory manner, applying principles of fair and open access.
I Box 6.1 continued next page
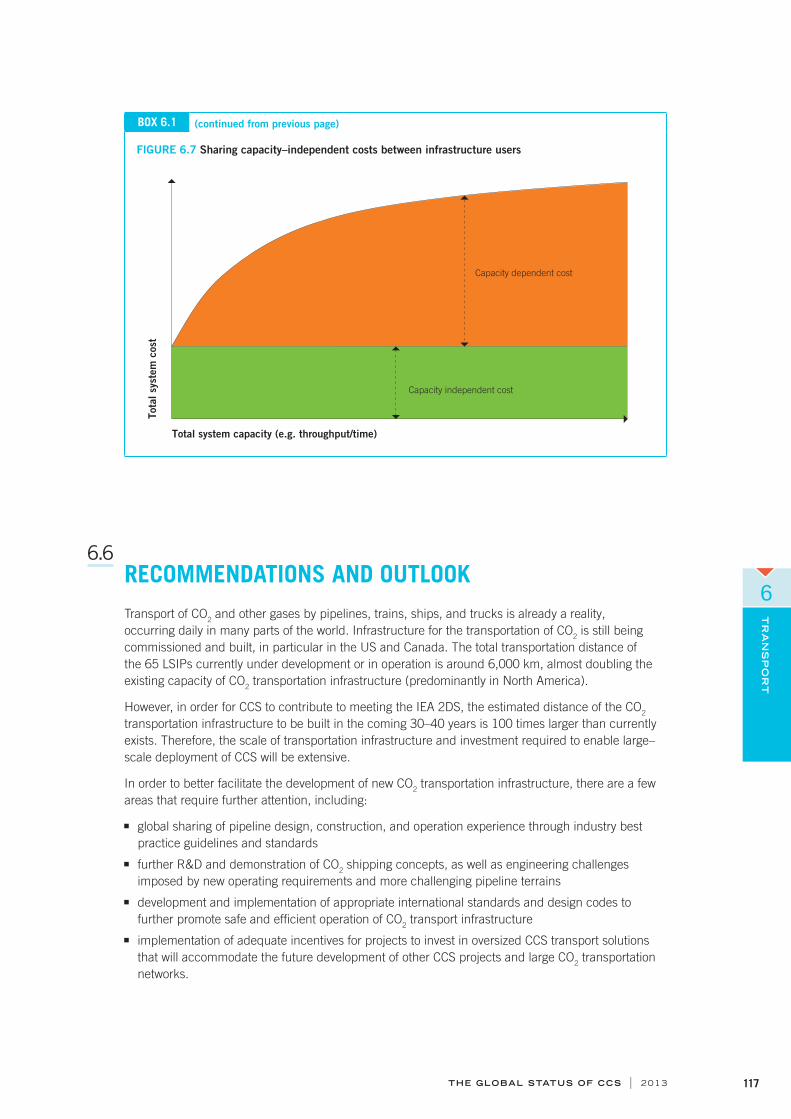
THE GLOBAL STATUS OF CCS | 2013 117
TR
AN
SP
OR
T
6
FIGURE 6.7 Sharing capacity–independent costs between infrastructure users
Total system capacity (e.g. throughput/time)
Tota
l sy
stem
cost
Capacity independent cost
Capacity dependent cost
BOX 6.1 (continued from previous page)
6.6 RECOMMENDATIONS AND OUTLOOKTransport of CO2 and other gases by pipelines, trains, ships, and trucks is already a reality, occurring daily in many parts of the world. Infrastructure for the transportation of CO2 is still being commissioned and built, in particular in the US and Canada. The total transportation distance of the 65 LSIPs currently under development or in operation is around 6,000 km, almost doubling the existing capacity of CO2 transportation infrastructure (predominantly in North America).
However, in order for CCS to contribute to meeting the IEA 2DS, the estimated distance of the CO2 transportation infrastructure to be built in the coming 30–40 years is 100 times larger than currently exists. Therefore, the scale of transportation infrastructure and investment required to enable large–scale deployment of CCS will be extensive.
In order to better facilitate the development of new CO2 transportation infrastructure, there are a few areas that require further attention, including:
global sharing of pipeline design, construction, and operation experience through industry best practice guidelines and standards
further R&D and demonstration of CO2 shipping concepts, as well as engineering challenges imposed by new operating requirements and more challenging pipeline terrains
development and implementation of appropriate international standards and design codes to further promote safe and effi cient operation of CO2 transport infrastructure
implementation of adequate incentives for projects to invest in oversized CCS transport solutions that will accommodate the future development of other CCS projects and large CO2 transportation networks.

THE GLOBAL STATUS OF CCS | 2013118
STORAGE
7
FIGURE 7.1 Storage overview
7.1 Overview .................................................................................................................................................... 119
7.2 CO2–EOR dominates geologic storage ................................................................................. 120
7.3 Dedicated storage activities (or non-EOR storage activities) .............................. 124
7.4 Storage activities in developing countries ........................................................................ 127
7.5 The important role of storage pilots and demonstration projects .................... 132
7.6 Case study – Project Pioneer ..................................................................................................... 134
7.7 Recommendations and outlook ................................................................................................ 135

THE GLOBAL STATUS OF CCS | 2013 119
KEY FINDINGS
7.1 OVERVIEWGlobally, approximately 25 Mtpa of anthropogenic (human made) CO2 can be stored in geological reservoirs by currently operating LSIPs. Of this, incidental storage associated with EOR activity accounts for more than 90 per cent; the remainder is dedicated storage in geological formations containing brine or non-potable water. However, several large–scale storage projects nearing operation will contribute signifi cantly to the proportion of CO2 stored as dedicated sequestration. These projects are important to demonstrate to stakeholders that dedicated geologic storage of greenhouse gases can be accomplished and that CCS is a vital part of the portfolio of low–carbon energy technologies.
Injection of CO2 into geologic formations has been performed for more than 40 years, beginning with attempts to increase oil production from aging reservoirs in western Texas, US. This process, known as CO2–EOR, has proven successful in many reservoirs. As a result, more oil has been produced and more CO2 retained, or stored, within the reservoir. It is estimated that more than 130 CO2–EOR projects are in operation globally, most in North America. In 1996, the fi rst large–scale dedicated CO2 storage project began injecting CO2 into a sandstone reservoir in the North Sea. In operation for around 17 years, it has so far stored more than 14 Mt of CO2. Similar dedicated storage projects generally target deep rocks fi lled with saline or non-potable water, often referred to as saline formations. The CO2 storage capacity of saline formations is signifi cantly greater than that of oil fi elds. Accordingly, more projects targeting deep saline reservoirs will be needed eventually to mitigate CO2 emissions to the atmosphere.
Smaller scale storage sites used for pilot and research projects have been enormously important to the development of large–scale CCS. These projects have improved understanding of processes within the reservoir and increased confi dence in techniques to predict and monitor the long-term fate of injected CO2. Most public concerns about CCS relate to storage. These projects may also offer transparency and further knowledge to address such concerns.
The current 65 LSIPs have the potential to store 122 Mtpa; the storage capacity of the 12 LSIPs in operation totals 25 Mtpa.
CO2–EOR continues to dominate all forms of geologic storage and is driving further deployment in developing countries, as well as development of storage, transport, and capture infrastructure.
The next tranche of dedicated storage projects is being constructed and nearing operation, which will quadruple existing saline formation storage and provide additional demonstrations of large–scale injection and storage of CO2 in different geologic settings.
Early but signifi cant progress is being made to advance CO2 storage programs in Southeast Asia, Middle East, South Africa, Mexico, and Brazil.
Smaller scale storage demonstrations and pilots, along with fi eld tests of monitoring methods, continue to provide critical information, including about the behaviour of subsurface CO2.

THE GLOBAL STATUS OF CCS | 2013120
ST
OR
AG
E
7
Geological settings that could serve as storage reservoirs for CO2 (Figure 7.1) include sedimentary rocks such as sandstones and limestones, which contain saline water in pores (option 1) and offer the greatest volume of storage potential. Most CO2 currently being injected is associated with oil production (option 3). Depleted oil and gas reservoirs (option 4) offer good prospects for storage. Comparatively less work has focused on injecting CO2 into coal seams (option 2).
7.2 CO2–EOR DOMINATES GEOLOGIC STORAGEIt is estimated that during the past 40 years nearly 1 Gt of CO2 has been injected into geological reservoirs as part of CO2–EOR activities. Increasingly, CO2–EOR is considered a means for advancing the deployment of large–scale CO2 storage projects due to its commercial advantages over dedicated storage prospects. Signifi cantly, all four LSIPs that have commenced operation in 2013 were CO2–EOR projects. Historically, the distribution of CO2–EOR operations has been concentrated in North America, in particular Texas, Oklahoma, and New Mexico, but opportunities are being recognised more broadly now in Brazil, Mexico, the Middle East, North Sea, and China.
About 75 per cent of the CO2 used in North American CO2–EOR operations is derived from geological structures containing enormous amounts of naturally occurring CO2 that can be obtained relatively inexpensively. This readily available geologic CO2 is, in part, the reason the CO2–EOR industry fi rst developed in southern US states. Captured (anthropogenic) CO2 contributes the remaining 25 per cent and has historically been derived mainly from gas processing and fertiliser plants, although two coal–fi red power plants will soon deliver CO2 for EOR – Boundary Dam in Saskatchewan, Canada, and Kemper County in Mississippi, US. To achieve reductions in emissions to the atmosphere, CO2–EOR operations must use anthropogenic CO2; virtually all sources of CO2 for EOR projects outside the US are anthropogenic. Access and proximity to a relatively pure and consistent stream of low–cost CO2 is a critical factor limiting the wider deployment of CO2–EOR. Competing technologies may also infl uence the adoption of CO2–EOR.
FIGURE 7.2 LSIP storage types according to region and country
Mass of CO2 (Mtpa)
0 10 20 30 40 50 60 70 80
Not specified
Depleted oil and gas reservoirs
Deep saline formations
Enhanced oil recovery (EOR)
United States Europe Canada China Australia
Other Asia South America AfricaMiddle East
Most, if not all, CO2–EOR operators do not attempt to increase the opportunities for storage of CO2 that their projects offer because, at present, there is no fi nancial or regulatory impetus to consider storage as a component of their business. Instead, the cost of purchasing CO2 encourages companies to minimise the amount required to produce a barrel of oil, and operators always attempt to optimise economic return based on the price of oil and the cost of CO2. For operators to consider making

THE GLOBAL STATUS OF CCS | 2013 121
ST
OR
AG
E
7
carbon storage part of their business, some form of economic CO2 value (e.g. through price, tax, or tax credits) will need to be implemented. Should regulatory or economic drivers come into play, transitioning CO2–EOR operations to more actively include storage, and ultimately become dedicated CO2 storage sites, will involve some modifi cations (and probably additional monitoring and verifi cation) to the operations typically used for oil recovery, including EOR.
An example of a new CO2–EOR project actively pursuing storage is Bell Creek in Wyoming, US, which uses the C02 captured at the Lost Cabin project. This project is being developed by Denbury Resources; monitoring aspects are being developed with the Plains CO2 Reduction Partnership, one of seven US DOE Regional Carbon Sequestration Partnerships. While Bell Creek is a fully commercial EOR operation, characterisation, modelling, and monitoring are directed toward examining long-term storage. One of the well-recognised research programs into CO2–EOR, the IEAGHG R&D Programme Weyburn–Midale CO2 Monitoring and Storage Project (WMP) managed by the Petroleum Technology Research Centre (PTRC) in Canada, completed its 12–year program in 2012. The program produced a book highlighting best practices for validating CO2 geological storage (Hitchon, 2012) and a special volume on specifi c technical work in the International Journal of Greenhouse Gas Control (Wildgust et al., 2013). From a public communication perspective, core messages derived from this project are the focus of a collaborative exercise discussed in Chapter 8 of this report.
How incidental storage with EOR worksCO2–EOR can be applied to a range of reservoir settings: sandstones, limestones, and dolostones; in structural or stratigraphic traps; in small isolated build-ups or giant fi elds; and onshore or offshore (the fi rst commercial offshore CO2–EOR project entered operation in June 2013 at the Petrobras Lula Oil Field CCS Project, Brazil). Limitations to deployment are largely infl uenced by the depth (temperature) of the reservoir, oil composition, previous oil recovery practices, and internal reservoir features that may hinder effective distribution of the injected CO2. Figure 7.3 illustrates the CO2–EOR process.
FIGURE 7.3 The CO2 enhanced oil recovery process
The CO2 is injected as a compressed liquid that dissolves into the oil. Conversely the oil dissolves into the dense CO2. Depending on the pressure and temperature of the reservoir and oil type, the CO2 and oil may mix to become a single phase (miscible). Miscibility causes the oil to swell slightly and become less viscous, so that it fl ows within and through the reservoir pores more easily. The oil then comes to the surface, the well pressure decreases, and the once miscible CO2 un-mixes from the oil.

THE GLOBAL STATUS OF CCS | 2013122
ST
OR
AG
E
7
At the surface, the CO2 can be collected, dehydrated, compressed, and re-injected into the reservoir. This recycling reduces the need to purchase additional CO2 and effectively establishes a closed-loop use of CO2. It also avoids emitting the CO2 to the atmosphere.
Operators try to be as effi cient as possible with the use of CO2 as it is one of the variable cost components of a project. A major factor in recovery effi ciency is the retention of CO2 within the reservoir. A large portion of the CO2 injected (generally considered to be 30 to 40 per cent, but this is variable for different reservoirs) will not return to the surface because it gets trapped in pore channels or stuck on mineral surfaces. This ‘loss’ of CO2 to the oil production cycle is actually a form of geologic storage, as the CO2 will be contained indefi nitely within the reservoir. This unavoidable mechanism associated with CO2–EOR is sometimes referred to as incidental storage. Moreover, as the injected CO2 that does come out with the oil will be captured and re-injected, a similar proportion of the CO2 from this cycle of injection will be stored incidentally. As the cycle is continually repeated, more of the CO2 will be progressively retained through incidental storage so that all the purchased CO2 will eventually reside within the geologic reservoir. Melzer (2012) describes this mechanism in detail and indicates that essentially all purchased CO2 for a CO2–EOR project will be securely trapped in the subsurface, with any losses very minor and mainly related to surface activities.
During the course of a CO2–EOR operation, the daily amount of CO2 purchased is about constant, partially offsetting that lost through incidental storage and continued expansion of the fl ood. Because of the growing cumulative injection of purchased CO2, the amount of recycled CO2 will correspondingly increase so that the daily rate of total CO2 injected (recycled plus newly purchased) will also increase during the initial to mid-stages of the fl ood. This leads to a discrepancy between the total amount of CO2 injected and that stored, which can be a source of confusion when discussing storage associated with CO2–EOR. Again, the total amount injected includes CO2 injected multiple times through the recycle process, but the total amount eventually stored is essentially the amount purchased (Figure 7.4). At some point, the amount of recycled CO2 may surpass that of new, purchased CO2.
FIGURE 7.4 Relative increase in recycled CO2 being used compared to newly purchased CO2 during the course of a CO2–EOR operation
Time
Time
Oil production (barrels)
Time from C02 injection to incremental oil production
Point of economicalproduction shut-down
Start CO2 EORoil production
CO2 injection (tonnes)
Start C02
injection
Purchased C02
Recycled C02
Source: Jakobsen et al., 2005.

THE GLOBAL STATUS OF CCS | 2013 123
ST
OR
AG
E
7
Storage potential associated with CO2–EOREOR operators attempt to minimise the cost of purchasing CO2 by optimising its use to achieve oil recovery. Often, individual oil fi elds will have greater CO2 storage capacity than the amount injected in an EOR operation. By implementing different injection scenarios, signifi cant additional CO2 storage can be attained in CO2–EOR operations (Law et al., 2004). Storage potential in oil reservoirs can also be increased by targeting portions of the reservoir not usually accessed by EOR strategies. Near the base of a reservoir, there is often a transitional zone between oil saturation and water saturation, which is called the residual oil zone (ROZ) and is generally considered non-economic. This part of the reservoir is currently gaining interest both for increasing CO2 storage capacity and recovering oil previously considered unrecoverable. Brine-fi lled formations can also occur beneath, adjacent to, or above oil reservoirs, but their use is generally prevented by ownership or access rights, or lack of economic benefi t. If these saline reservoirs were assessed as appropriate for CO2 storage, they could potentially be more easily accessed using the existing infrastructure associated with CO2–EOR operations. This is an example of stacked storage potential.
More than 20 billion tonnes of CO2 storage potential is estimated to be associated with CO2–EOR in North America. By including ROZ potential, this could increase by more than 50 per cent (Carpenter, 2012). Globally, Carpenter (2012) and Godec et al. (2011) have suggested storage potential of several hundred billion tonnes, or more. Although these numbers are preliminary, they indicate the signifi cant storage potential associated with CO2–EOR, which could be important for future CCS development.
Figure 7.5 indicates the potential mass of CO2 stored in the 65 LSIPs at various stages of advancement; approximately 122 Mtpa. As shown, CO2–EOR provides over 50 per cent more than the amount of anticipated CO2 storage of any other form of geologic storage for existing projects.
FIGURE 7.5 Potential mass of CO2 stored by LSIPs according to storage type and project lifecycle stage
Mass of CO2 (Mtpa)
0 10 20 30 40 50 60 70 80
Identify Evaluate Execute Define Operate
Not specified
Depleted oil and gas reservoirs
Enhanced oil recovery (EOR)
Deep saline formations
THE GLOBAL STATUS OF CCS | 2013124
ST
OR
AG
E
7
7.3 DEDICATED STORAGE ACTIVITIES (OR NON-EOR STORAGE ACTIVITIES)Since 2012, operational large–scale storage projects targeting saline formations (i.e. non-EOR activities) injected and stored about 1.5 Mt of CO2. Similar projects in construction (Execute) should increase CO2 injection into saline formations by about 5.8 Mtpa to more than 7 Mtpa in 2015, thus quadrupling the amount currently stored in saline formations.
Projects in operationThe Sleipner Project in Norway, operated by Statoil, is associated with natural gas production in the North Sea. Since 1996, it has been injecting CO2 offshore into sandstones of the Utsira Formation 1 km below the sea fl oor. Sleipner is the world’s fi rst commercial–scale dedicated storage project. CO2 is currently injected at a rate of about 0.9 Mtpa and, to date, more than 14 Mt of CO2 has been injected and stored. Statoil also operates the Snøhvit storage project, which in April 2008 began injecting CO2 into the Tubåen sandstone formation 2.6 km below the seafl oor in the Barents Sea, and by 2011 had stored 1.1 Mt of CO2. Statoil experienced operational issues with injectivity in the Tubåen formation and later in 2011 began injecting into the Stø formation, where about 0.82 Mt of CO2 had been stored by May 2013. In total, more than 1.9 Mt of CO2 has so far been stored as part of the Snøhvit project.
The In Salah CO2 Storage project in the central Algerian Desert is jointly operated by BP, Statoil, and Sonatrach. Since 2004, CO2 associated with processing natural gas has been injected into 1.9 km deep sandstones at the Krechba gas fi eld. The injection component of the larger gas production operation was a joint industry R&D program. In 2010, the program noted that CO2 may be accessing pre-existing fractures in the reservoir and overlying formations, so injection pressures were reduced (Ringrose et al., 2013). Injection ceased in June 2011; more than 3.8 Mt of CO2 had been injected at an average rate of 0.5 Mtpa. Injection has been suspended while the joint venture reviews technical and commercial data before making a decision about future operations at the site. It is expected that monitoring will be continued using the installed equipment. The In Salah project is still classifi ed as operational and therefore active until a decision is made about future operations.
Projects in Execute will soon add considerably to the amount of CO2 injected and stored as part of dedicated storage initiatives (Figure 7.6). In addition, more offshore projects are in early planning stages of development.

THE GLOBAL STATUS OF CCS | 2013 125
ST
OR
AG
E
7
FIGURE 7.6 Mass of CO2 that could be stored by LSIPs
0
5
10
15
20
25
30
35
40
45
Operate Execute Identify
Mass
of
CO
2
(Mtp
a)
0
5
10
15
20
25
30
35
40
45
Mass
of
CO
2
(Mtp
a)
Enhanced oil recovery (EOR) Deep saline formations
Depleted oil and gas reservoirs Not specified
Execute IdentifyOperate
Onshore deep saline formations Offshore deep saline formations
Only deep saline formations projects
EvaluateDefine
EvaluateDefine

THE GLOBAL STATUS OF CCS | 2013126
ST
OR
AG
E
7
Selected saline formation storage projects in ExecuteSeveral LSIPs under construction (Execute) involve major oil and gas companies that have expended signifi cant time, expertise, and resources developing storage sites to achieve an FID. The Gorgon Injection Project in Western Australia is a joint venture between Chevron, ExxonMobil, Shell, Osaka Gas, Tokyo Gas, and Chubu Electric Power. When it becomes operational in 2015, Gorgon will be the world’s largest CO2 injection project. The CO2 is associated with natural gas in the massive Gorgon and Io–Jansz gas fi elds of the Carnarvon Basin off the coast of Western Australia. The project will inject between 3.4 and 4.1 Mtpa of CO2 into sandstones at the Dupuy Formation about 2.3 km below the surface of Barrow Island. Barrow Island is located about 55 km off the coast of Western Australia, although the injection project is considered onshore storage. Planning for the overall project began in the early 1990s, and a team of geoscientists and engineers has been in place since 2002 to characterise the subsurface and advance development, operational, and monitoring plans specifi cally for the subsurface storage of CO2. Additional characterisation data will be collected during the drilling of new wells for CO2 injection and water production.
The Quest project in north-central Alberta, Canada, is a similar joint venture, comprising Shell Canada, Chevron Canada, and Marathon Oil Sands. Quest will store up to 1.1 Mtpa of CO2 in the Basal Cambrian Sands about 2.2 km deep in the Alberta Basin and intends to inject 27 Mt over the life of the project. To advance to an FID took more than fi ve years and involved a dedicated team of experienced geoscientists and petroleum engineers. The Execute stage, as with the Gorgon Injection Project, will require several more years of additional drilling and accumulation of substantial subsurface and baseline monitoring data to fi nalise geological models and forecasts. Extensive project development plans, including monitoring methods and closure strategies, have been provided to regulators and other stakeholders during public hearings. Both Gorgon and Quest have undergone several independent and extensive peer review exercises.
The Illinois Industrial CCS Project (Illinois ICCS) in the US is an LSIP being developed jointly by Archer Daniels Midland Company, Illinois State Geological Survey, Schlumberger Carbon Services, Richland Community College, and NETL. From mid-2014, Illinois ICCS intends to inject 1 Mtpa of CO2 into the Mt Simon sandstones in the Illinois Basin at a depth of nearly 2.2 km. This LSIP is leveraging extensive characterisation, research, and experience gained at the nearby Illinois Basin–Decatur Project (IBDP), which began its characterisation efforts in 2003 and has injected more than 420,000 t of CO2 with a target of 1 Mt over three years. IBDP has been developed by the Midwest Geological Sequestration Consortium and is led by the geological surveys of Illinois, Indiana, and Kentucky, in collaboration with Archer Daniels Midland Company, Schlumberger Carbon Services, and other subcontractors.
The Illinois ICCS project injection site is located about 2 km north of the IBDP site and will be injecting into the same sandstone reservoir. Illinois ICCS is expected to inject into the deep saline formation for about three years and then look for off-takers of the CO2 for EOR usage. The storage formation accessed by Illinois ICCS and IBDP is geologically equivalent to the Cambrian sandstones targeted by Quest and the Aquistore Project in Canada. Illinois ICCS is notable in that it includes a signifi cant public outreach and education program, including an association with the nearby National Sequestration Education Center.
Aquistore, in southeastern Saskatchewan, Canada, will begin to accept CO2 captured from SaskPower’s Boundary Dam coal–fi red power plant in October 2013 (Figure 7.7). Since 2012, an injection and monitoring well has been drilled into the Cambrian Deadwood formation of the Williston Basin as part of the project’s extensive research program, which involves innovative monitoring methods. The site will receive about 1 Mtpa of CO2 from the Boundary Dam plant until April 2014, at which time a portion of the CO2 will be redirected to oil fi elds to the north for EOR purposes. A continuous fl ow of CO2 will still go to disposal and storage via the Aquistore project. The project serves as an interesting case study for industry as a way of providing storage backup during periods when off-takers may be performing maintenance to equipment and cannot accept all the CO2 allocated, and venting is not an acceptable option.
The extent of the data collection and analysis of these sites indicates the prudence exercised by project proponents of early mover LSIPs in the detailed characterisation of potential dedicated geologic storage sites for CO2. These projects will help set best practices for future projects.

THE GLOBAL STATUS OF CCS | 2013 127
ST
OR
AG
E
7
FIGURE 7.7 Aquistore well drill rig, Saskatchewan, Canada
Image courtesy of Aquistore.
7.4 STORAGE ACTIVITIES IN DEVELOPING COUNTRIESThe need to develop expertise in geological storage of CO2 is increasingly recognised and implemented in many developing nations. For instance, Brazil initiated operation of the world’s fi rst offshore CO2–EOR project in June 2013, injecting 0.7 Mtpa of CO2. In Southeast Asia, the presence of immense natural gas reserves, many of which contain signifi cant amounts of associated CO2, may provide an economic driver for developing geologic storage potential in the region. In February 2013, the Society of Petroleum Engineers held an applied technology workshop in Malaysia specifi cally to address the issue of storage in offshore carbonate reservoirs. Presentations by industry specialists from regional oil companies indicated that CCS is one of the options being considered to develop these oil fi elds.
Geological stratifi cations and boundaries do not normally align with political boundaries. It is benefi cial, therefore, to engage with regional initiatives, such as the Coordinating Committee for Geoscience Programmes in East and Southeast Asia (CCOP), which includes many developing countries (Box 7.1).

THE GLOBAL STATUS OF CCS | 2013128
ST
OR
AG
E
7
BOX 7.1
CCS IN DEVELOPING COUNTRIES – STORAGE
Regional storage assessment in Southeast AsiaSince geology knows no borders, many countries in east and southeast Asia have decided to undertake a regional assessment. The CCOP has initiated a geological storage mapping program, with support from the Global CCS Institute and Norway’s Ministry of Foreign Affairs, to develop cross-border mapping programs to characterise storage reservoirs within the region.
Participants in the mapping program are from Cambodia, China, Indonesia, Japan, Korea, Lao-PDR, Malaysia, Philippines, Thailand, Timor Leste, and Vietnam (Figure 7.8). The project is designed to support existing CO2 geological storage activities and kick-start the implementation of storage mapping in member countries that do not have such activities. The aim is to provide a forum for knowledge sharing among the member countries and develop a guideline for national CO2 storage mapping, along with a CCOP CO2 storage atlas. Three member countries, Malaysia, Indonesia and China, will provide geological data to initiate the mapping exercise.
FIGURE 7.8 Map of CCOP countries
China
Korea Japan
Philippines
Papua New Guinea
Indonesia
Singapore
Malaysia
Cambodia
VietnamThailand
Laos
Timor-Leste
The project launch in Bali, Indonesia, in May 2013 was coupled with a workshop on geological storage selection and characterisation. Among other topics, the workshop introduced the criteria for assessing sedimentary basins for their storage potential. Professor John Kaldi from the CO2CRC has broken this down into essential questions, such as:
Injectivity: can we put the CO2 into the rock?
Containment: can we keep the CO2 in the rock?
Storage capacity: what volume of CO2 can the rock hold?
I Box 7.1 continued next page

THE GLOBAL STATUS OF CCS | 2013 129
ST
OR
AG
E
7
BOX 7.1 (continued from previous page)
FIGURE 7.9 Professor John Kaldi, CO2CRC, leads a discussion during the CCOP workshop on geological storage in Bali, Indonesia
The workshop was the fi rst of several intended as part of a proposed four–year program to achieve CCOP’s overarching goals (http://www.ccop.or.th). The goals are to:
provide a high-level overview of the potential for large–scale CO2 storage in the region
enhance capacity and capability in assessing geological sites for the safe and long-term storage of CO2
increase understanding of the potential of CO2 for enhanced oil/gas recovery.
MexicoMexico’s national electricity utility, Comisión Federal de Electricidad (CFE), is advancing the country’s knowledge of storage potential, primarily in deep saline formations, but also CO2–EOR. Mexico helped develop the North American Carbon Storage Atlas published in December 2012, and is now focused on basin-level studies. CFE is involved in an active capacity development program on storage that includes engaging with the academic sector, which will play an important role in CCS education. Mexico’s national oil company, PEMEX, is investigating the use of CO2 for EOR and has already undertaken pilot studies.
BrazilThe Brazilian Carbon Capture and Storage Atlas, to be published in late 2013 in Portuguese and English (with the Institute’s support), is an initiative that began in 2006 with the CARBMAP Project and the fi rst CO2 emissions country–scale assessment. Since then, Brazil has established the Center of Excellence in Research and Innovation in Petroleum, Mineral Resources and Carbon Storage (CEPAC), which has carried out a series of research projects that form the basis of the Atlas. The projects covered reservoir characterisation and modelling; CO2 measurement, monitoring and verifi cation; wellbore integrity; enhanced coal-bed methane; and a CCS geographic information system. The Atlas will also provide an overview of the potential for CCS in Brazil. Focusing on a

THE GLOBAL STATUS OF CCS | 2013130
ST
OR
AG
E
7
basin–scale analysis, the assessment criteria included active hydrocarbons production, coal-bed or saline aquifer occurrence, existing transport framework, effective storage capacity, and matched CO2 emissions. The results indicate that the fi ve Brazilian basins with the best prospects for CCS are Paraná, Campos, Santos, Recôncavo, and Potiguar.
Brazil initiated the world’s fi rst offshore CO2–EOR project in 2013, which also joined the ranks of operational LSIPs. In June, Petrobras and its partners commenced Phase 1A of the project, which is to inject and monitor 0.7 Mtpa of CO2 into the Lula oil fi eld. The fi eld is located in the pre-salt Santo Basin, which lies 300 km offshore in water 2,150 m deep, making it the deepest CO2 injection well in operation. Injection will be from the Cidade de Angra dos Reis FPSO facility. This phase of the project will evaluate the response of the carbonate reservoir to long-term injection.
Middle East and North AfricaIn Salah, in Algeria, was one of the world’s fi rst operating CCS projects. However, there is also signifi cant activity in the UAE, where Masdar is driving projects in a phased approach, starting with ESI. ADNOC and Masdar are collaborating on this CO2–EOR project due to begin in 2016 that will inject 0.8 Mtpa of CO2 into a mature oil fi eld.
Saudi Arabia actively supported the inclusion of CCS as an eligible offsetting activity under the CDM, and is a supporter of the 4-Kingdoms CCS Initiative, a CCS group comprising Saudi Arabia, Norway, The Netherlands, and UK. Saudi Aramco is constructing its fi rst CCS test site in Uthmaniyah, expected to be operational in 2015.
Qatar is developing some of the world’s largest CCS research initiatives. In September 2012, a US$70 million 10–year research partnership between Shell, Qatar Petroleum, Imperial College London, and Qatar Science and Technology Park established the Qatar Carbonates and Carbon Storage Research Centre (QCCSRC). The aim of the partnership is to address carbon storage in limestone and dolostone reservoirs, including developing state-of-the-art reservoir simulators to design optimum CO2 storage and oil recovery processes. The centre will help build Qatar’s capacity in CCS and cleaner fossil fuels. It involves more than 40 academic staff, postdoctoral researchers, and PhD students.
South AfricaThe South African Centre for Carbon Capture and Storage (SACCCS) manages the country’s CCS roadmap. The fi rst milestone was to ascertain the potential for CCS in South Africa; the second, completed in 2010, was to publish its Atlas on Geological Storage of Carbon Dioxide in South Africa (SACCCS, 2010a). Several basins identifi ed in the Atlas have undergone initial screening for storage suitability (SACCCS, 2010b); further technical review will help to identify the best location for a CO2 test injection project. This represents the third milestone. The intent of the injection test is to demonstrate safe storage of CO2 under South African conditions.
IndonesiaIndonesia began investigating CO2 storage potential (including with EOR) in 2003 through a collaboration of the Ministry of Environment, Lemigas, World Energy Council Indonesia National Committee, PT PLN (Persero), and Shell, with support from the British Embassy in Jakarta. In 2009, this ‘Indonesia CCS Study Working Group’ produced a comprehensive report on the potential for CCS in Indonesia. A subsequent pre-feasibility study for a pilot project in Merbau, South Sumatra, was conducted to rank the 10 most suitable sedimentary basins for CO2 storage. The top sites are Kutai and Tarakan basins in East Kalimantan, and the South Sumatra Basin in South Sumatra. These basins are relatively well characterised and have some existing infrastructure that could potentially be accessed. The pilot project would use the Merbau Gas Gathering Station as a source of CO2 and depleted oil and gas reservoirs in the immediate vicinity for storage. Initial storage capacity in oil and

THE GLOBAL STATUS OF CCS | 2013 131
ST
OR
AG
E
7
gas reservoirs in South Sumatra is estimated to be as much as 900 Mt, and for saline formations more than 7 Gt (assuming a storage effi ciency of 0.12 per cent). While these estimates are likely to be reduced with further critical examination on more focused sites, considerable storage capacity exists. The Merbau pilot has identifi ed several depleted hydrocarbon fi elds for potential storage sites and would inject 50 to 100 tpd of CO2 for several months. Depending on funding, injection could commence as early as 2016. Public communication of CCS has been part of the process.
MalaysiaMalaysia has numerous gas fi elds, many comprising 40 per cent or more CO2. Consequently, there are no direct development plans for about 60 per cent of the fi elds. However, PETRONAS, the national oil company, is developing a CO2 mitigation plan that includes CCS. The challenges associated with offshore projects – high cost, large–scale, and oceanic variations caused by varying temperature gradients – represent obstacles that will need to be overcome.
ChinaSome fairly well developed regional–scale storage assessments and detailed site characterisations, especially in relation to EOR, have been undertaken in China. Many of the sedimentary basins in China were characterised for storage potential as part of the EU–-funded Cooperation Action within CCS China–EU (COACH) and UK–China Near Zero Emissions Coal (NZEC) projects. These projects determined that there are considerable storage opportunities in deep saline formations and also via CO2–EOR (Zeng et al., 2013).
Carbon dioxide utilisation continues to be an important part of the CCS discussion in China, and is often considered necessary to partially offset its cost. Three of four state–owned petroleum companies have CO2–EOR pilots in operation:
PetroChina’s Jilin Oil Field EOR Project (Phase 1) commenced in 2008 and is now storing about 160,000 tpa of CO2
Sinopec's Shengli Oil Field EOR Project (Phase 1) captures and stores around 40,000 tpa of CO2
Yanchang Jingbian CCS Project (Phase 1) captures around 50,000 tpa of CO2 for injection into sandstones at the Yanchang Oil Field in the Ordos Basin
in Qinshi County, Shanxi Province, CO2 has been injected since April 2010 as part of an enhanced coal-bed methane project.
Storage in deep saline formations and depleted oil and gas formations continues to gain relevance in China, with four LSIPs reporting this as the potential storage option for their projects, up from two the previous year. The Shenhua Ordos CTL Project (Phase 1), which aims to capture and store 100,000 tpa of CO2, is among the most advanced projects in this category. It began injecting CO2 in a saline reservoir within the Ordos Basin in 2011.

THE GLOBAL STATUS OF CCS | 2013132
ST
OR
AG
E
7
7.5 THE IMPORTANT ROLE OF STORAGE PILOTS AND DEMONSTRATION PROJECTSMore than 40 small–scale injection programs have contributed enormously to advancing understanding of the behaviour of CO2 in the subsurface. This includes aspects of characterisation, modelling, risk assessment, and monitoring methods in saline reservoirs, depleted hydrocarbon fi elds, and coal beds. A review of many of these by Cook et al. (2013) provides insight into the lessons these projects provide in terms of the potential offered by geologic storage for reducing greenhouse gas emissions. Among the fi rst of such initiatives, the Frio Texas project, managed by the University of Texas at Austin’s Bureau of Economic Geology (Gulf Coast Carbon Center), US, began planning in 2002. In 2004, it started injection of 160 tpd of CO2 for 10 days into fl uvial sandstones at 1,524 m depth. A second injection program took place in 2006. The project used downhole logging tools to calculate CO2 saturations and attempted to identify the evolution of the vertical extent of the CO2 plume with time (Hovorka, 2006). Since then, many other pilot and R&D storage projects have contributed knowledge and operational experience. Research projects enable the examination and study of many facets of geologic storage, including laboratory studies of core material, development of modelling methods, and trial of monitoring techniques. Brief overviews of several of the many excellent small–scale injection programs are presented here.
FIGURE 7.10 Diagram of CO2 storage and example of a core
THE SOUTHEAST REGIONAL CARBON SEQUESTRATION PARTNERSHIP
The Southeast Regional Carbon Sequestration Partnership (SECARB) is one of seven US DOE Regional Partnerships in association with the University of Texas at Austin’s Bureau of Economic Geology. The partnership has undertaken a series of phased research projects, including characterisation, validation, and development, at a variety of sites in the US. SECARB is currently in Phase III, which aims to demonstrate that many deep saline reservoirs in Cretaceous sandstone units in the region are highly suitable for long-term storage of CO2 and have the potential to store centuries of emissions. For example, the Cranfi eld Project near Natchez, Mississippi, examined stacked storage potential and used highly innovative monitoring techniques to track the movement of CO2 in the reservoir. At the Citronelle Field in Alabama, injection of anthropogenic CO2 captured from Plant Barry began in August 2012, making this project the world’s fi rst fully integrated CCS project utilising CO2 from a coal–fi red power plant. And Denbury is injecting 100,000 to 150,000 tpa CO2 for up to three years for which SECARB is performing the monitoring, verifi cation, and accounting program.

THE GLOBAL STATUS OF CCS | 2013 133
ST
OR
AG
E
7
THE LACQ ROUSSE STORAGE PROJECT
The Lacq Rousse storage project is managed by Total and operated in the Rousse fi eld, a depleted gas reservoir, in the Aquitaine Basin of southwest France. Lacq has demonstrated the entire CO2 capture, transportation, and storage process (www.total.com). Construction of this project began in 2006 and injection of CO2 in 2010; the project stored 51,000 t of CO2 in 2012. The injection program fi nished mid-2013. The project aimed to demonstrate the feasibility of a complete CCS chain and apply monitoring and verifi cation techniques to an operational facility. The storage reservoir is a naturally fractured dolostone with poor matrix porosity, about 4.5 km deep; as such, it is an instructive project for addressing challenging storage targets. The project is currently wrapping-up, as planned, but monitoring activities will continue for several years. Total is considering publishing the fi ndings.
THE OTWAY PROJECT
The Otway Project located near Port Campbell in southwest Victoria, Australia, and managed by the CO2CRC is active. This well-known and oft visited site includes an interpretive learning centre and public outreach component. Phase I injected 65,000 t of CO2 into a depleted gas fi eld and implemented a robust monitoring and modelling strategy, aiming to confi rm containment. The project has been widely studied and is the basis of extensive scientifi c literature on a range of aspects of subsurface behaviour and monitoring of CO2 (Jenkins et al., 2011). In 2011, the Otway Project moved into Phase II. It is completing innovative fi eld tests to establish the residual trapping effi ciency of saline formations.
I More information is available at www.co2crc.com.au.
THE KETZIN PROJECT
The Ketzin Project (www.co2ketzin.de) near the town of Ketzin, Germany, is managed by the German Research Centre for Geosciences (GFZ). Planning for Ketzin began in 2004, and injection of 56,000 t of gaseous (rather than dense liquid) CO2 into a Triassic sandstone reservoir 630 m deep commenced in 2008. The Ketzin Project focuses primarily on testing novel methods of monitoring CO2 in saline reservoirs, using geophysical, geochemical, and microbiological methods to assist with the prediction of plume migration. A notable fi nding is that geochemical and biological testing can help improve aspects of injectivity into sandstones. The project includes an onsite visitors’ centre. It intends to present many of the scientifi c fi ndings in a compilation volume expected to be published in 2015.
THE GLOBAL STATUS OF CCS | 2013134
ST
OR
AG
E
7
7.6 CASE STUDY – PROJECT PIONEERInitially, Project Pioneer in Alberta, Canada, proposed to capture 1 Mtpa of CO2 from a retrofi tted coal–fi red power plant (Keephills 3) and transport it by pipeline to a regional oil fi eld for use in CO2–EOR and to a local sequestration site for deep geological storage. Partners in Project Pioneer were TransAlta Corporation, Capital Power, and Enbridge, with fi nancial support also provided by the Alberta provincial and Canadian federal governments. Pioneer would have been among the fi rst commercial–scale fully integrated CCS projects. Its motivation was to:
combat climate change by reducing GHG emissions to the atmosphere
ensure a sustainable supply of clean, affordable energy while ensuring a future for Alberta’s coal reserves as a low–cost, environmentally responsible form of power generation.
However, after several years and expenditure of CA$30 million, the project proponents decided not to proceed with the project. The proponents indicated that their decision to end the project was not a refl ection of the long-term viability of CCS or the future of coal–fi red power generation. Instead, the decision was dictated by situation–specifi c circumstances, including: (1) the choice to use horizontal wells instead of CO2–EOR in the regional oilfi eld; (2) uncertainties about the value of emissions credits; and (3) government funding deadlines that limited the time available to fully investigate and develop alternative market strategies. Despite not proceeding, the project fulfi lled one of its primary purposes – to provide a blueprint to evaluate the technical and fi nancial feasibilities of CCS projects.
To provide insight for future projects, the Global CCS Institute supported the development of a detailed report on Project Pioneer, which describes geological studies, reservoir models and simulations, risk analysis, site characterisation, and monitoring, measurement and verifi cation (MMV) strategies (including cost estimates) (TransAlta, 2013). Project Pioneer began around 2010, benefi tting from the existence of several regional geological characterisation programs that preceded it. One of these was the Alberta Saline Aquifer Project (ASAP), a consortium program to identify deep saline reservoirs in Alberta, Canada, for carbon storage. The other was the Wabamun Area Sequestration Project (WASP), also a joint project involving researchers, industry, and government, which assessed large–scale CO2 storage opportunities in a 60 x 90 km area in central Alberta. WASP identifi ed prospective storage locations useful for Project Pioneer. The Pioneer report includes conceptual geological models, regional maps, the outline of a data acquisition program, and well schematics. The prospective storage complex was in shelf-margin carbonates (limestones and dolostones) of the Devonian Nisku Formation. The report also outlines the methods used in modelling and reservoir simulations related to the injection of CO2, indicating that the site would be able to accept full injection rates of one, three, and 10 Mt over 10 years. In addition, adequate sealing units in place above and below the storage reservoir indicated safe, long-term containment.
Along with lessons learnt, topics discussed in the Project Pioneer report include:
the methods used to characterise the geological setting, determine the conceptual geological model and gauge the site’s appropriateness for storage
an evaluation well program that outlines objectives, procedures, and well schematics, and outcomes of the evaluation program
the description of a dynamic reservoir model with input parameters and methods used to calibrate the model, as well as the results of a pressure front analysis
ranked risks and the steps used to derive the risk assessment using features, events, and processes (FEPs)
MMV strategies and plans throughout all phases of the project (i.e. baseline, operation, and closure), based on consideration of potential risk scenarios.
THE GLOBAL STATUS OF CCS | 2013 135
ST
OR
AG
E
7
7.7 RECOMMENDATIONS AND OUTLOOKWhile CO2–EOR still drives much carbon storage activity, there are several large, high-profi le projects nearing operation that will demonstrate commercial–scale storage in saline reservoirs. In contrast to traditional oil and gas projects, these projects include development of extensive monitoring programs, geochemical and geomechanical studies of rocks within and outside the reservoir, and assessment of risks associated with long time frames. As such, they are vital projects for informing future geological storage programs.
It is notable that a surge in storage projects in developing nations is occurring. South America, South Africa, the Middle East, and Southeast Asia all initiated programs aimed at large–scale deployment of carbon storage. China continues to make progress with pilots and is looking to full-chain demonstration within the next several years. These projects will be critical to establish geological storage of CO2 as a viable component of the global low–carbon energy portfolio.
Sharing knowledge gained from large operational and small–scale research initiatives remains essential to progress the wider deployment of geological storage of CO2. In the current global economy, fewer active projects are progressing from planning to Execute and then Operate. With the exception of projects coupled with EOR, the absence of a clear source of revenue generation creates fi nancial hurdles that project proponents are often unable to overcome to ensure an attractive return on their investment.
It is crucial to maintain knowledge sharing and research activities. The Institute identifi es authoritative knowledge sharing as one of its prime areas of focus to accelerate and advance storage and, indeed, all aspects of CCS. For example, the Institute has supported preparation of a report by Stanford University on relative permeability (Benson et al., 2013), a topic of critical importance to reservoir simulation and predictive modelling. Active knowledge sharing networks associated with storage include the US DOE Regional Partnership program, European CCS Demonstration Projects Network, IEAGHG Network, CO2GeoNet/CGS Europe, and regional networks that exist within these larger programs (such as BASTOR2, which is looking at mapping geologic storage potential within the Baltic Sea). Similarly, the emergence of the CCOP mapping program, which involves most Asian countries, is demonstrating the spread of collaborative storage programs into different regions, including developing countries.
Standards and guidelines for geologic storage are also important. They serve to accelerate deployment by helping with transparency for public acceptance, enabling regulators to align with expectations, and supporting verifi cation of projects that may eventually be critical for global carbon trading. Recent developments have included:
the Canadian Standards Association publishing CSA Z741-12, Geologic Storage of Carbon Dioxide, in late 2012. This is a bi-national (US and Canada) product and a voluntary standard. A committee comprising technical experts from these regions (including representatives from industry, research, and regulators) prepared the standard, working with relevant working groups. The document addresses the entire project lifecycle, but does not include CO2–EOR. The standard adopts a performance approach, but does refl ect the regulatory regimes of these countries.
the ISO agreeing to develop ISOTC 265, Carbon Dioxide Capture, Transportation and Geological Storage, with 16 participating countries. Five working groups have been established to draft the standard, covering capture, transport, storage, quantifi cation and verifi cation, and cross-cutting issues. An organisational meeting on ISOTC 265 was held in Madrid in February 2013 and a further Technical Committee meeting in Beijing, in September 2013, will include updates by the individual working groups.
DNV preparing guidelines for geologic storage through two joint industry programs. DNV-RP-J203, Geologic Storage of Carbon Dioxide, is a performance–based guideline for site characterisation, risk management, and generic processes for permitting and requirements. This provides a basis for certifi cation through a companion work, DNV-DSS-402 Qualifi cation Management for Geological Storage of CO2.

THE GLOBAL STATUS OF CCS | 2013136
8
PUBLIC ENGAGEMENT
8.1 Overview .................................................................................................................................................... 137
8.2 A growing awareness of public engagement best practices ................................. 138
8.3 Using communication and education to explain risk and build capacity .. 144
8.4 Improving communication and collaboration ................................................................. 149
8.5 Recommendations and outlook ................................................................................................ 153
THE GLOBAL STATUS OF CCS | 2013 137
KEY FINDINGS
8.1 OVERVIEWResponses to the Institute’s annual survey for the past couple of years have demonstrated a growing awareness of best practice in public engagement and recognition of the importance of proactive, successful public engagement to enable CCS demonstration projects to proceed.
With several projects in 2013 progressing through, or making substantial developments within, their lifecycle phases, more projects around the world are utilising the best practice guidance and learning that has emerged from early CCS demonstrations. Developers are making serious attempts to understand the social context in which they operate and manage the potential social effects of their projects.
However, challenges remain. Following the global fi nancial crisis, funding for large, capital intensive infrastructure projects is scarce, and sensitivity to higher energy bills is increasing, resulting in a stronger need to persuasively articulate the need for, and value of, commercial–scale CCS projects. Persistent issues relate to a lack of understanding of CCS, CO2, and energy more generally, leading to confusion, misinformation, and increased perceptions of risk – particularly about CO2 transportation and storage.
In this chapter, trends in the 2013 project survey data are identifi ed and considered in the context of examples of project best practice. The key themes and recommendations emerging from a recent review of the existing body of applied social research into CCS are also set out.
New, creative efforts to tackle the persistent challenges associated with public understanding of CO2 storage are brought into focus with a profi le on the communication support materials produced by the research organisation responsible for the highly successful Weyburn–Midale CO2 Monitoring
As more projects progress through the project lifecycle, it is becoming increasingly important to use public engagement best practices and lessons learnt from early demonstration projects.
Gaining a comprehensive understanding of local communities, stakeholders, and the socio-political context of a proposed project site is an essential fi rst step in creating a successful public engagement strategy.
The 2013 survey responses clearly indicate increased efforts to enhance and broaden the general understanding of CCS technology and improve communication on the value proposition of CCS.
It is critical to encourage a more diverse group of stakeholders to advocate for CCS to increase awareness and credibility of the technology among the wider public.
The CCS industry has the knowledge and ability to demonstrate to the wider public that CCS has a critical role to play in a low–carbon energy future.
Opposite: Oxford University's Professor Myles Allen.

THE GLOBAL STATUS OF CCS | 2013138
PU
BL
IC E
NG
AG
EM
EN
T
8
and Storage Project. In the context of improving understanding and enabling skills development, this issue is examined further in relation to building capacity through tertiary education programs in developing countries.
Finally, consideration is given to a topic that has surfaced in several CCS Networks: how best to frame, or tell the story of, CCS technology to engage the interest of stakeholders. A short interview with representatives from the recently established ENGO Network on CCS highlights the importance of working collaboratively across diverse stakeholder groups. Hopefully it will challenge all those working in the industry to refl ect on their role in shaping how CCS is viewed by infl uential stakeholders, especially those external to existing CCS networks who play critically important roles in its success.
8.2 A GROWING AWARENESS OF PUBLIC ENGAGEMENT BEST PRACTICESPublic engagement, social licence to operate, public acceptance, public communication; these phrases can be found among myriad others used to describe the activities and materials required by CCS project developers to identify, understand, engage, build, and manage trusting relationships with stakeholders. Over the past fi ve years, a concerted effort has been made to research and record the emerging experiences of early CCS demonstration projects as they have attempted to navigate the social barriers to CCS deployment. This comprehensive body of CCS social research includes analysis of both the successes and failures of these early projects, identifying a common set of project success factors and providing examples of areas in which public engagement best practices could be usefully applied.
The Institute’s 2013 project survey results indicate a small but signifi cant increase in awareness of the value of public engagement best practices for CCS projects.
Plan early for successProject proponents are recognising the value of public engagement as an integral part of overall project planning. More than 70 per cent of projects that responded to the Institute's 2013 survey confi rmed they had completed, or are currently enacting or developing, a public engagement strategy.
FIGURE 8.1 Status of public engagement strategy development
23% 14% 39% 18% 6%
The project is still in need of a public engagement strategy.
The project is currently developing a public engagement strategy.
The project has a public engagement strategy and is actively engaging with key stakeholders.
The project has completed all regulatory approvals that require a formal public engagement process.
The project does not require a public engagement strategy.

THE GLOBAL STATUS OF CCS | 2013 139
PU
BL
IC E
NG
AG
EM
EN
T
8
Even those projects that had completed all the regulatory approvals requiring a formal public engagement process emphasised that they continue to actively maintain contact with key stakeholders and local communities, and engagement and communication is a core part of their projects.
We have enjoyed strong community support for our project since its inception, so even now that we have completed all the formal regulatory approvals that require public engagement processes, we are still putting in signifi cant efforts to keep our key stakeholders informed and meet with them regularly.
Barry Jessup, Alberta Carbon Trunk Line, Canada
Integrate communication and engagement resources within the core project teamOther encouraging examples of best practice became evident in project responses to the survey question that asked about integration of CCS project and public engagement teams. Half of all respondents highlighted that their public engagement team was integrated with senior executive management and at least two other project teams, such as legal and regulatory or the technical teams involved in designing the project’s capture, transport, and storage solutions. These results echo key recommendations from the CSIRO–led international comparison of communication, project planning, and management for CCS projects (Ashworth et al., 2011) and the recent multi-case study review, Communications for Carbon Capture and Storage (Prangnell, 2013).
The developers of successful projects consistently embed the communications function alongside commercial and technical leads. And while communication shouldn’t lead a project, practitioners should always be in a position to shape thinking.
Prangnell, 2013, p. 52.
Given the importance that multiple sources of social research and analysis of early CCS project case studies have placed on early engagement (Prangnell, 2013; Ashworth et al., 2011, 2012a; Kombrink et al., 2011) and a project’s early stage communication activity (de Groot and Steg, 2011), it is particularly positive that more than two-thirds of respondents in pre-FID phases of development planning indicated their public engagement resources are integrated within the project’s senior executive management.
Social site characterisationThere has been very little change in the types of communities in which CCS projects report having interactions; the majority of project sites are based in industrial and farmland areas. However, among the newly developing projects in the Asia Pacifi c region (particularly China, which has experienced the most new growth in number of CCS projects over the past few years), more are considering sites that transect moderately and highly populated areas.

THE GLOBAL STATUS OF CCS | 2013140
PU
BL
IC E
NG
AG
EM
EN
T
8
FIGURE 8.2 Type of community in which CCS projects are taking place by geographic region (respondents could select more than one type of community)
0 5 10 15 20
Moderately populated residential area
Farmland
Industrial area
Highly populated residential area
Number of responses
The Americas EMEA Asia Pacific
Area of environment, historical
or cultural significance
Other
Offshore
High-level stakeholder engagement is standard practice for most large energy infrastructure projects. However, when high profi le projects seek to operate in, or near, residential areas, a critical part of project management involves gaining a comprehensive understanding of the local community and its socio-political context. This process can also help to inform a sound public engagement strategy (Bradbury, 2012; Brunsting et al., 2012a; Global CCS Institute, 2012; Wade and Greenberg, 2011).
Overall, the 2013 survey results reveal a growing confi dence in the comprehensiveness of social site characterisation data collected by projects. However, some projects in the Evaluate and Defi ne stages of the project lifecycle did report shortcomings in their very early site analysis. These issues most often arise during early land access negotiations, and to manage them can prove expensive and labour intensive. If land access for initial investigations is not granted, extensive delays at an early stage of project development can occur.
The challenge is not always the result of inadequate early research or poor characterisation of stakeholder issues. Because of the long lead times associated with most CCS projects, changes in social circumstances are inevitable, so it is important to monitor the situation and keep key stakeholders informed of developments.
If we could turn back the clock, I think we would invest in a more comprehensive community profi le. Many of the challenges we face now have very little to do with CCS safety and more with legacy issues. Comprehensive baseline data would support regular monitoring for changes in behaviour and help us better target our messaging and engagement activities.
Dominique van Gent, SouthWest Hub Project, Australia
Social site characterisation is, by its nature, specifi c to each project site. However, building on the framework fi rst laid out in the Toolkit for Social Site Characterisation (Wade and Greenberg, 2011), research in France by Jammes et al. (2013) has sought to more accurately defi ne the key components of a comprehensive social site characterisation by performing such a characterisation.

THE GLOBAL STATUS OF CCS | 2013 141
PU
BL
IC E
NG
AG
EM
EN
T
8
BOX 8.1
Key public engagement principles in practiceA common complaint of CCS project proponents is that public engagement practices like social site characterisation and stakeholder identifi cation and analysis are theoretical and lacking in real project examples. To bring these concepts to life for future project developers, the Institute supported some of France’s leading public engagement specialists to perform and record each of the key stages of a comprehensive social site characterisation and prepare a stakeholder engagement process plan. The LIS (formerly ULCOS Blast Furnace CCS) project in Lorraine, France, was used as the subject of the case studies.
The fi nal report comprised four detailed case studies capturing all the processes and tools used to manage the following key public engagement processes:
context analysis
stakeholder identifi cation and mapping
issues identifi cation and materiality analysis
design and evaluation of the project stakeholder engagement plan.
The case studies provide tangible examples of stakeholder engagement processes for project developers. The fi nal report, including the case studies (Jammes et al. 2013), is available on the Institute’s website.
Other examples of social site characterisation and public engagement tools in practice are available from the outputs of Work Package 8 of the EC–funded SiteChar Project (2013). This work includes analysis of outreach activities conducted in communities in which CCS sites could be located in Scotland and Poland (Brunsting et al., 2012b).
Emerging trends in social research The Institute is four years into its partnership with Australia’s CSIRO to conduct an international research program into the social factors that can affect the successful deployment of CCS projects.
The Institute–coordinated program has delivered a total of 14 projects undertaken by 10 international research institutions, and 29 fi nal reports, as well as several ongoing journal publications. The CSIRO and the Institute recently completed a review and analysis of the key themes emerging from this body of social research and the 14 publications most frequently cited in them. The full analysis and helpful extended references will be published on the Institute's website; a preview of the seven key themes and recommendations emerging from the review are provided in Box 8.2.

THE GLOBAL STATUS OF CCS | 2013142
PU
BL
IC E
NG
AG
EM
EN
T
8
BOX 8.2
Key themes and recommendations from a synthesis of CSIRO–led social research
Framing CCS
Perceptions of climate change vary from belief to scepticism and denial. Therefore, in contextualising CCS, it is important to consider all positions and not focus on mitigation alone.
In discussing CCS, clearly defi ne the rationale for the technology’s implementation and take into consideration the national and international policies that underpin CCS.
Compare energy options transparently and communicate clearly, include issues and explanations of the wider energy debate.
Local context
Take into account a community’s social, cultural, economic, and political characteristics and the impact a CCS project may have on the community (the social site characterisation tool can be a useful aid).
Establish a baseline of knowledge and awareness across affected communities to better understand information needs, minimise misunderstandings, and avoid false expectations.
To anticipate and prevent any unplanned issues, consider a community’s local history and pre-existing concerns, as well as the overarching local, state, and national perspective.
Trust
Identify reliable individuals, organisations, and institutions within the community to ensure that those communicating messages on CCS are trusted.
Ensure that advice and information provided to stakeholders is trusted, reliable, and informative and provided in a way that allows suffi cient time for it to be absorbed.
To assist in smooth information transfer and feedback, consider establishing a citizen’s advisory committee or some form of community participation group.
Communication and engagement processes
Target gaps in local knowledge about CCS (identifi ed through baseline research).
Engage in meaningful dialogue with stakeholders and the public well in advance of fi nalising project plans, making use of trusted advocates within different stakeholder groups.
Use a wide variety of engagement processes and tools that promote open and transparent dialogue and help to establish effective relationships.
Embed experienced, high-level communication/engagement resources in a CCS project development team.
Information
Provide wide-ranging information (i.e. formal, informal, technical, simple) to stakeholders through a variety of reliable sources to develop trust and ensure stability of opinion.
Provide information that is balanced, of high quality, relevant, of minimal complexity, appropriately toned, and readily accessible to a range of stakeholders.
Develop information delivery programs tailored to different audiences e.g. courses on broad issues such as climate change, energy options, and potential mitigation solutions delivered through educational institutions.
I Box 8.2 continued next page

THE GLOBAL STATUS OF CCS | 2013 143
PU
BL
IC E
NG
AG
EM
EN
T
8
BOX 8.2 (continued from previous page)
Risk perception
To help minimise perceptions of risk, establish two-way communication processes that recognise individual risk perceptions and tailor responses to allay fears.
Include information that adequately addresses the multiple facets of risks associated with CCS, including capture, transport, and storage.
Ensure risk communication personnel are well trained to be aware of, recognise, and be sensitive to, varying perspectives associated with the risks of CCS.
Governance
Clearly defi ne processes for communities and other key stakeholders to provide input into project decisions and develop a partnership approach toward shared outcomes.
Align CCS legal and regulatory frameworks across local, state, and national contexts to reduce confl ict between different levels of government and minimise any erosion of public confi dence in a project.
Create a unifi ed vision of the need for a project across project funders, development teams, and team members.
If risk perceptions are high, provide some fl exibility in project plans to allow the public to infl uence the outcome and thereby minimise such risk perceptions.
FIGURE 8.3 A framework of interactions for CCS projects
External influences
Communication and engagement process
Governance
Local context
Framing CCS Trust Risk perception Level of acceptance
Information
THE GLOBAL STATUS OF CCS | 2013144
PU
BL
IC E
NG
AG
EM
EN
T
8
8.3 USING COMMUNICATION AND EDUCATION TO EXPLAIN RISK AND BUILD CAPACITYA common theme arising from the international social research data (Ashworth et al., 2012b), as well as the Institute’s global survey of CCS projects, is that initial public perceptions of CCS tend to focus on risks and uncertainties, especially risks associated with CO2 storage.
Tackling CO2 storageResearch by Itaoka et al. (2012) emphasised a general lack of understanding of the basic properties and effects of CO2. It identifi ed a pressing need for those promoting CCS to be supported with accurate information on key technical topics such as the properties of CO2, its behaviour underground, and its behaviour in different phases of transport.
The CSIRO’s comprehensive synthesis of social research recognises the considerable effort that has gone into creating communication material to explain CO2 storage in geological formations (Ashworth et al., 2013). Nevertheless, storage – particularly onshore storage and the effects of CO2 storage on water supplies, topped the list of most frequently voiced community concerns in the Institute’s 2012 and 2013 surveys, followed closely by concerns about CO2 transportation.
The long-term safe storage of CO2 is defi nitely the area where we have to provide stakeholders with the most reassurance. Storing a gas inside a rock is such an unfamiliar concept to most people here in Japan, this makes it pretty diffi cult to have a rational conversation around risk – so much of our engagement around CO2 storage started from a matter of trust.
Masanori Abe, Tomakomai Project, Japan
In a recent collection of interviews with communication and engagement staff from fi ve CCS demonstration projects, the persistent issue of public understanding and acceptance of CO2 storage was highlighted by Dr Vivian Scott, a geologist at Edinburgh University:
… part of the problem is that ‘offshore’ is an unfamiliar world where unfamiliar things happen. By contrast, discovering that your solid, familiar good old terra fi rma is not so solid, has stuff in it and moving around it, and doesn’t belong to you, is a bitter pill to swallow, even without the added ‘someone’s going to do something to it’ concern.
Prangnell, 2013, p. 13
In Prangnell’s case study report and a host of other social research publications (Desbarats et al., 2010; Hund and Greenberg, 2010), the researchers conclude there is an urgent need for tangible examples and accurate information about CCS in accessible language and from credible sources. This is the goal of the 'Creating Core Messages' project, led by the PTRC – the research team behind the WMP (see Box 8.3).
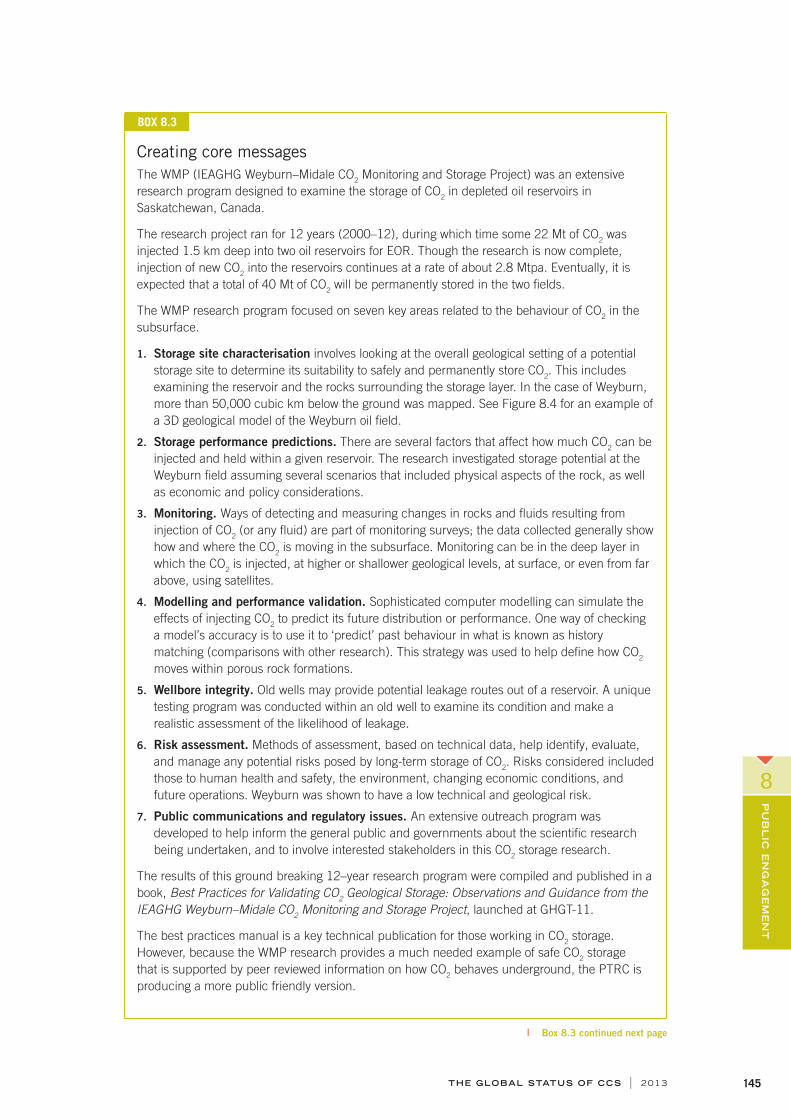
THE GLOBAL STATUS OF CCS | 2013 145
PU
BL
IC E
NG
AG
EM
EN
T
8
BOX 8.3
Creating core messages The WMP (IEAGHG Weyburn–Midale CO2 Monitoring and Storage Project) was an extensive research program designed to examine the storage of CO2 in depleted oil reservoirs in Saskatchewan, Canada.
The research project ran for 12 years (2000–12), during which time some 22 Mt of CO2 was injected 1.5 km deep into two oil reservoirs for EOR. Though the research is now complete, injection of new CO2 into the reservoirs continues at a rate of about 2.8 Mtpa. Eventually, it is expected that a total of 40 Mt of CO2 will be permanently stored in the two fi elds.
The WMP research program focused on seven key areas related to the behaviour of CO2 in the subsurface.
1. Storage site characterisation involves looking at the overall geological setting of a potential storage site to determine its suitability to safely and permanently store CO2. This includes examining the reservoir and the rocks surrounding the storage layer. In the case of Weyburn, more than 50,000 cubic km below the ground was mapped. See Figure 8.4 for an example of a 3D geological model of the Weyburn oil fi eld.
2. Storage performance predictions. There are several factors that affect how much CO2 can be injected and held within a given reservoir. The research investigated storage potential at the Weyburn fi eld assuming several scenarios that included physical aspects of the rock, as well as economic and policy considerations.
3. Monitoring. Ways of detecting and measuring changes in rocks and fl uids resulting from injection of CO2 (or any fl uid) are part of monitoring surveys; the data collected generally show how and where the CO2 is moving in the subsurface. Monitoring can be in the deep layer in which the CO2 is injected, at higher or shallower geological levels, at surface, or even from far above, using satellites.
4. Modelling and performance validation. Sophisticated computer modelling can simulate the effects of injecting CO2 to predict its future distribution or performance. One way of checking a model’s accuracy is to use it to ‘predict’ past behaviour in what is known as history matching (comparisons with other research). This strategy was used to help defi ne how CO2 moves within porous rock formations.
5. Wellbore integrity. Old wells may provide potential leakage routes out of a reservoir. A unique testing program was conducted within an old well to examine its condition and make a realistic assessment of the likelihood of leakage.
6. Risk assessment. Methods of assessment, based on technical data, help identify, evaluate, and manage any potential risks posed by long-term storage of CO2. Risks considered included those to human health and safety, the environment, changing economic conditions, and future operations. Weyburn was shown to have a low technical and geological risk.
7. Public communications and regulatory issues. An extensive outreach program was developed to help inform the general public and governments about the scientifi c research being undertaken, and to involve interested stakeholders in this CO2 storage research.
The results of this ground breaking 12–year research program were compiled and published in a book, Best Practices for Validating CO2 Geological Storage: Observations and Guidance from the IEAGHG Weyburn–Midale CO2 Monitoring and Storage Project, launched at GHGT-11.
The best practices manual is a key technical publication for those working in CO2 storage. However, because the WMP research provides a much needed example of safe CO2 storage that is supported by peer reviewed information on how CO2 behaves underground, the PTRC is producing a more public friendly version.
I Box 8.3 continued next page

THE GLOBAL STATUS OF CCS | 2013146
PU
BL
IC E
NG
AG
EM
EN
T
8
BOX 8.3 (continued from previous page)
The Institute supported PTRC booklet and presentation package, Creating Core Messages, will aim to support other CCS developers and funders to answer questions about CO2 storage commonly asked by members of the general public. All information will be based on the extensive data and research results compiled by WMP during the 12 years.
Early drafts of the material will be tested with local community focus groups to ensure they are clear and simple to understand. The fi nal Creating Core Messages package is expected to be published by the end of 2013.
I More information on the WMP and the Best Practices Manual is available at www.ptrc.ca.
FIGURE 8.4 A 3D geological model of the Weyburn oil fi eld created from characterisation data and showing barriers to vertical movement on the left, aquifers on the right, and wellbores stretching into the formation
Source: PTRC

THE GLOBAL STATUS OF CCS | 2013 147
PU
BL
IC E
NG
AG
EM
EN
T
8
Building understanding for future developmentImproving access to simple, precise, and credible information about CCS is extremely important, as is tailoring messages and communication activities to meet stakeholder information needs. There is a convincing body of evidence from Torvanger and Meadowcroft (2011) and Bradbury et al. (2011) that highlights the fl uid (sometimes volatile) nature of public perception and acceptance of information about CCS. This is particularly the case among stakeholders with little or no prior knowledge of the technology or the climate change and energy context that makes CCS so important.
The evidence suggests that when knowledge of CCS is limited, stakeholders’ opinions are not fi xed. They are heavily infl uenced by past experience, the opinions of others they trust, the level of trust felt toward the messenger, and the perceived relevance of a topic to the individual. It is vitally important, therefore, to build strong trusting relationships with infl uential stakeholders i.e. to build familiarity, ensure that communication and education activities about a project are relevant and address stakeholder questions and concerns, and improve general understanding of the need for, and intricacies of, CCS technology.
In developing countries, the time frames for CCS deployment may be longer and social circumstances markedly different to those in the developed world. In these countries, a focus on education to slowly build awareness of CCS and the wider energy and sustainability context is key to improving understanding and acceptance, and building capacity to deliver the technology. It is for this reason the Institute has partnered with the CO2CRC to introduce a CCS course to relevant universities in Malaysia and Mexico.
BOX 8.4
CCS IN DEVELOPING COUNTRIES – EDUCATION
Building understanding through universitiesThe need to strengthen primary, secondary and tertiary education about CCS and where it fi ts in the wider energy and sustainability context is a key lesson emerging from the body of social research into CCS deployment concepts (Colliver et al., 2011; Corry and Reiner, 2011; Reiner, 2008).
Incorporating CCS into the tertiary teaching syllabus of developing countries that have an interest in laying the groundwork for its deployment has the dual benefi ts of:
fostering a general culture of understanding and acceptance by raising awareness of, and familiarity with, the technology and the engineering concepts that make it possible. It places CCS together with renewables and other low–carbon energy technologies in day-to-day conversation
building capacity, skills, and understanding in the country’s current and future workforce.
This is why the Global CCS Institute is working with universities in Malaysia and Mexico on a ‘sustainable’ education initiative.
The initiative aims to up-skill university education providers to enable them to deliver a CCS course to suitable industry or academic students. The Institute considers this approach will have more enduring benefi ts than a one-off course, simply because it has the potential to reach a greater number of future professionals. The project has three components:
1. An intensive week–long course at which local professors and lecturers become the students and learn about many aspects of CCS. Delivered in partnership with the CO2CRC, the course covers capture, transport, storage, economics, CO2 utilisation, public engagement, and legal and regulatory issues.
2. Access to CO2CRC and Institute education materials, through a license agreement, to enable ‘graduates’ of the week-long course to deliver a CCS university course.
3. Ongoing assistance through a dedicated Institute Extranet through which participating lecturers can ask Institute and CO2CRC experts technical questions, and discuss issues.
I Box 8.4 continued next page

THE GLOBAL STATUS OF CCS | 2013148
PU
BL
IC E
NG
AG
EM
EN
T
8
BOX 8.4 (continued from previous page)
The fi rst Malaysian course was delivered in July 2012 with approximately 45 participants. Three universities in Malaysia subsequently signed license agreements to enable them to use the education materials to teach a CCS course. A refresher course was run in Malaysia in August 2013 for those lecturers who will be delivering the course in their respective institutions. In February 2013, the course was delivered in Mexico to approximately 40 attendees. To date, two universities in Mexico have signed license agreements, and a follow-up series of technical storage webinars has been organised.
FIGURE 8.5 Train-the-trainer course in Malaysia

THE GLOBAL STATUS OF CCS | 2013 149
PU
BL
IC E
NG
AG
EM
EN
T
8
8.4 IMPROVING COMMUNICATION AND COLLABORATION CCS tentatively emerged on the climate change stage during a time of rapid global growth and strong political will, characterised by the G8 Summit at Gleneagles (2005) and the Stern Review (2006). There was an exciting sense that the ingenuity of the human spirit was more than capable of working humankind out of the climate dilemma, and CCS quietly rode the wave of general interest in all things low–carbon.
Five years on from the global fi nancial crisis, political agendas are focused on economic recovery and there is intense competition for space in the public/political imagination to justify large infrastructure funding. In many regions, CCS was unfairly hit with negative associations – high cost, high risk, unproven technology – but, more recently, there have been efforts to re-engage with CCS and help others understand the important role it has to play in a low–carbon energy future.
The value of CCS may be clear, but translating it into policy remains a challenge. Public engagement and outreach are essential to achieve this goal.
Framing CCS to fi t stakeholder understanding An issue that has been grappled with by social researchers and CCS project networks is how best to frame, or tell the story of, CCS technology in a way that is engaging and relevant to stakeholders.
The Institute’s 2012 status report highlighted a shift in the way projects chose to discuss CCS with stakeholders toward a much stronger focus on the economic benefi ts and drivers of the technology. This trend was reinforced in the results of the 2013 survey, along with emerging social research by Markusson et al. (2012) critical of the traditional climate change mitigation context used to frame the CCS story.
While recognising the benefi ts of framing CCS in the broader context of climate change mitigation, CCS projects and networks are also realising that in order to engage effectively with stakeholders, communication on CCS must be set in a context that is relevant to the stakeholder. This requires a deep understanding of the stakeholder in question:
The current narrative for CCS has not served the technology well. It is a story based on mixed messages, complex language, intangible theories and over-infl ation. There has been a tendency to tell stakeholders what they should fi nd relevant, rather than try to understand CCS from a stakeholder perspective. Our Network is trying to move beyond the communication traps that have traditionally hampered CCS, to position CCS technology in its rightful place as a vital component of Australia’s low–carbon energy future.
Jaelle Bajada, Communications Manager, National CCS Council, Australia

THE GLOBAL STATUS OF CCS | 2013150
PU
BL
IC E
NG
AG
EM
EN
T
8
BOX 8.5
Networks in action CCS Networks across the globe are actively involved in communication initiatives to improve the rhetoric about CCS technology in their region.
Japanese Knowledge Sharing Network
This group comprises more than 20 organisations with an interest or expertise in CCS. The Network is committed to sharing knowledge on technical and risk–related topics and developing tools to do so.
It has published a report capturing lessons learnt from the trial implementation of a CCS communication framework for Japan. The trial involved a survey of 979 people and intense focus groups to gain insights into stakeholder responses to communication materials produced by the Network.
I More details are available from www.globalccsinstitute.com/networks/japanese-knowledge-network.
Australian Stakeholder and Strategy Network
This group comprises representatives from every major Australian CCS project, along with the Institute, National CCS Council, CSIRO, and Australian Government. It provides peer support and facilitates knowledge sharing among staff working on CCS communication, engagement, and policy.
The Network has been working to create a ‘narrative’ or set of key messages and proof points explaining the need for, and value of, CCS in Australia. It is hoped this work will encourage consistency and accuracy in messaging across the Australian CCS industry and act as contextual support for the National CCS Council’s Roadmap for CCS Development in Australia.
FIGURE 8.6 A meeting of the Australian Stakeholder and Strategy Network
European CCS Demonstration Project Network
This is an EC–funded network of leading CCS demonstration projects in Europe, established to encourage knowledge and experience sharing to fast-track learning and develop safe and commercially viable CCS.
The Network’s Public Engagement Working Group held an international communication and engagement workshop in May 2013, featuring case study analysis from fi ve different CCS projects. The overwhelming message emerging from discussions was the need to better articulate the value proposition of CCS in Europe.
I More details are available from www.ccsnetwork.eu/blog/international-comm-workshop.

THE GLOBAL STATUS OF CCS | 2013 151
PU
BL
IC E
NG
AG
EM
EN
T
8
Trusted advocates – collaborating with the ENGO communityEstablishing a trusting relationship is the key to successful public engagement. There is a wide ranging body of social research that covers the many facets of building trust in CCS technology, but one of the most cited recommendations, in the research and projects’ self-reports, is the importance of creating a support network of credible, well informed, third-party advocates (Terwel et al., 2011; Ashworth et al., 2013; Carr et al., 2010).
Environmental non-government organisations (ENGOs) tend to be highly infl uential advocates because they are generally perceived as independent, credible, and motivated to act in the best interests of the public (Terwel et al., 2011). As such, it is in the best interests of ENGOs and CCS proponents to engage in an ongoing dialogue and fi nd common goals in working toward the broader climate change mitigation objective.
Nevertheless, the traditionally uneasy relationship between industry and ENGO groups still seems to affect projects. In responses to the Institute’s 2013 survey, ENGOs and the local communities situated near CCS transport routes and storage locations were considered the greatest public engagement challenges.
However, there are noteworthy cases of CCS projects successfully collaborating with a broad spectrum of stakeholders to greatly improve acceptance and understanding of the project. Summit Power’s Texas Clean Energy Project (TCEP) is one example.
Before even beginning its project design concept, TCEP sought advice from the Clean Air Task Force (CATF) on how to design a coal-feedstock gasifi cation plant with carbon capture that environmental groups would support or at least not oppose. The project’s Texas site was selected at the suggestion of CATF and the Environmental Defense Fund, while leaders from the Natural Resources Defense Council advised the TCEP management on an appropriate carbon capture target. The project hired a leading lawyer for environmental groups to obtain the air permit, and the project plans deliberately avoided the use of water that could be used for drinking or agriculture. Finally, the project agreed to establish an independently funded Carbon Management Advisory Board of leading climate scientists, geologists, and representatives of environmental organisations to monitor the project’s CCS activities. Eric Redman, President and CEO of Summit Power, is very proud of Summit Power’s collaborative efforts with the ENGO community:
… all this helped gain ENGO support and avoid opposition. We take our community and environmental responsibilities very seriously, and after all, the project deals directly with one of the most important environmental issues, namely the need for carbon capture and sequestration – and does so at a scale larger than any other power plant yet built.
Eric Redman, President and CEO, Summit Power
The ENGO stakeholder group is complex and its reasons for sometimes vocal opposition to CCS often have little to do with the technology. Rather, it refl ects concerns about the continued use of, and dependence on, fossil fuels and, sometimes, a lack of trust in the large industries and energy companies generally involved in CCS demonstration (Corry and Reiner, 2011; Corry and Riesch, 2012). To better understand the world and opinions of ENGOs, George Peridas, Natural Resources Defense Council, and Camilla Svendsen Skriung, Zero Emission Resource Organisation – founding organisational members of the ENGO Network on CCS – graciously agreed to be interviewed for this report.

THE GLOBAL STATUS OF CCS | 2013152
PU
BL
IC E
NG
AG
EM
EN
T
8
BOX 8.6
Interview with the International ENGO Network on CCS
As would be expected, our organisations approached CCS with caution … after a long and careful study of the available science, we have concluded that CCS can be carried out safely and effectively, provided it is adequately regulated. Our conclusions are based on, and are backed by, an overwhelming consensus of the scientifi c literature and prominent research institutions.
Camilla Svendsen Skriung, ZERO
Q: What is the International ENGO Network and what groups do you represent?
A: The International ENGO Network is a coalition of environmental non-government organisations that was formally established in 2011 to enable us to work more closely toward the safe and effective deployment of CCS as a timely mitigation tool for combating climate change.
We have members from different organisations across North America (Clean Air Task Force, Environmental Defense Fund, The Pembina Institute, Natural Resources Defense Council, World Resources Institute); Europe (The Bellona Foundation, Green Alliance, Zero Emissions Resource Organisation, E3G); and Asia Pacifi c (The Climate Institute). We conduct advocacy individually and as a group, and we aim to disseminate scientifi cally sound and objective materials on CCS.
Q: Do all members of the Network have a common position on CCS?
A: All members believe that because urgent reductions in greenhouse gas emissions are needed to prevent dangerous climate change, a variety of innovative solutions is necessary, and given the world’s current and projected reliance on fossil fuels, CCS is a critical mitigation technology that can achieve faster and deeper emissions reductions.
Currently, 10 different ENGOs participate in the Network. While there is no one uniform position on all aspects of CCS, we do share the following central goals:
ensure that CCS is performed and regulated safely, effectively, and according to best practices, in a manner that protects our climate, human health, and the environment
pursue domestic and international policies, regulations, and initiatives that enable CCS to deliver on its emissions reduction potential
disseminate scientifi cally sound and objective information on CCS technology
work toward common positions and responses to international developments in the CCS arena
work to phase-out the construction of new unabated, conventional coal–fi red power stations as soon as possible, with CCS playing a part of the solution. In developed countries, no new, conventional coal–fi red generation should be constructed without CCS
work to incorporate CCS in other types of fossil–fi red power generation, industrial sectors, and in combination with sustainable biomass.
Q: What do you see as the role of the Network in communicating about CCS?
A: Our goal is to communicate scientifi cally accurate and objective information about the technology to the public, stakeholders, and the government. We expend considerable effort to understand the technology in depth, and then distil that information in ways that are understood by a broad audience.
I Box 8.6 continued next page
THE GLOBAL STATUS OF CCS | 2013 153
PU
BL
IC E
NG
AG
EM
EN
T
8
BOX 8.6 (continued from previous page)
8.5 RECOMMENDATIONS AND OUTLOOKCCS is at something of a crossroads. For those immersed in a highly challenging environment with often slow-moving funding and policy commitments, it would be very easy to put the commercial deployment of CCS in the ‘too diffi cult’ basket. However, for those with an eye to the very real challenges of creating a sustainable low–carbon energy future, the commercial deployment of CCS is non-negotiable.
The value proposition for CCS does exist, but it is complex and challenging to communicate to an uninformed audience. To better position CCS in the minds of the public and policymakers, the encouraging work various CCS networks are starting to undertake to improve the defi nition and communication of the CCS value proposition in different regions must be continued and supported.
Since 2012, many projects and networks have taken the initiative to improve public engagement on CCS. It is clear from the comprehensive responses to the Institute’s 2013 survey that public engagement best practices are fi ltering through to emerging projects, although there is a need for more tangible examples of crucial activities like social site characterisation.
With an estimated 70 per cent of CCS emissions reductions needing to come from non-OECD nations by 2050 (IEA, ETP 2012), the importance of developing capacity and improving the accessibility of early CCS demonstration learning in these regions will be a key goal.
Finally, support for, and collaboration on, CCS by infl uential stakeholder groups like the ENGO Network are important for garnering public support and improving public understanding. This kind of support helps to position CCS in its rightful place as a key emissions reduction technology with a critical role to play in a low–carbon future. More of these collaborative relationships must be fostered to raise the public understanding and credibility of CCS.
We see our mission as particularly important, fi rst because industry and governments are not trusted sources by the public in many circumstances, and because few ENGOs have made the investment to come to grips with the scientifi c and technical intricacies of the technology. It is also important to understand that the application of CCS is not limited explicitly to coal, but extends to other industries such as natural gas, biomass, steel and cement.
Q: Traditionally, there has been a somewhat uneasy relationship between ENGOs and industrial developers, yet a number of the ENGO Network members are actively collaborating with early CCS project developers. Can you give us some examples of the benefi ts of this kind of collaboration?
A: Being supportive of a technology is not the same as backing every project that proposes to use it. A project is a complex balance of many environmental and social parameters, and carbon dioxide reductions alone do not make for an acceptable or desirable project. Other issues, such as air quality, water and land use, environmental justice, and others should be taken into account when evaluating a project. On industry’s part, honesty and transparency are always paramount when it comes to individual projects. Seeking input at the earliest opportunity from stakeholders is key, as well as providing them with meaningful pathways to make themselves heard and provide input into the decision making process. Successful partnerships between ENGOs and developers are far more likely to arise when these criteria are met.
I More information about the International ENGO Network and recent reports is available from
www.engonetwork.org and www.globalccsinstitute.com.

THE GLOBAL STATUS OF CCS | 2013154
AP
PE
ND
IXE
S
A
APPENDIX A: PROJECTS
A.1 Defi nition of LSIPs LSIPs are defi ned as projects involving the capture, transport, and storage of CO2 at a scale of:
at least 800,000 tonnes of CO2 annually for a coal–based power plant or
at least 400,000 tonnes of CO2 annually for other emissions–intensive industrial facilities (including natural gas–based power generation).
The thresholds listed above correspond to the minimum amounts of CO2 typically emitted by commercial–scale power plants and other industrial facilities. Projects at this scale must store anthropogenic CO2 permanently in geologic storage sites to qualify as LSIPs; projects that involve EOR using anthropogenic CO2 may also satisfy this defi nition. There is currently no clear standard or regulatory guidance on monitoring requirements involving CO2 storage associated with EOR. Accordingly, criteria regarding monitoring expectations for CO2–EOR are not included in the current LSIP defi nition. Generally, CO2–EOR projects will undertake some monitoring, using site-specifi c methods.
This defi nition of LSIPs will be regularly reviewed and adapted as CCS matures; as clear CCS legislation, regulation, and standards emerge; and as discussions progress on project boundaries, lifecycle analysis, and acceptable use of CO2.
A.2 Asset lifecycle defi nitionThe Project Lifecycle Model represents the various stages in the development of a CCS project, small or large, as it moves through planning, construction, operation, closure, and post-closure. There are different systems available to defi ne project stages, sometimes using different terminology, but all effectively use a similar lifecycle model. This framework (Figure A.1) refl ects the decision points in a project lifecycle at which developers either decide to continue to commit resources to refi ne the project further (gateways) or assess that future benefi ts will not cover the expected costs.
A project is considered to be in ‘planning’ when it is in the Identify, Evaluate, or Defi ne stages. A project is considered to be ‘active’ if it has made a positive FID and 1) has entered construction (Execute stage), or 2) is in operation (Operate stage), or 3) is in the process of ceasing operations (Closure stage). As a project progresses through each stage and the scope, cost, risk, and schedule become clearer, the project becomes more defi ned. This approach reduces uncertainty while managing upfront development costs.
In the Identify stage, a proponent carries out early studies and preliminary comparisons of alternatives to determine the business viability of a broad project concept. For example, an oil and gas company believes it could take concentrated CO2 from one of its natural gas processing facilities and inject and store the CO2 to increase oil production at one of its existing facilities. To start the process, the company would conduct preliminary desktop analysis of both the surface and subsurface requirements of the project to determine if the concept is viable and attractive. It is important that during the Identify stage, proponents consider all relevant aspects of the project (stakeholder management, project delivery, regulatory approvals, and infrastructure, as well as physical CCS facilities). Before progressing to the Evaluate stage, all options that meet the overall concept should be clearly identifi ed.
In the Evaluate stage, the range of options that could be employed is examined to build on the broad project concept. For the oil and gas company, this would involve exploring:
which of its facilities, and possibly even facilities of other companies, might be best placed to provide the concentrated CO2 for the project
pipeline routes that could be utilised from each of these sites, and even alternative transport options such as shipping, if relevant

THE GLOBAL STATUS OF CCS | 2013 155
AP
PE
ND
IXE
S
A
FIGURE A.1 Project Lifecycle Model
IDE
NTIFY
EVA
LUA
TEE
VALU
ATE
DE
FINE
PLA
NN
ING
EXE
CU
TEO
PE
RA
TEO
PE
RA
TEC
LOS
UR
E
AC
TIVE
PO
ST
CLO
SU
RE
CLO
SE
D
FIN
AL IN
VE
STM
EN
T D
EC
ISIO
ND
EC
OM
MIS
SIO
NE
DProject phase
and stageDeveloper’s goalsACTIVITIES
Capture and transportACTIVITIES
Storage
Sin
gle option
selectedH
andover to ow
ner for op
erations
Post-closu
re arrangem
ents
Consider
high-level
options.
Short-list
options for
further study.
“What could
it be?”
Exam
ine selected
option and provide
to allow
investment
decision to be
m
ade.
Dem
onstrate the
technical and
economic viability
of the project.
“What w
ill it be?”
Be capable of
being audited by
third parties (i.e.
peer review
ers,
investors).
Exam
ine
short-listed
options and
sub-options.
Establish if
Select one
best option for
taking forw
ard.
“What should
it be?”
Feasibility studies.
Estim
ate overall
project capital
cost (10–1
5%
)
and operating
costs (5%
).
Prefeasibility
studies.
Estim
ate overall
project capital
cost (20–2
5%
)
and operating
costs (10–15%).
Undertake
rem
aining
(detailed)
design.
Build
organisation to
comm
ission
and manage
asset.
Undertake
construction
activities.
Undertake
com
missioning.
Operate the
asset w
ithin
regulatory
compliance
requirem
ents,
for the
operating life
of the asset.
Decom
mission
asset to regulatory
com
pliance
requirements.
Rehabilitate site
for future use.
Build
organisation
and prepare
resources for
post closure.
Project
execution.
Asset operation.
Asset
decomm
issioning.
Monitor.
Asset
decomm
issioned. C
oncept
studies.
Site selection
studies.
Site assessm
ent
studies. D
esign and
installation. O
perate. C
lose. P
ost-closure
monitoring
program
being
implem
ented.
Site screening
studies.
Source: WorleyParsons 2009, modifi ed by Global CCS Institute

THE GLOBAL STATUS OF CCS | 2013156
AP
PE
ND
IXE
S
A
which oil production fi eld is suitable for CO2 injection based on its proximity to the concentrated CO2, stage of oil production at the fi eld, and other site factors.
For each option, the costs, benefi ts, risks, and opportunities are identifi ed. During the Evaluate stage, project proponents must continue to consider, for each option, all relevant aspects of the project (i.e. stakeholder management, project delivery, regulatory approvals, infrastructure, as well as physical CCS facilities). At the end of this stage, the preferred option is selected and becomes the subject of the Defi ne stage. No other options are studied in the Defi ne stage.
In the Defi ne stage, the selected option is investigated in greater detail through feasibility and preliminary FEED. For the oil and gas company, this would involve determining the specifi c technology to be used, design and overall project costs, required permits and approvals, and key risks to the project. Other activities during the Defi ne stage include conducting focused stakeholder engagement processes, seeking out fi nance or funding opportunities, and undertaking tender processes for engineering, procurement, and contracting suppliers.
At the end of the Defi ne stage, the project must be suffi ciently defi ned for an FID to be made. The level of confi dence in costing estimates should be ±10–15 per cent for overall project capital costs and for project operating costs. Collectively, the Identify, Evaluate, and Defi ne stages take between four and seven years. Development costs to reach an FID can be in the order of 10–15 per cent of overall project capital cost, depending on the size, industry, and complexity of the project.
In the Execute stage, the detailed engineering design is fi nalised, construction and commissioning of the plant occurs, and the organisation to operate the facility is established. Once completed, the project then moves into the Operate stage.
In the Operate stage, the CCS project is operated within regulatory requirements, and maintained and modifi ed, as needed, to improve performance.
In the Closure stage, the CCS project is decommissioned to comply with regulatory requirements. The site is rehabilitated for future defi ned use and resources are allocated to manage post-closure responsibilities.
In the Post-closure stage, the project is considered ‘Closed’, with assets having been decommissioned and a post-closure monitoring program implemented. The project is then considered inactive and is therefore closed.
Project proponents select the description that is most representative of the capture, transport, and storage lifecycle stages of their projects to respond to the Institute’s annual project survey. These are summarised in Table A.1.
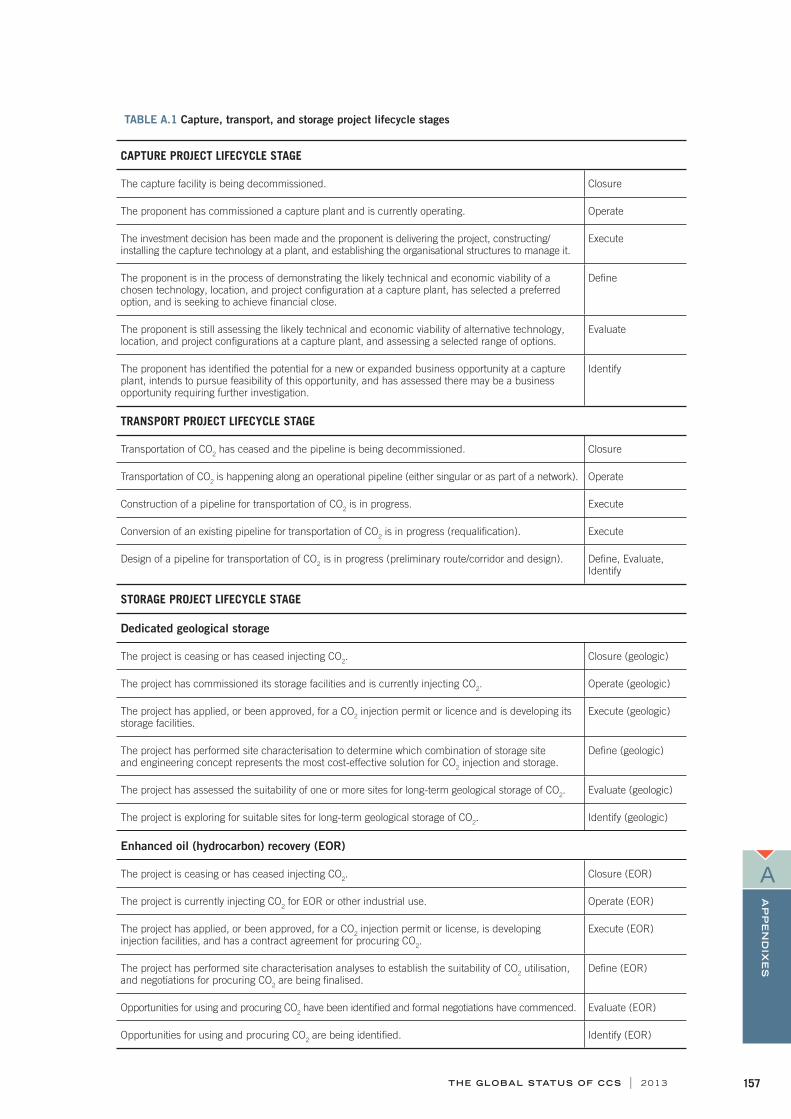
THE GLOBAL STATUS OF CCS | 2013 157
AP
PE
ND
IXE
S
A
TABLE A.1 Capture, transport, and storage project lifecycle stages
CAPTURE PROJECT LIFECYCLE STAGE
The capture facility is being decommissioned. Closure
The proponent has commissioned a capture plant and is currently operating. Operate
The investment decision has been made and the proponent is delivering the project, constructing/installing the capture technology at a plant, and establishing the organisational structures to manage it.
Execute
The proponent is in the process of demonstrating the likely technical and economic viability of a chosen technology, location, and project confi guration at a capture plant, has selected a preferred option, and is seeking to achieve fi nancial close.
Defi ne
The proponent is still assessing the likely technical and economic viability of alternative technology, location, and project confi gurations at a capture plant, and assessing a selected range of options.
Evaluate
The proponent has identifi ed the potential for a new or expanded business opportunity at a capture plant, intends to pursue feasibility of this opportunity, and has assessed there may be a business opportunity requiring further investigation.
Identify
TRANSPORT PROJECT LIFECYCLE STAGE
Transportation of CO2 has ceased and the pipeline is being decommissioned. Closure
Transportation of CO2 is happening along an operational pipeline (either singular or as part of a network). Operate
Construction of a pipeline for transportation of CO2 is in progress. Execute
Conversion of an existing pipeline for transportation of CO2 is in progress (requalifi cation). Execute
Design of a pipeline for transportation of CO2 is in progress (preliminary route/corridor and design). Defi ne, Evaluate, Identify
STORAGE PROJECT LIFECYCLE STAGE
Dedicated geological storage
The project is ceasing or has ceased injecting CO2. Closure (geologic)
The project has commissioned its storage facilities and is currently injecting CO2. Operate (geologic)
The project has applied, or been approved, for a CO2 injection permit or licence and is developing its storage facilities.
Execute (geologic)
The project has performed site characterisation to determine which combination of storage site and engineering concept represents the most cost-effective solution for CO2 injection and storage.
Defi ne (geologic)
The project has assessed the suitability of one or more sites for long-term geological storage of CO2. Evaluate (geologic)
The project is exploring for suitable sites for long-term geological storage of CO2. Identify (geologic)
Enhanced oil (hydrocarbon) recovery (EOR)
The project is ceasing or has ceased injecting CO2. Closure (EOR)
The project is currently injecting CO2 for EOR or other industrial use. Operate (EOR)
The project has applied, or been approved, for a CO2 injection permit or license, is developing injection facilities, and has a contract agreement for procuring CO2.
Execute (EOR)
The project has performed site characterisation analyses to establish the suitability of CO2 utilisation, and negotiations for procuring CO2 are being fi nalised.
Defi ne (EOR)
Opportunities for using and procuring CO2 have been identifi ed and formal negotiations have commenced. Evaluate (EOR)
Opportunities for using and procuring CO2 are being identifi ed. Identify (EOR)
THE GLOBAL STATUS OF CCS | 2013158
AP
PE
ND
IXE
S
A
A.3 Overview of survey and data analysis processSince 2009, the Global CCS Institute has maintained a comprehensive database of CCS projects to quantify progress toward CCS demonstration (Global CCS Institute, 2012, 2011a, 2011b and WorleyParsons et al., 2009). Historically, the LSIPs dataset has been compiled from an annual project survey completed by lead project proponents. The survey is designed to monitor projects’ progress through the asset lifecycle. It is supported by primary research undertaken by the Institute’s Asia Pacifi c, Americas, and Europe/Middle East/Africa offi ces, with results retained for proprietary analysis and published in summary form on the Institute’s public website and in reports.
In 2013, the Institute improved data systems and collection methods, providing project proponents access to a private project portal linked to a secure database. At the time of publication, the Institute had received survey returns from more than 80 per cent of surveyed projects, demonstrating a high level of direct engagement with projects around the world and allowing an empirical basis for analysis. For those projects that did not complete the survey in 2013, previously collected and publicly available data was used for analysis.
The improvements involved adopting a statistical framework to drive stronger process and control through survey efforts, and creating appropriate supporting structures for reinforcement.
The fi ve phases of the Institute’s framework involve:
1. Development: planning the survey, including deciding the topics about which information will be collected.
2. Collection: activities undertaken up to and including the lodgement of the completed survey forms from projects.
3. Processing: capture of responses on survey forms and representation in Institute systems.
4. Analysis/dissemination: development of a statistical package to inform annual reporting on overall development of CCS projects and their respective contributions toward demonstration.
5. Evaluation: bringing together all phases to assess performance in preparation for the following year/s.
This sequence allows the Institute to adopt a repeatable process with the necessary supporting structures in place.
Apart from surveying LSIPs, in 2013 the Institute continued to expand the survey to include some projects that do not fall into the defi nition of an LSIP. This may be continued in future surveys in recognition of the strong and valuable contribution to CCS that smaller, mid-sized, or non-integrated projects make. The Institute gratefully acknowledges survey participation by the following projects:
Alcoa Kwinana Carbonation Plant
Bell Creek Combined CO2 Enhanced Oil Recovery and CO2 Storage Project
Big Sky Carbon Sequestration Partnership – Kevin Dome (Montana State University)
Callide Oxyfuel Project
CO2CRC Otway Project Stage 2
COURSE50
CPI Lang Fang IGCC–CCS Project
Guodian CO2 Capture and Utilisation Project
Hontomín Technology Development Plant on CO2 Storage
HRL IDGCC Demonstration Project
HuaNeng GreenGen IGCC Project (Pilot CCS)
Huazhong University 35 MW Oxy-Combustion Project
Jilin Oil Field PetroChina EOR Project (Phase 1)
Lacq Pilot CCS project

THE GLOBAL STATUS OF CCS | 2013 159
AP
PE
ND
IXE
S
A
Midwest Geological Sequestration Consortium – Illinois Basin – Decatur Project – Development Phase
Midwest Regional Carbon Sequestration Partnership – Development Phase Project in Michigan
Miranga CO2 Experimental Site
Osaki CoolGen
Shanghai Shidongkou 2nd fi red power plant
Shenhua Ordos CTL Project (pilot phase)
Sinopec Shengli oil fi eld EOR Project (pilot)
Southern Company and MHI Plant Barry Demonstration Project
Tomakomai CCS Demonstration Project
Vattenfall Schwarze Pumpe Oxyfuel Pilot Plant
Wakamatsu EAGLE Project.

THE GLOBAL STATUS OF CCS | 2013160
AP
PE
ND
IXE
S
A
A.4 Reconciliation of LSIPs with 2012 status reportTable A.2 outlines major changes to LSIPs since The Global Status of CCS: 2012 was published in October 2012.
TABLE A.2 Reconciliation of LSIPs with those presented in The Global Status of CCS: 2012
COUNTRY LSIP CAPTURE CAPACITY (MTPA)
COMMENTS
Newly identifi ed LSIPs
Brazil Petrobras Lula Oil Field CCS Project
0.7 Offshore oil production with associated gas, CO2 separation and reinjection for EOR.
China Yanchang Jingbian CCS Project (Phase 2)
0.41 First phase commenced operation in 2012 and captures 50,000 tpa of CO2 for EOR, to be followed by a further 360,000 tpa transported by pipeline and stored by 2016.
Saudi Arabia Uthmaniyah CO2–EOR Demonstration Project
0.8 Will capture and store approximately 800,000 tpa of CO2 from a natural gas production and processing facility.
Projects removed from LSIP listing
Bulgaria Maritsa Thermal Power Plant CCS Project
2.5 This project is considered to be on hold, following advice that it is not currently being pursued.
Canada Swan Hills Synfuels A 'In-Situ Coal Gasifi cation/Power Generation Project'
1.2 to 1.4 This project is considered to be on hold. Swan Hills Synfuels has indicated that it will proceed with a CCS program as soon as natural gas prices increase to a range that makes it economically feasible.
Malta Sargas Green Power Plant Malta
0.7 This project’s capture capacity has been revised and it now falls outside the LSIP defi nition. It remains a notable project.
New Zealand Southland Coal & Fertilizer 1 This project is considered to be on hold. Its proponent, Solid Energy, is prioritising investment in other projects.
Poland Bełchatów 1.6 to 1.8 This project is considered cancelled. In April 2013, PGE announced it had cancelled Bełchatów because the company was unable to secure the necessary fi nancing.
The Netherlands
Eemshaven CCS 1.2 This project is considered to be on hold following a decision by the Dutch Government to support only the Green Hydrogen project submission in the NER300’s fi rst round.
Pegasus Rotterdam 2.5 This project is considered on hold following a decision by the Dutch Government to support only the Green Hydrogen project submission in the NER300’s fi rst round.
Green Hydrogen 0.5 This project is considered on hold after being considered not eligible for NER300 funding in late 2012.
UAE Hydrogen Power Abu Dhabi (HPAD)
1.7 Masdar has advised that this project can be considered on hold while it focuses on the delivery of the ESI project.
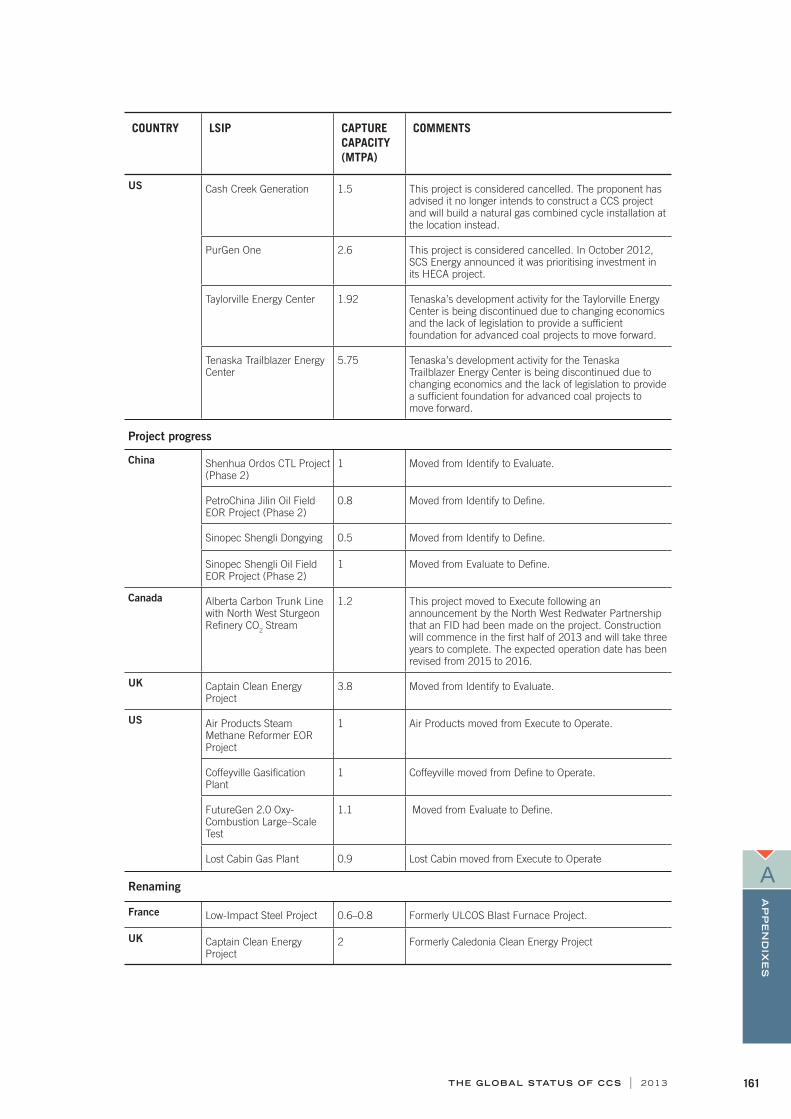
THE GLOBAL STATUS OF CCS | 2013 161
AP
PE
ND
IXE
S
A
COUNTRY LSIP CAPTURE CAPACITY (MTPA)
COMMENTS
US Cash Creek Generation 1.5 This project is considered cancelled. The proponent has advised it no longer intends to construct a CCS project and will build a natural gas combined cycle installation at the location instead.
PurGen One 2.6 This project is considered cancelled. In October 2012, SCS Energy announced it was prioritising investment in its HECA project.
Taylorville Energy Center 1.92 Tenaska’s development activity for the Taylorville Energy Center is being discontinued due to changing economics and the lack of legislation to provide a suffi cient foundation for advanced coal projects to move forward.
Tenaska Trailblazer Energy Center
5.75 Tenaska’s development activity for the Tenaska Trailblazer Energy Center is being discontinued due to changing economics and the lack of legislation to provide a suffi cient foundation for advanced coal projects to move forward.
Project progress
China Shenhua Ordos CTL Project (Phase 2)
1 Moved from Identify to Evaluate.
PetroChina Jilin Oil Field EOR Project (Phase 2)
0.8 Moved from Identify to Defi ne.
Sinopec Shengli Dongying 0.5 Moved from Identify to Defi ne.
Sinopec Shengli Oil Field EOR Project (Phase 2)
1 Moved from Evaluate to Defi ne.
Canada Alberta Carbon Trunk Line with North West Sturgeon Refi nery CO2 Stream
1.2 This project moved to Execute following an announcement by the North West Redwater Partnership that an FID had been made on the project. Construction will commence in the fi rst half of 2013 and will take three years to complete. The expected operation date has been revised from 2015 to 2016.
UK Captain Clean Energy Project
3.8 Moved from Identify to Evaluate.
US Air Products Steam Methane Reformer EOR Project
1 Air Products moved from Execute to Operate.
Coffeyville Gasifi cation Plant
1 Coffeyville moved from Defi ne to Operate.
FutureGen 2.0 Oxy-Combustion Large–Scale Test
1.1 Moved from Evaluate to Defi ne.
Lost Cabin Gas Plant 0.9 Lost Cabin moved from Execute to Operate
Renaming
France Low-Impact Steel Project 0.6–0.8 Formerly ULCOS Blast Furnace Project.
UK Captain Clean Energy Project
2 Formerly Caledonia Clean Energy Project
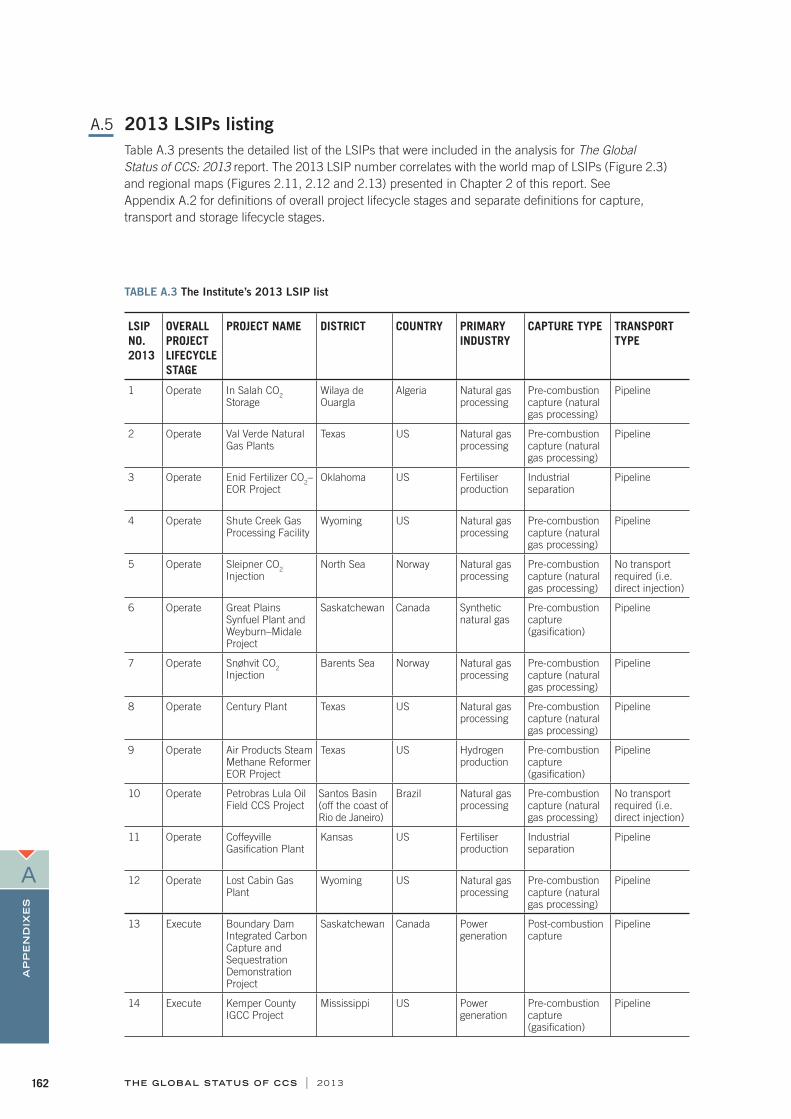
THE GLOBAL STATUS OF CCS | 2013162
AP
PE
ND
IXE
S
A
TABLE A.3 The Institute’s 2013 LSIP list
LSIP NO. 2013
OVERALL PROJECT LIFECYCLE STAGE
PROJECT NAME DISTRICT COUNTRY PRIMARY INDUSTRY
CAPTURE TYPE TRANSPORT TYPE
1 Operate In Salah CO2 Storage
Wilaya de Ouargla
Algeria Natural gas processing
Pre-combustion capture (natural gas processing)
Pipeline
2 Operate Val Verde Natural Gas Plants
Texas US Natural gas processing
Pre-combustion capture (natural gas processing)
Pipeline
3 Operate Enid Fertilizer CO2–EOR Project
Oklahoma US Fertiliser production
Industrial separation
Pipeline
4 Operate Shute Creek Gas Processing Facility
Wyoming US Natural gas processing
Pre-combustion capture (natural gas processing)
Pipeline
5 Operate Sleipner CO2 Injection
North Sea Norway Natural gas processing
Pre-combustion capture (natural gas processing)
No transport required (i.e. direct injection)
6 Operate Great Plains Synfuel Plant and Weyburn–Midale Project
Saskatchewan Canada Synthetic natural gas
Pre-combustion capture (gasifi cation)
Pipeline
7 Operate Snøhvit CO2 Injection
Barents Sea Norway Natural gas processing
Pre-combustion capture (natural gas processing)
Pipeline
8 Operate Century Plant Texas US Natural gas processing
Pre-combustion capture (natural gas processing)
Pipeline
9 Operate Air Products Steam Methane Reformer EOR Project
Texas US Hydrogen production
Pre-combustion capture (gasifi cation)
Pipeline
10 Operate Petrobras Lula Oil Field CCS Project
Santos Basin (off the coast of Rio de Janeiro)
Brazil Natural gas processing
Pre-combustion capture (natural gas processing)
No transport required (i.e. direct injection)
11 Operate Coffeyville Gasifi cation Plant
Kansas US Fertiliser production
Industrial separation
Pipeline
12 Operate Lost Cabin Gas Plant
Wyoming US Natural gas processing
Pre-combustion capture (natural gas processing)
Pipeline
13 Execute Boundary Dam Integrated Carbon Capture and Sequestration Demonstration Project
Saskatchewan Canada Power generation
Post-combustion capture
Pipeline
14 Execute Kemper County IGCC Project
Mississippi US Power generation
Pre-combustion capture (gasifi cation)
Pipeline
A.5 2013 LSIPs listingTable A.3 presents the detailed list of the LSIPs that were included in the analysis for The Global Status of CCS: 2013 report. The 2013 LSIP number correlates with the world map of LSIPs (Figure 2.3) and regional maps (Figures 2.11, 2.12 and 2.13) presented in Chapter 2 of this report. See Appendix A.2 for defi nitions of overall project lifecycle stages and separate defi nitions for capture, transport and storage lifecycle stages.

THE GLOBAL STATUS OF CCS | 2013 163
AP
PE
ND
IXE
S
A
TRANSPORT DISTANCE (KM)
CAPTURE PROJECT LIFECYCLE STAGE
TRANSPORT PROJECT LIFECYCLE STAGE
STORAGE PROJECT LIFECYCLE STAGE
PRIMARY STORAGE OPTION
PRIMARY STORAGE SUBTYPE
CAPTURE CAPACITY (MTPA)
YEAR OF OPERATION
LSIP NO. 2012
14 Operate Operational transport
This project has suspended injection of CO2.
Dedicated geological storage
Onshore deep saline formations
0 (Injection suspended)
2004 6
132 Operate Operational transport
Operate Enhanced hydrocarbon recovery
Use of CO2 in EOR
1.3 1972 1
225 Operate Operational transport
Operate Enhanced hydrocarbon recovery
Use of CO2 in EOR
0.7 1982 2
403 Operate Operational transport
Operate Enhanced hydrocarbon recovery
Use of CO2 in EOR
7 1986 3
0.11 Operate Operational transport
Operate Dedicated geological storage
Offshore deep saline formations
0.9 1996 4
315 Operate Operational transport
Operate Enhanced hydrocarbon recovery
Use of CO2 in EOR
3 2000 5
152 Operate Operational transport
Operate Dedicated geological storage
Offshore deep saline formations
0.6–0.8 2008 7
69 Operate Operational transport
Operate Enhanced hydrocarbon recovery
Use of CO2 in EOR
8.4 2010 8
101–150 Operate Operational transport
Operate Enhanced hydrocarbon recovery
Use of CO2 in EOR
1 2013 9
Not specifi ed Operate Operational transport
Operate Enhanced hydrocarbon recovery
Use of CO2 in EOR
0.7 2013 new
112 Operate Operational transport
Operate Enhanced hydrocarbon recovery
Use of CO2 in EOR
1 2013 17
Not specifi ed Operate Operational transport
Operate Enhanced hydrocarbon recovery
Use of CO2 in EOR
0.8–1.0 2013 10
100 Execute Design of pipeline
Defi ne Enhanced hydrocarbon recovery
Use of CO2 in EOR
1 2014 13
75 Execute Design of pipeline
Execute Enhanced hydrocarbon recovery
Use of CO2 in EOR
3.5 2014 14
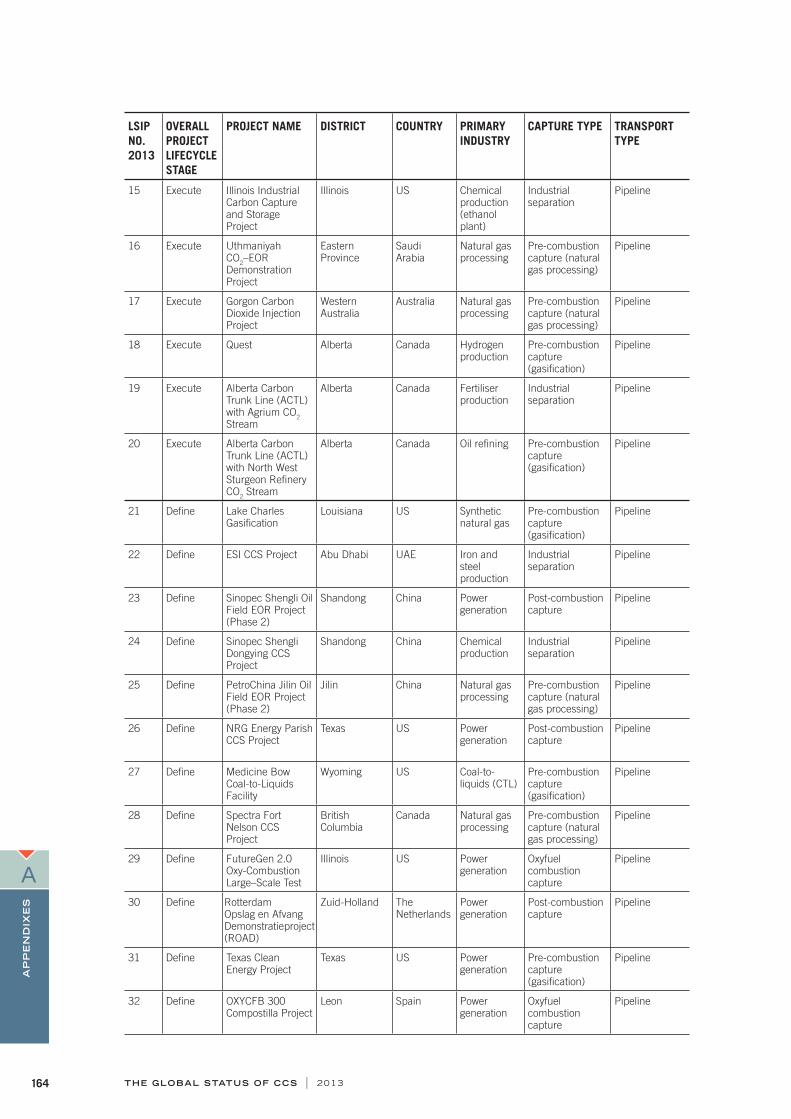
THE GLOBAL STATUS OF CCS | 2013164
AP
PE
ND
IXE
S
A
LSIP NO. 2013
OVERALL PROJECT LIFECYCLE STAGE
PROJECT NAME DISTRICT COUNTRY PRIMARY INDUSTRY
CAPTURE TYPE TRANSPORT TYPE
15 Execute Illinois Industrial Carbon Capture and Storage Project
Illinois US Chemical production (ethanol plant)
Industrial separation
Pipeline
16 Execute Uthmaniyah CO2–EOR Demonstration Project
Eastern Province
Saudi Arabia
Natural gas processing
Pre-combustion capture (natural gas processing)
Pipeline
17 Execute Gorgon Carbon Dioxide Injection Project
Western Australia
Australia Natural gas processing
Pre-combustion capture (natural gas processing)
Pipeline
18 Execute Quest Alberta Canada Hydrogen production
Pre-combustion capture (gasifi cation)
Pipeline
19 Execute Alberta Carbon Trunk Line (ACTL) with Agrium CO2 Stream
Alberta Canada Fertiliser production
Industrial separation
Pipeline
20 Execute Alberta Carbon Trunk Line (ACTL) with North West Sturgeon Refi nery CO2 Stream
Alberta Canada Oil refi ning Pre-combustion capture (gasifi cation)
Pipeline
21 Defi ne Lake Charles Gasifi cation
Louisiana US Synthetic natural gas
Pre-combustion capture (gasifi cation)
Pipeline
22 Defi ne ESI CCS Project Abu Dhabi UAE Iron and steel production
Industrial separation
Pipeline
23 Defi ne Sinopec Shengli Oil Field EOR Project (Phase 2)
Shandong China Power generation
Post-combustion capture
Pipeline
24 Defi ne Sinopec Shengli Dongying CCS Project
Shandong China Chemical production
Industrial separation
Pipeline
25 Defi ne PetroChina Jilin Oil Field EOR Project (Phase 2)
Jilin China Natural gas processing
Pre-combustion capture (natural gas processing)
Pipeline
26 Defi ne NRG Energy Parish CCS Project
Texas US Power generation
Post-combustion capture
Pipeline
27 Defi ne Medicine Bow Coal-to-Liquids Facility
Wyoming US Coal-to-liquids (CTL)
Pre-combustion capture (gasifi cation)
Pipeline
28 Defi ne Spectra Fort Nelson CCS Project
British Columbia
Canada Natural gas processing
Pre-combustion capture (natural gas processing)
Pipeline
29 Defi ne FutureGen 2.0 Oxy-Combustion Large–Scale Test
Illinois US Power generation
Oxyfuel combustion capture
Pipeline
30 Defi ne Rotterdam Opslag en Afvang Demonstratieproject (ROAD)
Zuid-Holland The Netherlands
Power generation
Post-combustion capture
Pipeline
31 Defi ne Texas Clean Energy Project
Texas US Power generation
Pre-combustion capture (gasifi cation)
Pipeline
32 Defi ne OXYCFB 300 Compostilla Project
Leon Spain Power generation
Oxyfuel combustion capture
Pipeline

THE GLOBAL STATUS OF CCS | 2013 165
AP
PE
ND
IXE
S
A
TRANSPORT DISTANCE (KM)
CAPTURE PROJECT LIFECYCLE STAGE
TRANSPORT PROJECT LIFECYCLE STAGE
STORAGE PROJECT LIFECYCLE STAGE
PRIMARY STORAGE OPTION
PRIMARY STORAGE SUBTYPE
CAPTURE CAPACITY (MTPA)
YEAR OF OPERATION
LSIP NO. 2012
1.6 Execute Construction of pipeline
Execute Dedicated geological storage
Onshore deep saline formations
0.8–1.0 2014 11
70 Execute Construction of pipeline
Execute Enhanced hydrocarbon recovery
Use of CO2 in EOR
0.8 2014 New
7 Execute Construction of pipeline
Execute Dedicated geological storage
Onshore deep saline formations
3.4–4.1 2015 15
65 Execute Design of pipeline
Execute Dedicated geological storage
Onshore deep saline formations
1.1 2015 16
240 Execute Design of pipeline
Defi ne Enhanced hydrocarbon recovery
Use of CO2 in EOR
0.4–0.6 2015 12
240 Execute Design of pipeline
Defi ne Enhanced hydrocarbon recovery
Use of CO2 in EOR
1.2–1.4 2016 19
Not specifi ed Defi ne Design of pipeline
Execute Enhanced hydrocarbon recovery
Use of CO2 in EOR
4.5 2015 18
47 Defi ne Design of pipeline
Defi ne Enhanced hydrocarbon recovery
Use of CO2 in EOR
0.8 2015 20
51–100 Defi ne Design of pipeline
Execute Enhanced hydrocarbon recovery
Use of CO2 in EOR
1 2015 50
70 Defi ne Design of pipeline
Execute Enhanced hydrocarbon recovery
Use of CO2 in EOR
0.5 2015 72
35 Defi ne Design of pipeline
Execute Enhanced hydrocarbon recovery
Use of CO2 in EOR
0.8 2015 62
132 Defi ne Design of pipeline
Defi ne Enhanced hydrocarbon recovery
Use of CO2 in EOR
1.4–1.6 2016 22
Not specifi ed Defi ne Operational transport
Not Specifi ed Enhanced hydrocarbon recovery
Use of CO2 in EOR
2.0–3.0 2016 21
35 Defi ne Design of pipeline
Evaluate Dedicated geological storage
Onshore deep saline formations
2.2 2017 30
47 Defi ne Design of Pipeline
Execute Dedicated geological storage
Onshore deep saline formations
1.1 2017 44
25 Defi ne Design of pipeline
Defi ne Dedicated geological storage
Offshore depleted oil and/or gas reservoir
1.0–1.2 2017 25
<50 Defi ne Operational transport
Execute Enhanced hydrocarbon recovery
Use of CO2 in EOR
2.0–3.0 2017 27
136 Defi ne Design of pipeline
Defi ne Dedicated geological storage
Onshore deep saline formations
1.0–1.2 2018 23
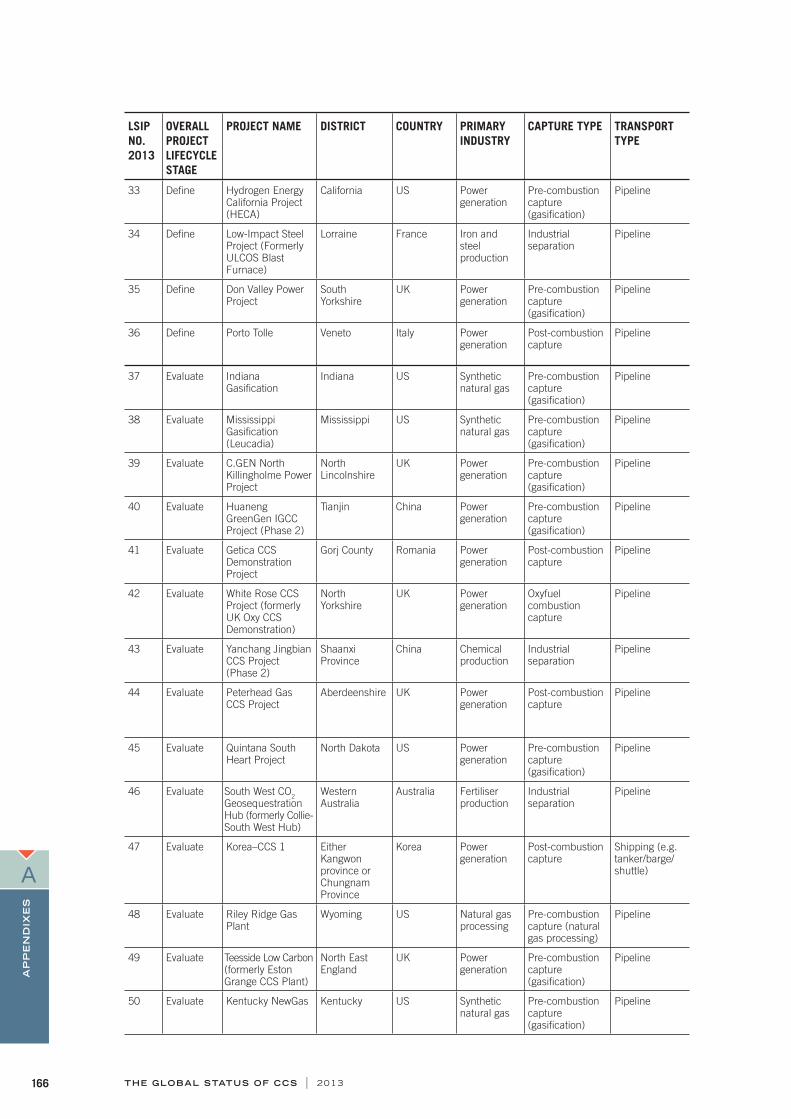
THE GLOBAL STATUS OF CCS | 2013166
AP
PE
ND
IXE
S
A
LSIP NO. 2013
OVERALL PROJECT LIFECYCLE STAGE
PROJECT NAME DISTRICT COUNTRY PRIMARY INDUSTRY
CAPTURE TYPE TRANSPORT TYPE
33 Defi ne Hydrogen Energy California Project (HECA)
California US Power generation
Pre-combustion capture (gasifi cation)
Pipeline
34 Defi ne Low-Impact Steel Project (Formerly ULCOS Blast Furnace)
Lorraine France Iron and steel production
Industrial separation
Pipeline
35 Defi ne Don Valley Power Project
South Yorkshire
UK Power generation
Pre-combustion capture (gasifi cation)
Pipeline
36 Defi ne Porto Tolle Veneto Italy Power generation
Post-combustion capture
Pipeline
37 Evaluate Indiana Gasifi cation
Indiana US Synthetic natural gas
Pre-combustion capture (gasifi cation)
Pipeline
38 Evaluate Mississippi Gasifi cation (Leucadia)
Mississippi US Synthetic natural gas
Pre-combustion capture (gasifi cation)
Pipeline
39 Evaluate C.GEN North Killingholme Power Project
North Lincolnshire
UK Power generation
Pre-combustion capture (gasifi cation)
Pipeline
40 Evaluate Huaneng GreenGen IGCC Project (Phase 2)
Tianjin China Power generation
Pre-combustion capture (gasifi cation)
Pipeline
41 Evaluate Getica CCS Demonstration Project
Gorj County Romania Power generation
Post-combustion capture
Pipeline
42 Evaluate White Rose CCS Project (formerly UK Oxy CCS Demonstration)
North Yorkshire
UK Power generation
Oxyfuel combustion capture
Pipeline
43 Evaluate Yanchang Jingbian CCS Project (Phase 2)
Shaanxi Province
China Chemical production
Industrial separation
Pipeline
44 Evaluate Peterhead Gas CCS Project
Aberdeenshire UK Power generation
Post-combustion capture
Pipeline
45 Evaluate Quintana South Heart Project
North Dakota US Power generation
Pre-combustion capture (gasifi cation)
Pipeline
46 Evaluate South West CO2 Geosequestration Hub (formerly Collie-South West Hub)
Western Australia
Australia Fertiliser production
Industrial separation
Pipeline
47 Evaluate Korea–CCS 1 Either Kangwon province or Chungnam Province
Korea Power generation
Post-combustion capture
Shipping (e.g. tanker/barge/shuttle)
48 Evaluate Riley Ridge Gas Plant
Wyoming US Natural gas processing
Pre-combustion capture (natural gas processing)
Pipeline
49 Evaluate Teesside Low Carbon (formerly Eston Grange CCS Plant)
North East England
UK Power generation
Pre-combustion capture (gasifi cation)
Pipeline
50 Evaluate Kentucky NewGas Kentucky US Synthetic natural gas
Pre-combustion capture (gasifi cation)
Pipeline
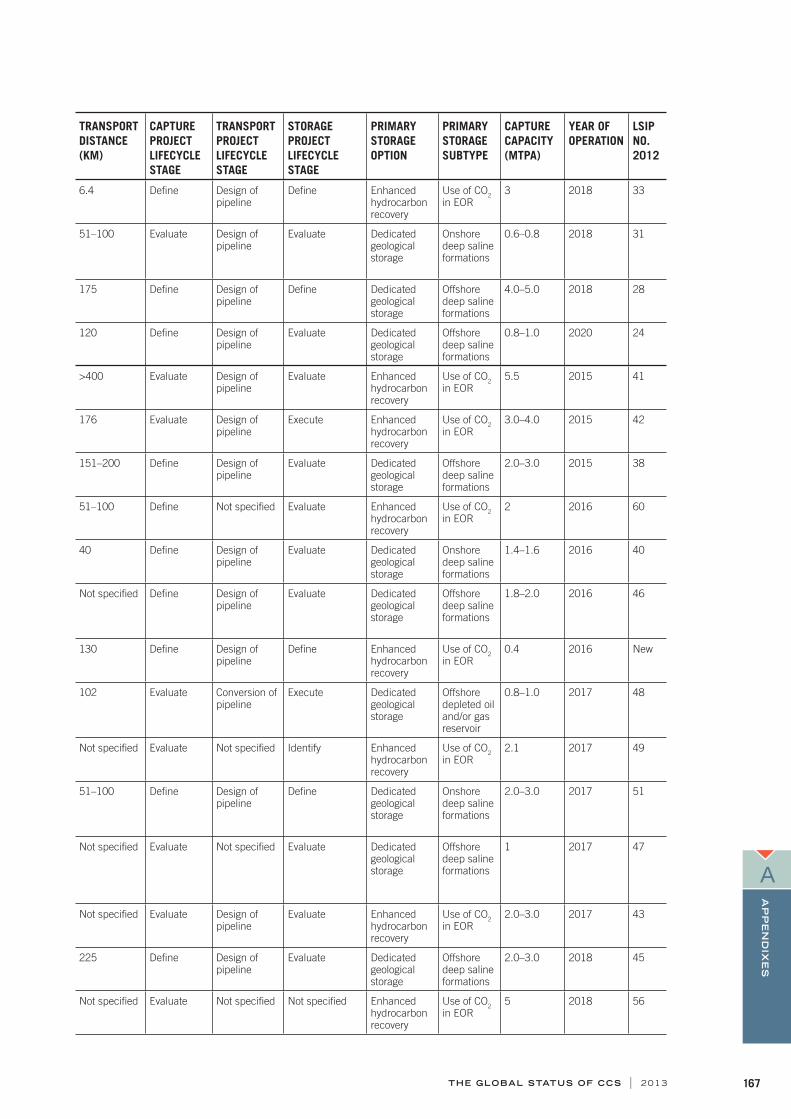
THE GLOBAL STATUS OF CCS | 2013 167
AP
PE
ND
IXE
S
A
TRANSPORT DISTANCE (KM)
CAPTURE PROJECT LIFECYCLE STAGE
TRANSPORT PROJECT LIFECYCLE STAGE
STORAGE PROJECT LIFECYCLE STAGE
PRIMARY STORAGE OPTION
PRIMARY STORAGE SUBTYPE
CAPTURE CAPACITY (MTPA)
YEAR OF OPERATION
LSIP NO. 2012
6.4 Defi ne Design of pipeline
Defi ne Enhanced hydrocarbon recovery
Use of CO2 in EOR
3 2018 33
51–100 Evaluate Design of pipeline
Evaluate Dedicated geological storage
Onshore deep saline formations
0.6–0.8 2018 31
175 Defi ne Design of pipeline
Defi ne Dedicated geological storage
Offshore deep saline formations
4.0–5.0 2018 28
120 Defi ne Design of pipeline
Evaluate Dedicated geological storage
Offshore deep saline formations
0.8–1.0 2020 24
>400 Evaluate Design of pipeline
Evaluate Enhanced hydrocarbon recovery
Use of CO2 in EOR
5.5 2015 41
176 Evaluate Design of pipeline
Execute Enhanced hydrocarbon recovery
Use of CO2 in EOR
3.0–4.0 2015 42
151–200 Defi ne Design of pipeline
Evaluate Dedicated geological storage
Offshore deep saline formations
2.0–3.0 2015 38
51–100 Defi ne Not specifi ed Evaluate Enhanced hydrocarbon recovery
Use of CO2 in EOR
2 2016 60
40 Defi ne Design of pipeline
Evaluate Dedicated geological storage
Onshore deep saline formations
1.4–1.6 2016 40
Not specifi ed Defi ne Design of pipeline
Evaluate Dedicated geological storage
Offshore deep saline formations
1.8–2.0 2016 46
130 Defi ne Design of pipeline
Defi ne Enhanced hydrocarbon recovery
Use of CO2 in EOR
0.4 2016 New
102 Evaluate Conversion of pipeline
Execute Dedicated geological storage
Offshore depleted oil and/or gas reservoir
0.8–1.0 2017 48
Not specifi ed Evaluate Not specifi ed Identify Enhanced hydrocarbon recovery
Use of CO2 in EOR
2.1 2017 49
51–100 Defi ne Design of pipeline
Defi ne Dedicated geological storage
Onshore deep saline formations
2.0–3.0 2017 51
Not specifi ed Evaluate Not specifi ed Evaluate Dedicated geological storage
Offshore deep saline formations
1 2017 47
Not specifi ed Evaluate Design of pipeline
Evaluate Enhanced hydrocarbon recovery
Use of CO2 in EOR
2.0–3.0 2017 43
225 Defi ne Design of pipeline
Evaluate Dedicated geological storage
Offshore deep saline formations
2.0–3.0 2018 45
Not specifi ed Evaluate Not specifi ed Not specifi ed Enhanced hydrocarbon recovery
Use of CO2 in EOR
5 2018 56
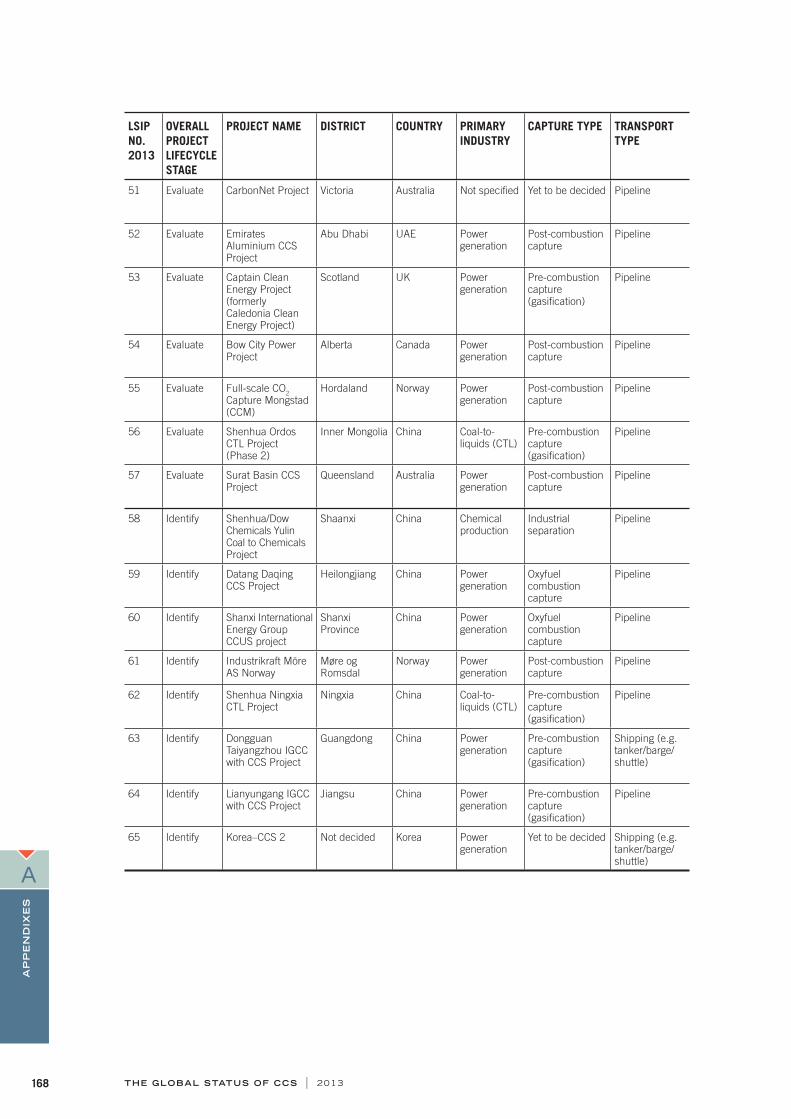
THE GLOBAL STATUS OF CCS | 2013168
AP
PE
ND
IXE
S
A
LSIP NO. 2013
OVERALL PROJECT LIFECYCLE STAGE
PROJECT NAME DISTRICT COUNTRY PRIMARY INDUSTRY
CAPTURE TYPE TRANSPORT TYPE
51 Evaluate CarbonNet Project Victoria Australia Not specifi ed Yet to be decided Pipeline
52 Evaluate Emirates Aluminium CCS Project
Abu Dhabi UAE Power generation
Post-combustion capture
Pipeline
53 Evaluate Captain Clean Energy Project (formerly Caledonia Clean Energy Project)
Scotland UK Power generation
Pre-combustion capture (gasifi cation)
Pipeline
54 Evaluate Bow City Power Project
Alberta Canada Power generation
Post-combustion capture
Pipeline
55 Evaluate Full-scale CO2 Capture Mongstad (CCM)
Hordaland Norway Power generation
Post-combustion capture
Pipeline
56 Evaluate Shenhua Ordos CTL Project (Phase 2)
Inner Mongolia China Coal-to-liquids (CTL)
Pre-combustion capture (gasifi cation)
Pipeline
57 Evaluate Surat Basin CCS Project
Queensland Australia Power generation
Post-combustion capture
Pipeline
58 Identify Shenhua/Dow Chemicals Yulin Coal to Chemicals Project
Shaanxi China Chemical production
Industrial separation
Pipeline
59 Identify Datang Daqing CCS Project
Heilongjiang China Power generation
Oxyfuel combustion capture
Pipeline
60 Identify Shanxi International Energy Group CCUS project
Shanxi Province
China Power generation
Oxyfuel combustion capture
Pipeline
61 Identify Industrikraft Möre AS Norway
Møre og Romsdal
Norway Power generation
Post-combustion capture
Pipeline
62 Identify Shenhua Ningxia CTL Project
Ningxia China Coal-to-liquids (CTL)
Pre-combustion capture (gasifi cation)
Pipeline
63 Identify Dongguan Taiyangzhou IGCC with CCS Project
Guangdong China Power generation
Pre-combustion capture (gasifi cation)
Shipping (e.g. tanker/barge/shuttle)
64 Identify Lianyungang IGCC with CCS Project
Jiangsu China Power generation
Pre-combustion capture (gasifi cation)
Pipeline
65 Identify Korea–CCS 2 Not decided Korea Power generation
Yet to be decided Shipping (e.g. tanker/barge/shuttle)

THE GLOBAL STATUS OF CCS | 2013 169
AP
PE
ND
IXE
S
A
TRANSPORT DISTANCE (KM)
CAPTURE PROJECT LIFECYCLE STAGE
TRANSPORT PROJECT LIFECYCLE STAGE
STORAGE PROJECT LIFECYCLE STAGE
PRIMARY STORAGE OPTION
PRIMARY STORAGE SUBTYPE
CAPTURE CAPACITY (MTPA)
YEAR OF OPERATION
LSIP NO. 2012
51–100 Identify Design of pipeline
Evaluate Dedicated geological storage
Offshore deep saline formations
0.8–1.0 2018 53
351–400 Defi ne Design of pipeline
Defi ne Enhanced hydrocarbon recovery
Use of CO2 in EOR
2 2018 55
351–400 Defi ne Design of pipeline
Evaluate Dedicated geological storage
Offshore deep saline formations
3.8 2018 66
51–100 Evaluate Design of pipeline
Evaluate Enhanced hydrocarbon recovery
Use of CO2 in EOR
1 2019 52
Not specifi ed Evaluate Design of pipeline
Identify Dedicated geological storage
Offshore deep saline formations
1.0–1.2 2020 59
201–250 Evaluate Not specifi ed Defi ne Dedicated geological storage
Onshore deep saline formations
1 2020 68
151–200 Evaluate Design of pipeline
Defi ne Dedicated geological storage
Onshore deep saline formations
1 2022 61
<50 Identify Not specifi ed Identify Dedicated geological storage
Onshore deep saline formations
2.0–3.0 2017 69
Not specifi ed Evaluate Design of pipeline
Identify Dedicated geological storage
Onshore deep saline formations
1.0–1.2 2018 70
Not specifi ed Identify Not specifi ed Identify Not specifi ed Not specifi ed
1.0–1.2 2018 74
Not specifi ed Defi ne Design of pipeline
Not specifi ed Not specifi ed Not specifi ed
1.4–1.6 2018 63
201–250 Identify Not specifi ed Not specifi ed Not specifi ed Not specifi ed
2 2018 75
201–250 Identify Not specifi ed Identify Dedicated geological storage
Offshore depleted oil and/or gas reservoir
1 2019 71
201–250 Identify Not specifi ed Identify Enhanced hydrocarbon recovery
Use of CO2 in EOR
0.8–1.0 2019 73
Not specifi ed Identify Not specifi ed Evaluate Dedicated geological storage
Offshore deep saline formations
1 2019 64

THE GLOBAL STATUS OF CCS | 2013170
AP
PE
ND
IXE
S
B
APPENDIX B: BUSINESS CASE FUNDAMENTALS FOR CCS PROJECTS
B.1 Defi nition of a business caseThe business case for a project provides the strategic, fi nancial, commercial, technical, operational, and other information and analysis necessary to make an FID about whether an investment or project should be implemented. In particular, a business case provides justifi cation for the project or investment with respect to its alignment with the objectives of the organisation. The business case also provides the basis for managing and controlling the delivery of the project on time, within budget, and to the agreed quality standards and time frames.
As such, it will normally include:
a detailed description of the project, including technical recommendations arising from the design and engineering studies commissioned when preparing the project’s business case
an analysis describing the rationale for the project and the needs it meets
an economic assessment of the costs and benefi ts of the project
an outline of the risk-adjusted capital and operating costs required to deliver the project
an investment appraisal of the project to determine whether it is fi nancially feasible
a fi nancing plan defi ning how the project is to be funded from private and public sources
a project fi nancial model with justifi cation for assumptions
a risk assessment to identify, quantify, and mitigate material risks
a delivery plan setting out time frames, resources, governance, and reporting.
B.2 Complexity of a CCS business caseThe development of a business case for a CCS project is particularly complex because the various elements of the CCS chain must be integrated. Correspondingly, technical, commercial, fi nancial, and operational factors need to be taken into account, in addition to the wide range of considerations applicable to a conventional project.
This increased complexity is a corollary of the higher fi nancing risk profi le that applies to CCS projects, compared to their conventional counterparts. The increased fi nancing risk applies throughout the project’s lifecycle, from the construction of the project through to the closure of the storage sites, where long-term liabilities extend beyond the capture plant’s operating life (Table B.1).
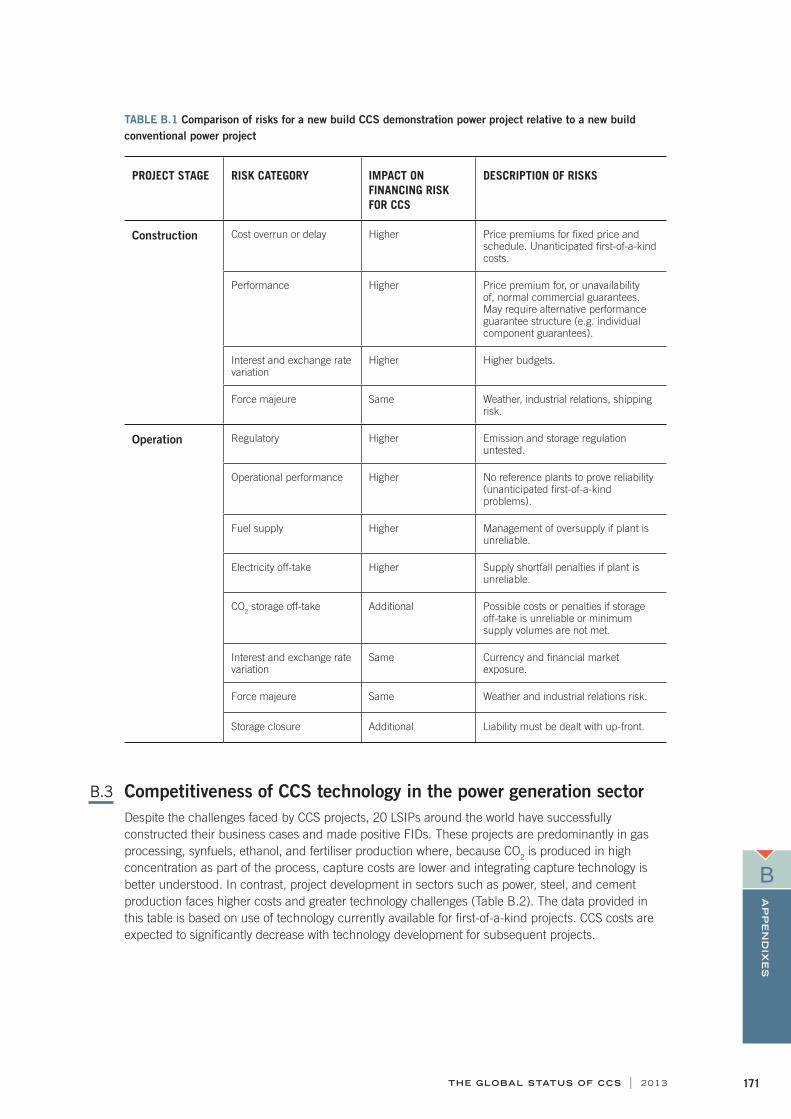
THE GLOBAL STATUS OF CCS | 2013 171
AP
PE
ND
IXE
S
B
TABLE B.1 Comparison of risks for a new build CCS demonstration power project relative to a new build conventional power project
PROJECT STAGE RISK CATEGORY IMPACT ON FINANCING RISK FOR CCS
DESCRIPTION OF RISKS
Construction Cost overrun or delay Higher Price premiums for fi xed price and schedule. Unanticipated fi rst-of-a-kind costs.
Performance Higher Price premium for, or unavailability of, normal commercial guarantees. May require alternative performance guarantee structure (e.g. individual component guarantees).
Interest and exchange rate variation
Higher Higher budgets.
Force majeure Same Weather, industrial relations, shipping risk.
Operation Regulatory Higher Emission and storage regulation untested.
Operational performance Higher No reference plants to prove reliability (unanticipated fi rst-of-a-kind problems).
Fuel supply Higher Management of oversupply if plant is unreliable.
Electricity off-take Higher Supply shortfall penalties if plant is unreliable.
CO2 storage off-take Additional Possible costs or penalties if storage off-take is unreliable or minimum supply volumes are not met.
Interest and exchange rate variation
Same Currency and fi nancial market exposure.
Force majeure Same Weather and industrial relations risk.
Storage closure Additional Liability must be dealt with up-front.
B.3 Competitiveness of CCS technology in the power generation sectorDespite the challenges faced by CCS projects, 20 LSIPs around the world have successfully constructed their business cases and made positive FIDs. These projects are predominantly in gas processing, synfuels, ethanol, and fertiliser production where, because CO2 is produced in high concentration as part of the process, capture costs are lower and integrating capture technology is better understood. In contrast, project development in sectors such as power, steel, and cement production faces higher costs and greater technology challenges (Table B.2). The data provided in this table is based on use of technology currently available for fi rst-of-a-kind projects. CCS costs are expected to signifi cantly decrease with technology development for subsequent projects.

THE GLOBAL STATUS OF CCS | 2013172
AP
PE
ND
IXE
S
B
TABLE B.2 Comparison of production cost increases with the addition of CO2 capture
POWER GENERATION HIGHER COST CO2 CAPTURE FROM INDUSTRIAL SOURCES
LOWER COST CO2 CAPTURE FROM INDUSTRIAL SOURCES
Post-combustion
Oxyfuel IGCC NGCC Steel production
Cement production
Natural gas processing
Fertiliser production
Increase in cost of production with CCS (fi rst-of-a-kind) (%)
61–76 53–65 37 40 10–14 39–52 1 3
Source: WorleyParsons and Schlumberger, 2011.
Despite the added costs, CCS is a competitive technology for the power sector when compared to other large–scale abatement options (Figure B.1) on the basis of cost of CO2 avoided. In addition, the fi nite availability of lesser cost options (geothermal, wind, and hydro resources) limits their role in meeting emissions targets, and requires higher cost options such as CCS, solar, and nuclear technologies to be deployed concurrently to meet energy supply needs.
FIGURE B.1 Costs of CO2 avoided
-38-27
-8 -79
23
67
90
139
182
0 016
25
49
92106
176
203
239
-50
0
50
100
150
200
300
Geoth
erm
al
Hyd
ropo
wer
Wind
onsh
ore
Nuc
lear
Biom
ass
CCS (n
atur
al gas
)
CCS (c
oal)
Wind
offsho
re
Solar t
herm
al
Solar P
V
US
$ p
er
tonne
Source: Global CCS Institute, 2011.Notes for fi gure: The cost of CO2 avoided identifi es the cost of reducing emissions relative to the amount of fossil fuel emissions displaced, expressed in US dollars per tonne of CO2.
The cost estimates presented here include the costs of constructing and operating the technology assessed. Other costs, including network connections and changes to reserve requirements, are not included in these estimates.
For all technologies except gas–fi red CCS power generation plants, the amount of CO2 avoided is relative to the emissions of a supercritical pulverised coal plant. For gas–fi red CCS, the reference plant is an unabated combined cycle plant.
Negative avoided costs occur where the cost of the low–carbon technology is less than the fossil fuel technology.

THE GLOBAL STATUS OF CCS | 2013 173
AP
PE
ND
IXE
S
C
APPENDIX C: POLICY
C.1 Overview of CCS Policy Index (CCSPI) framework The CCSPI comprises three sub-indicators: (i) propensity to adopt CCS policies; (ii) current policy setting to support pre-commercial demonstration activities; and (iii) current and future policy settings to drive commercial deployment.
The comprehensiveness of a policy environment can be measured by the extent to which identifi ed policies have the potential to address known barriers (including market failures) of the CCS demonstration and deployment stages. It is also important for governments to continue to send strong policy signals (in the absence of policy implementation) that future institutional arrangements, supportive programs, and regulatory frameworks can and will be put in place in a timely manner to effi ciently support the early stages of commercial deployment.
While policies may be considered appropriately comprehensive, they need to be adequate and suffi cient in their effect too, and the CCSPI framework considers the strength of the prevailing policy support. Weightings are applied to components of the sub-indicators according to the effect and/or importance of various attributes. A summary of the weightings used in the analysis is provided at Table C.1 (note that sensitivity analysis undertaken on the choice of weight revealed few material variations in the overall results).
TABLE C.1 CCSPI weightings
INDICATOR CPI WEIGHT (%) CATEGORY CATEGORY WEIGHT (%)
Composite indicator 100 Adoption 10
Demonstration 60
Deployment 30
The rationale for the choice of weights is as follows. The portfolio of policy options supporting demonstrations has been given preference at this time over those supporting commercial deployment (e.g. carbon pricing), refl ecting the stage of CCS developments today. CCS demonstration efforts require substantial government policy intervention to help push solutions to the market. Over time, however, it is expected that, as the positive spill-overs of demonstration are realised, CCS deployment will be driven by a greater emphasis on market pull policies that will empower the private sector to invest in CCS.
The Alberta CCS Development Council, for example, believes there is scope for about a 40 per cent reduction in CCS project costs to be delivered over a 10 to 15–year technology lifecycle, culminating in full commercialisation (Alberta CCS Development Council, 2009, p. 61).
It is well understood by policymakers today that simply relying on a carbon price to pull through CCS (or any nascent large–scale clean energy technology) is fl awed as it cannot address the specifi c barriers of demonstration (although it is recognised to be a necessary component of any CCS project business case). The preference for specifi c policy options over time is illustrated in Figure C.1.

THE GLOBAL STATUS OF CCS | 2013174
AP
PE
ND
IXE
S
C
FIGURE C.1 Preference for specifi c policy options over time
REASONS FOR POLICY INTERVENTION
EXTERNALITY
PUBLIC GOOD
VOLUNTARY
INFORMATION ASYMMETRY
COMPETITION ISSUES
Market–based mechanismsAdministrative carbon pricingFeed-in tariffs
Insurance
Tax credits
Voluntary offsets and best practice
Regulations
Shift in policy emphasis over lifecycle
Regulated obligationsRD&D programsInternational collaborationGovernment commitments
POLICY TYPES
TECHNOLOGY PUSH
MARKET PULL
DEMONSTRATION DEPLOYMENT
STY
LIS
ED
PO
LIC
Y M
IX
Source: IEA – A policy for carbon capture and storage (2012), adapted by the Global CCS Institute.

THE GLOBAL STATUS OF CCS | 2013 175
AP
PE
ND
IXE
S
C
C.2 Mapping of policy options to type
TABLE C.2 Mapping of policy options to policy type
POLICY TYPE POLICY OPTION
Carbon constraint Emissions reduction target
Economic – direct incentives Purchase power agreements
Procurement rules
Economic – fi scal incentives Feed-in tariffs
Infrastructure investments
Tax relief (credits/reduction)
Taxes (energy, other environmental)
Carbon tax
Rebates
Regulated pricing
Economic – market–based Cap & trade
Offsets
Economic – public fi nance Grants/subsidies
RD&D funding
Loans (low–cost, guarantees)
Insurance
Government commitments White paper
Indirect driver Energy security
Information Implementation advice
Knowledge sharing
Performance labelling
Professional training
International standards
Roadmaps
Technology needs assessments (TNA)
Institutional Institutional strengthening
Strategic planning
International collaboration International funding programs
International public–private fi nancing
Encouraging positive spill-overs
R&D Demonstration
Research
Regulatory Audits
Codes and standards
Monitoring
Obligation schemes
Other mandated requirements
Emissions performance standards
State assumes long-term liability
Enabling legislation
Energy intensity targets
Voluntary approaches Public initiative
Private initiative

THE GLOBAL STATUS OF CCS | 2013176
AP
PE
ND
IXE
S
C
C.3 UNFCCC architectureThe UNFCCC is the treaty that underpins the global effort to address climate change. It is a forum in which delegates from more than 200 countries negotiate climate change commitments consistent with their national interest on the basis of 'common but differentiated responsibilities'.
The Institute is an accredited observer to the UNFCCC, and actively engages both informally and formally in climate talks to contribute to processes and advocate for the explicit consideration and effi cient inclusion of CCS activities into every support mechanism.
The Institute considers UNFCCC developments fundamentally important to the success of CCS. It is critical that governments increase their emissions mitigation targets and adopt low–carbon pathways to prevent the dangerous effects of climate change. In this scenario, CCS is an economically attractive and necessary mitigation option. Pathways to effective mitigation can be strongly assisted by UNFCCC institutional arrangements, and are often implemented at the domestic level through complementary national government policy settings.
The UNFCCC has an evolving architecture that provides for:
emissions reduction pledges and legally binding targets, or carbon caps
an international emissions cap and trade system, as well as two baseline-credit offset schemes under the Kyoto Protocol
creation of new market mechanisms (including, potentially, an ETS operating outside of the UNFCCC)
funding sources (through the Finance Mechanism’s Green Climate Fund and Global Environment Facility)
technology transfer and development to developing countries (through the Technology Mechanism’s TEC and CTCN).
In addition, the Intergovernmental Panel on Climate Change (IPCC) provides scientifi c advice to the UNFCCC on the nature and effects of climate change. The 5th Technical Assessment Report (four reports in all) will be released in late 2013 and throughout 2014.
The more that CCS is embedded into UNFCCC mechanisms and initiatives, the greater its international acceptance through evidence–based endorsement by sovereign nations; access to international and national resources and support regimes; enhanced institutional arrangements, best practices, and procedures; and the lifting of community literacy and awareness of CCS–related health, safety, and environment matters.
In June 2013, the three UNFCCC subsidiary bodies with responsibility for prosecuting issues – the Subsidiary Body for Implementation (SBI), SBSTA, and ADP – met for the 38th time. These bodies engaged in efforts to fi nd common ground and a compromise on many controversial issues in the lead-up to the next meeting of the decision making bodies – the 19th Conference of the Parties to the UNFCCC (COP19) and the 9th COP serving as the Meeting of Parties to the Kyoto Protocol (CMP9). These meetings are scheduled to take place in Warsaw, Poland, from 11 to 22 November 2013.
The SBI and SBSTA are permanent bodies; the ADP is a temporary body seeking to settle the 2015 agreement (post the Kyoto Protocol) and enhance global mitigation commitments and action pre-2020.
The SBI is the main body exploring ways to fi nance the required investments in mitigation and adaptation, especially for developing countries. And it is jointly responsible, with SBSTA, for the agenda on technology transfer and development in developing countries (some 70 per cent of emissions will be generated from non-OECD regions by 2050). The barriers to technology (affordability, access to intellectual property rights (IPR), scale, and so on) need to be addressed so that the technologies, mostly owned by the developed world, can be utilised by developing countries in a way that is satisfactory to all. This essentially means protecting IPR, securing funding, making business cases, and functioning in a way that observes the principles of sustainable and fair development. All these issues are multi-dimensional.

THE GLOBAL STATUS OF CCS | 2013 177
AP
PE
ND
IXE
S
C
The SBSTA is looking into the same technology issues as the SBI, as well as issues of a more technical nature. For example, under the Kyoto Protocol’s methodological issues, CCS in the CDM was prosecuted in this body for more than six years before it was adopted by the CMP as an eligible project level activity. In 2016, SBSTA will pick up the unresolved CCS–related issues of allowing transboundary movement of CO2 (capture in one country and storage in another) and whether to establish a permanent fund to remedy any unforeseen event (sourced by quarantining a percentage of CDM offsets for each CCS project). Also, if the CDM Executive Board, in implementing the CMP decision to include CCS as a project level activity, refers any CCS–related matter to the CMP for advice, the CMP will likely task SBSTA to explore and make recommendations.
SBSTA is also looking at the role of additional approaches to mitigation and adaptation undertaken by nations either unilaterally or multilaterally and that potentially fall outside the UNFCCC architecture. For the UNFCCC to recognise the results of such efforts as contributing to a county’s compliance with their undertakings, they must be authentic, internationally verifi able, and acquitted just once i.e. no double-counting under multiple initiatives. Some countries believe that eligible measures should fall under the governance of the UNFCCC and/or be wholly consistent with its principles. However, many other countries believe it is the sovereign right of countries to implement any measure they see fi t without UNFCCC interference.
In the context of a new market mechanism under the UNFCCC, SBSTA is looking at a possible trading scheme (that may not necessarily be cap and trade) in specifi c sectors, such as energy or agriculture. A few years ago, Norway proposed a CCS-specifi c mechanism that was rejected and that is never likely to eventuate.
The ADP is looking at much the same issues as the SBI and SBSTA, but through a very different lens. It is examining what can be done by nations through technology transfer and funding to accelerate and enhance large–scale mitigation efforts prior to 2020 to complement the second commitment period of the Kyoto Protocol (which currently has the support of even fewer developed countries than during the fi rst commitment period). Also, it plans to negotiate the legal form and nature of commitments in the post-2020 agreement. This period will be especially important for CCS, which is expected to move out of the current demonstration and become commercially deployable at that time.
The ADP has indicated that it is prepared to treat CCS with as much importance as renewable energy and energy effi ciency. This represents a material vote of confi dence in CCS by the parties, as the notion of clean fossil energy has historically been either mostly ignored or dismissed (although CCS is written into the Convention).
The ADP realises that CCS allows countries to aspire to higher ambitions over the medium- to long-term. It also recognises that CCS is at the core of the abatement effort required to hold the global average temperature rise to below 2°C by 2050 and 2100, especially given the vast amount of fossil fuel reserves available and the increase in fossil fuel use by developing countries. This recent acceptance by such an important body of the role that CCS must play in climate change abatement is welcomed.
The UNFCCC can help mobilise international resources and shape domestic policy settings to support CCS. CCS-relevant agendas in the UNFCCC include technology, fi nance, market mechanisms (existing and future), and the IPCC’s assessment of a portfolio of low–emitting technologies. The UNFCCC is a government–led process. As such, international progress in its CCS-relevant agendas can assist national policy development efforts by giving policymakers access to mitigation and technology funds; technology transfer; capital markets; project knowledge sharing and capacity building; best practice (including technical and institutional strengthening); community acceptability; and enhanced investor certainty.
The way the UNFCCC currently organises its business is illustrated in Figure C.2.

THE GLOBAL STATUS OF CCS | 2013178
AP
PE
ND
IXE
S
C
FIGURE C.2 Current UNFCCC architecture
FAO
UNDP
Conference
of the Parties
(COP)
WMO
UNEP
UNITED NATIONS IPCC
FRAMEWORK
CONVENTION ON
CLIMATE CHANGE
(UNFCCC)
Meeting
of the Parties
(CMP)
SBISBSTAAWG-ADP
KYOTO
PROTOCOL
PERMANENT SUBSIDIARY BODIESAd hoc
working group
2015 Regime

THE GLOBAL STATUS OF CCS | 2013 179
AP
PE
ND
IXE
S
D
APPENDIX D: CAPTURE
D.1 Capture processesCarbon capture involves the removal of CO2 from a gas stream. This gas stream can either be natural gas produced at the wellhead, fl ue gas from a chemical process, or fl ue gas from power generation. Carbon capture is often considered to account for more than 90 per cent of the total cost of CCS. This cost derives mostly from the separation of CO2 from dilute gases such as the fl ue gas from power generation.
Carbon capture has been deployed commercially in gas processing, and there are several projects around the world that remove CO2 from produced gas and then re-inject it back into the subsurface (e.g. the Sleipner project). Capture is also used commercially in some chemical sectors where the CO2 needs to be separated from a gas stream (e.g. fertiliser manufacturing).
Carbon capture has been demonstrated at power plants of approximately 10 per cent commercial size. Plants of commercial size with carbon capture are currently under construction in the Boundary Dam and Kemper County projects. These are expected to be fully operational in 2014.
The main challenges for power generation are the energy penalty associated with carbon capture and the increased capital and operational costs.
NATURAL GAS PROCESSING
Many sources of natural gas contain levels of CO2 that must be separated out before the gas can be sold on the market. This process produces a pure stream of CO2 and creates a low–cost opportunity to use that CO2 for EOR or geological storage. Similarly, some chemical processes, such as the production of fertiliser, require the CO2 to be removed from an intermediate process stream and this also produces a pure CO2 stream. All that is required is drying, compression, and injection.
Most of the CO2 from natural gas processing is vented, but in some projects it is used for EOR, especially in North America. Other projects, such as Sleipner, store the CO2 in a reservoir to avoid paying the domestic carbon tax.
Currently, around 25 Mtpa of CO2 is able to be captured and stored from gas processing and other high purity sources. A further 13 Mtpa of CO2 will be added to this when current projects under construction (e.g. Quest and Gorgon) become operational in the next few years.
POWER GENERATION
Capture from power generating plants is more challenging. The concentration of CO2 in the fl ue gas is low, at around 12–14 per cent for coal–fi red power generation. Furthermore, the chemical environment is more challenging because it contains oxygen and often sulphur dioxides and nitrous oxides, making separation of CO2 from fl ue gases more diffi cult.
Three leading technologies are being demonstrated for capture from power generation around the world:
1. Post-combustion capture processes separate CO2 from combustion exhaust gases. CO2 can be captured using a liquid solvent. Once absorbed by the solvent, the CO2 is released by heating to form a high-purity stream of CO2. This technology is widely used to capture CO2 for use in the food and beverage industry.
2. Pre-combustion capture processes convert fuel into a gaseous mixture of hydrogen and CO2. The hydrogen is separated and can be burnt without producing any CO2; the CO2 can be compressed for transport. The fuel conversion steps required for pre-combustion are more complex than the processes involved in post-combustion, making the technology more diffi cult to apply to existing power plants. Pre-combustion capture is used in industrial processes but has not been demonstrated much in larger power generation projects.

THE GLOBAL STATUS OF CCS | 2013180
AP
PE
ND
IXE
S
D
3. Oxyfuel capture processes use oxygen rather than air for combustion of fuel. This produces an exhaust gas that is mainly water vapour and CO2, which can be easily separated to produce a high-purity CO2 stream.
POST-COMBUSTION
Figure D.1 represents post-combustion capture. It is possibly the easiest and most applicable of the early capture technologies because it can be attached to existing power stations. Post-combustion capture can be partially applied, which means it can be deployed to meet intermediate emission guidelines and then expanded when the guidelines further reduce the allowable emissions from coal–fi red power generation.
FIGURE D.1 Post-combustion capture
This means that the capture plant can be operated separately from the power plant. The CO2 in the exhaust gas from the power plant is separated using a solvent. The CO2 is then removed from the solvent to produce a high-purity stream for geological storage. The energy required for the separation process can either be supplied separately or integrated into the power plant, although this results in an effi ciency penalty.
Some recent key developments include:
Plant Barry. This project takes a slipstream from a commercial power station, equivalent to the total emissions from a 25 MW power station. The capture plant has been operational for a couple of years, and since August 2012 has injected the captured CO2 into a saline reservoir. This makes it the fi rst coal–fi red power generation project that demonstrates the full CCS process. The project uses MHI technology.
Technology Centre Mongstad, offi cially opened in May 2012, is a joint venture between the Norwegian Government, Statoil, Shell, and Sasol. This US$1 billion venture is a facility that allows different capture technologies to be demonstrated. It is able to provide up to 100,000 tpa of CO2 at a range of concentrations to simulate CO2 separation from gas– or coal–fi red power generation or from a refi nery. Since test activity started in July 2012, the facility has been in operation for more than 5,000 hrs, with more than 98 per cent availability. This has made it possible to supply the two absorption plants with exhaust gas and other utilities, as requested by the two technology owners utilising the large pilot units. The technologies currently being tested are from Aker and Alstom.

THE GLOBAL STATUS OF CCS | 2013 181
AP
PE
ND
IXE
S
D
Boundary Dam is a power plant retrofi t that includes an upgrade of the power generation process and capture of the CO2 produced. The CO2 will mainly be used for EOR. The plant is currently under construction; the power plant is expected to be operational by the end of 2013, but the capture part of the plant will not be fully operational until early 2014. The plant uses Cansolv technologies.
There are several generic challenges associated with PCC, including:
most technologies need signifi cant scaling to be relevant to power generation
a loss of power of around 30 per cent
the fl ue gases need cleaning (SOX and NOX)
integration may reduce a power plant’s fl exibility
an increase in water use of around 35 per cent
signifi cant space requirements could be a particular challenge at well-established sites
amine emissions.
Much of the RD&D work around the world is focusing on these challenges. Developments will provide a better understanding of how to scale-up the technology and reduce the loss of power from the plant.
PRE-COMBUSTION
Pre-combustion CO2 capture is a process whereby the carbon in fuel is separated or removed before the combustion process. Instead of burning coal or natural gas in a combustion plant, the fuel is converted to hydrogen (H2) and CO2 prior to combustion. The CO2 can then be captured and stored, while the H2is burnt to produce power. Pre-combustion can be deployed with either natural gas–fi red or coal–fi red systems. For power generation applications, natural gas combined cycle (NGCC) and IGCC units have been explored for natural gas–fi red and coal–fi red systems respectively.
Steam, natural gas, or coal, and either air or oxygen, are fed into a reformer (natural gas) or gasifi er (coal). The product stream is referred to as synthesis gas (syngas), and it contains a variety of compounds, including H2, carbon monoxide (CO), and CO2. In the case of oxygen–fi red systems, an air separation unit is used to produce the large volumes of high-purity oxygen required. This syngas is typically fed into a water–gas shift reactor to convert the CO to CO2, and the capture process placed downstream from the water–gas shift reactor. The two major components in the shifted syngas stream are H2 and CO2, so the capture process is primarily an H2/CO2 separation. The separation process can be either solvent, membrane, or sorbent based. It is important to note that in the case of a coal–fi red system, hydrogen sulphide (H2S) may also be present in the syngas and will need to be removed. The schematic in Figure D.2 depicts a typical gasifi er–based pre-combustion capture facility.
It is important to note that the volumes of gas handled in pre-combustion capture are signifi cantly less than those managed for post-combustion capture. Also, the partial pressure of CO2 in the shifted syngas stream is typically at least 10 to 100 times greater than that in fl ue gas for post-combustion. These factors suggest that the CO2 separation process requires less energy than post-combustion. As a result, pre-combustion holds the promise of lower parasitic power requirements than post-combustion capture.
The challenges of pre-combustion capture include:
more process steps are required for pre-combustion compared to post-combustion capture, e.g. the water–gas shift process
with coal–fi red systems, removal/management of H2S is required
gasifi cation and reforming processes in the power generation sector have been utilised less than in traditional combustion processes
the use of specially designed turbines for power generation that can utilise a feed stream containing H2 may be required.

THE GLOBAL STATUS OF CCS | 2013182
AP
PE
ND
IXE
S
D
FIGURE D.2 Pre-combustion capture
Some recent developments include:
pre-combustion from coal–fi red power generation is being demonstrated from a slipstream at the Nuon Willem Alexander IGCC plant, Buggenum, The Netherlands. This is based on a 20 MW slipstream from the IGCC plant, which captures approximately 90 per cent of the CO2 in that stream. The work is ongoing and uses the Selexol separation process.
GreenGen project in China is a 250 MW plant that uses a gasifi er based on China Huaneng technology. Small–scale capture is expected to commence in 2013. A solvent–based capture system (i.e. Selexol) has been selected for this process also.
Kemper County is a new 582 MW IGCC power station under construction in Mississippi, US, with a projected date of operation of 2014. The project aims to capture 65 per cent of its emissions, equivalent to 3.5 Mtpa of CO2. The plant will use the solvent–based Selexol process.
OXYFUEL COMBUSTION
Oxyfuel combustion (Figure D.3) is an integrated technology with an advantage over pre-combustion in that it can be retrofi tted to existing plants, although this may require a rebuild of the boiler and additional ducting work for recycling fl ue gases. Another advantage of this process is that it produces a nearly pure stream of CO2 so the capture process is much simpler than post-combustion capture.
The main components of oxyfuel combustion are:
the air separation unit to provide a pure stream of oxygen
a boiler for burning the coal and oxygen, which produces steam that can be used to drive a steam turbine
a capture unit that mainly separates moisture from a CO2 stream. The CO2 can then be compressed for storage.

THE GLOBAL STATUS OF CCS | 2013 183
AP
PE
ND
IXE
S
D
FIGURE D.3 Oxyfuel capture
Some recent developments include:
Schwarze Pumpe pilot plant in Germany has been operational since 2008. In 2011, capture technology by Air Products was added to the project to demonstrate capture, purifi cation, and compression. Nearly 9,000 t of CO2 has been captured and liquefi ed.
The CUIDEN Technology Development Centre for CO2 Capture pilot plant in Spain is the fi rst oxyfuel–CFB (circulating fl uidised bed). The plant was commissioned in October 2012.
Callide in Australia was launched in December 2012. The project represents an increase in scale compared to the Schwarze Pumpe project and demonstrates the retrofi t of a subcritical coal–fi red power station to an oxyfuel plant. Since commissioning, more than 1,200 hrs of oxy–fi red demonstration have been achieved and more than 200 hrs of operation of the CO2 capture plant. The project demonstrates the fi rst integrated oxyfuel demonstration plant with electrical generation.
FutureGen in the US has selected oxyfuel as its preferred technology. This large–scale project is currently in detailed design and expected to be operational in 2017.
There are fewer large–scale oxyfuel combustion projects compared to pre- and post-combustion projects. A couple of projects are nearing their FID, and once that happens the projects will enter a construction phase that can take three to fi ve years.
Challenges with oxyfuel combustion include:
it requires an integrated plant
high temperature materials are required for equipment, especially the boiler, since combustion temperatures tend to be signifi cantly greater than the temperatures in post-combustion
the air separation unit requires around 25 per cent of the electricity produced
start-up using air may require additional gas treating equipment
increased water consumption.
The current global work program aims to address many of these challenges.

THE GLOBAL STATUS OF CCS | 2013184
AP
PE
ND
IXE
S
E
APPENDIX E: EXISTING CO2 TRANSPORT INFRASTRUCTURE Extensive networks of pipelines already exist around the world, both on land and under the sea. In the US alone, there are about 800,000 km of natural gas and hazardous liquid pipelines, and 3.5 million km of natural gas distribution lines. Some 6,000 km of pipelines actively transport CO2 today. In the US, around 50 CO2 pipelines are currently operating; in 2010, operational pipelines transported 48–58 Mtpa of CO2 (DiPietro et al., 2012). These onshore pipelines cross six provincial/state boundaries and one international border (into Canada). Much of the existing pipeline infrastructure in the US was built in the 1980s and 1990s and delivers mainly naturally sourced CO2 for EOR purposes, rather than captured anthropogenic CO2.
Table E.1 provides an overview of the main existing CO2–EOR pipelines in the US. Table E.2 provides an overview of the LSIPs that could be considered extensions or components of these existing CO2–EOR pipeline networks in the US.
TABLE E.1 Existing major US CO2 pipelines
PIPELINE OWNER/OPERATOR
LENGTH (km)
DIAMETER (inches)
ESTIMATED MAXIMUM FLOW CAPACITY (Mtpa)
LOCATION (STATE/PROVINCE)
Adair Apache 24 4 1 Texas
Anton Irish Oxy 64 8 1.6 Texas
Beaver Creek Devon 85 Wyoming
Borger, Texas, to Camrick, Oklahoma
Chaparral Energy 138 4 1 Texas, Oklahoma
Bravo Oxy Permian 351 20 7 New Mexico, Texas
Canyon Reef Carriers
Kinder Morgan 224 16 4.3 Texas
Centerline Kinder Morgan 182 16 4.3 Texas
Central Basin Kinder Morgan 230 16 4.3 Texas
Chaparral Chaparral Energy 37 6 1.3 Oklahoma
Choctaw (Northeast Jackson Dome)
Denbury Onshore, LLC
294 20 7 Mississippi, Louisiana
Coffeyville –Burbank
Chaparral Energy 112 8 1.6 Kansas, Oklahoma
Comanche Creek (currently inactive)
PetroSource 193 6 1.3 Texas
Cordona Lake XTO 11 6 1.3 Texas
Cortez Kinder Morgan 808 30 23.6 Texas
Dakota Gasifi cation (Souris Valley)
Dakota Gasifi cation 328 14 2.6 North Dakota, Saskatchewan
Delta Denbury Onshore, LLC
174 24 11.4 Mississippi, Louisiana
Dollarhide Chevron 37 8 1.6 Texas
El Mar Kinder Morgan 56 6 1.3 Texas
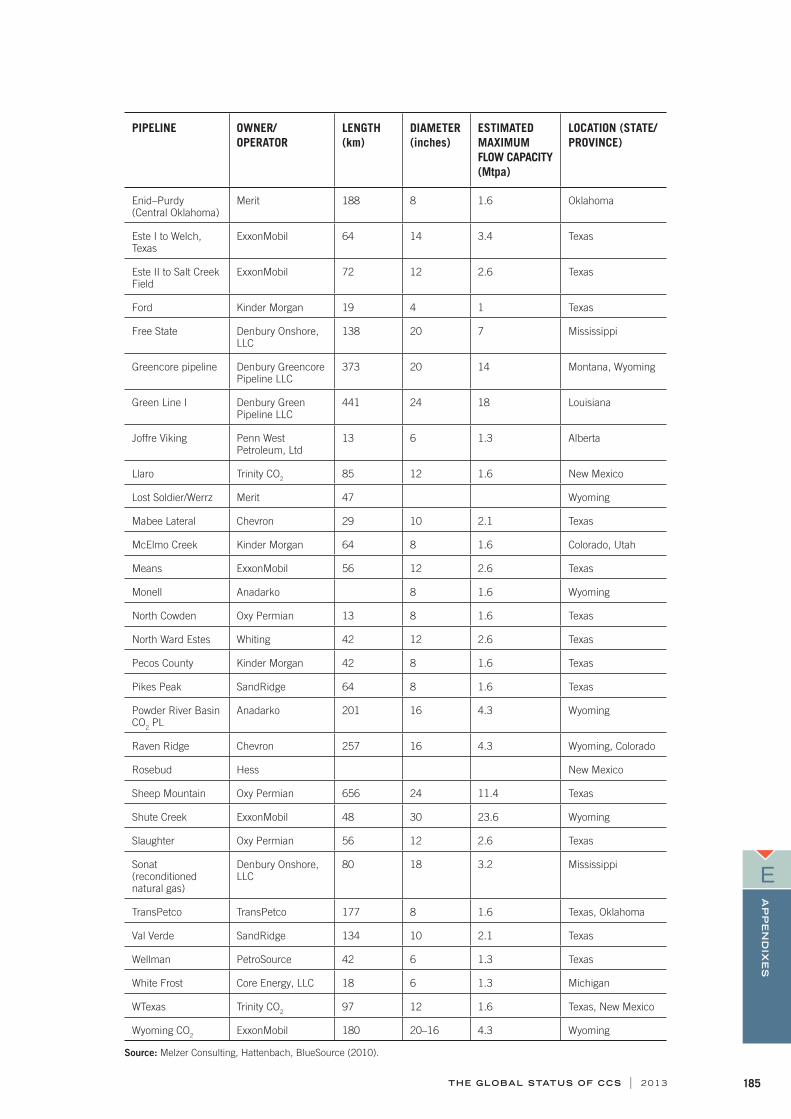
THE GLOBAL STATUS OF CCS | 2013 185
AP
PE
ND
IXE
S
E
PIPELINE OWNER/OPERATOR
LENGTH (km)
DIAMETER (inches)
ESTIMATED MAXIMUM FLOW CAPACITY (Mtpa)
LOCATION (STATE/PROVINCE)
Enid–Purdy (Central Oklahoma)
Merit 188 8 1.6 Oklahoma
Este I to Welch, Texas
ExxonMobil 64 14 3.4 Texas
Este II to Salt Creek Field
ExxonMobil 72 12 2.6 Texas
Ford Kinder Morgan 19 4 1 Texas
Free State Denbury Onshore, LLC
138 20 7 Mississippi
Greencore pipeline Denbury Greencore Pipeline LLC
373 20 14 Montana, Wyoming
Green Line I Denbury Green Pipeline LLC
441 24 18 Louisiana
Joffre Viking Penn West Petroleum, Ltd
13 6 1.3 Alberta
Llaro Trinity CO2 85 12 1.6 New Mexico
Lost Soldier/Werrz Merit 47 Wyoming
Mabee Lateral Chevron 29 10 2.1 Texas
McElmo Creek Kinder Morgan 64 8 1.6 Colorado, Utah
Means ExxonMobil 56 12 2.6 Texas
Monell Anadarko 8 1.6 Wyoming
North Cowden Oxy Permian 13 8 1.6 Texas
North Ward Estes Whiting 42 12 2.6 Texas
Pecos County Kinder Morgan 42 8 1.6 Texas
Pikes Peak SandRidge 64 8 1.6 Texas
Powder River Basin CO2 PL
Anadarko 201 16 4.3 Wyoming
Raven Ridge Chevron 257 16 4.3 Wyoming, Colorado
Rosebud Hess New Mexico
Sheep Mountain Oxy Permian 656 24 11.4 Texas
Shute Creek ExxonMobil 48 30 23.6 Wyoming
Slaughter Oxy Permian 56 12 2.6 Texas
Sonat (reconditioned natural gas)
Denbury Onshore, LLC
80 18 3.2 Mississippi
TransPetco TransPetco 177 8 1.6 Texas, Oklahoma
Val Verde SandRidge 134 10 2.1 Texas
Wellman PetroSource 42 6 1.3 Texas
White Frost Core Energy, LLC 18 6 1.3 Michigan
WTexas Trinity CO2 97 12 1.6 Texas, New Mexico
Wyoming CO2 ExxonMobil 180 20–16 4.3 Wyoming
Source: Melzer Consulting, Hattenbach, BlueSource (2010).
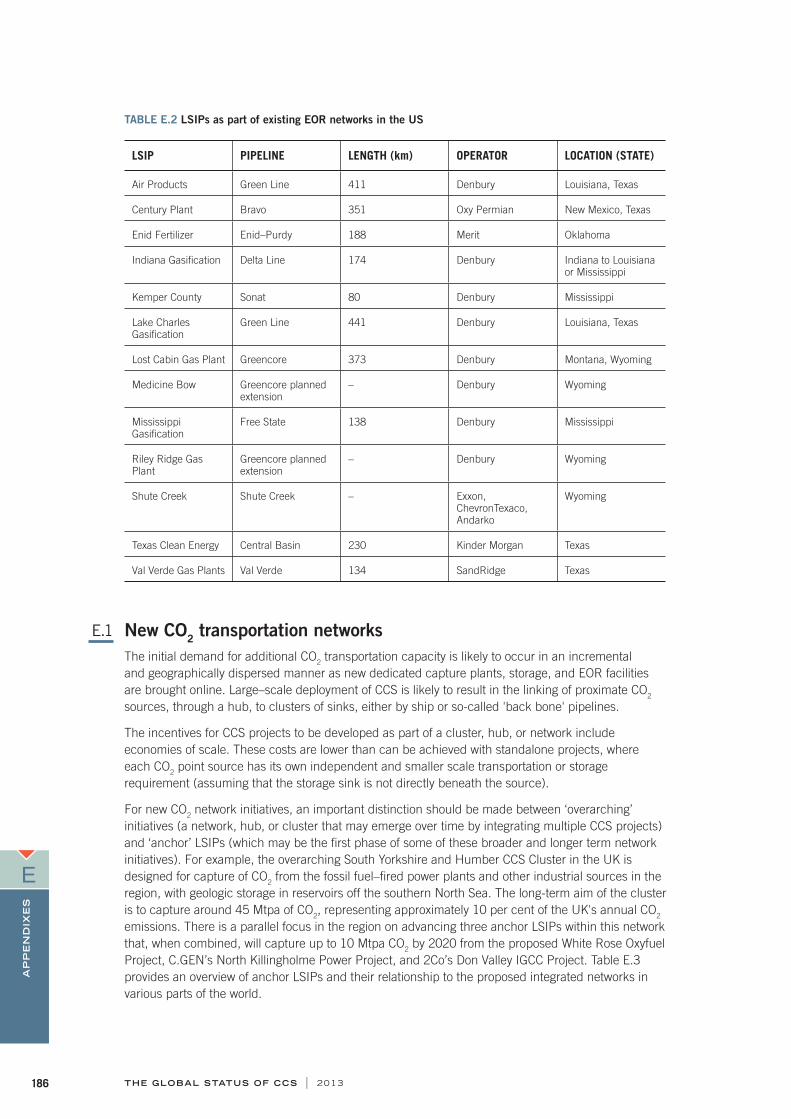
THE GLOBAL STATUS OF CCS | 2013186
AP
PE
ND
IXE
S
E
TABLE E.2 LSIPs as part of existing EOR networks in the US
LSIP PIPELINE LENGTH (km) OPERATOR LOCATION (STATE)
Air Products Green Line 411 Denbury Louisiana, Texas
Century Plant Bravo 351 Oxy Permian New Mexico, Texas
Enid Fertilizer Enid–Purdy 188 Merit Oklahoma
Indiana Gasifi cation Delta Line 174 Denbury Indiana to Louisiana or Mississippi
Kemper County Sonat 80 Denbury Mississippi
Lake Charles Gasifi cation
Green Line 441 Denbury Louisiana, Texas
Lost Cabin Gas Plant Greencore 373 Denbury Montana, Wyoming
Medicine Bow Greencore planned extension
– Denbury Wyoming
Mississippi Gasifi cation
Free State 138 Denbury Mississippi
Riley Ridge Gas Plant
Greencore planned extension
– Denbury Wyoming
Shute Creek Shute Creek – Exxon, ChevronTexaco, Andarko
Wyoming
Texas Clean Energy Central Basin 230 Kinder Morgan Texas
Val Verde Gas Plants Val Verde 134 SandRidge Texas
E.1 New CO2 transportation networksThe initial demand for additional CO2 transportation capacity is likely to occur in an incremental and geographically dispersed manner as new dedicated capture plants, storage, and EOR facilities are brought online. Large–scale deployment of CCS is likely to result in the linking of proximate CO2 sources, through a hub, to clusters of sinks, either by ship or so-called 'back bone' pipelines.
The incentives for CCS projects to be developed as part of a cluster, hub, or network include economies of scale. These costs are lower than can be achieved with standalone projects, where each CO2 point source has its own independent and smaller scale transportation or storage requirement (assuming that the storage sink is not directly beneath the source).
For new CO2 network initiatives, an important distinction should be made between ‘overarching’ initiatives (a network, hub, or cluster that may emerge over time by integrating multiple CCS projects) and ‘anchor’ LSIPs (which may be the fi rst phase of some of these broader and longer term network initiatives). For example, the overarching South Yorkshire and Humber CCS Cluster in the UK is designed for capture of CO2 from the fossil fuel–fi red power plants and other industrial sources in the region, with geologic storage in reservoirs off the southern North Sea. The long-term aim of the cluster is to capture around 45 Mtpa of CO2, representing approximately 10 per cent of the UK's annual CO2 emissions. There is a parallel focus in the region on advancing three anchor LSIPs within this network that, when combined, will capture up to 10 Mtpa CO2 by 2020 from the proposed White Rose Oxyfuel Project, C.GEN’s North Killingholme Power Project, and 2Co’s Don Valley IGCC Project. Table E.3 provides an overview of anchor LSIPs and their relationship to the proposed integrated networks in various parts of the world.

THE GLOBAL STATUS OF CCS | 2013 187
AP
PE
ND
IXE
S
E
TABLE E.3 CO2 network initiatives related to CCS
CO2 NETWORK PROPOSALS FOR CCS DESCRIPTION AND ANCHOR LSIPS
Rotterdam CO2 Hub (The Netherlands) The Rotterdam CO2 Hub aims to capture and store 5 Mtpa of CO2 from anchor projects like ROAD and other industries in the port in 2015–17, expanding to 20 Mtpa in 2020–25 and providing the basis for low–carbon industrial and economic growth in Rotterdam.
Humber cluster (UK) The Humber and Yorkshire region has the long-term potential to capture and store upwards of 40 Mtpa of CO2 from many sources. Anchor projects include the White Rose Oxyfuel project, C.GEN North Killingholme Power Project, and Don Valley Power Project.
Teesside cluster (UK) The cluster in the Teesside region would capture and store up to 15 Mtpa of CO2 from the Teesside Low Carbon project, an aluminium smelter, and emissions from other surrounding industries.
Scottish CCS cluster (UK) The Captain Clean Energy Project could accelerate the development of a Scottish CCS cluster. The CO2 captured in the Firth of Forth area will be transported by pipeline to the St Fergus terminal in close proximity to SSE’s Peterhead project, where CO2Deep Store will store it in depleted reservoirs under the North Sea.
South West Hub (Australia) The South West CO2 Geosequestration Hub project in Western Australia aims to be collecting 5–6 Mtpa of CO2 by 2018–22 from industrial processes, including the Perdaman Collie urea project, as well as from alumina production and power facilities for storage in the Lesueur formation in the Southern Perth Basin.
CarbonNet Project (Australia) The CarbonNet CCS network aims to integrate multiple CCS projects across the entire CCS value chain within the next 10 years. The network is initially sized to capture and store around 1 Mtpa of CO2 from emission sources in the Latrobe Valley by 2018, with the potential to rapidly scale up to support more than 20 Mtpa thereafter.
Masdar CCS Project (UAE) The Abu Dhabi CCS network (Masdar) aims to capture CO2 emissions from existing power and industrial sites, as well as develop a network of CO2 pipelines to transport the CO2 to Abu Dhabi’s oil reservoirs for EOR. Anchor projects include ESI CCS Project and the Emirates Aluminium CCS Project.

THE GLOBAL STATUS OF CCS | 2013188
AP
PE
ND
IXE
S
F
APPENDIX F: STORAGEThe underground storage of CO2 emissions from anthropogenic sources will help abate climate change by removing and keeping this greenhouse gas out of the atmosphere.
Storing CO2 underground is not a new or emerging technology – it is an existing reality. In fact, there are numerous geological systems that naturally contain CO2 and have stored this geologically sourced CO2 for millennia. As well, the oil and gas industry has used CO2 for decades for EOR, where incidental storage is associated with the activity.
There are many similar geological systems throughout the world that are capable of retaining centuries’ worth of CO2 captured from industrial processes. Finding and characterising a suitable geological storage site is a process that should be implemented early in a CCS project and many regional surveys around the world have highlighted potential storage sites.
Although geologic storage of gases occurs naturally and has also been used safely by industry for many decades, it remains a challenge to describe this process to the public.
F.1 How does geological storage of CO2 work? Geological storage involves injecting CO2 captured from industrial processes into rock formations deep underground that have the capacity to store large volumes of the greenhouse gas and containment characteristics that will not allow it to leak. In this way, the CO2 is permanently removed from the atmosphere. A book by Professor Peter Cook provides an excellent and accessible introduction to the topic (Cook, 2012).
Typically, the following geologic characteristics are associated with effective storage sites:
rock formations have enough voids, or pores, to provide the capacity to store the CO2
pores in the rock are suffi ciently connected, a feature called permeability, to accept the amount of CO2 at the rate it is injected, allowing the CO2 to move and spread out within the formation
an extensive cap rock or barrier at the top of the formation to contain the CO2 for thousands of years and longer.
Fortunately, there are many locations globally that have formations with these characteristics and most are in vast geological features called sedimentary basins. Almost all oil and gas production is associated with sedimentary basins, and the types of geologic formations that trap oil and gas (and also naturally occurring CO2) include sandstones, limestones, and dolomites that are similar to those that make good CO2 storage reservoirs. It is the natural geologic characteristics, the ones that resulted in oil and gas being trapped for millions of years before they were discovered, that make secure geologic storage of CO2 such a viable option for greenhouse gas mitigation. Many coal deposits are also associated with sedimentary basins, so coal–fi red power plants, which are a signifi cant source of CO2 emissions, can sometimes be co-located near storage sites. In other instances and for other industries, suitable storage locations may be considerable distances away.
Figure 7.1 depicts the different types of storage options available:
deep saline aquifer is a storage type often referred to in the CCS literature, but it really means any saline water-bearing formation (the water can range from slightly brackish to many times the concentration of seawater, but is usually non-potable)
depleted oil or gas fi elds that are no longer economic for oil or gas production, but have established trapping and storage characteristics
EOR, which involves injecting CO2 to increase oil production from mature oil fi elds enhanced
coal-bed methane, in which CO2 is injected into coal-beds to exchange CO2 with methane.

THE GLOBAL STATUS OF CCS | 2013 189
AP
PE
ND
IXE
S
F
F.2 How is CO2 injected underground and why does it stay there?Once captured, the CO2 is compressed into a fl uid almost as dense as water, then pumped down through a well into a porous geological formation. The pores in underground formations are initially fi lled with a fl uid, either oil, gas, or much more commonly, salty water. Although CO2 can be injected into oil reservoirs to help with oil recovery, in the longer term most large–scale CO2 injection projects will target saline water-bearing formations for storage because they are more common and can have much larger capacity than oil reservoirs. In general, depths greater than 800 m are desired to keep the CO2 in the compressed, or dense, state. It should be noted that CO2 above this depth can also be securely stored; it will just be in a gaseous state that occupies more volume.
Because injected CO2 is slightly more buoyant than the salty water that co-exists within the storage reservoir, a portion of the CO2 will migrate to the top of the formation and become structurally trapped beneath the impermeable cap rock that acts as a seal. In most natural systems, there are numerous barriers between the reservoir and the surface. Some of the trapped CO2 will slowly start to dissolve into the saline water and become trapped indefi nitely (called solution trapping), another portion may become trapped in tiny pore spaces (referred to as residual trapping). The ultimate trapping process involves dissolved CO2 reacting with the reservoir rocks to form a new mineral. Depending on the reservoir minerals present, this process, called mineral trapping, may be relatively quick or very slow, but it effectively locks the CO2 into a solid mineral permanently.
F.3 Is underground storage of CO2 safe? Industrial–scale, pilot, and research–scale storage projects inject several millions of tonnes of CO2 annually into deep saline formations, demonstrating that injection is safe and effective. EOR projects, where CO2 storage occurs incidentally, have been operating safely for decades. This has been validated by the work of intergovernmental and industry partnerships, research programs, and stakeholder networks. No adverse safety, health, or environmental effects have ever been documented from any of these operations.
F.4 How do we know that it works? The oil and natural gas industry has more than 40 years' experience of injecting almost one billion tonnes of CO2 into geologic reservoirs to increase oil production. This type of EOR is called CO2–EOR. The CO2 is usually injected into the reservoir under pressure in a liquid or dense phase, which allows it to mix with the oil and make the oil fl ow more easily, ultimately producing more oil. The CO2–oil mixture is brought to the surface, where the CO2 un-mixes from the oil (at the lower pressure), and is recaptured for re-injection. Through this recycling process, all the CO2 used will eventually remain in the reservoir indefi nitely at the end of the oil fi eld’s life (called incidental storage). The success of the CO2–EOR projects in injecting and retaining CO2, and the increasing number of research demonstrations into saline reservoir storage, show that large quantities of CO2 can be stored underground – safely, securely, and for a very long time.
F.5 How much CO2 can be stored underground?A number of regions around the world – the US, Canada, Mexico, China, South Africa, Europe, Australia, Japan, Korea, and other countries in Southeast Asia – are doing a signifi cant amount of work on characterising potential storage sites. The United Nations IPCC estimates the world's potential capacity at two trillion tonnes, although it may possess 'much larger potential' (IPCC, 2005).
More recent and focused studies in North America, Europe, Australia, and elsewhere have shown that in many regions there is centuries’ worth of CO2 geological storage potential in saline formations and oil and gas reservoirs. However, the identifi cation of suitable storage sites close to individual CO2 sources may prove challenging. The selection and characterisation of individual storage sites is one of the most expensive components in the early stages of a CCS project, but it must be considered early. Storage is also one of the most closely scrutinised aspects of CCS by the public.

THE GLOBAL STATUS OF CCS | 2013190
AP
PE
ND
IXE
S
G
APPENDIX G: REFERENCES
Executive summaryIEA, 2013, Redrawing the energy–climate map, OECD/IEA, France.
IEA, 2012a, Energy technology perspectives: Pathways to a clean energy system, OECD/IEA, France.
IEA, 2012b, World Energy Outlook 2012, OECD/IEA, France.
Kim, JY, 2012, OPED: A world 4 degrees hotter? We must avoid it, The Guardian Online Global Development, 19 November 2012.ONLINE http://www.worldbank.org/en/news/opinion/2012/1½ 0/oped-a-world-4-degrees-hotter-we-
must-avoid-it
UNFCCC, COP, 2009, Report of the Conference of the Parties on its fi fteenth session, held in Copenhagen from 7 to 19 December 2009. Addendum. Part Two: Action taken by the Conference of the Parties at its fi fteenth session, FCCC/CP/2009/11/Add.1, United Nations Offi ce at Geneva, Switzerland.
IntroductionIEA, 2013a, Energy Statistics, OECD/IEA, France.ONLINE http://data.iea.org
IEA, 2013b, Redrawing the energy–climate map, OECD/IEA, France.
IEA, 2013c, Global action to advance carbon capture and storage: A focus on industrial applications, OECD/IEA, France.
IEA, 2013d, Technology roadmap: Carbon capture and storage, OECD/IEA, France. ONLINE http://www.globalccsinstitute.com/publications/iea-2013-ccs-technology-roadmap
IEA, 2012a, Energy technology perspectives: Pathways to a clean energy system, OECD/IEA, France.
Projects and Appendix ACSLF, 2013, Meeting summary (Draft), Projects Interaction and Review Team (PIRT) Meeting, Rome, Italy, 17 April 2013. ONLINE http://www.cslforum.org/meetings/rome2013/index.html
Global CCS Institute, 2012, The Global Status of CCS: 2012, Global CCS Institute, Australia. ONLINE http://www.globalccsinstitute.com/publications/global-status-ccs-2012
Global CCS Institute, 2011a, The Global Status of CCS: 2011, Global CCS Institute, Australia. ONLINE http://www.globalccsinstitute.com/publications/global-status-ccs-2011
Global CCS Institute, 2011b, The Global Status of CCS: 2010, Global CCS Institute, Australia. ONLINE http://www.globalccsinstitute.com/publications/global-status-ccs-2010
IEA, 2013, Technology roadmap: Carbon capture and storage, OECD/IEA, France. ONLINE http://www.globalccsinstitute.com/publications/iea-2013-ccs-technology-roadmap
IEA, 2012, Energy technology perspectives: Pathways to a clean energy system, OECD/IEA, France.
IPCC, 2007, Contribution of Working Group III to the Fourth Assessment Report of the Intergovernmental Panel on Climate Change, Metz, B, Davidson, OR, Bosch, PR, Dave, R, Meyer, LA (eds), Cambridge University Press, Cambridge, UK, and New York, US.

THE GLOBAL STATUS OF CCS | 2013 191
AP
PE
ND
IXE
S
G
Pizarro, J, Branco, C, 2012, Planning and implementing an EOR project for the pre-salt Lula fi eld, World Oil, 233(8).
Tenaska, 2012, Tenaska Trailblazer front end engineering design (FEED) study, prepared for the Global CCS Institute. ONLINE http://www.globalccsinstitute.com/publications/tenaska-trailblazer-front-end-engineering-
design-feed-study
WorleyParsons, Schlumberger, Baker & McKenzie and EPRI (Electric Power Research Institute), 2009, Strategic analysis of the global status of CCS, prepared for the Global CCS Institute. ONLINE www.globalccsinstitute.com/publications/strategic-analysis-global-status-carbon-capture-
storage
Business case and Appendix B2Co, 2013, Making the business case for CCS, prepared for the Global CCS Institute. ONLINE http://www.globalccsinstitute.com/publications/making-business-case-ccs
Global CCS Institute, 2011, Strategic analysis of the global status of carbon capture and storage: Economic assessment of carbon capture and storage technologies, Global CCS Institute, Canberra. ONLINE http://www.globalccsinstitute.com/publications/economic-assessment-carbon-capture-and-
storage-technologies-2011-update
North West Redwater Partnership, 2013, Carbon capture through innovative commercial structuring in the Canadian oil sands, prepared for the Global CCS Institute. ONLINE http://www.globalccsinstitute.com/publications/carbon-capture-through-innovative-
commercial-structuring-canadian-oil-sands
Rumble, G, 2012, Implications of the global fi nancial crisis for CCS, presented at the 11th International Conference on Greenhouse Gas Technologies, Kyoto, Japan, Elsevier.
RCI, 2013, Transport and storage economics of CCS networks in The Netherlands, prepared for the Global CCS Institute. ONLINE http://www.globalccsinstitute.com/publications/transport-and-storage-economics-ccs-
networks-netherlands
Summit Power, 2013, TCEP Business Case and Contracting (in press), prepared for the Global CCS Institute.
Policy, legal and regulatory and Appendix CAlberta CCS Development Council, 2009, Accelerating carbon capture and storage implementation in Alberta, Final Report, March 2009, Canada. ONLINE http://www.energy.gov.ab.ca/Org/pdfs/CCS_Implementation.pdf
BP, 2013, Statistical Review of World Energy June 2013. ONLINE http://www.bp.com/statisticalreview
European Commission, 2013, Communication from the Commission to the European Parliament, the Council, the European Economic and Social Committee and the Committee of the Regions on the Future of Carbon Capture and Storage in Europe, COM(2013) 180 Final, Brussels, 27.3.2013.
Ministry of Business Innovation and Employment, 2013, Carbon Capture and Storage Investment Round: Request for Proposals, July 2012, Ministry of Business Innovation and Employment, New Zealand.
SCER (Standing Council on Energy Resources) [undated, accessed 7 July 2013], Priority issues of national signifi cance, SCER website. ONLINE http://www.scer.gov.au/about-us/priority-issues-of-national-signifi cance/

THE GLOBAL STATUS OF CCS | 2013192
AP
PE
ND
IXE
S
G
Capture and Appendix DIEA, 2013a, Technology roadmap: Carbon capture and storage, OECD/IEA, France. ONLINE http://www.globalccsinstitute.com/publications/iea-2013-ccs-technology-roadmap
IEA, 2013b, Global action to advance carbon capture and storage: A focus on industrial applications, Annex to tracking clean energy progress 2013, Clean Energy Ministerial, April 2013, OECD/IEA, France.
Yeh, S, Rubin, ES, Taylor, M, Hounshell, D, 2005, Technology innovations and experience curves for nitrogen oxide control technologies, Air and Waste Management Assoc., 55, 1827–33.
Transport and Appendix EAustralian Standard – AS, 2885.1, 2012, Pipelines: Gas and liquid petroleum.
ASME B31.4, 2006, Pipeline transport systems for liquid hydrocarbons and other liquids.
Cenovus Energy, 2013, Cenovus Energy proposed Rafferty CO2 pipeline project: landowner information, Cenovus Energy website. ONLINE http://www.cenovus.com/operations/oil/docs/rafferty-landowner.pdf
Chiyoda, 2013, Preliminary feasibility study on CO2 carrier for ship-based CCS: Storage site identifi cation beyond the Japanese continental shelf, prepared for the Global CCS Institute. ONLINE http://www.globalccsinstitute.com/publications/preliminary-feasibility-study-co2-carrier-ship-
based-ccs-storage-site-identifi cation
CSA (Canadian Standards Association), 2011, Z662-07, Standard for oil and gas pipeline systems.
DiPietro, P, Balash, P, Wallace, M, 2012, Note on sources of CO2 supply for enhanced-oil-recovery operations, Prepared for NETL, April 2012, SPE Economics & Management.
DNV (Det Norske Veritas), 2010, Recommended practice: DNV-RP-J202, Design and operation of CO2 pipelines. ONLINE http://exchange.dnv.com/publishing/codes/download.asp?url=2010-04/rp-j202.pdf
Enhance Energy, 2013a, The Alberta carbon trunk line project fact sheet, Enhance Energy website. ONLINE http://www.enhanceenergy.com/pdf/ACTL/actl_fact_sheet.pdf
Enhance Energy, 2013b, Background, construction, Enhance Energy website. ONLINE http://www.enhanceenergy.com/background/construction
ISO 13623, 2009, Petroleum and natural gas industries: Pipeline transportation systems.
Melzer Consulting, Hattenbach, BlueSource, 2010, In: Interstate Oil and Gas Compact Commission, 2010, Policy, legal, and regulatory evaluation of the feasibility of a national pipeline infrastructure for the transport and storage of carbon dioxide, Submitted to Southern States Energy Board, US.
NGC (National Grid Carbon), 2013, Capacity charging mechanism for shared CO2 transportation and storage infrastructure, prepared for the Global CCS Institute. ONLINE http://www.globalccsinstitute.com/publications/capacity-charging-mechanism-shared-co2-
transportation-and-storage-infrastructure
ROAD, 2013, Flow assurance & control philosophy: Special report for the Global Carbon Capture and Storage Institute, prepared for the Global CCS Institute. ONLINE http://www.globalccsinstitute.com/publications/road-project-fl ow-assurance-and-control-
philosophy
Rotterdam Climate Initiative (RCI), 2013, Transport and storage economics of CCS networks in The Netherlands, prepared for the Global CCS Institute. ONLINE http://www.globalccsinstitute.com/publications/transport-and-storage-economics-ccs-
networks-netherlands

THE GLOBAL STATUS OF CCS | 2013 193
AP
PE
ND
IXE
S
G
Shell Canada, 2013, About Quest, Shell Canada website. ONLINE http://www.shell.ca/en/aboutshell/our-business-tpkg/upstream/oil-sands/quest/about-quest.html
Storage and Appendix FBenson, S, Pini, R, Reynolds, C, Krevor, K, 2013, Relative permeability analysis to describe multi-phase fl ow in CO2 storage reservoirs, prepared for the Global CCS Institute.ONLINE http://www.globalccsinstitute.com/publications/relative-permeability-analysis-describe-multi-phase-fl ow-co2-storage-reservoirs
CSA, 2012, Z741-12, Geologic storage of carbon dioxide.
Carpenter, S, 2012, CCUS – Opportunities to utilize anthropogenic CO2 for enhanced oil recovery and CO2 storage, AAPG Search and Discovery article 80269.ONLINE http://www.searchanddiscovery.com/documents/2012/80269carpenter/ndx_carpenter.pdf
Cook, P, Causebrook, R, Michael, K, Watson, M, 2013, Developing a small scale CO2 test injection: Experience to date and best practice (in press), CO2CRC Report No. RPT13-4294 for IEAGHG.
Cook, PJ, 2012, Clean energy, climate and carbon, CSIRO Publishing, Melbourne, Australia.
Godec, M, Kuuskraa, V, Van Leeuwen, T, Melzer, LS, Wildgust, N, 2011, CO2 storage in depleted oil fi elds: The worldwide potential for carbon dioxide enhanced oil recovery, Energy Procedia, 4, 2162–69.
Hitchon, B (ed.), 2012, Best practices for validating CO2 geological storage, Observations and guidance from the IEAGHG Weyburn–Midale CO2 monitoring and storage project. Geoscience Publishing.
Hovorka, S, 2006, Frio brine storage experiment: Lessons learned, In: 8th International Conference on Greenhouse Gas Control Technologies, Trondheim, Norway, GCCC Digital Publication Series.
IPCC, 2005, Special report on carbon dioxide capture and storage: Summary for policymakers.
Jakobsen, V, Hauge, F, Holm, M, Kristiansen, B, 2005, CO2 for EOR on the Norwegian shelf: A case study, Bellona Report. ONLINE http://www.bellona.org/reports/co2_report
Jenkins, C, Cook, P, Ennis-King, J, Undershultz, J, Boreham, C, Dance, T, Urosevic, M, 2011, Safe storage and effective monitoring of CO2 in depleted gas fi elds, Proceedings of the National Academy of Sciences of the United States of America, 109(2), 35–41.
Law, D, Huang, S, Freitag, N, Perkins, E, Wassmuth, F, Dunbar, B, Ashgari, K, 2004, Theme 3: CO2 storage capacity and distribution predictions and the application of economic limits, In: Wilson, M, Monea, M (eds.), IEA GHG Weyburn CO2 monitoring & storage project summary report 2000–2004, 149–210.
Melzer, SL, 2012, Carbon dioxide enhanced oil recovery (CO2–EOR): Factors involved in adding carbon capture, utilization and storage (CCUS) to enhanced oil recovery, Report prepared for National Enhanced Oil Recovery Initiative (NEORI), Center for Climate and Energy Solutions.
Ringrose, PS, Mathieson, AS, Wright, IW, Selama, F, Hansen, O, Bissell, R, Saoula, N, Midgley, J, 2013, The In Salah CO2 storage project: Lessons learned and knowledge transfer, Energy Procedia.
SACCCS (South African Centre for Carbon Capture and Storage), 2010a, Atlas on geological storage in South Africa, Council for Geoscience, South Africa.
SACCCS, 2010b, Technical report on the geological storage of CO2 in South Africa, Council for Geoscience, South Africa.
TransAlta, 2013, Project Pioneer: Pioneer’s sequestration research and proposed MMV programme, prepared for the Global CCS Institute.ONLINE http://www.globalccsinstitute.com/publications/pioneers-sequestration-research-and-
proposed-mmv-programme

THE GLOBAL STATUS OF CCS | 2013194
AP
PE
ND
IXE
S
G
Wildgust, N, Tontiwachwuthikul, P, Gilboy, C (eds), 2013, The IEAGHG Weyburn–Midale CO2 monitoring and storage project, Special issue of the International Journal of Greenhouse Gas Control, 16(1).
Zeng, R, Vincent, C, Tian, X, Stephenson, M, Wang, S, Xu, W, 2013, New potential carbon emission reduction enterprises in China: Deep geological storage of CO2 emitted through industrial usage of coal in China, Greenhouse Gas Sci. Technol., 3, 106–115.
Public engagementAshworth, P, Dowd, A-M, Rodriguez, M, Jeanneret, T, Mabon, L, Howell, R, 2013, Synthesis of CCS social research: Refl ections and current state of play 2013 (in press), prepared for the Global CCS Institute, CSIRO, Queensland.
Ashworth, P, Bradbury, J, Wade, S, Feenstra, CFJ, Greenberg, S, Hund, G, Mikunda, T, 2012a, What’s in store: Lessons from implementing CCS, International Journal of Greenhouse Gas Control, 9, 402–9.
Ashworth, P, Jeanneret, T, Stenner, K, Hobman, EV, 2012b, International comparison of the large group process. Results from Canada, The Netherlands, Scotland and Australia. CSIRO, Pullenvale, Queensland. ONLINE http://www.globalccsinstitute.com/publications/international-comparison-large-group-
process-results-canada-netherlands-scotland-and
Ashworth, P, Bradbury, J, Feenstra, CFJ, Greenberg, S, Hund, G, Mikunda, T, Wade, S, 2011, Communication, project planning and management for carbon capture and storage projects: An international comparison, prepared for the Global CCS Institute, EP 104273, CSIRO, Pullenvale, Queensland. ONLINE http://www.globalccsinstitute.com/publications/communication-project-planning-and-
management-carbon-capture-and-storage-projects
Bradbury, J, 2012, Public understanding of and engagement with CCS, In: Markusson, N, Shackley, S, Evar, B (eds.), The social dynamics of carbon capture and storage, 172–88, Earthscan, London.
Bradbury, J, Greenberg, S, Wade, S, 2011, Communicating the risks of CCS, prepared for the Global CCS Institute.ONLINE http://www.globalccsinstitute.com/publications/communicating-risks-ccs
Brunsting, S, Mastop, J, Pol, M, Kaiser, M, Zimmer, R, Shackley, S, Mabon, L, Howell, R, 2012a, SiteChar Deliverable 8.2: Trust building and raising public awareness, ECN, Amsterdam.
Brunsting, S, Pol, M, Mastop, J, Kaiser, M, Zimmer, R, Shackley, S, Mabon, L, Howell, R, Hepplewhite, F, Loveridge, R, Mazurowski, M, Czesław, R, 2012b, Site characterisation for CO2 storage operations to inform public engagement in Poland and Scotland, Paper to the 11th International Conference on Greenhouse Gas Technologies, Kyoto, Japan.
Carr, A, Wong-Parodi, G, Itaoka, K, Saito, A, Dowd, A-M, Rodriguez, S, Ray, I, 2010, Investigation carbon dioxide capture and storage (CCS) opinions via survey and focus groups methods: An experimental comparison in Australia, Japan and the United States of America. EP11942. CSIRO, Pullenvale.
Colliver, A, Dowd, A-M, Rodriguez, S, 2011, Report on international carbon capture and storage education materials, EP114532, CSIRO, Canberra.
Corry, O, Reiner, D, 2011, Evaluating global carbon capture and storage (CCS) communication materials: A survey of global CCS communications, A report for CSIRO Work Package 1, University of Cambridge, Cambridge.
Corry, O, Riesch, H, 2012, Beyond ‘for or against’: environmental NGO-evaluations of CCS as a climate change solution’, In N. Markusson, S. Shackley and B. Evar (eds.), 2012, The social dynamics of carbon capture and storage, 91–102, Earthscan, London.

THE GLOBAL STATUS OF CCS | 2013 195
AP
PE
ND
IXE
S
G
de Groot, JIM, Steg, L, 2011, Psychological perspectives on the geological disposal of radioactive waste and carbon dioxide, In: Toth, FL (ed.), Geological disposal of carbon dioxide and radioactive waste: A comparative assessment, 44, 339–63, Springer, The Netherlands.
Desbarats, J, Upham, P, Riesch, H, Reiner, D, Brunsting, S, de Best-Waldhober, M, Duetschke, E, Oltra, C, Sala, R, McLachlan, C, 2010, Review of the public participation practices for CCS and non-CCS projects in Europe, Institute for European Environmental Policy, Brussels.
Global CCS Institute, 2012, The Global Status of CCS: 2012, Global CCS Institute, Australia.ONLINE http://www.globalccsinstitute.com/publications/global-status-ccs-2012
Hund, G, Greenberg, S, 2010, FutureGen case study, In: Fulfi lment of Task 1 for CSIRO on behalf of the Global CCS Institute: International comparison of public outreach practices associated with large scale CCS projects, Pacifi c Northwest National Laboratory, Illinois State Geological Survey – Advanced Energy Technology Initiative, US.
IEA, 2012, Energy technology perspectives: Pathways to a clean energy system, OECD/IEA, France.
Itaoka, K, Saito, A, Paukovic, M, de Best-Waldhober, M, Dowd, AM, Jeanneret, T, Ashworth, P, James, M, 2012, Understanding how individuals perceive carbon dioxide: Implications for acceptance of carbon dioxide capture and storage, prepared for the Global CCS Institute, EP 118160, CSIRO, Australia. ONLINE http://www.globalccsinstitute.com/publications/understanding-how-individuals-perceive-
carbon-dioxide-implications-acceptance-carbon
Jammes, L, Vervier, P, and Lesueur, T, 2013, Social site characterisation and stakeholder engagement (in press), prepared for the Global CCS Institute, Australia.
Kombrink, M, Jonker, T, and Thonon, I, 2011. Stakeholder management ROAD, prepared for the Global CCS Institute. ONLINE http://www.globalccsinstitute.com/publications/stakeholder-management-report
Markusson, N, Shackley, S, Evar, B, 2012, The social dynamics of carbon capture and storage, Earthscan, London.
Prangnell, M, 2013, Communications for carbon capture and storage: Identifying the benefi ts, managing risk and maintaining the trust of stakeholders, prepared for the Global CCS Institute. ONLINE http://www.globalccsinstitute.com/publications/communications-carbon-capture-and-
storage-identifying-benefi ts-managing-risk-and
Reiner, DM, 2008, A looming rhetorical gap: a survey of public communications activities for carbon dioxide capture and storage technologies, Electricity Policy Research Group Working Paper 0801, University of Cambridge, Cambridge.
SiteChar, 2013, WP8: Advancing public awareness. SiteChar website. ONLINE http://www.sitechar-co2.eu/Sections.aspx?section=528.529.550
Terwel, BW, Harinck, F, Ellemers, N, Daamen, DDL, 2011, Going beyond the properties of CO2 capture and storage (CCS) technology: How trust in stakeholders affects public acceptance of CCS, International Journal of Greenhouse Gas Control, 5, 181–8.
Torvanger, A, Meadowcroft, J, 2011, The political economy of technology support: Making decisions about carbon capture and storage and low carbon energy technologies, Global Environmental Change, 21(2), 303–12.
Wade, S, Greenberg, S, 2011, Social site characterisation: From concept to application, A review of relevant social science literature and a toolkit for social site characterisation, prepared for the Global CCS Institute, AJW Inc. US.ONLINE http://www.globalccsinstitute.com/publications/social-site-characterisation-concept-
application

THE GLOBAL STATUS OF CCS | 2013196
AP
PE
ND
IXE
S
H
APPENDIX H: ABBREVIATIONS AND ACRONYMS% per cent
°C degrees Celsius
3D three dimensional
2DS IEA 2°C Scenario (where energy–related CO2 emissions are nearly halved by 2050)
ACTL Alberta Carbon Trunk Line (Canada)
ADB Asian Development Bank
ADNOC Abu Dhabi National Oil Company (UAE)
Ar argon
ASAP Alberta Saline Aquifer Project (Canada)
bar a unit of pressure: 1 bar is equal to 100,000 pascal
C2H4O acetaldehyde
CA Canada
CAPEX capital expenditure
CATF Clean Air Task Force (US)
CBDR common but differentiated responsibilities
CCOP Coordinating Committee for Geoscience Programmes (East and Southeast Asia)
CCP (The) Carbon Capture Project
CCS carbon capture and storage
CCSPI (The Global CCS Institute) CCS Policy Index
CCUS carbon capture utilisation and storage
CDM Clean Development Mechanism
CEM Clean Energy Ministerial
CEPAC Center of Excellence in Research and Innovation in Petroleum, Mineral Resources and Carbon Storage (Brazil)
CER Certifi ed Emission Reduction
CFB circulating fl uidised bed
CFD contract for difference
CFE Comisión Federal de Electricidad (Mexico’s national electricity utility)
CHNG China Huaneng Group
CMP Conference of the Parties (serving as the Meeting of Parties to the Kyoto Protocol) (UNFCCC)
CO carbon monoxide
CO2 carbon dioxide
CO2CRC Cooperative Research Centre for Greenhouse Gas Technologies (Australia)
CO2eq carbon dioxide equivalent
COACH Cooperation Action within CCS China–EU
COP Conference of the Parties (UNFCCC)
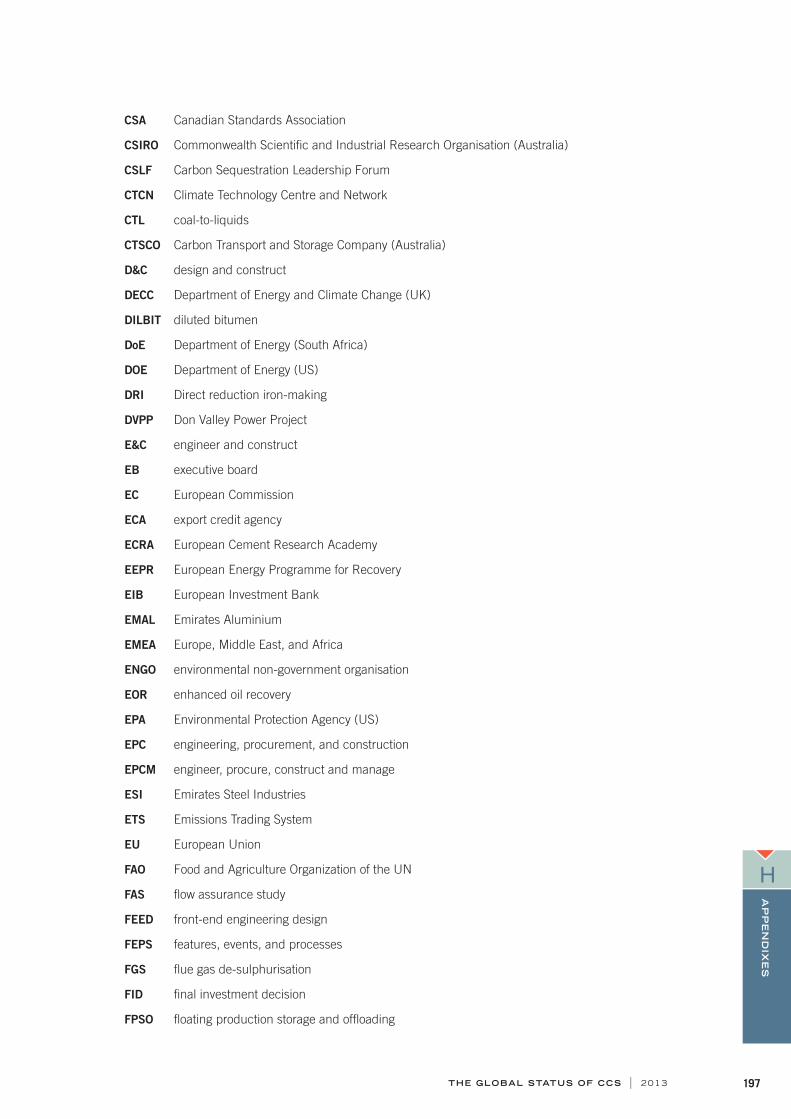
THE GLOBAL STATUS OF CCS | 2013 197
AP
PE
ND
IXE
S
H
CSA Canadian Standards Association
CSIRO Commonwealth Scientifi c and Industrial Research Organisation (Australia)
CSLF Carbon Sequestration Leadership Forum
CTCN Climate Technology Centre and Network
CTL coal-to-liquids
CTSCO Carbon Transport and Storage Company (Australia)
D&C design and construct
DECC Department of Energy and Climate Change (UK)
DILBIT diluted bitumen
DoE Department of Energy (South Africa)
DOE Department of Energy (US)
DRI Direct reduction iron-making
DVPP Don Valley Power Project
E&C engineer and construct
EB executive board
EC European Commission
ECA export credit agency
ECRA European Cement Research Academy
EEPR European Energy Programme for Recovery
EIB European Investment Bank
EMAL Emirates Aluminium
EMEA Europe, Middle East, and Africa
ENGO environmental non-government organisation
EOR enhanced oil recovery
EPA Environmental Protection Agency (US)
EPC engineering, procurement, and construction
EPCM engineer, procure, construct and manage
ESI Emirates Steel Industries
ETS Emissions Trading System
EU European Union
FAO Food and Agriculture Organization of the UN
FAS fl ow assurance study
FEED front-end engineering design
FEPS features, events, and processes
FGS fl ue gas de-sulphurisation
FID fi nal investment decision
FPSO fl oating production storage and offl oading
THE GLOBAL STATUS OF CCS | 2013198
AP
PE
ND
IXE
S
H
GB Great Britain
GCC Gulf Cooperation Council (Middle East)
GFZ German Research Centre for Geosciences (Deutsches GeoForschungsZentrum)
GHG greenhouse gas
Gj/t gigajoule/s per tonne
Gt gigatonne/s
GWe gigawatt/s electric
H2 hydrogen
H2O water
H2S hydrogen sulphide
HDD horizontal directional drilling
HECA Hydrogen Energy California project (US)
HPAD Hydrogen Power Abu Dhabi (UAE)
hrs hours
HSE health, safety, and environment
IBDP Illinois Basin–Decatur Project (US)
IDB Inter-American Development Bank
IEA International Energy Agency
IGCC integrated gasifi cation combined cycle
IPCC Intergovernmental Panel on Climate Change
IPR intellectual property rights
IRS Internal Revenue Service (US)
ISO International Organization for Standardization
JIP joint industry project
JV joint venture
KEPRI KEPCO Research Institute (Korea)
KeTTHA Ministry of Energy, Green Technology and Water (Malaysia)
Kg/s kilogram/s per second
Km kilometre/s
Ktpa kilo-tonne/s per annum
LET low–emissions technology
LIS Low-Impact Steel project (formerly the ULCOS project) (France)
LNG liquefi ed natural gas
LSIP large–scale integrated project
LSTK Lump Sum Turnkey
m metre/s
Masdar Abu Dhabi Future Energy Company (UAE)

THE GLOBAL STATUS OF CCS | 2013 199
AP
PE
ND
IXE
S
H
MEA monoethanolamine
MEF Major Economies Forum
MFI multilateral funding institution
MHI Mitsubishi Heavy Industries
mm millimetre/s
MMV monitoring, measurement and verifi cation
MOST Ministry of Science and Technology (China)
Mt million tonne/s
Mtpa million tonne/s per annum
MW megawatt/s
MWe megawatt/s of electrical output
MWth megawatt/s thermal
N2 nitrogen
NAMA nationally appropriate mitigation action
NCCC National Carbon Capture Center (US)
NDRC National Development and Reform Commission (China)
NEORI National Enhanced Oil Recovery Initiative (US)
NER300 New Entrants Reserve (European Commission funding program)
NETL National Energy Technology Laboratory (US)
NGCC natural gas combined cycle
NGL Hawiyah natural gas processing plant (Saudi Arabia)
NGO non-government organisation
NOX nitrous oxide
NPV net present value
NSPS new source performance standards
NWRP North West Redwater Partnership (Canada)
NWSR North West Sturgeon Refi nery CO2 Project (Canada)
NZ New Zealand
NZEC Near Zero Emissions Coal project (UK–China)
O2 oxygen
O&M operations and maintenance
OECD Organisation for Economic Cooperation and Development
OPEX operating expenditure
PCC post-combustion capture
PGE Polish Energy Group (Polska Grupa Energetyczna)
PPMV part/s per million by volume
PTRC Petroleum Technology Research Centre (Canada)

THE GLOBAL STATUS OF CCS | 2013200
AP
PE
ND
IXE
S
H
QCCSRC Qatar Carbonates and Carbon Storage Research Centre
R&D research and development
RBS Royal Bank of Scotland
RD&D research, development and demonstration
RFA Regulatory Framework Assessment (Canada)
ROAD Rotterdam Opslag en Afvang Demonstratie Project (The Netherlands)
ROZ residual oil zone
SACCCS South African Centre for Carbon Capture and Storage
SBI Subsidiary Body for Implementation (UNFCCC)
SBSTA Subsidiary Body for Scientifi c and Technological Advice (UNFCCC)
SCC Standards Council of Canada
SCER Standing Council of Energy and Resources (Australia)
SCR selective catalytic reduction
SECARB Southeast Regional Carbon Sequestration Partnership (US)
SEG Sinopec Engineering Group (China)
SOX oxides of sulphur
T tonne/s
TCEP Texas Clean Energy Project (US)
TCM Technology Centre Mongstad (Norway)
TEC Technology Executive Committee
TNA technology needs assessment
TPA tonne/s per annum
TPD tonne/s per day
UAE United Arab Emirates
UK United Kingdom
ULCOS Ultra-Low CO2 Steelmaking consortium (France)
UNDP United Nations Development Programme
UNEP United Nations Environment Programme
UNFCCC United Nations Framework Convention on Climate Change
US United States (of America)
WA Western Australia
WASP Wabamun Area Sequestration Project (Canada)
WCS Western Canadian Select (grade of crude oil)
WG working group
WMP Weyburn–Midale CO2 Monitoring and Storage Project (Canada)
WMO World Meteorological Organization
WTI West Texas Intermediate (grade of crude oil)

Internals printed on Maine Recycled. Featuring 60% certified recycled (PCW) and 40% certified virgin fibre sourced from responsibly managed forests. Certified carbon neutral by The Carbon Neutral Company, Maine Recycled is manufactured process chlorine free and produced in a facility that operates under world’s best practice ISO 14001 Environment Management System.

GLOBALCCSINSTITUTE.COM