Embed Size (px)
Citation preview
ResearchPublication Date: 31 May 2006 ID Number: G00139413
© 2006 Gartner, Inc. and/or its Affiliates. All Rights Reserved. Reproduction and distribution of this publication in any form without prior written permission is forbidden. The information contained herein has been obtained from sources believed to be reliable. Gartner disclaims all warranties as to the accuracy, completeness or adequacy of such information. Although Gartner's research may discuss legal issues related to the information technology business, Gartner does not provide legal advice or services and its research should not be construed or used as such. Gartner shall have no liability for errors, omissions or inadequacies in the information contained herein or for interpretations thereof. The opinions expressed herein are subject to change without notice.
The Gartner Business Value Model: A Framework for Measuring Business Performance Michael Smith, Audrey L. Apfel, Richard Mitchell
The Business Value Model is designed to address IT-to-business alignment, initiative prioritization and communication of IT's value contribution to the business. The Business Value Model supports the Balanced Scorecard, Six Sigma, Economic Value Added, agility and other methodologies.
Publication Date: 31 May 2006/ID Number: G00139413 Page 2 of 68
© 2006 Gartner, Inc. and/or its Affiliates. All Rights Reserved.
TABLE OF CONTENTS
1.0 Introduction.................................................................................................................................. 6 2.0 The Business Value Model Overview.......................................................................................... 7 3.0 Target Audience .......................................................................................................................... 8 4.0 Positioning the Business Value Model ........................................................................................ 9 5.0 Guiding Principles for Metric Selection........................................................................................ 9 6.0 Applications of the Business Value Model ................................................................................ 10 7.0 Implement the Business Value Model at a P&L Level .............................................................. 12 8.0 A Word of Caution ..................................................................................................................... 13 9.0 High-Level Business Aspects .................................................................................................... 13 10.0 Aggregate Measures ............................................................................................................... 14 11.0 Prime Metrics........................................................................................................................... 15
11.1 Business Aspect: Demand Management ................................................................... 16 11.1.1 Aggregate: Market Responsiveness .......................................................... 16
11.1.1.1 Target Market Index ................................................................... 16 11.1.1.2 Market Coverage Index .............................................................. 17 11.1.1.3 Market Share Index .................................................................... 18 11.1.1.4 Opportunity/Threat Index............................................................ 19 11.1.1.5 Product Portfolio Index ............................................................... 20 11.1.1.6 Channel Profitability Index.......................................................... 21 11.1.1.7 Configurability Index................................................................... 22
11.1.2 Aggregate: Sales Effectiveness ................................................................. 23 11.1.2.1 Sales Opportunity Index ............................................................. 23 11.1.2.2 Sales Cycle Index....................................................................... 24 11.1.2.3 Sales Close Index ...................................................................... 25 11.1.2.4 Sales Price Index ....................................................................... 25 11.1.2.5 Cost-of-Sales Index.................................................................... 26 11.1.2.6 Forecast Accuracy...................................................................... 26 11.1.2.7 Customer Retention Index.......................................................... 27
11.1.3 Aggregate: Product Development Effectiveness........................................ 28 11.1.3.1 New Products Index ................................................................... 28 11.1.3.2 Feature Function Index .............................................................. 29 11.1.3.3 Time-to-Market Index ................................................................. 30 11.1.3.4 R&D Success Index ................................................................... 31
11.2 Business Aspect: Supply Management...................................................................... 32 11.2.1 Aggregate: Customer Responsiveness...................................................... 32
11.2.1.1 On-Time Delivery ....................................................................... 32 11.2.1.2 Order Fill Rate ............................................................................ 33 11.2.1.3 Material Quality........................................................................... 34 11.2.1.4 Service Accuracy........................................................................ 35 11.2.1.5 Service Performance.................................................................. 36 11.2.1.6 Customer Care Performance ..................................................... 37 11.2.1.7 Agreement Effectiveness ........................................................... 38 11.2.1.8 Transformation Ratio.................................................................. 39
11.2.2 Aggregate: Supplier Effectiveness ............................................................. 40 11.2.2.1 Supplier On-Time Delivery ......................................................... 40
Publication Date: 31 May 2006/ID Number: G00139413 Page 3 of 68
© 2006 Gartner, Inc. and/or its Affiliates. All Rights Reserved.
11.2.2.2 Supplier Order Fill Rate.............................................................. 41 11.2.2.3 Supplier Material Quality ............................................................ 41 11.2.2.4 Supplier Service Accuracy ......................................................... 42 11.2.2.5 Supplier Service Performance.................................................... 43 11.2.2.6 Supplier Care Performance........................................................ 44 11.2.2.7 Supplier Agreement Effectiveness ............................................. 45 11.2.2.8 Supplier Transformation Ratio.................................................... 46
11.2.3 Aggregate: Operational Efficiency.............................................................. 47 11.2.3.1 Cash-to-Cash Cycle Time .......................................................... 47 11.2.3.2 Conversion Cost......................................................................... 48 11.2.3.3 Asset Utilization.......................................................................... 48 11.2.3.4 Sigma Value ............................................................................... 49
11.3 Business Aspect: Support Services ........................................................................... 50 11.3.1 Aggregate: Human Resources Responsiveness ....................................... 50
11.3.1.1 Recruitment Effectiveness Index................................................ 50 11.3.1.2 Benefits Administration Index..................................................... 51 11.3.1.3 Skills Inventory Index ................................................................. 52 11.3.1.4 Employee Training Index............................................................ 53 11.3.1.5 HR Advisory Index...................................................................... 54 11.3.1.6 HR Total Cost Index ................................................................... 55
11.3.2 Aggregate: IT Responsiveness .................................................................. 56 11.3.2.1 Systems Performance ................................................................ 56 11.3.2.2 IT Support Performance ............................................................. 57 11.3.2.3 Partnership Ratio........................................................................ 58 11.3.2.4 Service-Level Effectiveness ....................................................... 59 11.3.2.5 New Projects Index .................................................................... 60 11.3.2.6 IT Total Cost Index ..................................................................... 61
11.3.3 Aggregate: Finance and Regulatory Responsiveness............................... 62 11.3.3.1 Compliance Index....................................................................... 62 11.3.3.2 Accuracy Index........................................................................... 63 11.3.3.3 Advisory Index............................................................................ 64 11.3.3.4 Cost-of-Service Index................................................................. 65
12.0 Appendix A: Frequently Asked Questions............................................................................... 65 13.0 Appendix B: Sigma Table for Defects per Million.................................................................... 66
LIST OF TABLES
Table 1. Business Value Model Applications .................................................................................. 11 Table 2. Prime Metrics of Real Value Creation Not Based on Well-Vetted or Legal Data Capture Points............................................................................................................................................... 13 Table 3. Business Value Model High-Level Business Aspect Definitions....................................... 14 Table 4. Sigma Table for Defects per Million .................................................................................. 66
Publication Date: 31 May 2006/ID Number: G00139413 Page 4 of 68
© 2006 Gartner, Inc. and/or its Affiliates. All Rights Reserved.
LIST OF FIGURES
Figure 1. Comparison of Standard Measures of Value to Actual Value in the U.S........................... 7 Figure 2. Where Do I Start My BPM Evaluation? The Gartner Value Model .................................... 8 Figure 3. Positioning the Business Value Model ............................................................................... 9 Figure 4. Business Value Model High-Level Business Aspects...................................................... 14 Figure 5. Business Value Model Aggregate Measures ................................................................... 14 Figure 6. Target Market Index ......................................................................................................... 16 Figure 7. Market Coverage Index.................................................................................................... 17 Figure 8. Market Share Index .......................................................................................................... 18 Figure 9. Opportunity/Threat Index.................................................................................................. 19 Figure 10. Product Portfolio Index................................................................................................... 20 Figure 11. Channel Profitability Index ............................................................................................. 21 Figure 12. Configurability Index....................................................................................................... 22 Figure 13. Sales Opportunity Index................................................................................................. 23 Figure 14. Sales Cycle Index........................................................................................................... 24 Figure 15. Sales Close Index .......................................................................................................... 25 Figure 16. Sales Price Index ........................................................................................................... 25 Figure 17. Cost-of-Sales Index........................................................................................................ 26 Figure 18. Forecast Accuracy.......................................................................................................... 26 Figure 19. Customer Retention Index ............................................................................................. 27 Figure 20. New Products Index ....................................................................................................... 28 Figure 21. Feature Function Index .................................................................................................. 29 Figure 22. Time-to-Market Index ..................................................................................................... 30 Figure 23. R&D Success Index ....................................................................................................... 31 Figure 24. On-Time Delivery ........................................................................................................... 32 Figure 25. Order Fill Rate ................................................................................................................ 33 Figure 26. Material Quality .............................................................................................................. 34 Figure 27. Service Accuracy............................................................................................................ 35 Figure 28. Service Performance...................................................................................................... 36 Figure 29. Customer Care Performance ......................................................................................... 37 Figure 30. Agreement Effectiveness ............................................................................................... 38 Figure 31. Transformation Ratio...................................................................................................... 39 Figure 32. Supplier On-Time Delivery ............................................................................................. 40 Figure 33. Supplier Order Fill Rate.................................................................................................. 41
Publication Date: 31 May 2006/ID Number: G00139413 Page 5 of 68
© 2006 Gartner, Inc. and/or its Affiliates. All Rights Reserved.
Figure 34. Supplier Material Quality ................................................................................................ 41 Figure 35. Supplier Service Accuracy ............................................................................................. 42 Figure 36. Supplier Service Performance ....................................................................................... 43 Figure 37. Supplier Care Performance............................................................................................ 44 Figure 38. Supplier Agreement Effectiveness ................................................................................. 45 Figure 39. Supplier Transformation Ratio ....................................................................................... 46 Figure 40. Cash-to-Cash Cycle Time .............................................................................................. 47 Figure 41. Conversion Cost............................................................................................................. 48 Figure 42. Asset Utilization.............................................................................................................. 48 Figure 43. Sigma Value ................................................................................................................... 49 Figure 44. Recruitment Effectiveness Index.................................................................................... 50 Figure 45. Benefits Administration Index......................................................................................... 51 Figure 46. Skills Inventory Index ..................................................................................................... 52 Figure 47. Employee Training Index................................................................................................ 53 Figure 48. HR Advisory Index.......................................................................................................... 54 Figure 49. HR Total Cost Index....................................................................................................... 55 Figure 50. Systems Performance.................................................................................................... 56 Figure 51. IT Support Performance................................................................................................. 57 Figure 52. Partnership Ratio............................................................................................................ 58 Figure 53. Service-Level Effectiveness ........................................................................................... 59 Figure 54. New Projects Index ........................................................................................................ 60 Figure 55. IT Total Cost Index ......................................................................................................... 61 Figure 56. Compliance Index........................................................................................................... 62 Figure 57. Accuracy Index............................................................................................................... 63 Figure 58. Advisory Index................................................................................................................ 64 Figure 59. Cost-of-Service Index..................................................................................................... 65
Publication Date: 31 May 2006/ID Number: G00139413 Page 6 of 68
© 2006 Gartner, Inc. and/or its Affiliates. All Rights Reserved.
ANALYSIS
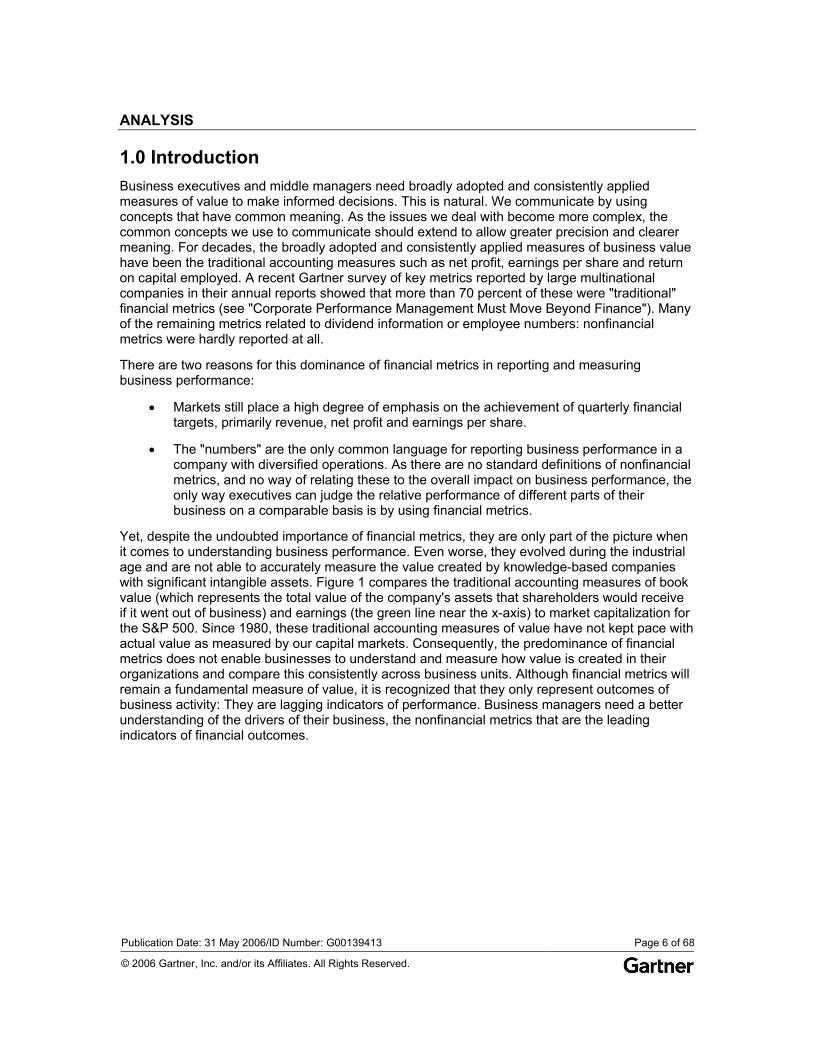
1.0 Introduction Business executives and middle managers need broadly adopted and consistently applied measures of value to make informed decisions. This is natural. We communicate by using concepts that have common meaning. As the issues we deal with become more complex, the common concepts we use to communicate should extend to allow greater precision and clearer meaning. For decades, the broadly adopted and consistently applied measures of business value have been the traditional accounting measures such as net profit, earnings per share and return on capital employed. A recent Gartner survey of key metrics reported by large multinational companies in their annual reports showed that more than 70 percent of these were "traditional" financial metrics (see "Corporate Performance Management Must Move Beyond Finance"). Many of the remaining metrics related to dividend information or employee numbers: nonfinancial metrics were hardly reported at all.
There are two reasons for this dominance of financial metrics in reporting and measuring business performance:
• Markets still place a high degree of emphasis on the achievement of quarterly financial targets, primarily revenue, net profit and earnings per share.
• The "numbers" are the only common language for reporting business performance in a company with diversified operations. As there are no standard definitions of nonfinancial metrics, and no way of relating these to the overall impact on business performance, the only way executives can judge the relative performance of different parts of their business on a comparable basis is by using financial metrics.
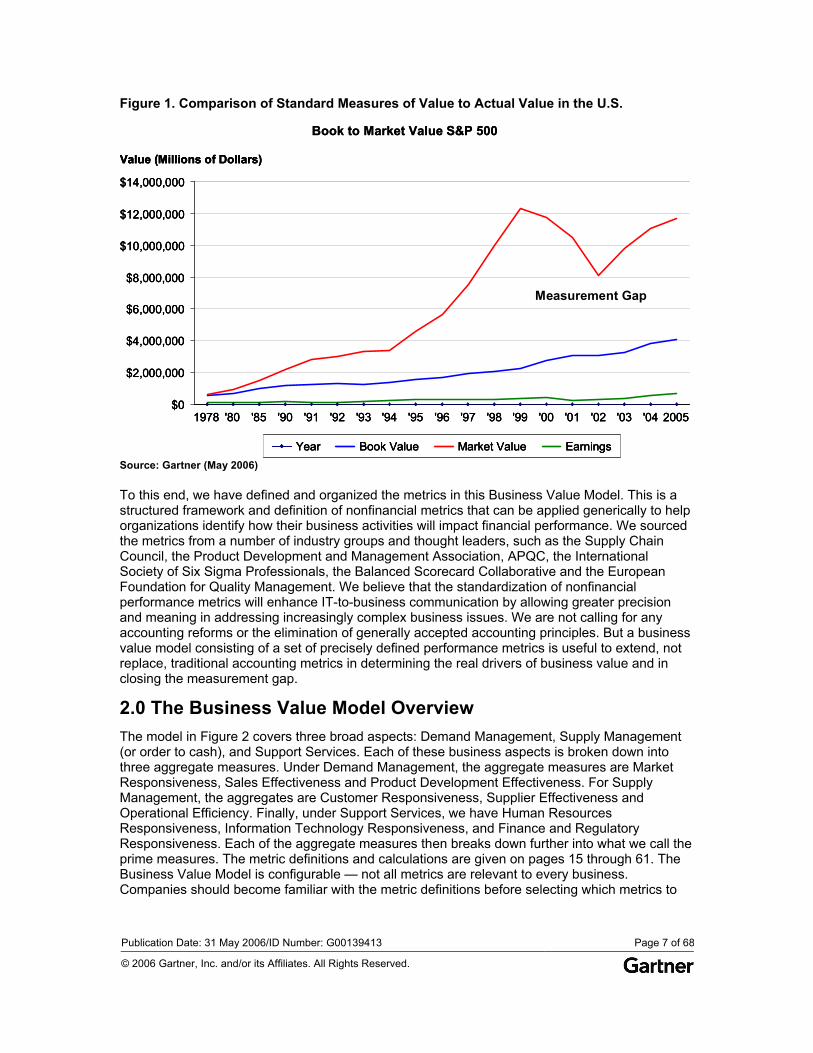
Yet, despite the undoubted importance of financial metrics, they are only part of the picture when it comes to understanding business performance. Even worse, they evolved during the industrial age and are not able to accurately measure the value created by knowledge-based companies with significant intangible assets. Figure 1 compares the traditional accounting measures of book value (which represents the total value of the company's assets that shareholders would receive if it went out of business) and earnings (the green line near the x-axis) to market capitalization for the S&P 500. Since 1980, these traditional accounting measures of value have not kept pace with actual value as measured by our capital markets. Consequently, the predominance of financial metrics does not enable businesses to understand and measure how value is created in their organizations and compare this consistently across business units. Although financial metrics will remain a fundamental measure of value, it is recognized that they only represent outcomes of business activity: They are lagging indicators of performance. Business managers need a better understanding of the drivers of their business, the nonfinancial metrics that are the leading indicators of financial outcomes.
Publication Date: 31 May 2006/ID Number: G00139413 Page 7 of 68
© 2006 Gartner, Inc. and/or its Affiliates. All Rights Reserved.
Figure 1. Comparison of Standard Measures of Value to Actual Value in the U.S.
Book to Market Value S&P 500
1978 2005'04'03'01'00'99'98'97'96'95'93'92'91'90'85'80 '94 '02$0
$2,000,000
$4,000,000
$6,000,000
$8,000,000
$10,000,000
$12,000,000
$14,000,000
Value (Millions of Dollars)
Year Book Value Market Value Earnings
Measurement Gap
Book to Market Value S&P 500
1978 2005'04'03'01'00'99'98'97'96'95'93'92'91'90'85'80 '94 '02$0
$2,000,000
$4,000,000
$6,000,000
$8,000,000
$10,000,000
$12,000,000
$14,000,000
Value (Millions of Dollars)
Year Book Value Market Value Earnings
Measurement Gap
1978 2005'04'03'01'00'99'98'97'96'95'93'92'91'90'85'80 '94 '02$0
$2,000,000
$4,000,000
$6,000,000
$8,000,000
$10,000,000
$12,000,000
$14,000,000
Value (Millions of Dollars)
Year Book Value Market Value EarningsYear Book Value Market Value EarningsYearYear Book ValueBook Value Market ValueMarket Value EarningsEarnings
Measurement Gap
Source: Gartner (May 2006)
To this end, we have defined and organized the metrics in this Business Value Model. This is a structured framework and definition of nonfinancial metrics that can be applied generically to help organizations identify how their business activities will impact financial performance. We sourced the metrics from a number of industry groups and thought leaders, such as the Supply Chain Council, the Product Development and Management Association, APQC, the International Society of Six Sigma Professionals, the Balanced Scorecard Collaborative and the European Foundation for Quality Management. We believe that the standardization of nonfinancial performance metrics will enhance IT-to-business communication by allowing greater precision and meaning in addressing increasingly complex business issues. We are not calling for any accounting reforms or the elimination of generally accepted accounting principles. But a business value model consisting of a set of precisely defined performance metrics is useful to extend, not replace, traditional accounting metrics in determining the real drivers of business value and in closing the measurement gap.
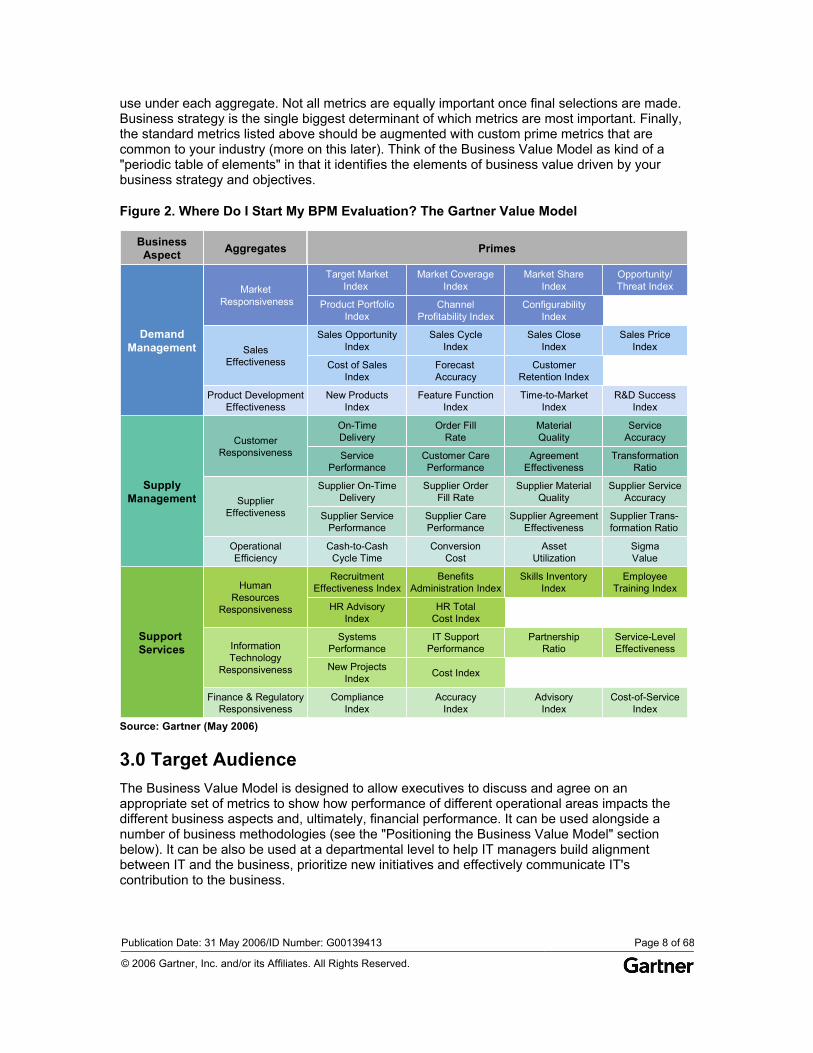
2.0 The Business Value Model Overview The model in Figure 2 covers three broad aspects: Demand Management, Supply Management (or order to cash), and Support Services. Each of these business aspects is broken down into three aggregate measures. Under Demand Management, the aggregate measures are Market Responsiveness, Sales Effectiveness and Product Development Effectiveness. For Supply Management, the aggregates are Customer Responsiveness, Supplier Effectiveness and Operational Efficiency. Finally, under Support Services, we have Human Resources Responsiveness, Information Technology Responsiveness, and Finance and Regulatory Responsiveness. Each of the aggregate measures then breaks down further into what we call the prime measures. The metric definitions and calculations are given on pages 15 through 61. The Business Value Model is configurable — not all metrics are relevant to every business. Companies should become familiar with the metric definitions before selecting which metrics to
Publication Date: 31 May 2006/ID Number: G00139413 Page 8 of 68
© 2006 Gartner, Inc. and/or its Affiliates. All Rights Reserved.
use under each aggregate. Not all metrics are equally important once final selections are made. Business strategy is the single biggest determinant of which metrics are most important. Finally, the standard metrics listed above should be augmented with custom prime metrics that are common to your industry (more on this later). Think of the Business Value Model as kind of a "periodic table of elements" in that it identifies the elements of business value driven by your business strategy and objectives.
Figure 2. Where Do I Start My BPM Evaluation? The Gartner Value Model
Aggregates PrimesBusinessAspect
SalesEffectiveness
CustomerResponsiveness
MarketResponsiveness
Product DevelopmentEffectiveness
SupplierEffectiveness
OperationalEfficiency
HumanResources
Responsiveness
InformationTechnology
Responsiveness
Finance & RegulatoryResponsiveness
On-TimeDelivery
Sales OpportunityIndex
Cost of SalesIndex
New ProductsIndex
ServicePerformance
Supplier On-TimeDelivery
Supplier ServicePerformance
Cash-to-CashCycle Time
RecruitmentEffectiveness Index
HR AdvisoryIndex
SystemsPerformance
New ProjectsIndex
ComplianceIndex
Sales CycleIndex
ForecastAccuracy
Feature FunctionIndex
Order FillRate
Customer CarePerformance
Supplier OrderFill Rate
Supplier CarePerformance
ConversionCost
BenefitsAdministration Index
HR TotalCost Index
IT SupportPerformance
Cost Index
AccuracyIndex
AgreementEffectiveness
CustomerRetention Index
Sales CloseIndex
Time-to-MarketIndex
MaterialQuality
Supplier MaterialQuality
Supplier AgreementEffectiveness
AssetUtilization
Skills InventoryIndex
PartnershipRatio
AdvisoryIndex
ServiceAccuracy
Sales PriceIndex
R&D SuccessIndex
TransformationRatio
Supplier ServiceAccuracy
Supplier Trans-formation Ratio
SigmaValue
EmployeeTraining Index
Service-LevelEffectiveness
Cost-of-ServiceIndex
SupportServices
SupplyManagement
DemandManagement
Product PortfolioIndex
ChannelProfitability Index
ConfigurabilityIndex
Target MarketIndex
Market CoverageIndex
Market ShareIndex
Opportunity/Threat Index
Aggregates PrimesBusinessAspect
SalesEffectiveness
CustomerResponsiveness
MarketResponsiveness
Product DevelopmentEffectiveness
SupplierEffectiveness
OperationalEfficiency
HumanResources
Responsiveness
InformationTechnology
Responsiveness
Finance & RegulatoryResponsiveness
On-TimeDelivery
Sales OpportunityIndex
Cost of SalesIndex
New ProductsIndex
ServicePerformance
Supplier On-TimeDelivery
Supplier ServicePerformance
Cash-to-CashCycle Time
RecruitmentEffectiveness Index
HR AdvisoryIndex
SystemsPerformance
New ProjectsIndex
ComplianceIndex
Sales CycleIndex
ForecastAccuracy
Feature FunctionIndex
Order FillRate
Customer CarePerformance
Supplier OrderFill Rate
Supplier CarePerformance
ConversionCost
BenefitsAdministration Index
HR TotalCost Index
IT SupportPerformance
Cost Index
AccuracyIndex
AgreementEffectiveness
CustomerRetention Index
Sales CloseIndex
Time-to-MarketIndex
MaterialQuality
Supplier MaterialQuality
Supplier AgreementEffectiveness
AssetUtilization
Skills InventoryIndex
PartnershipRatio
AdvisoryIndex
ServiceAccuracy
Sales PriceIndex
R&D SuccessIndex
TransformationRatio
Supplier ServiceAccuracy
Supplier Trans-formation Ratio
SigmaValue
EmployeeTraining Index
Service-LevelEffectiveness
Cost-of-ServiceIndex
SupportServices
SupplyManagement
DemandManagement
Product PortfolioIndex
ChannelProfitability Index
ConfigurabilityIndex
Product PortfolioIndex
ChannelProfitability Index
ConfigurabilityIndex
Target MarketIndex
Market CoverageIndex
Market ShareIndex
Opportunity/Threat Index
Source: Gartner (May 2006)
3.0 Target Audience The Business Value Model is designed to allow executives to discuss and agree on an appropriate set of metrics to show how performance of different operational areas impacts the different business aspects and, ultimately, financial performance. It can be used alongside a number of business methodologies (see the "Positioning the Business Value Model" section below). It can be also be used at a departmental level to help IT managers build alignment between IT and the business, prioritize new initiatives and effectively communicate IT's contribution to the business.
Publication Date: 31 May 2006/ID Number: G00139413 Page 9 of 68
© 2006 Gartner, Inc. and/or its Affiliates. All Rights Reserved.
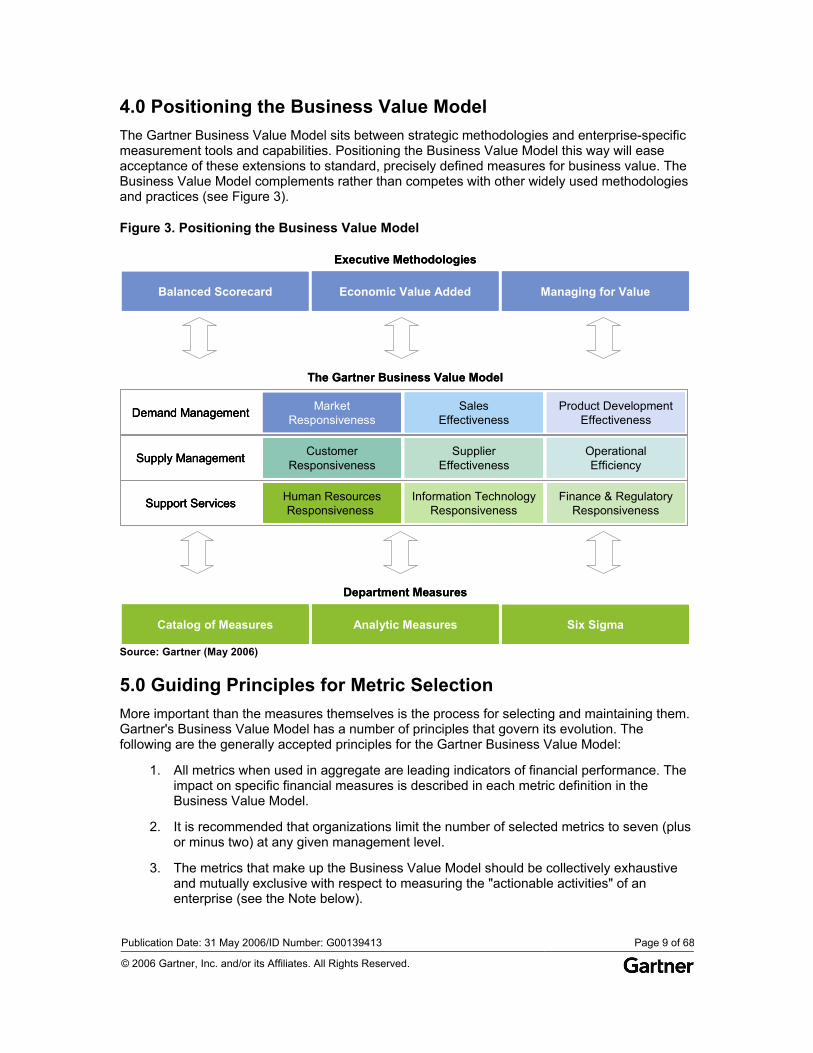
4.0 Positioning the Business Value Model The Gartner Business Value Model sits between strategic methodologies and enterprise-specific measurement tools and capabilities. Positioning the Business Value Model this way will ease acceptance of these extensions to standard, precisely defined measures for business value. The Business Value Model complements rather than competes with other widely used methodologies and practices (see Figure 3).
Figure 3. Positioning the Business Value Model
Balanced Scorecard Economic Value Added Managing for Value
Executive Methodologies
Balanced Scorecard Economic Value Added Managing for ValueBalanced ScorecardBalanced Scorecard Economic Value AddedEconomic Value Added Managing for ValueManaging for Value
Executive Methodologies
MarketResponsiveness
CustomerResponsiveness
Human ResourcesResponsiveness
SalesEffectiveness
SupplierEffectiveness
Information TechnologyResponsiveness
Product DevelopmentEffectiveness
OperationalEfficiency
Finance & RegulatoryResponsiveness
Demand Management
Supply Management
Support Services
The Gartner Business Value Model
MarketResponsiveness
CustomerResponsiveness
Human ResourcesResponsiveness
SalesEffectiveness
SupplierEffectiveness
Information TechnologyResponsiveness
Product DevelopmentEffectiveness
OperationalEfficiency
Finance & RegulatoryResponsiveness
Demand Management
Supply Management
Support Services
MarketResponsiveness
CustomerResponsiveness
Human ResourcesResponsiveness
MarketResponsiveness
CustomerResponsiveness
Human ResourcesResponsiveness
SalesEffectiveness
SupplierEffectiveness
Information TechnologyResponsiveness
SalesEffectiveness
SupplierEffectiveness
Information TechnologyResponsiveness
Product DevelopmentEffectiveness
OperationalEfficiency
Finance & RegulatoryResponsiveness
Product DevelopmentEffectiveness
OperationalEfficiency
Finance & RegulatoryResponsiveness
Demand Management
Supply Management
Support Services
The Gartner Business Value Model
Catalog of Measures Analytic Measures Six Sigma
Department Measures
Catalog of Measures Analytic Measures Six SigmaCatalog of MeasuresCatalog of Measures Analytic MeasuresAnalytic Measures Six SigmaSix Sigma
Department Measures
Source: Gartner (May 2006)
5.0 Guiding Principles for Metric Selection More important than the measures themselves is the process for selecting and maintaining them. Gartner's Business Value Model has a number of principles that govern its evolution. The following are the generally accepted principles for the Gartner Business Value Model:
1. All metrics when used in aggregate are leading indicators of financial performance. The impact on specific financial measures is described in each metric definition in the Business Value Model.
2. It is recommended that organizations limit the number of selected metrics to seven (plus or minus two) at any given management level.
3. The metrics that make up the Business Value Model should be collectively exhaustive and mutually exclusive with respect to measuring the "actionable activities" of an enterprise (see the Note below).
Publication Date: 31 May 2006/ID Number: G00139413 Page 10 of 68
© 2006 Gartner, Inc. and/or its Affiliates. All Rights Reserved.
4. The Business Value Model should be hierarchical, focusing on the actionable activities within the enterprise that are managed at the executive and middle management levels. The standard Business Value Model need not go down to a detailed process or intradepartmental level, as other department measures (see Figure 3) exist to do this. However, integrating such metrics with the standard Business Value Model should be encouraged.
5. The Business Value Model should be based on standard metrics, foster collaboration and allow comparison between internal departments and external organizations.
6. Users can integrate their own organization's internal metrics that may not appear at all in the Business Value Model. The Business Value Model should be made flexible by an architecture allowing many groupings of standard and custom prime metrics that can be combined through its hierarchical structure into aggregate measures. We recommend that 70 percent to 80 percent of the metrics used in an enterprise implementation of the Business Value Model be standard, and 20 percent to 30 percent be custom.
7. The holistic nature of the Business Value Model should capture the cause-and-effect relationships between business functions within the enterprise, to ensure that all the effects of a specific change are considered.
8. The prime metrics should be selected based on general availability of the data required to support them in automated business transaction systems.
9. The Business Value Model should evolve over time, allowing benchmarking to continue throughout.
Note: Principle 3
Principle 3 requires some explanation. "Collectively exhaustive" and "mutually exclusive" are straightforward concepts. However, their implications to performance management are powerful.
• "Collectively exhaustive" means that the set of measures identified explains all the actionable activities within the enterprise. This includes demand management, supply chain management and support services. In this way, the Business Value Model is limited to the things management can affect. When driving a car, you can control the steering wheel and foot pedals, but you can't control the weather or the direction of the road.
• "Mutually exclusive" means that no two measures overlap one another in the operating events being monitored. This needs to be true as you move both vertically and horizontally throughout the Business Value Model. For example, inventory turns and inventory days of supply are measures that overlap. Examining their definitions, it is clear that they measure the same thing.
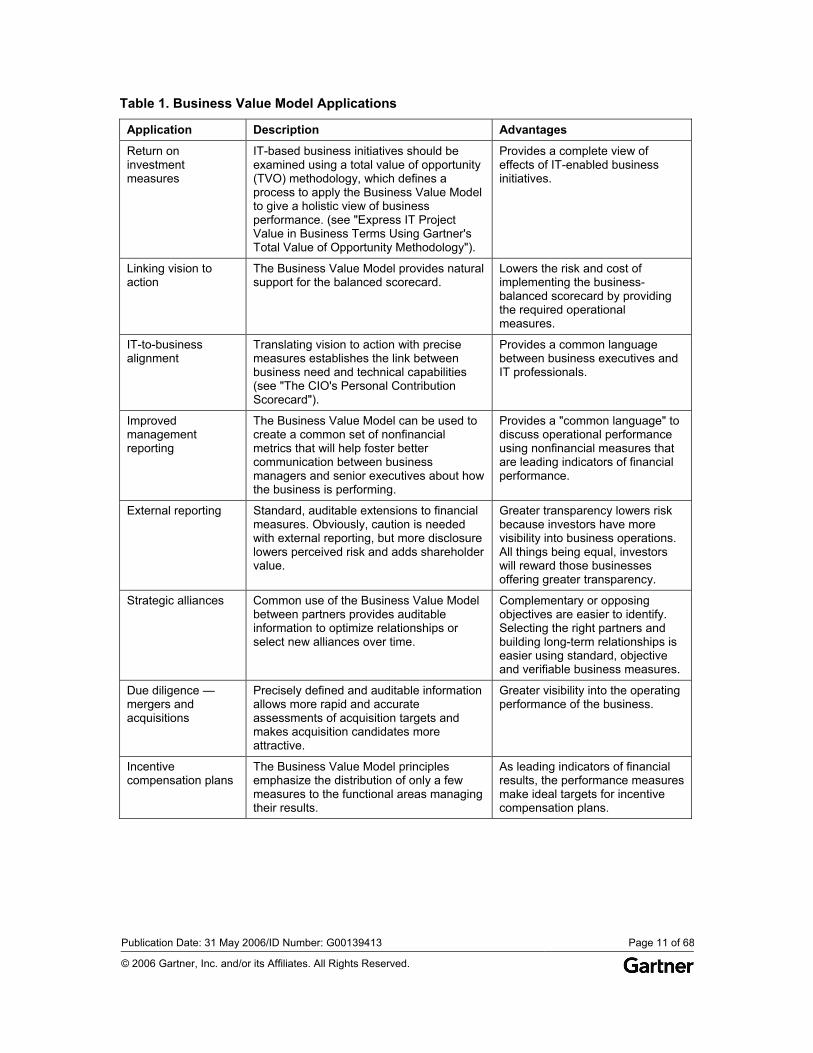
6.0 Applications of the Business Value Model The Gartner Business Value Model is intended to provide many useful management purposes, summarized in Table 1.
Publication Date: 31 May 2006/ID Number: G00139413 Page 11 of 68
© 2006 Gartner, Inc. and/or its Affiliates. All Rights Reserved.
Table 1. Business Value Model Applications
Application Description Advantages
Return on investment measures
IT-based business initiatives should be examined using a total value of opportunity (TVO) methodology, which defines a process to apply the Business Value Model to give a holistic view of business performance. (see "Express IT Project Value in Business Terms Using Gartner's Total Value of Opportunity Methodology").
Provides a complete view of effects of IT-enabled business initiatives.
Linking vision to action
The Business Value Model provides natural support for the balanced scorecard.
Lowers the risk and cost of implementing the business-balanced scorecard by providing the required operational measures.
IT-to-business alignment
Translating vision to action with precise measures establishes the link between business need and technical capabilities (see "The CIO's Personal Contribution Scorecard").
Provides a common language between business executives and IT professionals.
Improved management reporting
The Business Value Model can be used to create a common set of nonfinancial metrics that will help foster better communication between business managers and senior executives about how the business is performing.
Provides a "common language" to discuss operational performance using nonfinancial measures that are leading indicators of financial performance.
External reporting Standard, auditable extensions to financial measures. Obviously, caution is needed with external reporting, but more disclosure lowers perceived risk and adds shareholder value.
Greater transparency lowers risk because investors have more visibility into business operations. All things being equal, investors will reward those businesses offering greater transparency.
Strategic alliances Common use of the Business Value Model between partners provides auditable information to optimize relationships or select new alliances over time.
Complementary or opposing objectives are easier to identify. Selecting the right partners and building long-term relationships is easier using standard, objective and verifiable business measures.
Due diligence — mergers and acquisitions
Precisely defined and auditable information allows more rapid and accurate assessments of acquisition targets and makes acquisition candidates more attractive.
Greater visibility into the operating performance of the business.
Incentive compensation plans
The Business Value Model principles emphasize the distribution of only a few measures to the functional areas managing their results.
As leading indicators of financial results, the performance measures make ideal targets for incentive compensation plans.
Publication Date: 31 May 2006/ID Number: G00139413 Page 12 of 68
© 2006 Gartner, Inc. and/or its Affiliates. All Rights Reserved.
Application Description Advantages
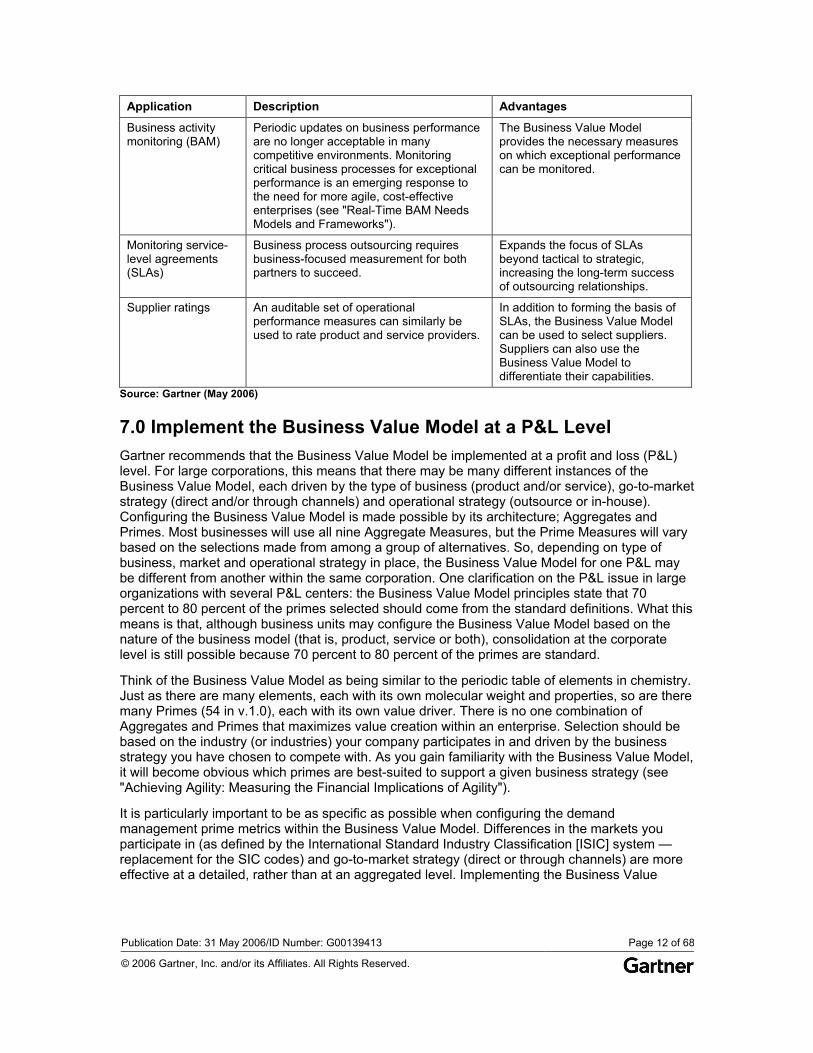
Business activity monitoring (BAM)
Periodic updates on business performance are no longer acceptable in many competitive environments. Monitoring critical business processes for exceptional performance is an emerging response to the need for more agile, cost-effective enterprises (see "Real-Time BAM Needs Models and Frameworks").
The Business Value Model provides the necessary measures on which exceptional performance can be monitored.
Monitoring service- level agreements (SLAs)
Business process outsourcing requires business-focused measurement for both partners to succeed.
Expands the focus of SLAs beyond tactical to strategic, increasing the long-term success of outsourcing relationships.
Supplier ratings An auditable set of operational performance measures can similarly be used to rate product and service providers.
In addition to forming the basis of SLAs, the Business Value Model can be used to select suppliers. Suppliers can also use the Business Value Model to differentiate their capabilities.
Source: Gartner (May 2006)
7.0 Implement the Business Value Model at a P&L Level Gartner recommends that the Business Value Model be implemented at a profit and loss (P&L) level. For large corporations, this means that there may be many different instances of the Business Value Model, each driven by the type of business (product and/or service), go-to-market strategy (direct and/or through channels) and operational strategy (outsource or in-house). Configuring the Business Value Model is made possible by its architecture; Aggregates and Primes. Most businesses will use all nine Aggregate Measures, but the Prime Measures will vary based on the selections made from among a group of alternatives. So, depending on type of business, market and operational strategy in place, the Business Value Model for one P&L may be different from another within the same corporation. One clarification on the P&L issue in large organizations with several P&L centers: the Business Value Model principles state that 70 percent to 80 percent of the primes selected should come from the standard definitions. What this means is that, although business units may configure the Business Value Model based on the nature of the business model (that is, product, service or both), consolidation at the corporate level is still possible because 70 percent to 80 percent of the primes are standard.
Think of the Business Value Model as being similar to the periodic table of elements in chemistry. Just as there are many elements, each with its own molecular weight and properties, so are there many Primes (54 in v.1.0), each with its own value driver. There is no one combination of Aggregates and Primes that maximizes value creation within an enterprise. Selection should be based on the industry (or industries) your company participates in and driven by the business strategy you have chosen to compete with. As you gain familiarity with the Business Value Model, it will become obvious which primes are best-suited to support a given business strategy (see "Achieving Agility: Measuring the Financial Implications of Agility").
It is particularly important to be as specific as possible when configuring the demand management prime metrics within the Business Value Model. Differences in the markets you participate in (as defined by the International Standard Industry Classification [ISIC] system — replacement for the SIC codes) and go-to-market strategy (direct or through channels) are more effective at a detailed, rather than at an aggregated level. Implementing the Business Value
Publication Date: 31 May 2006/ID Number: G00139413 Page 13 of 68
© 2006 Gartner, Inc. and/or its Affiliates. All Rights Reserved.
Model at a P&L level will usually take care of this issue if your P&L centers map to a single ISIC category.
8.0 A Word of Caution The Business Value Model is a work in progress. Every effort was made to select broadly adopted and consistently applied Prime metrics that were based on the guiding principles discussed previously. But we do not yet live in a perfect world. Most of the 54 Prime metrics are calculated as the byproduct of well-vetted, even regulated data capture points (transactions), such as a purchase order or a letter of employment. However, there are some areas where real value is created, yet there were no well-vetted or regulated data capture points (transactions). In these areas, we did our best to base the metric calculations on commonly performed transactions. Examples of this are qualifying a sales lead or determining the features and functions of a new product or service offering. In these situations, we provide guidance on how to establish these common transaction points in the metric specifications — for example, using a formal sales management process or system for qualifying sales opportunities, or through the components listed on a standard bill of materials for capturing new features and functions in product offerings. But these transaction points are subject to interpretation and require discipline by the company using them.
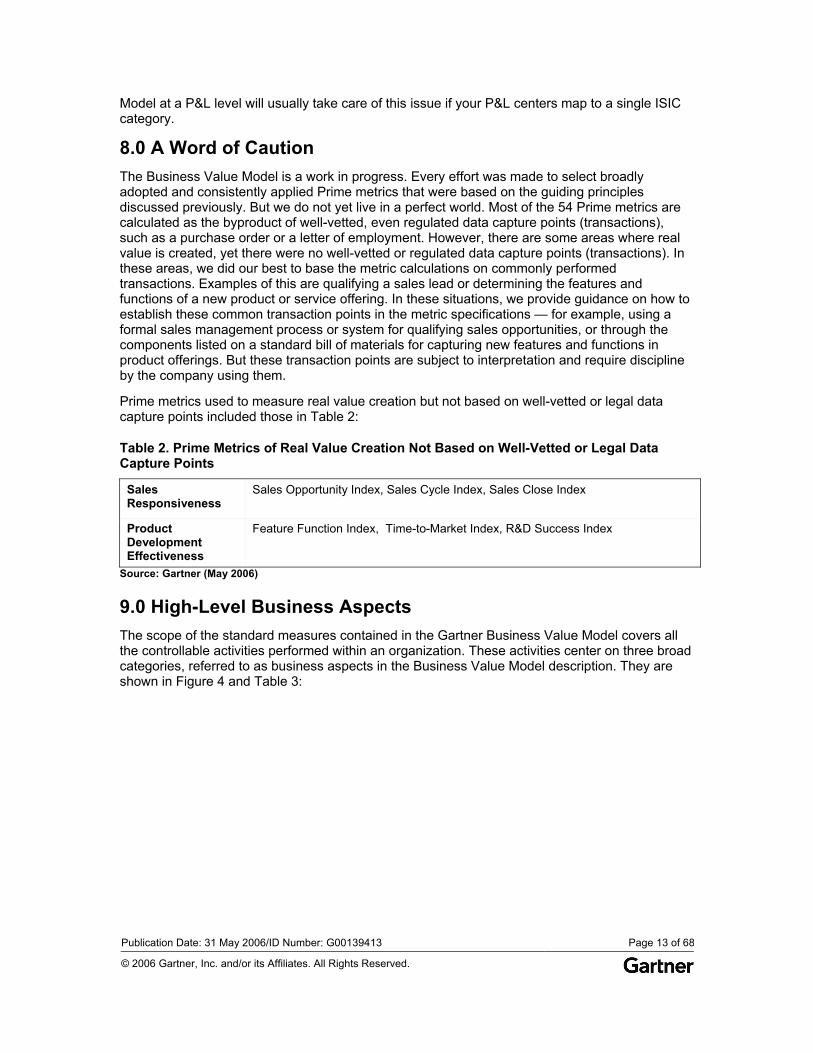
Prime metrics used to measure real value creation but not based on well-vetted or legal data capture points included those in Table 2:
Table 2. Prime Metrics of Real Value Creation Not Based on Well-Vetted or Legal Data Capture Points
Sales Responsiveness
Sales Opportunity Index, Sales Cycle Index, Sales Close Index
Product Development Effectiveness
Feature Function Index, Time-to-Market Index, R&D Success Index
Source: Gartner (May 2006)
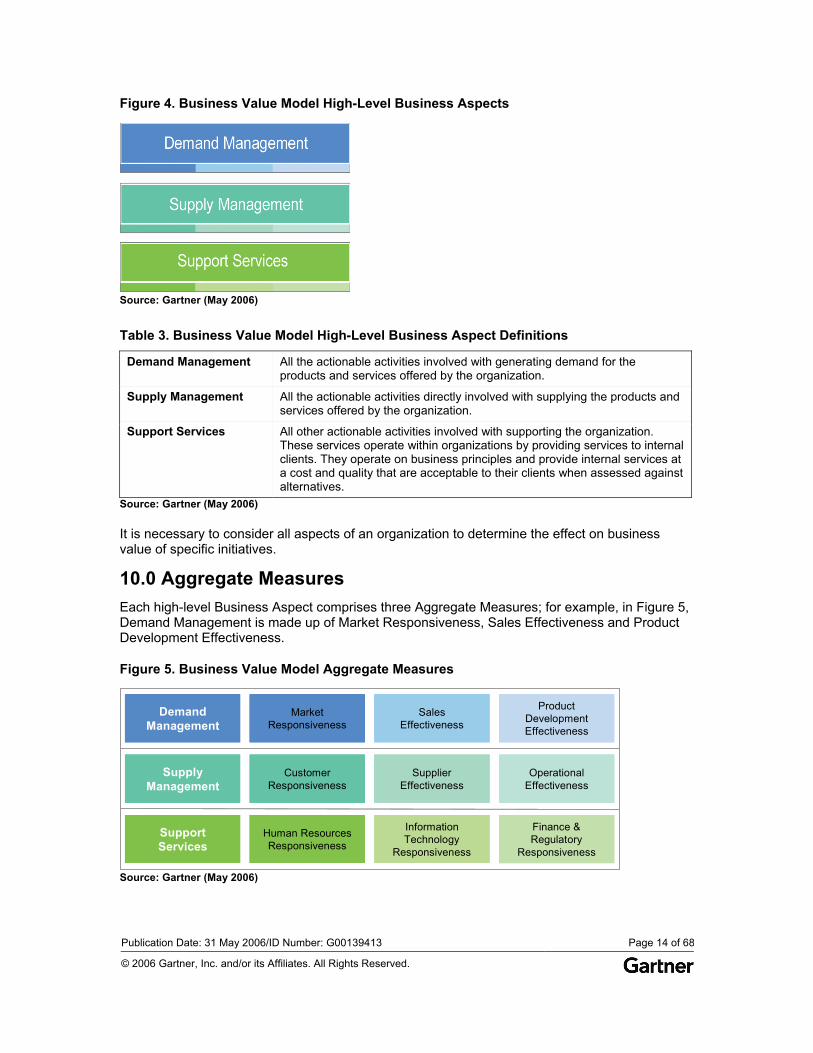
9.0 High-Level Business Aspects The scope of the standard measures contained in the Gartner Business Value Model covers all the controllable activities performed within an organization. These activities center on three broad categories, referred to as business aspects in the Business Value Model description. They are shown in Figure 4 and Table 3:
Publication Date: 31 May 2006/ID Number: G00139413 Page 14 of 68
© 2006 Gartner, Inc. and/or its Affiliates. All Rights Reserved.
Figure 4. Business Value Model High-Level Business Aspects
Source: Gartner (May 2006)
Table 3. Business Value Model High-Level Business Aspect Definitions
Demand Management All the actionable activities involved with generating demand for the products and services offered by the organization.
Supply Management All the actionable activities directly involved with supplying the products and services offered by the organization.
Support Services All other actionable activities involved with supporting the organization. These services operate within organizations by providing services to internal clients. They operate on business principles and provide internal services at a cost and quality that are acceptable to their clients when assessed against alternatives.
Source: Gartner (May 2006)
It is necessary to consider all aspects of an organization to determine the effect on business value of specific initiatives.
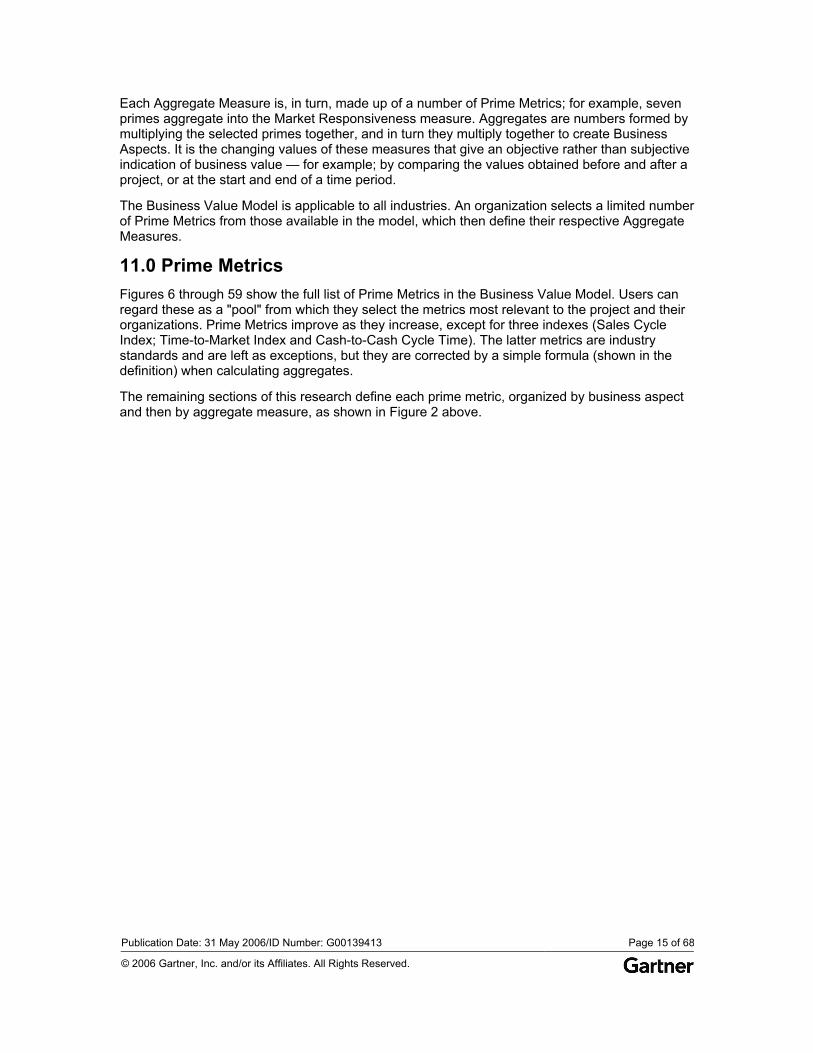
10.0 Aggregate Measures Each high-level Business Aspect comprises three Aggregate Measures; for example, in Figure 5, Demand Management is made up of Market Responsiveness, Sales Effectiveness and Product Development Effectiveness.
Figure 5. Business Value Model Aggregate Measures
InformationTechnology
Responsiveness
Finance &Regulatory
Responsiveness
Human ResourcesResponsiveness
SupportServices
CustomerResponsiveness
SupplierEffectiveness
OperationalEffectiveness
SupplyManagement
SalesEffectiveness
ProductDevelopmentEffectiveness
MarketResponsiveness
DemandManagement
InformationTechnology
Responsiveness
Finance &Regulatory
Responsiveness
Human ResourcesResponsiveness
SupportServices
InformationTechnology
Responsiveness
Finance &Regulatory
Responsiveness
Human ResourcesResponsiveness
SupportServices
CustomerResponsiveness
SupplierEffectiveness
OperationalEffectiveness
SupplyManagement
CustomerResponsiveness
SupplierEffectiveness
OperationalEffectiveness
SupplyManagement
SalesEffectiveness
ProductDevelopmentEffectiveness
MarketResponsiveness
DemandManagement
SalesEffectiveness
ProductDevelopmentEffectiveness
MarketResponsiveness
DemandManagement
Source: Gartner (May 2006)
Publication Date: 31 May 2006/ID Number: G00139413 Page 15 of 68
© 2006 Gartner, Inc. and/or its Affiliates. All Rights Reserved.
Each Aggregate Measure is, in turn, made up of a number of Prime Metrics; for example, seven primes aggregate into the Market Responsiveness measure. Aggregates are numbers formed by multiplying the selected primes together, and in turn they multiply together to create Business Aspects. It is the changing values of these measures that give an objective rather than subjective indication of business value — for example; by comparing the values obtained before and after a project, or at the start and end of a time period.
The Business Value Model is applicable to all industries. An organization selects a limited number of Prime Metrics from those available in the model, which then define their respective Aggregate Measures.
11.0 Prime Metrics Figures 6 through 59 show the full list of Prime Metrics in the Business Value Model. Users can regard these as a "pool" from which they select the metrics most relevant to the project and their organizations. Prime Metrics improve as they increase, except for three indexes (Sales Cycle Index; Time-to-Market Index and Cash-to-Cash Cycle Time). The latter metrics are industry standards and are left as exceptions, but they are corrected by a simple formula (shown in the definition) when calculating aggregates.
The remaining sections of this research define each prime metric, organized by business aspect and then by aggregate measure, as shown in Figure 2 above.
Publication Date: 31 May 2006/ID Number: G00139413 Page 16 of 68
© 2006 Gartner, Inc. and/or its Affiliates. All Rights Reserved.
11.1 Business Aspect: Demand Management
11.1.1 Aggregate: Market Responsiveness
11.1.1.1 Target Market Index
Figure 6. Target Market Index
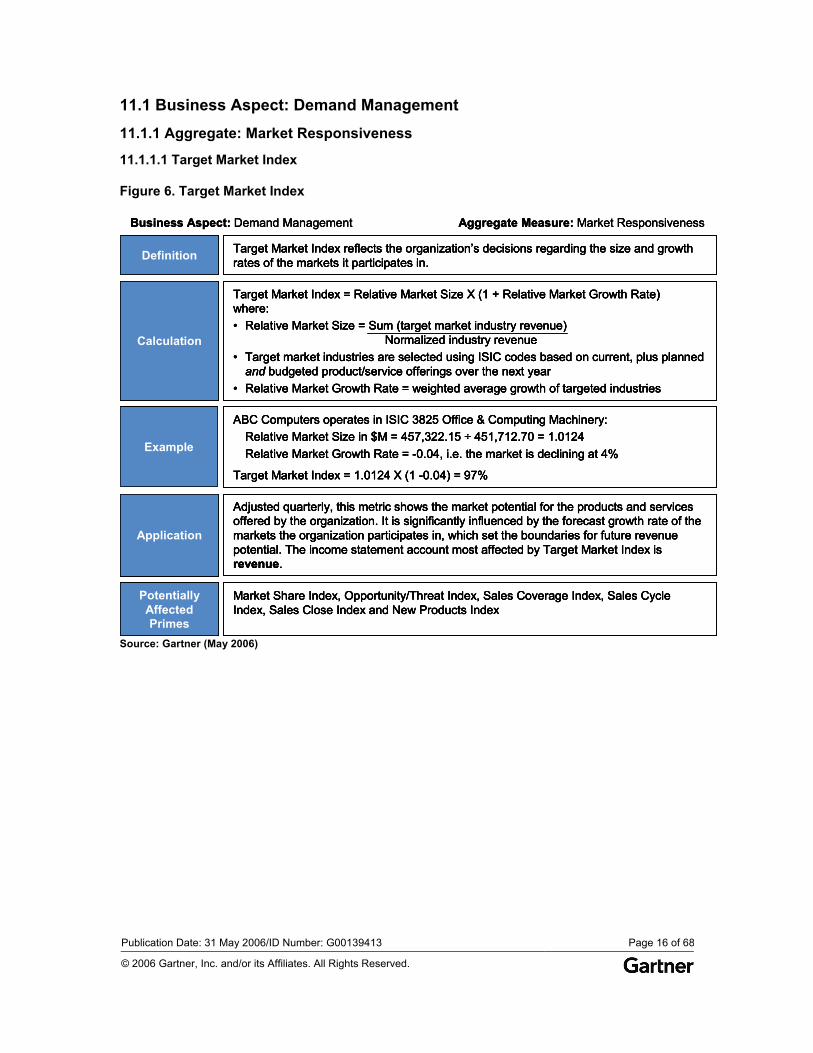
Target Market Index reflects the organization’s decisions regarding the size and growth rates of the markets it participates in.Definition
Target Market Index = Relative Market Size X (1 + Relative Market Growth Rate) where:• Relative Market Size = Sum (target market industry revenue)
Normalized industry revenue• Target market industries are selected using ISIC codes based on current, plus planned
and budgeted product/service offerings over the next year• Relative Market Growth Rate = weighted average growth of targeted industries
Calculation
ABC Computers operates in ISIC 3825 Office & Computing Machinery:Relative Market Size in $M = 457,322.15 ÷ 451,712.70 = 1.0124Relative Market Growth Rate = -0.04, i.e. the market is declining at 4%
Target Market Index = 1.0124 X (1 -0.04) = 97%
Example
Adjusted quarterly, this metric shows the market potential for the products and services offered by the organization. It is significantly influenced by the forecast growth rate of the markets the organization participates in, which set the boundaries for future revenue potential. The income statement account most affected by Target Market Index is revenue.
Application
Market Share Index, Opportunity/Threat Index, Sales Coverage Index, Sales Cycle Index, Sales Close Index and New Products Index
PotentiallyAffectedPrimes
Business Aspect: Demand Management Aggregate Measure: Market Responsiveness
Target Market Index reflects the organization’s decisions regarding the size and growth rates of the markets it participates in.Definition Target Market Index reflects the organization’s decisions regarding the size and growth rates of the markets it participates in.DefinitionDefinition
Target Market Index = Relative Market Size X (1 + Relative Market Growth Rate) where:• Relative Market Size = Sum (target market industry revenue)
Normalized industry revenue• Target market industries are selected using ISIC codes based on current, plus planned
and budgeted product/service offerings over the next year• Relative Market Growth Rate = weighted average growth of targeted industries
Calculation
Target Market Index = Relative Market Size X (1 + Relative Market Growth Rate) where:• Relative Market Size = Sum (target market industry revenue)
Normalized industry revenue• Target market industries are selected using ISIC codes based on current, plus planned
and budgeted product/service offerings over the next year• Relative Market Growth Rate = weighted average growth of targeted industries
CalculationCalculation
ABC Computers operates in ISIC 3825 Office & Computing Machinery:Relative Market Size in $M = 457,322.15 ÷ 451,712.70 = 1.0124Relative Market Growth Rate = -0.04, i.e. the market is declining at 4%
Target Market Index = 1.0124 X (1 -0.04) = 97%
Example
ABC Computers operates in ISIC 3825 Office & Computing Machinery:Relative Market Size in $M = 457,322.15 ÷ 451,712.70 = 1.0124Relative Market Growth Rate = -0.04, i.e. the market is declining at 4%
Target Market Index = 1.0124 X (1 -0.04) = 97%
ExampleExample
Adjusted quarterly, this metric shows the market potential for the products and services offered by the organization. It is significantly influenced by the forecast growth rate of the markets the organization participates in, which set the boundaries for future revenue potential. The income statement account most affected by Target Market Index is revenue.
Application
Adjusted quarterly, this metric shows the market potential for the products and services offered by the organization. It is significantly influenced by the forecast growth rate of the markets the organization participates in, which set the boundaries for future revenue potential. The income statement account most affected by Target Market Index is revenue.
ApplicationApplication
Market Share Index, Opportunity/Threat Index, Sales Coverage Index, Sales Cycle Index, Sales Close Index and New Products Index
PotentiallyAffectedPrimes
Market Share Index, Opportunity/Threat Index, Sales Coverage Index, Sales Cycle Index, Sales Close Index and New Products Index
PotentiallyAffectedPrimes
PotentiallyAffectedPrimes
Business Aspect: Demand Management Aggregate Measure: Market Responsiveness
Source: Gartner (May 2006)
Publication Date: 31 May 2006/ID Number: G00139413 Page 17 of 68
© 2006 Gartner, Inc. and/or its Affiliates. All Rights Reserved.
11.1.1.2 Market Coverage Index
Figure 7. Market Coverage Index
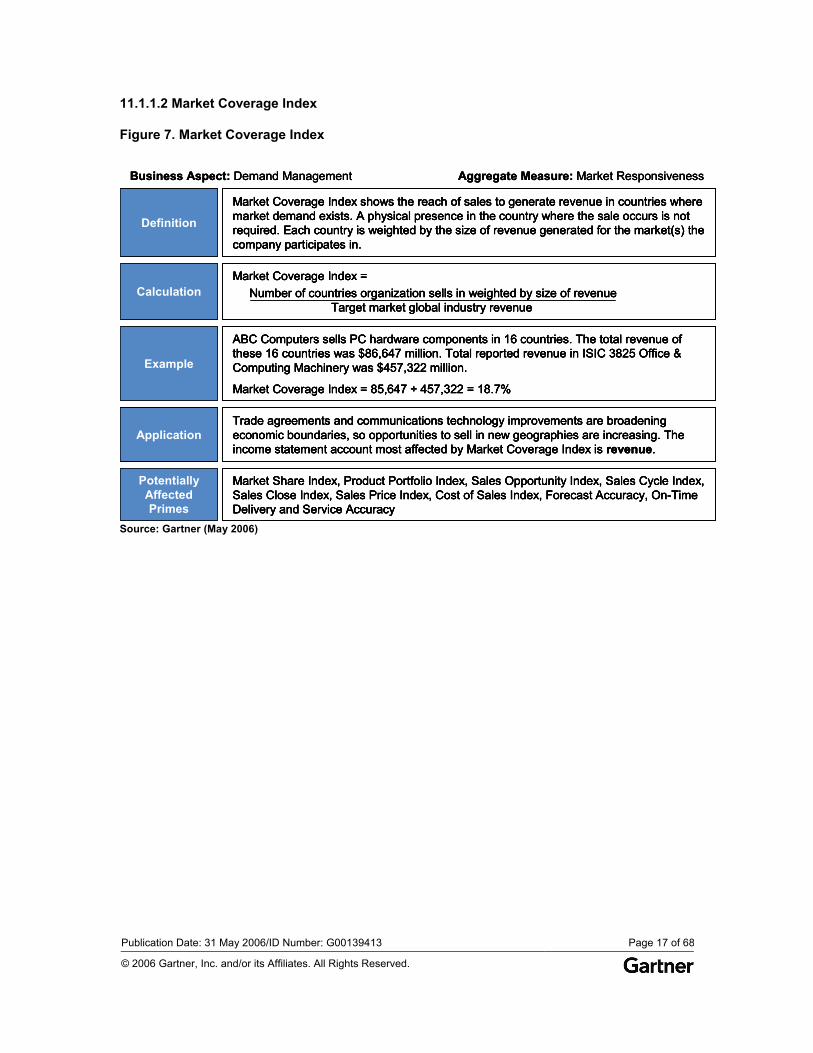
Market Coverage Index shows the reach of sales to generate revenue in countries where market demand exists. A physical presence in the country where the sale occurs is not required. Each country is weighted by the size of revenue generated for the market(s) the company participates in.
Definition
Market Coverage Index =Number of countries organization sells in weighted by size of revenue
Target market global industry revenueCalculation
ABC Computers sells PC hardware components in 16 countries. The total revenue of these 16 countries was $86,647 million. Total reported revenue in ISIC 3825 Office & Computing Machinery was $457,322 million.
Market Coverage Index = 85,647 ÷ 457,322 = 18.7%
Example
Trade agreements and communications technology improvements are broadening economic boundaries, so opportunities to sell in new geographies are increasing. The income statement account most affected by Market Coverage Index is revenue.
Application
Market Share Index, Product Portfolio Index, Sales Opportunity Index, Sales Cycle Index, Sales Close Index, Sales Price Index, Cost of Sales Index, Forecast Accuracy, On-Time Delivery and Service Accuracy
PotentiallyAffectedPrimes
Business Aspect: Demand Management Aggregate Measure: Market Responsiveness
Market Coverage Index shows the reach of sales to generate revenue in countries where market demand exists. A physical presence in the country where the sale occurs is not required. Each country is weighted by the size of revenue generated for the market(s) the company participates in.
Definition
Market Coverage Index shows the reach of sales to generate revenue in countries where market demand exists. A physical presence in the country where the sale occurs is not required. Each country is weighted by the size of revenue generated for the market(s) the company participates in.
DefinitionDefinition
Market Coverage Index =Number of countries organization sells in weighted by size of revenue
Target market global industry revenueCalculation
Market Coverage Index =Number of countries organization sells in weighted by size of revenue
Target market global industry revenueCalculationCalculation
ABC Computers sells PC hardware components in 16 countries. The total revenue of these 16 countries was $86,647 million. Total reported revenue in ISIC 3825 Office & Computing Machinery was $457,322 million.
Market Coverage Index = 85,647 ÷ 457,322 = 18.7%
Example
ABC Computers sells PC hardware components in 16 countries. The total revenue of these 16 countries was $86,647 million. Total reported revenue in ISIC 3825 Office & Computing Machinery was $457,322 million.
Market Coverage Index = 85,647 ÷ 457,322 = 18.7%
ExampleExample
Trade agreements and communications technology improvements are broadening economic boundaries, so opportunities to sell in new geographies are increasing. The income statement account most affected by Market Coverage Index is revenue.
ApplicationTrade agreements and communications technology improvements are broadening economic boundaries, so opportunities to sell in new geographies are increasing. The income statement account most affected by Market Coverage Index is revenue.
ApplicationApplication
Market Share Index, Product Portfolio Index, Sales Opportunity Index, Sales Cycle Index, Sales Close Index, Sales Price Index, Cost of Sales Index, Forecast Accuracy, On-Time Delivery and Service Accuracy
PotentiallyAffectedPrimes
Market Share Index, Product Portfolio Index, Sales Opportunity Index, Sales Cycle Index, Sales Close Index, Sales Price Index, Cost of Sales Index, Forecast Accuracy, On-Time Delivery and Service Accuracy
PotentiallyAffectedPrimes
PotentiallyAffectedPrimes
Business Aspect: Demand Management Aggregate Measure: Market Responsiveness
Source: Gartner (May 2006)
Publication Date: 31 May 2006/ID Number: G00139413 Page 18 of 68
© 2006 Gartner, Inc. and/or its Affiliates. All Rights Reserved.
11.1.1.3 Market Share Index
Figure 8. Market Share Index
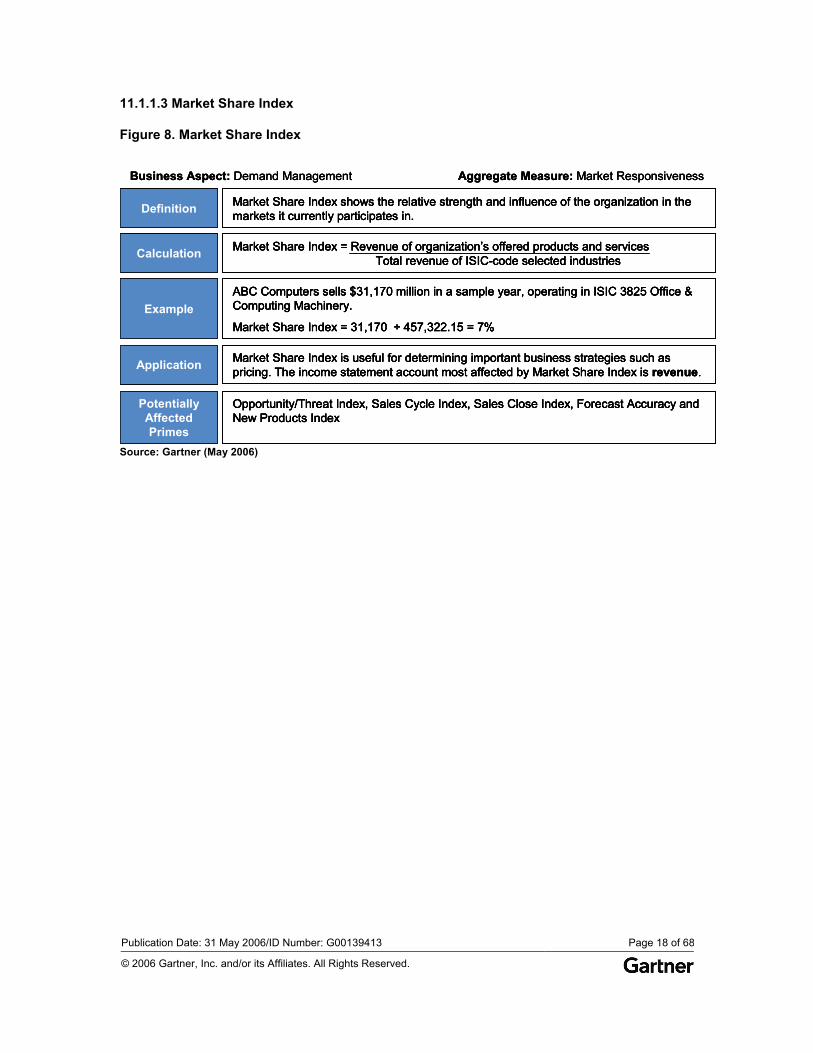
Market Share Index shows the relative strength and influence of the organization in the markets it currently participates in.Definition
Market Share Index = Revenue of organization’s offered products and servicesTotal revenue of ISIC-code selected industriesCalculation
ABC Computers sells $31,170 million in a sample year, operating in ISIC 3825 Office & Computing Machinery.
Market Share Index = 31,170 ÷ 457,322.15 = 7% Example
Market Share Index is useful for determining important business strategies such as pricing. The income statement account most affected by Market Share Index is revenue. Application
Opportunity/Threat Index, Sales Cycle Index, Sales Close Index, Forecast Accuracy and New Products Index
PotentiallyAffectedPrimes
Business Aspect: Demand Management Aggregate Measure: Market Responsiveness
Market Share Index shows the relative strength and influence of the organization in the markets it currently participates in.Definition Market Share Index shows the relative strength and influence of the organization in the markets it currently participates in.DefinitionDefinition
Market Share Index = Revenue of organization’s offered products and servicesTotal revenue of ISIC-code selected industriesCalculation Market Share Index = Revenue of organization’s offered products and servicesTotal revenue of ISIC-code selected industriesCalculationCalculation
ABC Computers sells $31,170 million in a sample year, operating in ISIC 3825 Office & Computing Machinery.
Market Share Index = 31,170 ÷ 457,322.15 = 7% Example
ABC Computers sells $31,170 million in a sample year, operating in ISIC 3825 Office & Computing Machinery.
Market Share Index = 31,170 ÷ 457,322.15 = 7% ExampleExample
Market Share Index is useful for determining important business strategies such as pricing. The income statement account most affected by Market Share Index is revenue. Application Market Share Index is useful for determining important business strategies such as pricing. The income statement account most affected by Market Share Index is revenue. ApplicationApplication
Opportunity/Threat Index, Sales Cycle Index, Sales Close Index, Forecast Accuracy and New Products Index
PotentiallyAffectedPrimes
Opportunity/Threat Index, Sales Cycle Index, Sales Close Index, Forecast Accuracy and New Products Index
PotentiallyAffectedPrimes
PotentiallyAffectedPrimes
Business Aspect: Demand Management Aggregate Measure: Market Responsiveness
Source: Gartner (May 2006)
Publication Date: 31 May 2006/ID Number: G00139413 Page 19 of 68
© 2006 Gartner, Inc. and/or its Affiliates. All Rights Reserved.
11.1.1.4 Opportunity/Threat Index
Figure 9. Opportunity/Threat Index
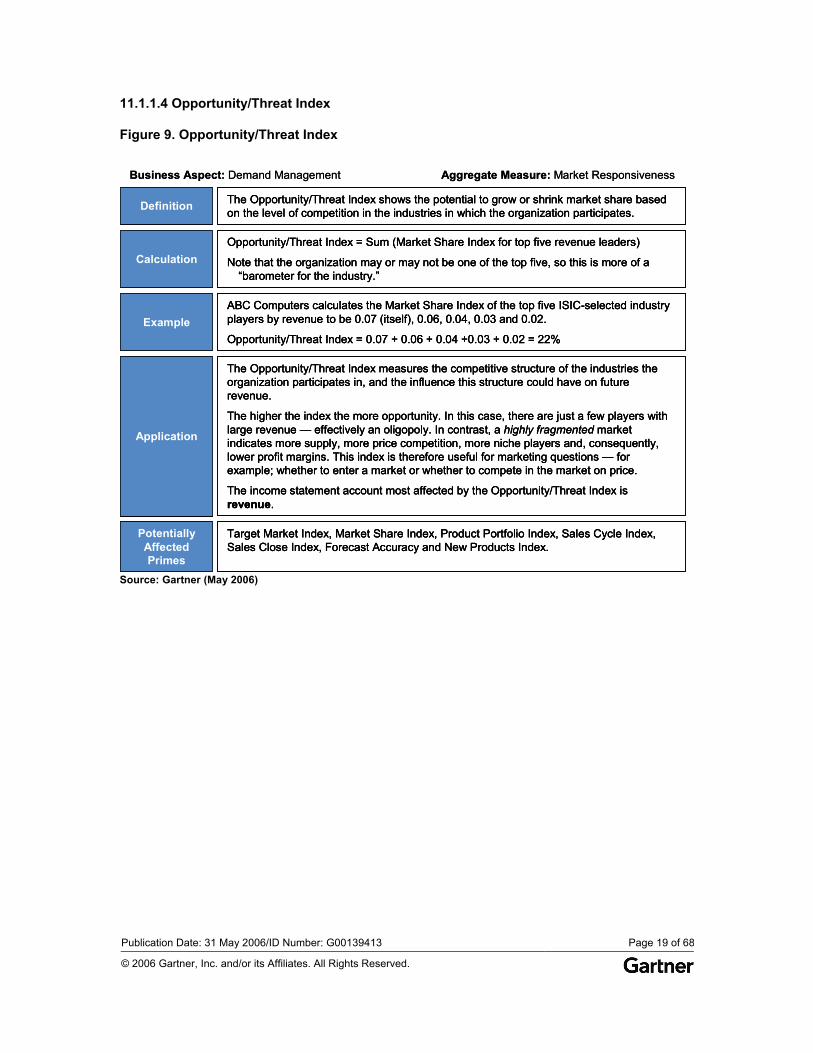
Definition The Opportunity/Threat Index shows the potential to grow or shrink market share based on the level of competition in the industries in which the organization participates.
CalculationOpportunity/Threat Index = Sum (Market Share Index for top five revenue leaders)
Note that the organization may or may not be one of the top five, so this is more of a “barometer for the industry.”
ExampleABC Computers calculates the Market Share Index of the top five ISIC-selected industry players by revenue to be 0.07 (itself), 0.06, 0.04, 0.03 and 0.02.
Opportunity/Threat Index = 0.07 + 0.06 + 0.04 +0.03 + 0.02 = 22%
Application
The Opportunity/Threat Index measures the competitive structure of the industries the organization participates in, and the influence this structure could have on future revenue.
The higher the index the more opportunity. In this case, there are just a few players with large revenue — effectively an oligopoly. In contrast, a highly fragmented market indicates more supply, more price competition, more niche players and, consequently, lower profit margins. This index is therefore useful for marketing questions — for example; whether to enter a market or whether to compete in the market on price.
The income statement account most affected by the Opportunity/Threat Index is revenue.
PotentiallyAffectedPrimes
Target Market Index, Market Share Index, Product Portfolio Index, Sales Cycle Index, Sales Close Index, Forecast Accuracy and New Products Index.
Business Aspect: Demand Management Aggregate Measure: Market Responsiveness
Definition The Opportunity/Threat Index shows the potential to grow or shrink market share based on the level of competition in the industries in which the organization participates. DefinitionDefinition The Opportunity/Threat Index shows the potential to grow or shrink market share based on the level of competition in the industries in which the organization participates.
CalculationOpportunity/Threat Index = Sum (Market Share Index for top five revenue leaders)
Note that the organization may or may not be one of the top five, so this is more of a “barometer for the industry.”
CalculationCalculationOpportunity/Threat Index = Sum (Market Share Index for top five revenue leaders)
Note that the organization may or may not be one of the top five, so this is more of a “barometer for the industry.”
ExampleABC Computers calculates the Market Share Index of the top five ISIC-selected industry players by revenue to be 0.07 (itself), 0.06, 0.04, 0.03 and 0.02.
Opportunity/Threat Index = 0.07 + 0.06 + 0.04 +0.03 + 0.02 = 22%ExampleExample
ABC Computers calculates the Market Share Index of the top five ISIC-selected industry players by revenue to be 0.07 (itself), 0.06, 0.04, 0.03 and 0.02.
Opportunity/Threat Index = 0.07 + 0.06 + 0.04 +0.03 + 0.02 = 22%
Application
The Opportunity/Threat Index measures the competitive structure of the industries the organization participates in, and the influence this structure could have on future revenue.
The higher the index the more opportunity. In this case, there are just a few players with large revenue — effectively an oligopoly. In contrast, a highly fragmented market indicates more supply, more price competition, more niche players and, consequently, lower profit margins. This index is therefore useful for marketing questions — for example; whether to enter a market or whether to compete in the market on price.
The income statement account most affected by the Opportunity/Threat Index is revenue.
ApplicationApplication
The Opportunity/Threat Index measures the competitive structure of the industries the organization participates in, and the influence this structure could have on future revenue.
The higher the index the more opportunity. In this case, there are just a few players with large revenue — effectively an oligopoly. In contrast, a highly fragmented market indicates more supply, more price competition, more niche players and, consequently, lower profit margins. This index is therefore useful for marketing questions — for example; whether to enter a market or whether to compete in the market on price.
The income statement account most affected by the Opportunity/Threat Index is revenue.
PotentiallyAffectedPrimes
Target Market Index, Market Share Index, Product Portfolio Index, Sales Cycle Index, Sales Close Index, Forecast Accuracy and New Products Index.
PotentiallyAffectedPrimes
PotentiallyAffectedPrimes
Target Market Index, Market Share Index, Product Portfolio Index, Sales Cycle Index, Sales Close Index, Forecast Accuracy and New Products Index.
Business Aspect: Demand Management Aggregate Measure: Market Responsiveness
Source: Gartner (May 2006)
Publication Date: 31 May 2006/ID Number: G00139413 Page 20 of 68
© 2006 Gartner, Inc. and/or its Affiliates. All Rights Reserved.
11.1.1.5 Product Portfolio Index
Figure 10. Product Portfolio Index
Definition
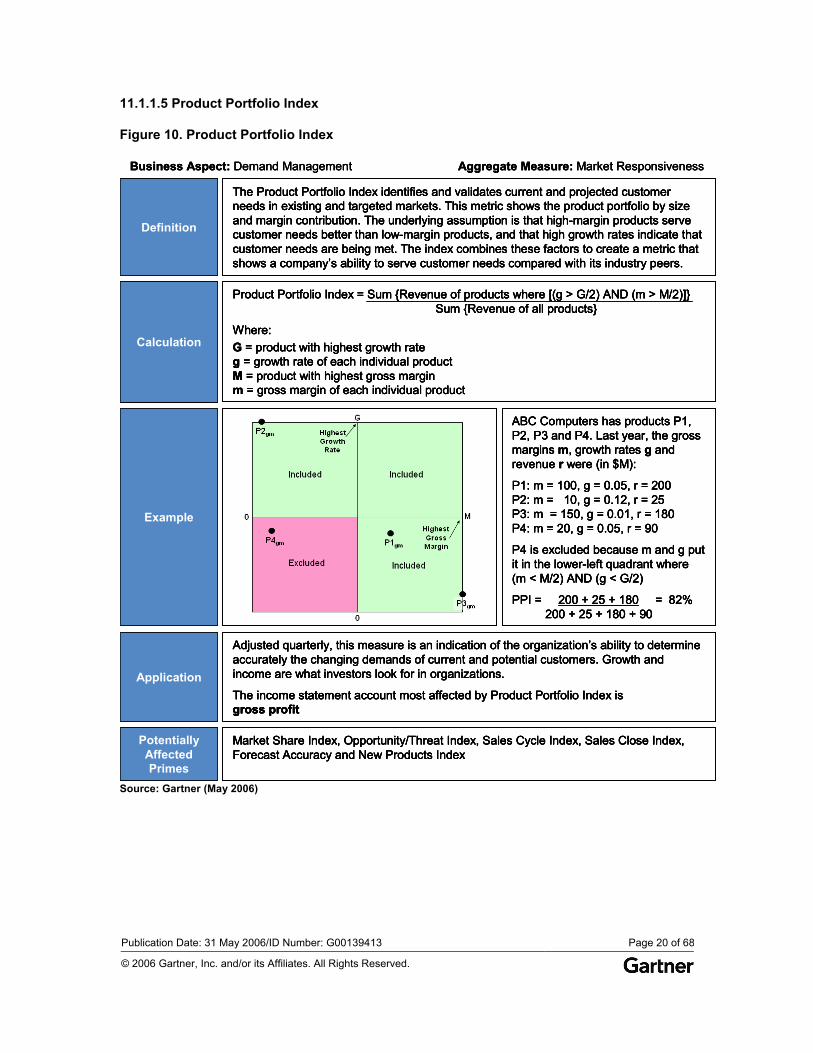
The Product Portfolio Index identifies and validates current and projected customer needs in existing and targeted markets. This metric shows the product portfolio by size and margin contribution. The underlying assumption is that high-margin products serve customer needs better than low-margin products, and that high growth rates indicate that customer needs are being met. The index combines these factors to create a metric that shows a company’s ability to serve customer needs compared with its industry peers.
Calculation
Product Portfolio Index = Sum {Revenue of products where [(g > G/2) AND (m > M/2)]}Sum {Revenue of all products}
Where:G = product with highest growth rateg = growth rate of each individual productM = product with highest gross marginm = gross margin of each individual product
Application
Adjusted quarterly, this measure is an indication of the organization’s ability to determine accurately the changing demands of current and potential customers. Growth and income are what investors look for in organizations.
The income statement account most affected by Product Portfolio Index is gross profit
PotentiallyAffectedPrimes
Market Share Index, Opportunity/Threat Index, Sales Cycle Index, Sales Close Index, Forecast Accuracy and New Products Index
Business Aspect: Demand Management Aggregate Measure: Market Responsiveness
Example
ABC Computers has products P1, P2, P3 and P4. Last year, the gross margins m, growth rates g and revenue r were (in $M):
P1: m = 100, g = 0.05, r = 200P2: m = 10, g = 0.12, r = 25P3: m = 150, g = 0.01, r = 180P4: m = 20, g = 0.05, r = 90
P4 is excluded because m and g put it in the lower-left quadrant where(m < M/2) AND (g < G/2)
PPI = 200 + 25 + 180 = 82%200 + 25 + 180 + 90
Definition
The Product Portfolio Index identifies and validates current and projected customer needs in existing and targeted markets. This metric shows the product portfolio by size and margin contribution. The underlying assumption is that high-margin products serve customer needs better than low-margin products, and that high growth rates indicate that customer needs are being met. The index combines these factors to create a metric that shows a company’s ability to serve customer needs compared with its industry peers.
DefinitionDefinition
The Product Portfolio Index identifies and validates current and projected customer needs in existing and targeted markets. This metric shows the product portfolio by size and margin contribution. The underlying assumption is that high-margin products serve customer needs better than low-margin products, and that high growth rates indicate that customer needs are being met. The index combines these factors to create a metric that shows a company’s ability to serve customer needs compared with its industry peers.
Calculation
Product Portfolio Index = Sum {Revenue of products where [(g > G/2) AND (m > M/2)]}Sum {Revenue of all products}
Where:G = product with highest growth rateg = growth rate of each individual productM = product with highest gross marginm = gross margin of each individual product
CalculationCalculation
Product Portfolio Index = Sum {Revenue of products where [(g > G/2) AND (m > M/2)]}Sum {Revenue of all products}
Where:G = product with highest growth rateg = growth rate of each individual productM = product with highest gross marginm = gross margin of each individual product
Application
Adjusted quarterly, this measure is an indication of the organization’s ability to determine accurately the changing demands of current and potential customers. Growth and income are what investors look for in organizations.
The income statement account most affected by Product Portfolio Index is gross profit
ApplicationApplication
Adjusted quarterly, this measure is an indication of the organization’s ability to determine accurately the changing demands of current and potential customers. Growth and income are what investors look for in organizations.
The income statement account most affected by Product Portfolio Index is gross profit
PotentiallyAffectedPrimes
Market Share Index, Opportunity/Threat Index, Sales Cycle Index, Sales Close Index, Forecast Accuracy and New Products Index
PotentiallyAffectedPrimes
PotentiallyAffectedPrimes
Market Share Index, Opportunity/Threat Index, Sales Cycle Index, Sales Close Index, Forecast Accuracy and New Products Index
Business Aspect: Demand Management Aggregate Measure: Market Responsiveness
Example
ABC Computers has products P1, P2, P3 and P4. Last year, the gross margins m, growth rates g and revenue r were (in $M):
P1: m = 100, g = 0.05, r = 200P2: m = 10, g = 0.12, r = 25P3: m = 150, g = 0.01, r = 180P4: m = 20, g = 0.05, r = 90
P4 is excluded because m and g put it in the lower-left quadrant where(m < M/2) AND (g < G/2)
PPI = 200 + 25 + 180 = 82%200 + 25 + 180 + 90
ExampleExample
ABC Computers has products P1, P2, P3 and P4. Last year, the gross margins m, growth rates g and revenue r were (in $M):
P1: m = 100, g = 0.05, r = 200P2: m = 10, g = 0.12, r = 25P3: m = 150, g = 0.01, r = 180P4: m = 20, g = 0.05, r = 90
P4 is excluded because m and g put it in the lower-left quadrant where(m < M/2) AND (g < G/2)
PPI = 200 + 25 + 180 = 82%200 + 25 + 180 + 90
Source: Gartner (May 2006)
Publication Date: 31 May 2006/ID Number: G00139413 Page 21 of 68
© 2006 Gartner, Inc. and/or its Affiliates. All Rights Reserved.
11.1.1.6 Channel Profitability Index
Figure 11. Channel Profitability Index
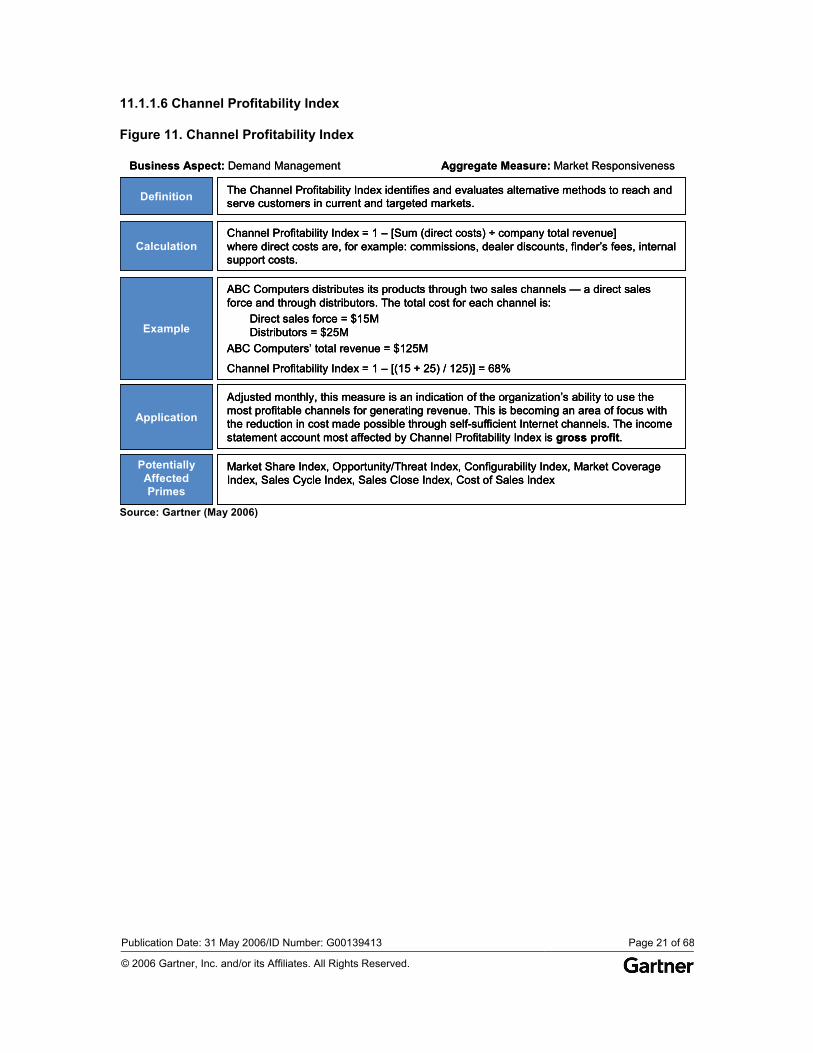
Definition The Channel Profitability Index identifies and evaluates alternative methods to reach and serve customers in current and targeted markets.
CalculationChannel Profitability Index = 1 – [Sum (direct costs) ÷ company total revenue]where direct costs are, for example: commissions, dealer discounts, finder’s fees, internal support costs.
Example
ABC Computers distributes its products through two sales channels — a direct sales force and through distributors. The total cost for each channel is:
Direct sales force = $15MDistributors = $25M
ABC Computers’ total revenue = $125M
Channel Profitability Index = 1 – [(15 + 25) / 125)] = 68%
Application
Adjusted monthly, this measure is an indication of the organization’s ability to use the most profitable channels for generating revenue. This is becoming an area of focus with the reduction in cost made possible through self-sufficient Internet channels. The income statement account most affected by Channel Profitability Index is gross profit.
PotentiallyAffectedPrimes
Market Share Index, Opportunity/Threat Index, Configurability Index, Market Coverage Index, Sales Cycle Index, Sales Close Index, Cost of Sales Index
Business Aspect: Demand Management Aggregate Measure: Market Responsiveness
Definition The Channel Profitability Index identifies and evaluates alternative methods to reach and serve customers in current and targeted markets. DefinitionDefinition The Channel Profitability Index identifies and evaluates alternative methods to reach and serve customers in current and targeted markets.
CalculationChannel Profitability Index = 1 – [Sum (direct costs) ÷ company total revenue]where direct costs are, for example: commissions, dealer discounts, finder’s fees, internal support costs.
CalculationCalculationChannel Profitability Index = 1 – [Sum (direct costs) ÷ company total revenue]where direct costs are, for example: commissions, dealer discounts, finder’s fees, internal support costs.
Example
ABC Computers distributes its products through two sales channels — a direct sales force and through distributors. The total cost for each channel is:
Direct sales force = $15MDistributors = $25M
ABC Computers’ total revenue = $125M
Channel Profitability Index = 1 – [(15 + 25) / 125)] = 68%
ExampleExample
ABC Computers distributes its products through two sales channels — a direct sales force and through distributors. The total cost for each channel is:
Direct sales force = $15MDistributors = $25M
ABC Computers’ total revenue = $125M
Channel Profitability Index = 1 – [(15 + 25) / 125)] = 68%
Application
Adjusted monthly, this measure is an indication of the organization’s ability to use the most profitable channels for generating revenue. This is becoming an area of focus with the reduction in cost made possible through self-sufficient Internet channels. The income statement account most affected by Channel Profitability Index is gross profit.
ApplicationApplication
Adjusted monthly, this measure is an indication of the organization’s ability to use the most profitable channels for generating revenue. This is becoming an area of focus with the reduction in cost made possible through self-sufficient Internet channels. The income statement account most affected by Channel Profitability Index is gross profit.
PotentiallyAffectedPrimes
Market Share Index, Opportunity/Threat Index, Configurability Index, Market Coverage Index, Sales Cycle Index, Sales Close Index, Cost of Sales Index
PotentiallyAffectedPrimes
PotentiallyAffectedPrimes
Market Share Index, Opportunity/Threat Index, Configurability Index, Market Coverage Index, Sales Cycle Index, Sales Close Index, Cost of Sales Index
Business Aspect: Demand Management Aggregate Measure: Market Responsiveness
Source: Gartner (May 2006)
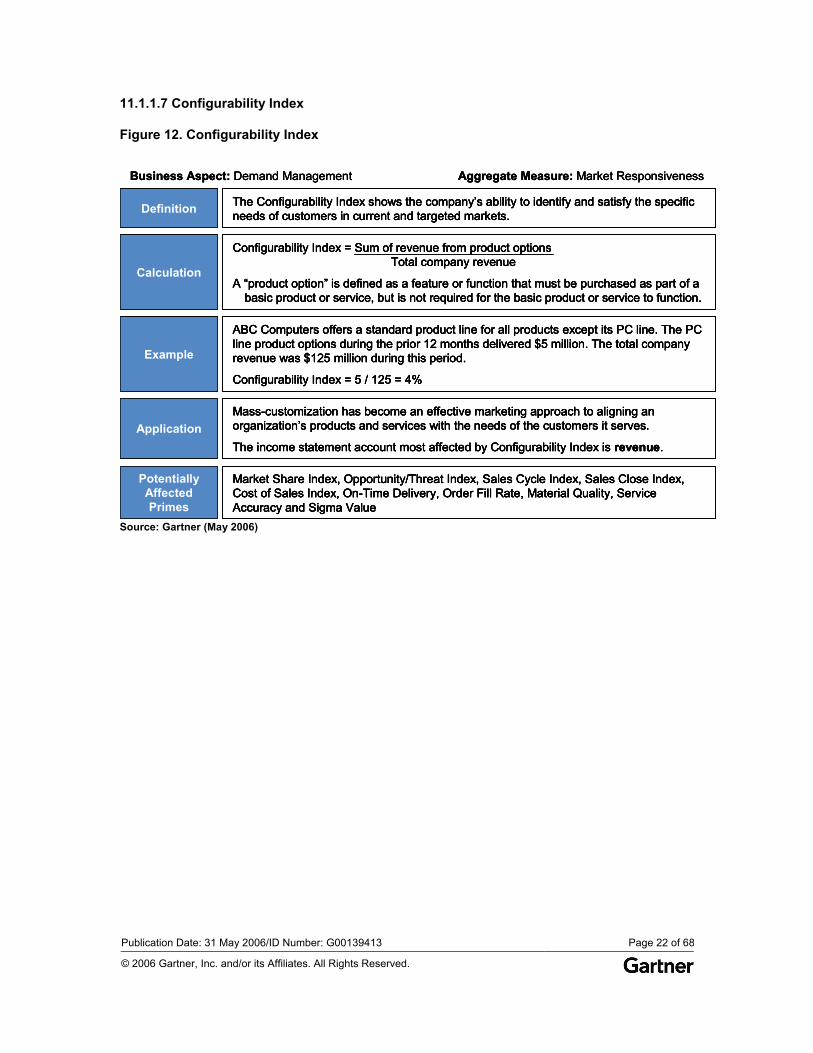
Publication Date: 31 May 2006/ID Number: G00139413 Page 22 of 68
© 2006 Gartner, Inc. and/or its Affiliates. All Rights Reserved.
11.1.1.7 Configurability Index
Figure 12. Configurability Index
Definition The Configurability Index shows the company’s ability to identify and satisfy the specific needs of customers in current and targeted markets.
Calculation
Configurability Index = Sum of revenue from product optionsTotal company revenue
A “product option” is defined as a feature or function that must be purchased as part of a basic product or service, but is not required for the basic product or service to function.
Example
ABC Computers offers a standard product line for all products except its PC line. The PC line product options during the prior 12 months delivered $5 million. The total company revenue was $125 million during this period.
Configurability Index = 5 / 125 = 4%
ApplicationMass-customization has become an effective marketing approach to aligning an organization’s products and services with the needs of the customers it serves.
The income statement account most affected by Configurability Index is revenue.
PotentiallyAffectedPrimes
Market Share Index, Opportunity/Threat Index, Sales Cycle Index, Sales Close Index, Cost of Sales Index, On-Time Delivery, Order Fill Rate, Material Quality, Service Accuracy and Sigma Value
Business Aspect: Demand Management Aggregate Measure: Market Responsiveness
Definition The Configurability Index shows the company’s ability to identify and satisfy the specific needs of customers in current and targeted markets. DefinitionDefinition The Configurability Index shows the company’s ability to identify and satisfy the specific needs of customers in current and targeted markets.
Calculation
Configurability Index = Sum of revenue from product optionsTotal company revenue
A “product option” is defined as a feature or function that must be purchased as part of a basic product or service, but is not required for the basic product or service to function.
CalculationCalculation
Configurability Index = Sum of revenue from product optionsTotal company revenue
A “product option” is defined as a feature or function that must be purchased as part of a basic product or service, but is not required for the basic product or service to function.
Example
ABC Computers offers a standard product line for all products except its PC line. The PC line product options during the prior 12 months delivered $5 million. The total company revenue was $125 million during this period.
Configurability Index = 5 / 125 = 4%
ExampleExample
ABC Computers offers a standard product line for all products except its PC line. The PC line product options during the prior 12 months delivered $5 million. The total company revenue was $125 million during this period.
Configurability Index = 5 / 125 = 4%
ApplicationMass-customization has become an effective marketing approach to aligning an organization’s products and services with the needs of the customers it serves.
The income statement account most affected by Configurability Index is revenue. ApplicationApplication
Mass-customization has become an effective marketing approach to aligning an organization’s products and services with the needs of the customers it serves.
The income statement account most affected by Configurability Index is revenue.
PotentiallyAffectedPrimes
Market Share Index, Opportunity/Threat Index, Sales Cycle Index, Sales Close Index, Cost of Sales Index, On-Time Delivery, Order Fill Rate, Material Quality, Service Accuracy and Sigma Value
PotentiallyAffectedPrimes
PotentiallyAffectedPrimes
Market Share Index, Opportunity/Threat Index, Sales Cycle Index, Sales Close Index, Cost of Sales Index, On-Time Delivery, Order Fill Rate, Material Quality, Service Accuracy and Sigma Value
Business Aspect: Demand Management Aggregate Measure: Market Responsiveness
Source: Gartner (May 2006)
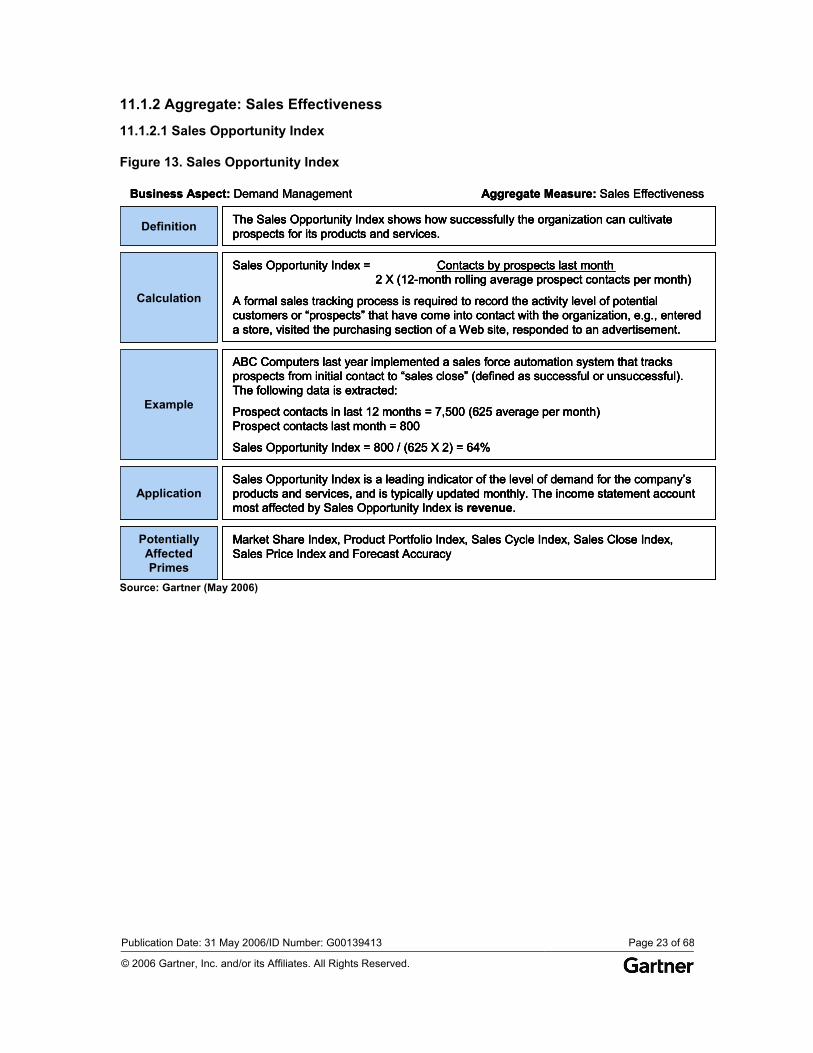
Publication Date: 31 May 2006/ID Number: G00139413 Page 23 of 68
© 2006 Gartner, Inc. and/or its Affiliates. All Rights Reserved.
11.1.2 Aggregate: Sales Effectiveness
11.1.2.1 Sales Opportunity Index
Figure 13. Sales Opportunity Index
Definition The Sales Opportunity Index shows how successfully the organization can cultivate prospects for its products and services.
Calculation
Sales Opportunity Index = Contacts by prospects last month2 X (12-month rolling average prospect contacts per month)
A formal sales tracking process is required to record the activity level of potential customers or “prospects” that have come into contact with the organization, e.g., entered a store, visited the purchasing section of a Web site, responded to an advertisement.
Example
ABC Computers last year implemented a sales force automation system that tracks prospects from initial contact to “sales close” (defined as successful or unsuccessful). The following data is extracted:
Prospect contacts in last 12 months = 7,500 (625 average per month)Prospect contacts last month = 800
Sales Opportunity Index = 800 / (625 X 2) = 64%
ApplicationSales Opportunity Index is a leading indicator of the level of demand for the company’s products and services, and is typically updated monthly. The income statement account most affected by Sales Opportunity Index is revenue.
PotentiallyAffectedPrimes
Market Share Index, Product Portfolio Index, Sales Cycle Index, Sales Close Index, Sales Price Index and Forecast Accuracy
Business Aspect: Demand Management Aggregate Measure: Sales Effectiveness
Definition The Sales Opportunity Index shows how successfully the organization can cultivate prospects for its products and services. DefinitionDefinition The Sales Opportunity Index shows how successfully the organization can cultivate prospects for its products and services.
Calculation
Sales Opportunity Index = Contacts by prospects last month2 X (12-month rolling average prospect contacts per month)
A formal sales tracking process is required to record the activity level of potential customers or “prospects” that have come into contact with the organization, e.g., entered a store, visited the purchasing section of a Web site, responded to an advertisement.
CalculationCalculation
Sales Opportunity Index = Contacts by prospects last month2 X (12-month rolling average prospect contacts per month)
A formal sales tracking process is required to record the activity level of potential customers or “prospects” that have come into contact with the organization, e.g., entered a store, visited the purchasing section of a Web site, responded to an advertisement.
Example
ABC Computers last year implemented a sales force automation system that tracks prospects from initial contact to “sales close” (defined as successful or unsuccessful). The following data is extracted:
Prospect contacts in last 12 months = 7,500 (625 average per month)Prospect contacts last month = 800
Sales Opportunity Index = 800 / (625 X 2) = 64%
ExampleExample
ABC Computers last year implemented a sales force automation system that tracks prospects from initial contact to “sales close” (defined as successful or unsuccessful). The following data is extracted:
Prospect contacts in last 12 months = 7,500 (625 average per month)Prospect contacts last month = 800
Sales Opportunity Index = 800 / (625 X 2) = 64%
ApplicationSales Opportunity Index is a leading indicator of the level of demand for the company’s products and services, and is typically updated monthly. The income statement account most affected by Sales Opportunity Index is revenue.
ApplicationApplicationSales Opportunity Index is a leading indicator of the level of demand for the company’s products and services, and is typically updated monthly. The income statement account most affected by Sales Opportunity Index is revenue.
PotentiallyAffectedPrimes
Market Share Index, Product Portfolio Index, Sales Cycle Index, Sales Close Index, Sales Price Index and Forecast Accuracy
PotentiallyAffectedPrimes
PotentiallyAffectedPrimes
Market Share Index, Product Portfolio Index, Sales Cycle Index, Sales Close Index, Sales Price Index and Forecast Accuracy
Business Aspect: Demand Management Aggregate Measure: Sales Effectiveness
Source: Gartner (May 2006)
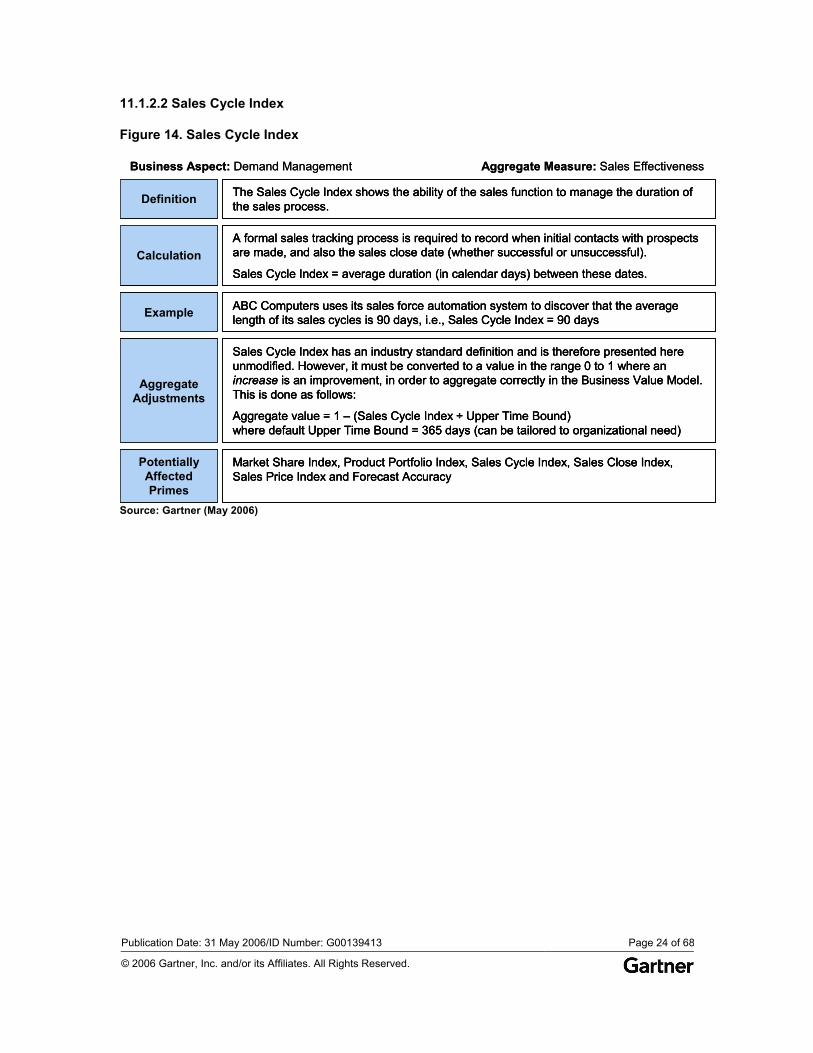
Publication Date: 31 May 2006/ID Number: G00139413 Page 24 of 68
© 2006 Gartner, Inc. and/or its Affiliates. All Rights Reserved.
11.1.2.2 Sales Cycle Index
Figure 14. Sales Cycle Index
Definition The Sales Cycle Index shows the ability of the sales function to manage the duration of the sales process.
CalculationA formal sales tracking process is required to record when initial contacts with prospects are made, and also the sales close date (whether successful or unsuccessful).
Sales Cycle Index = average duration (in calendar days) between these dates.
Example ABC Computers uses its sales force automation system to discover that the average length of its sales cycles is 90 days, i.e., Sales Cycle Index = 90 days
AggregateAdjustments
Sales Cycle Index has an industry standard definition and is therefore presented here unmodified. However, it must be converted to a value in the range 0 to 1 where an increase is an improvement, in order to aggregate correctly in the Business Value Model. This is done as follows:
Aggregate value = 1 – (Sales Cycle Index ÷ Upper Time Bound)where default Upper Time Bound = 365 days (can be tailored to organizational need)
PotentiallyAffectedPrimes
Market Share Index, Product Portfolio Index, Sales Cycle Index, Sales Close Index, Sales Price Index and Forecast Accuracy
Business Aspect: Demand Management Aggregate Measure: Sales Effectiveness
Definition The Sales Cycle Index shows the ability of the sales function to manage the duration of the sales process. DefinitionDefinition The Sales Cycle Index shows the ability of the sales function to manage the duration of the sales process.
CalculationA formal sales tracking process is required to record when initial contacts with prospects are made, and also the sales close date (whether successful or unsuccessful).
Sales Cycle Index = average duration (in calendar days) between these dates. CalculationCalculation
A formal sales tracking process is required to record when initial contacts with prospects are made, and also the sales close date (whether successful or unsuccessful).
Sales Cycle Index = average duration (in calendar days) between these dates.
Example ABC Computers uses its sales force automation system to discover that the average length of its sales cycles is 90 days, i.e., Sales Cycle Index = 90 days ExampleExample ABC Computers uses its sales force automation system to discover that the average length of its sales cycles is 90 days, i.e., Sales Cycle Index = 90 days
AggregateAdjustments
Sales Cycle Index has an industry standard definition and is therefore presented here unmodified. However, it must be converted to a value in the range 0 to 1 where an increase is an improvement, in order to aggregate correctly in the Business Value Model. This is done as follows:
Aggregate value = 1 – (Sales Cycle Index ÷ Upper Time Bound)where default Upper Time Bound = 365 days (can be tailored to organizational need)
AggregateAdjustments
AggregateAdjustments
Sales Cycle Index has an industry standard definition and is therefore presented here unmodified. However, it must be converted to a value in the range 0 to 1 where an increase is an improvement, in order to aggregate correctly in the Business Value Model. This is done as follows:
Aggregate value = 1 – (Sales Cycle Index ÷ Upper Time Bound)where default Upper Time Bound = 365 days (can be tailored to organizational need)
PotentiallyAffectedPrimes
Market Share Index, Product Portfolio Index, Sales Cycle Index, Sales Close Index, Sales Price Index and Forecast Accuracy
PotentiallyAffectedPrimes
PotentiallyAffectedPrimes
Market Share Index, Product Portfolio Index, Sales Cycle Index, Sales Close Index, Sales Price Index and Forecast Accuracy
Business Aspect: Demand Management Aggregate Measure: Sales Effectiveness
Source: Gartner (May 2006)
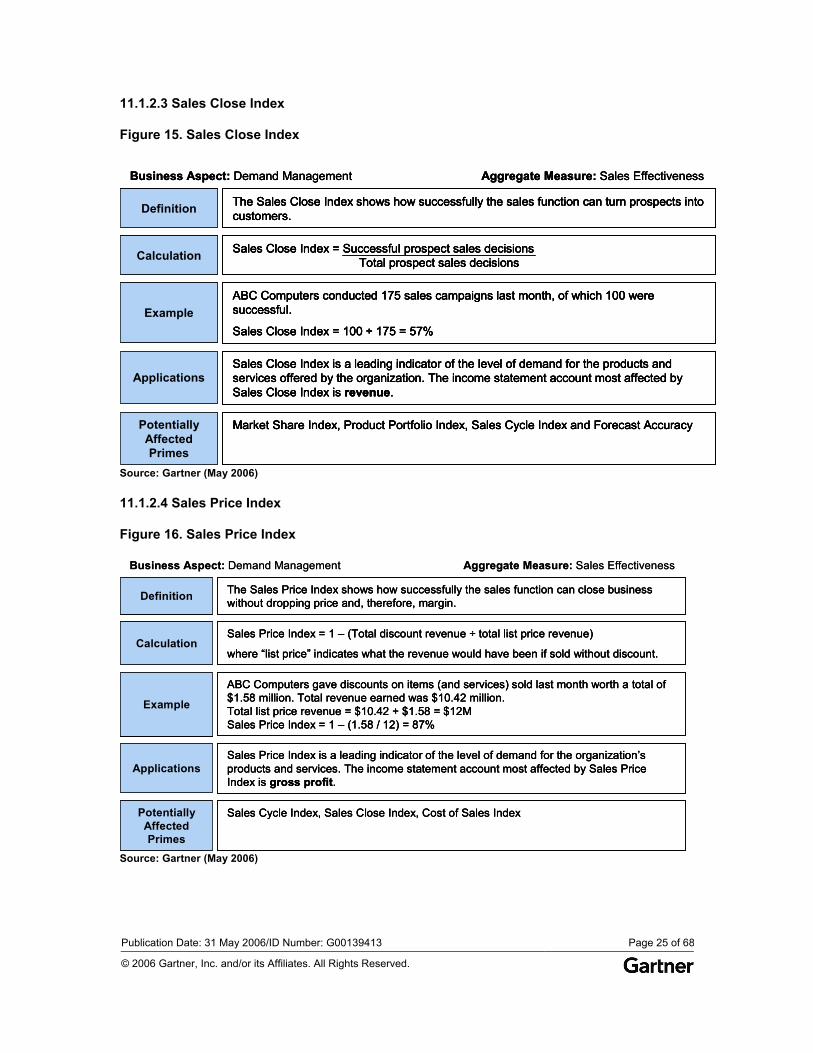
Publication Date: 31 May 2006/ID Number: G00139413 Page 25 of 68
© 2006 Gartner, Inc. and/or its Affiliates. All Rights Reserved.
11.1.2.3 Sales Close Index
Figure 15. Sales Close Index
Definition The Sales Close Index shows how successfully the sales function can turn prospects into customers.
Calculation Sales Close Index = Successful prospect sales decisionsTotal prospect sales decisions
ExampleABC Computers conducted 175 sales campaigns last month, of which 100 were successful.
Sales Close Index = 100 ÷ 175 = 57%
ApplicationsSales Close Index is a leading indicator of the level of demand for the products and services offered by the organization. The income statement account most affected by Sales Close Index is revenue.
PotentiallyAffectedPrimes
Market Share Index, Product Portfolio Index, Sales Cycle Index and Forecast Accuracy
Business Aspect: Demand Management Aggregate Measure: Sales Effectiveness
Definition The Sales Close Index shows how successfully the sales function can turn prospects into customers. DefinitionDefinition The Sales Close Index shows how successfully the sales function can turn prospects into customers.
Calculation Sales Close Index = Successful prospect sales decisionsTotal prospect sales decisions CalculationCalculation Sales Close Index = Successful prospect sales decisionsTotal prospect sales decisions
ExampleABC Computers conducted 175 sales campaigns last month, of which 100 were successful.
Sales Close Index = 100 ÷ 175 = 57% ExampleExample
ABC Computers conducted 175 sales campaigns last month, of which 100 were successful.
Sales Close Index = 100 ÷ 175 = 57%
ApplicationsSales Close Index is a leading indicator of the level of demand for the products and services offered by the organization. The income statement account most affected by Sales Close Index is revenue.
ApplicationsApplicationsSales Close Index is a leading indicator of the level of demand for the products and services offered by the organization. The income statement account most affected by Sales Close Index is revenue.
PotentiallyAffectedPrimes
Market Share Index, Product Portfolio Index, Sales Cycle Index and Forecast Accuracy PotentiallyAffectedPrimes
PotentiallyAffectedPrimes
Market Share Index, Product Portfolio Index, Sales Cycle Index and Forecast Accuracy
Business Aspect: Demand Management Aggregate Measure: Sales Effectiveness
Source: Gartner (May 2006)
11.1.2.4 Sales Price Index
Figure 16. Sales Price Index
Definition The Sales Price Index shows how successfully the sales function can close business without dropping price and, therefore, margin.
CalculationSales Price Index = 1 – (Total discount revenue ÷ total list price revenue)
where “list price” indicates what the revenue would have been if sold without discount.
Example
ABC Computers gave discounts on items (and services) sold last month worth a total of $1.58 million. Total revenue earned was $10.42 million.Total list price revenue = $10.42 + $1.58 = $12MSales Price Index = 1 – (1.58 / 12) = 87%
ApplicationsSales Price Index is a leading indicator of the level of demand for the organization’s products and services. The income statement account most affected by Sales Price Index is gross profit.
PotentiallyAffectedPrimes
Sales Cycle Index, Sales Close Index, Cost of Sales Index
Business Aspect: Demand Management Aggregate Measure: Sales Effectiveness
Definition The Sales Price Index shows how successfully the sales function can close business without dropping price and, therefore, margin. DefinitionDefinition The Sales Price Index shows how successfully the sales function can close business without dropping price and, therefore, margin.
CalculationSales Price Index = 1 – (Total discount revenue ÷ total list price revenue)
where “list price” indicates what the revenue would have been if sold without discount. CalculationCalculation
Sales Price Index = 1 – (Total discount revenue ÷ total list price revenue)
where “list price” indicates what the revenue would have been if sold without discount.
Example
ABC Computers gave discounts on items (and services) sold last month worth a total of $1.58 million. Total revenue earned was $10.42 million.Total list price revenue = $10.42 + $1.58 = $12MSales Price Index = 1 – (1.58 / 12) = 87%
ExampleExample
ABC Computers gave discounts on items (and services) sold last month worth a total of $1.58 million. Total revenue earned was $10.42 million.Total list price revenue = $10.42 + $1.58 = $12MSales Price Index = 1 – (1.58 / 12) = 87%
ApplicationsSales Price Index is a leading indicator of the level of demand for the organization’s products and services. The income statement account most affected by Sales Price Index is gross profit.
ApplicationsApplicationsSales Price Index is a leading indicator of the level of demand for the organization’s products and services. The income statement account most affected by Sales Price Index is gross profit.
PotentiallyAffectedPrimes
Sales Cycle Index, Sales Close Index, Cost of Sales Index PotentiallyAffectedPrimes
PotentiallyAffectedPrimes
Sales Cycle Index, Sales Close Index, Cost of Sales Index
Business Aspect: Demand Management Aggregate Measure: Sales Effectiveness
Source: Gartner (May 2006)
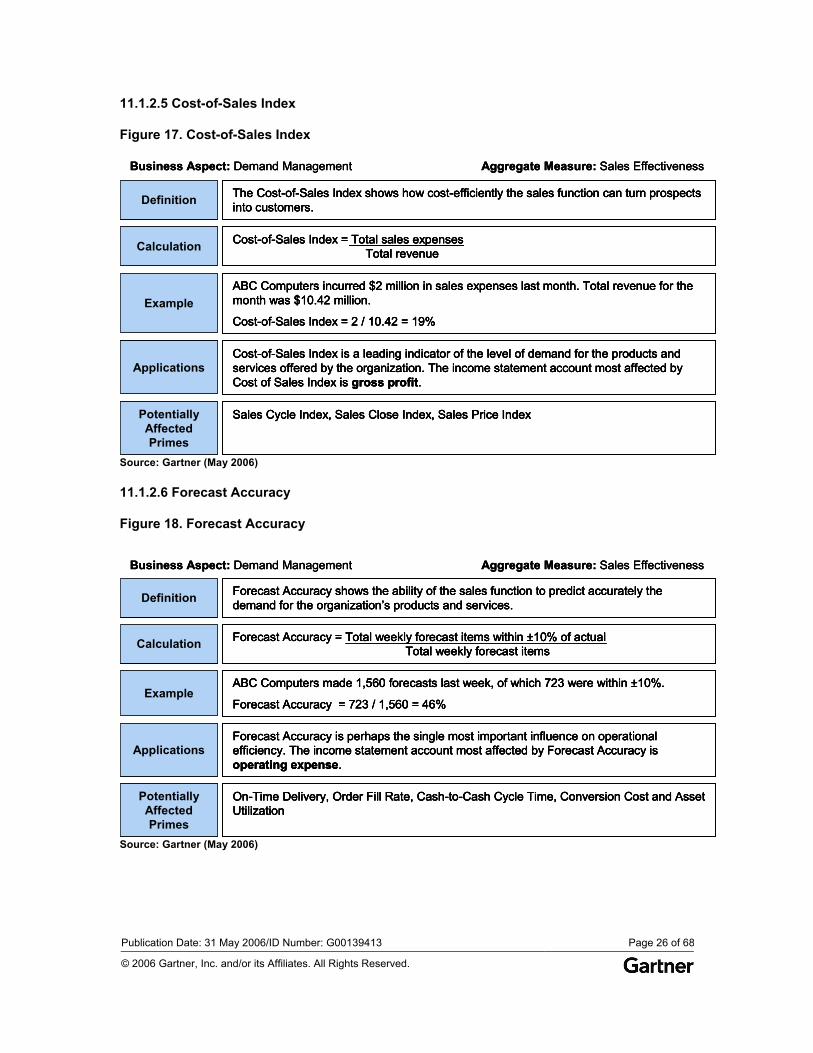
Publication Date: 31 May 2006/ID Number: G00139413 Page 26 of 68
© 2006 Gartner, Inc. and/or its Affiliates. All Rights Reserved.
11.1.2.5 Cost-of-Sales Index
Figure 17. Cost-of-Sales Index
Definition The Cost-of-Sales Index shows how cost-efficiently the sales function can turn prospects into customers.
Calculation Cost-of-Sales Index = Total sales expensesTotal revenue
ExampleABC Computers incurred $2 million in sales expenses last month. Total revenue for the month was $10.42 million.
Cost-of-Sales Index = 2 / 10.42 = 19%
ApplicationsCost-of-Sales Index is a leading indicator of the level of demand for the products and services offered by the organization. The income statement account most affected by Cost of Sales Index is gross profit.
PotentiallyAffectedPrimes
Sales Cycle Index, Sales Close Index, Sales Price Index
Business Aspect: Demand Management Aggregate Measure: Sales Effectiveness
Definition The Cost-of-Sales Index shows how cost-efficiently the sales function can turn prospects into customers. DefinitionDefinition The Cost-of-Sales Index shows how cost-efficiently the sales function can turn prospects into customers.
Calculation Cost-of-Sales Index = Total sales expensesTotal revenue CalculationCalculation Cost-of-Sales Index = Total sales expensesTotal revenue
ExampleABC Computers incurred $2 million in sales expenses last month. Total revenue for the month was $10.42 million.
Cost-of-Sales Index = 2 / 10.42 = 19% ExampleExample
ABC Computers incurred $2 million in sales expenses last month. Total revenue for the month was $10.42 million.
Cost-of-Sales Index = 2 / 10.42 = 19%
ApplicationsCost-of-Sales Index is a leading indicator of the level of demand for the products and services offered by the organization. The income statement account most affected by Cost of Sales Index is gross profit.
ApplicationsApplicationsCost-of-Sales Index is a leading indicator of the level of demand for the products and services offered by the organization. The income statement account most affected by Cost of Sales Index is gross profit.
PotentiallyAffectedPrimes
Sales Cycle Index, Sales Close Index, Sales Price Index PotentiallyAffectedPrimes
PotentiallyAffectedPrimes
Sales Cycle Index, Sales Close Index, Sales Price Index
Business Aspect: Demand Management Aggregate Measure: Sales Effectiveness
Source: Gartner (May 2006)
11.1.2.6 Forecast Accuracy
Figure 18. Forecast Accuracy
Definition Forecast Accuracy shows the ability of the sales function to predict accurately the demand for the organization’s products and services.
Calculation Forecast Accuracy = Total weekly forecast items within ±10% of actualTotal weekly forecast items
ExampleABC Computers made 1,560 forecasts last week, of which 723 were within ±10%.
Forecast Accuracy = 723 / 1,560 = 46%
ApplicationsForecast Accuracy is perhaps the single most important influence on operational efficiency. The income statement account most affected by Forecast Accuracy is operating expense.
PotentiallyAffectedPrimes
On-Time Delivery, Order Fill Rate, Cash-to-Cash Cycle Time, Conversion Cost and Asset Utilization
Business Aspect: Demand Management Aggregate Measure: Sales Effectiveness
Definition Forecast Accuracy shows the ability of the sales function to predict accurately the demand for the organization’s products and services. DefinitionDefinition Forecast Accuracy shows the ability of the sales function to predict accurately the demand for the organization’s products and services.
Calculation Forecast Accuracy = Total weekly forecast items within ±10% of actualTotal weekly forecast itemsCalculationCalculation Forecast Accuracy = Total weekly forecast items within ±10% of actualTotal weekly forecast items
ExampleABC Computers made 1,560 forecasts last week, of which 723 were within ±10%.
Forecast Accuracy = 723 / 1,560 = 46%ExampleExample
ABC Computers made 1,560 forecasts last week, of which 723 were within ±10%.
Forecast Accuracy = 723 / 1,560 = 46%
ApplicationsForecast Accuracy is perhaps the single most important influence on operational efficiency. The income statement account most affected by Forecast Accuracy is operating expense.
ApplicationsApplicationsForecast Accuracy is perhaps the single most important influence on operational efficiency. The income statement account most affected by Forecast Accuracy is operating expense.
PotentiallyAffectedPrimes
On-Time Delivery, Order Fill Rate, Cash-to-Cash Cycle Time, Conversion Cost and Asset Utilization
PotentiallyAffectedPrimes
PotentiallyAffectedPrimes
On-Time Delivery, Order Fill Rate, Cash-to-Cash Cycle Time, Conversion Cost and Asset Utilization
Business Aspect: Demand Management Aggregate Measure: Sales Effectiveness
Source: Gartner (May 2006)
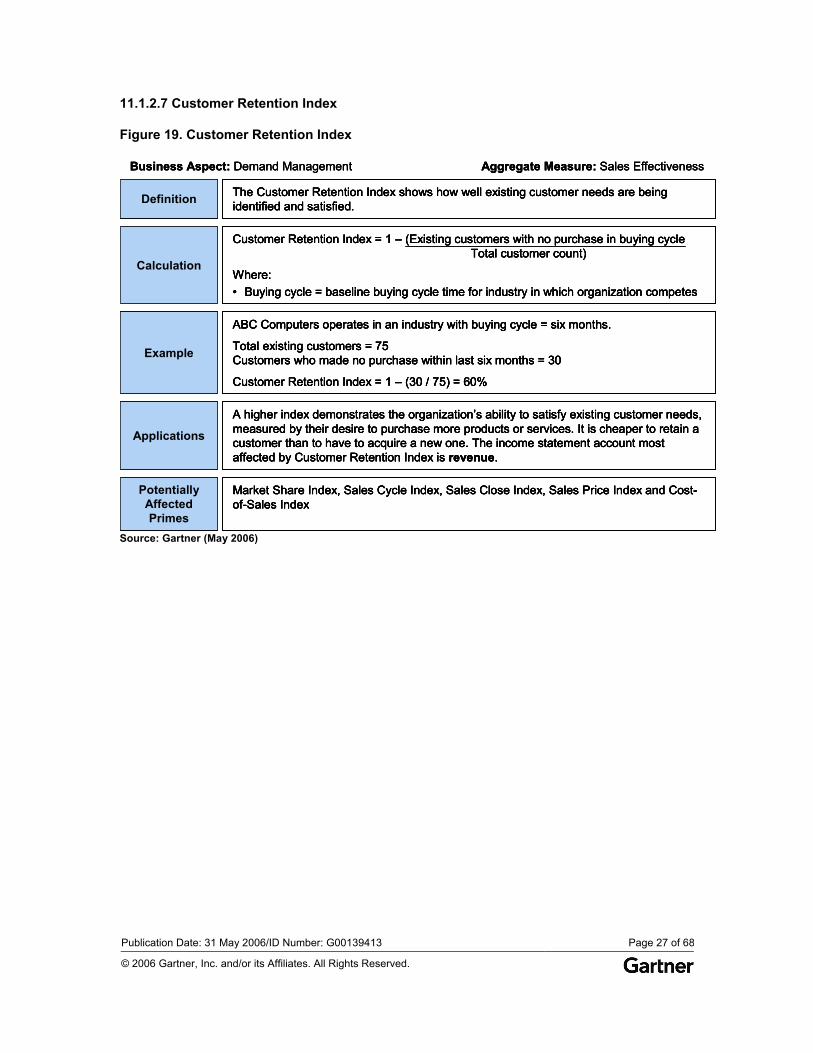
Publication Date: 31 May 2006/ID Number: G00139413 Page 27 of 68
© 2006 Gartner, Inc. and/or its Affiliates. All Rights Reserved.
11.1.2.7 Customer Retention Index
Figure 19. Customer Retention Index
Definition The Customer Retention Index shows how well existing customer needs are being identified and satisfied.
Calculation
Customer Retention Index = 1 – (Existing customers with no purchase in buying cycleTotal customer count)
Where:• Buying cycle = baseline buying cycle time for industry in which organization competes
Example
ABC Computers operates in an industry with buying cycle = six months.
Total existing customers = 75Customers who made no purchase within last six months = 30
Customer Retention Index = 1 – (30 / 75) = 60%
Applications
A higher index demonstrates the organization’s ability to satisfy existing customer needs, measured by their desire to purchase more products or services. It is cheaper to retain a customer than to have to acquire a new one. The income statement account most affected by Customer Retention Index is revenue.
PotentiallyAffectedPrimes
Market Share Index, Sales Cycle Index, Sales Close Index, Sales Price Index and Cost-of-Sales Index
Business Aspect: Demand Management Aggregate Measure: Sales Effectiveness
Definition The Customer Retention Index shows how well existing customer needs are being identified and satisfied.DefinitionDefinition The Customer Retention Index shows how well existing customer needs are being identified and satisfied.
Calculation
Customer Retention Index = 1 – (Existing customers with no purchase in buying cycleTotal customer count)
Where:• Buying cycle = baseline buying cycle time for industry in which organization competes
CalculationCalculation
Customer Retention Index = 1 – (Existing customers with no purchase in buying cycleTotal customer count)
Where:• Buying cycle = baseline buying cycle time for industry in which organization competes
Example
ABC Computers operates in an industry with buying cycle = six months.
Total existing customers = 75Customers who made no purchase within last six months = 30
Customer Retention Index = 1 – (30 / 75) = 60%
ExampleExample
ABC Computers operates in an industry with buying cycle = six months.
Total existing customers = 75Customers who made no purchase within last six months = 30
Customer Retention Index = 1 – (30 / 75) = 60%
Applications
A higher index demonstrates the organization’s ability to satisfy existing customer needs, measured by their desire to purchase more products or services. It is cheaper to retain a customer than to have to acquire a new one. The income statement account most affected by Customer Retention Index is revenue.
ApplicationsApplications
A higher index demonstrates the organization’s ability to satisfy existing customer needs, measured by their desire to purchase more products or services. It is cheaper to retain a customer than to have to acquire a new one. The income statement account most affected by Customer Retention Index is revenue.
PotentiallyAffectedPrimes
Market Share Index, Sales Cycle Index, Sales Close Index, Sales Price Index and Cost-of-Sales Index
PotentiallyAffectedPrimes
PotentiallyAffectedPrimes
Market Share Index, Sales Cycle Index, Sales Close Index, Sales Price Index and Cost-of-Sales Index
Business Aspect: Demand Management Aggregate Measure: Sales Effectiveness
Source: Gartner (May 2006)
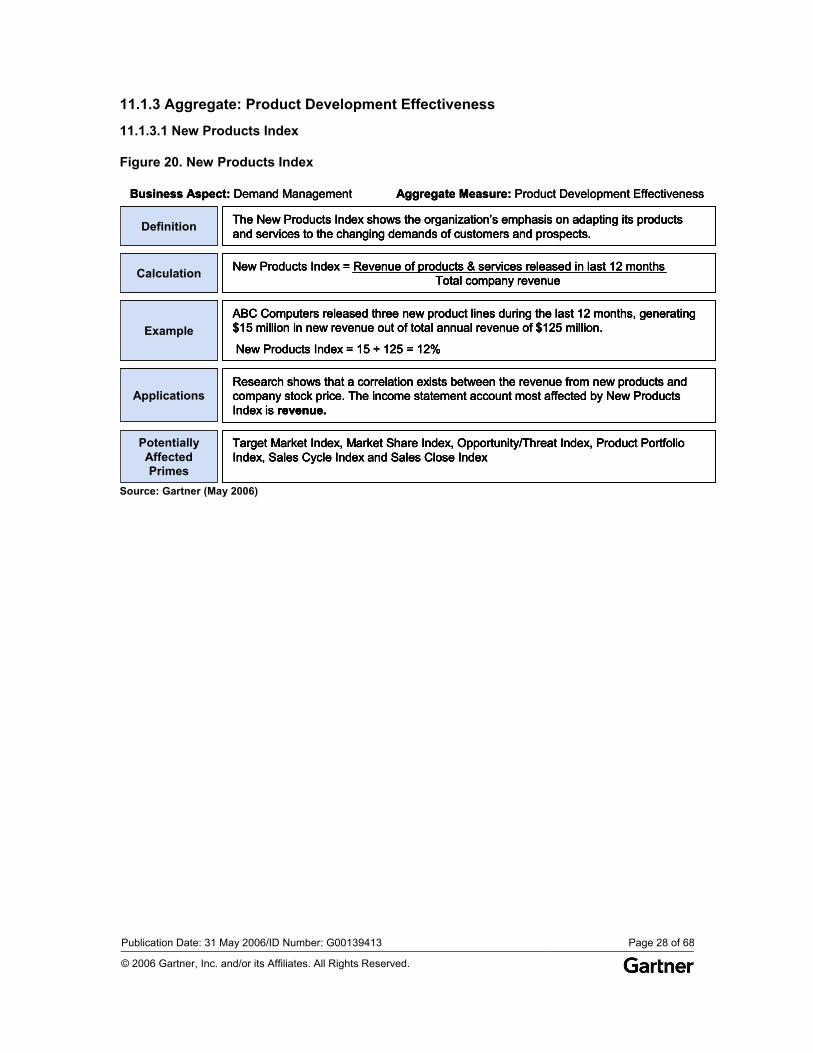
Publication Date: 31 May 2006/ID Number: G00139413 Page 28 of 68
© 2006 Gartner, Inc. and/or its Affiliates. All Rights Reserved.
11.1.3 Aggregate: Product Development Effectiveness
11.1.3.1 New Products Index
Figure 20. New Products Index
Definition The New Products Index shows the organization’s emphasis on adapting its products and services to the changing demands of customers and prospects.
Calculation New Products Index = Revenue of products & services released in last 12 monthsTotal company revenue
ExampleABC Computers released three new product lines during the last 12 months, generating $15 million in new revenue out of total annual revenue of $125 million.
New Products Index = 15 ÷ 125 = 12%
ApplicationsResearch shows that a correlation exists between the revenue from new products and company stock price. The income statement account most affected by New Products Index is revenue.
PotentiallyAffectedPrimes
Target Market Index, Market Share Index, Opportunity/Threat Index, Product Portfolio Index, Sales Cycle Index and Sales Close Index
Business Aspect: Demand Management Aggregate Measure: Product Development Effectiveness
Definition The New Products Index shows the organization’s emphasis on adapting its products and services to the changing demands of customers and prospects.DefinitionDefinition The New Products Index shows the organization’s emphasis on adapting its products and services to the changing demands of customers and prospects.
Calculation New Products Index = Revenue of products & services released in last 12 monthsTotal company revenueCalculationCalculation New Products Index = Revenue of products & services released in last 12 monthsTotal company revenue
ExampleABC Computers released three new product lines during the last 12 months, generating $15 million in new revenue out of total annual revenue of $125 million.
New Products Index = 15 ÷ 125 = 12%ExampleExample
ABC Computers released three new product lines during the last 12 months, generating $15 million in new revenue out of total annual revenue of $125 million.
New Products Index = 15 ÷ 125 = 12%
ApplicationsResearch shows that a correlation exists between the revenue from new products and company stock price. The income statement account most affected by New Products Index is revenue.
ApplicationsApplicationsResearch shows that a correlation exists between the revenue from new products and company stock price. The income statement account most affected by New Products Index is revenue.
PotentiallyAffectedPrimes
Target Market Index, Market Share Index, Opportunity/Threat Index, Product Portfolio Index, Sales Cycle Index and Sales Close Index
PotentiallyAffectedPrimes
PotentiallyAffectedPrimes
Target Market Index, Market Share Index, Opportunity/Threat Index, Product Portfolio Index, Sales Cycle Index and Sales Close Index
Business Aspect: Demand Management Aggregate Measure: Product Development Effectiveness
Source: Gartner (May 2006)
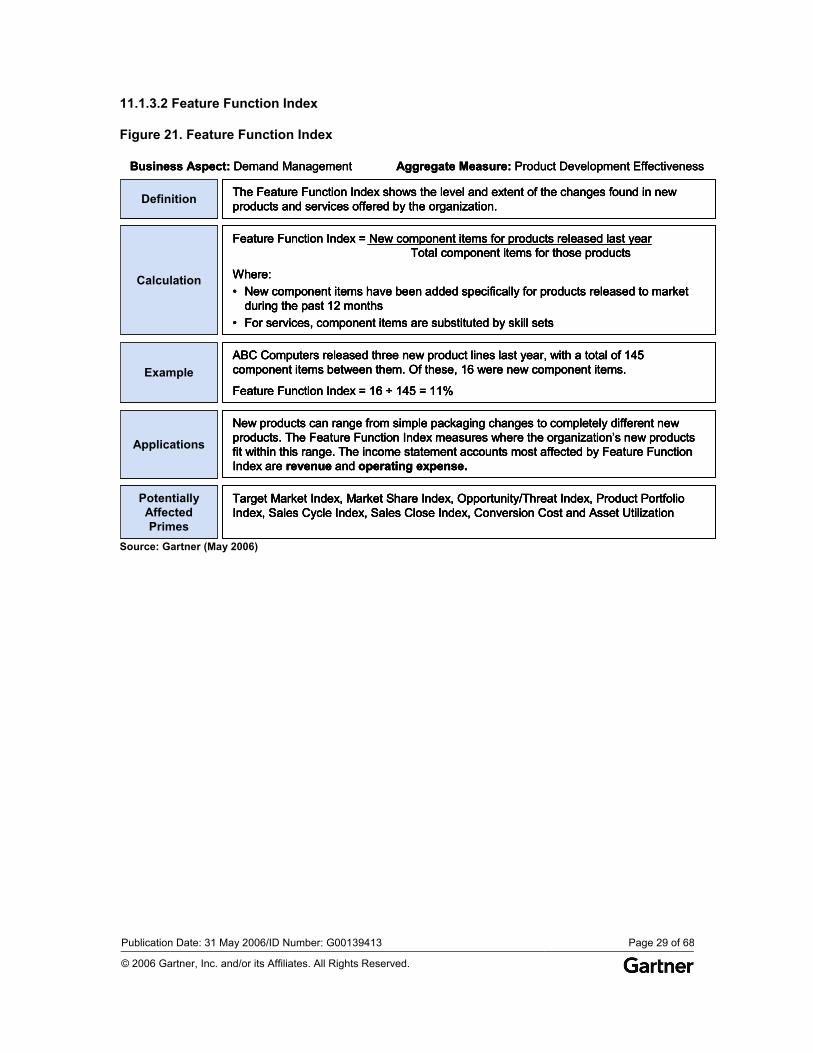
Publication Date: 31 May 2006/ID Number: G00139413 Page 29 of 68
© 2006 Gartner, Inc. and/or its Affiliates. All Rights Reserved.
11.1.3.2 Feature Function Index
Figure 21. Feature Function Index
Business Aspect: Demand Management Aggregate Measure: Product Development Effectiveness
Definition The Feature Function Index shows the level and extent of the changes found in new products and services offered by the organization.
Calculation
Feature Function Index = New component items for products released last yearTotal component items for those products
Where:• New component items have been added specifically for products released to market
during the past 12 months• For services, component items are substituted by skill sets
ExampleABC Computers released three new product lines last year, with a total of 145 component items between them. Of these, 16 were new component items.
Feature Function Index = 16 ÷ 145 = 11%
Applications
New products can range from simple packaging changes to completely different new products. The Feature Function Index measures where the organization’s new products fit within this range. The income statement accounts most affected by Feature Function Index are revenue and operating expense.
PotentiallyAffectedPrimes
Target Market Index, Market Share Index, Opportunity/Threat Index, Product Portfolio Index, Sales Cycle Index, Sales Close Index, Conversion Cost and Asset Utilization
Business Aspect: Demand Management Aggregate Measure: Product Development Effectiveness
Definition The Feature Function Index shows the level and extent of the changes found in new products and services offered by the organization. DefinitionDefinition The Feature Function Index shows the level and extent of the changes found in new products and services offered by the organization.
Calculation
Feature Function Index = New component items for products released last yearTotal component items for those products
Where:• New component items have been added specifically for products released to market
during the past 12 months• For services, component items are substituted by skill sets
CalculationCalculation
Feature Function Index = New component items for products released last yearTotal component items for those products
Where:• New component items have been added specifically for products released to market
during the past 12 months• For services, component items are substituted by skill sets
ExampleABC Computers released three new product lines last year, with a total of 145 component items between them. Of these, 16 were new component items.
Feature Function Index = 16 ÷ 145 = 11% ExampleExample
ABC Computers released three new product lines last year, with a total of 145 component items between them. Of these, 16 were new component items.
Feature Function Index = 16 ÷ 145 = 11%
Applications
New products can range from simple packaging changes to completely different new products. The Feature Function Index measures where the organization’s new products fit within this range. The income statement accounts most affected by Feature Function Index are revenue and operating expense.
ApplicationsApplications
New products can range from simple packaging changes to completely different new products. The Feature Function Index measures where the organization’s new products fit within this range. The income statement accounts most affected by Feature Function Index are revenue and operating expense.
PotentiallyAffectedPrimes
Target Market Index, Market Share Index, Opportunity/Threat Index, Product Portfolio Index, Sales Cycle Index, Sales Close Index, Conversion Cost and Asset Utilization
PotentiallyAffectedPrimes
PotentiallyAffectedPrimes
Target Market Index, Market Share Index, Opportunity/Threat Index, Product Portfolio Index, Sales Cycle Index, Sales Close Index, Conversion Cost and Asset Utilization
Source: Gartner (May 2006)
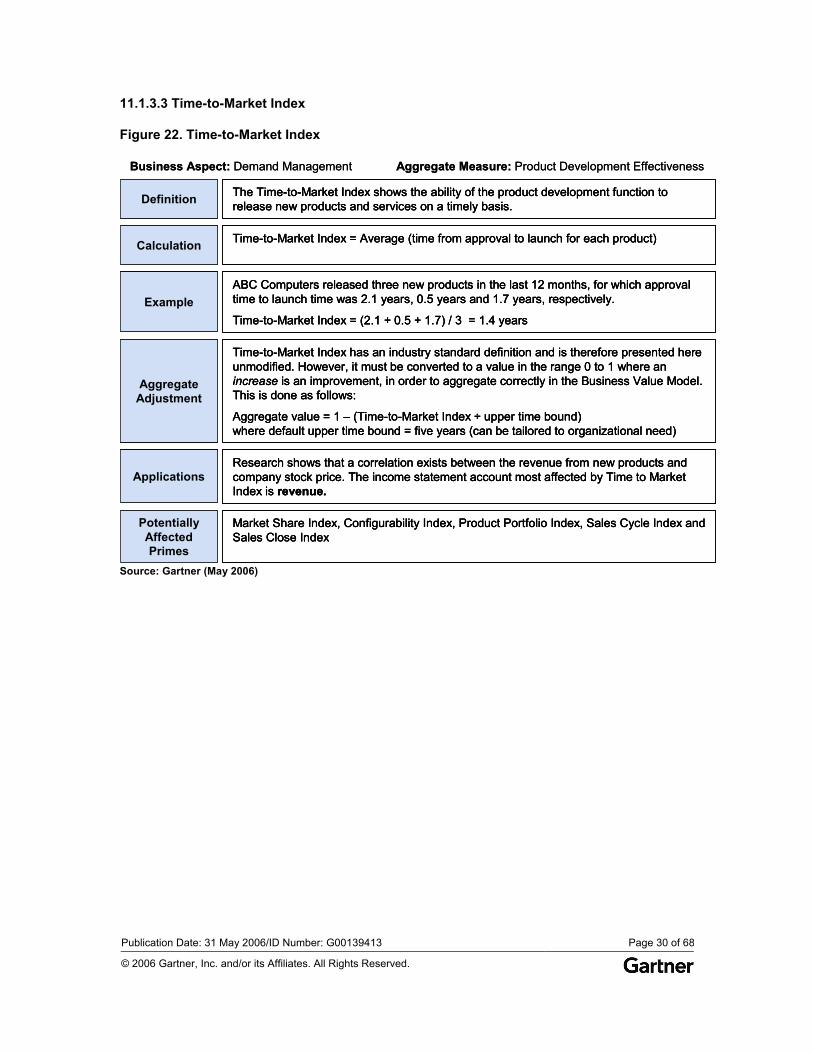
Publication Date: 31 May 2006/ID Number: G00139413 Page 30 of 68
© 2006 Gartner, Inc. and/or its Affiliates. All Rights Reserved.
11.1.3.3 Time-to-Market Index
Figure 22. Time-to-Market Index
Business Aspect: Demand Management Aggregate Measure: Product Development Effectiveness
Definition The Time-to-Market Index shows the ability of the product development function to release new products and services on a timely basis.
Calculation Time-to-Market Index = Average (time from approval to launch for each product)
ExampleABC Computers released three new products in the last 12 months, for which approval time to launch time was 2.1 years, 0.5 years and 1.7 years, respectively.
Time-to-Market Index = (2.1 + 0.5 + 1.7) / 3 = 1.4 years
AggregateAdjustment
Time-to-Market Index has an industry standard definition and is therefore presented here unmodified. However, it must be converted to a value in the range 0 to 1 where an increase is an improvement, in order to aggregate correctly in the Business Value Model. This is done as follows:
Aggregate value = 1 – (Time-to-Market Index ÷ upper time bound) where default upper time bound = five years (can be tailored to organizational need)
PotentiallyAffectedPrimes
Market Share Index, Configurability Index, Product Portfolio Index, Sales Cycle Index and Sales Close Index
ApplicationsResearch shows that a correlation exists between the revenue from new products and company stock price. The income statement account most affected by Time to Market Index is revenue.
Business Aspect: Demand Management Aggregate Measure: Product Development Effectiveness
Definition The Time-to-Market Index shows the ability of the product development function to release new products and services on a timely basis.DefinitionDefinition The Time-to-Market Index shows the ability of the product development function to release new products and services on a timely basis.
Calculation Time-to-Market Index = Average (time from approval to launch for each product)CalculationCalculation Time-to-Market Index = Average (time from approval to launch for each product)
ExampleABC Computers released three new products in the last 12 months, for which approval time to launch time was 2.1 years, 0.5 years and 1.7 years, respectively.
Time-to-Market Index = (2.1 + 0.5 + 1.7) / 3 = 1.4 years ExampleExample
ABC Computers released three new products in the last 12 months, for which approval time to launch time was 2.1 years, 0.5 years and 1.7 years, respectively.
Time-to-Market Index = (2.1 + 0.5 + 1.7) / 3 = 1.4 years
AggregateAdjustment
Time-to-Market Index has an industry standard definition and is therefore presented here unmodified. However, it must be converted to a value in the range 0 to 1 where an increase is an improvement, in order to aggregate correctly in the Business Value Model. This is done as follows:
Aggregate value = 1 – (Time-to-Market Index ÷ upper time bound) where default upper time bound = five years (can be tailored to organizational need)
AggregateAdjustmentAggregate
Adjustment
Time-to-Market Index has an industry standard definition and is therefore presented here unmodified. However, it must be converted to a value in the range 0 to 1 where an increase is an improvement, in order to aggregate correctly in the Business Value Model. This is done as follows:
Aggregate value = 1 – (Time-to-Market Index ÷ upper time bound) where default upper time bound = five years (can be tailored to organizational need)
PotentiallyAffectedPrimes
Market Share Index, Configurability Index, Product Portfolio Index, Sales Cycle Index and Sales Close Index
PotentiallyAffectedPrimes
PotentiallyAffectedPrimes
Market Share Index, Configurability Index, Product Portfolio Index, Sales Cycle Index and Sales Close Index
ApplicationsResearch shows that a correlation exists between the revenue from new products and company stock price. The income statement account most affected by Time to Market Index is revenue.
ApplicationsApplicationsResearch shows that a correlation exists between the revenue from new products and company stock price. The income statement account most affected by Time to Market Index is revenue.
Source: Gartner (May 2006)
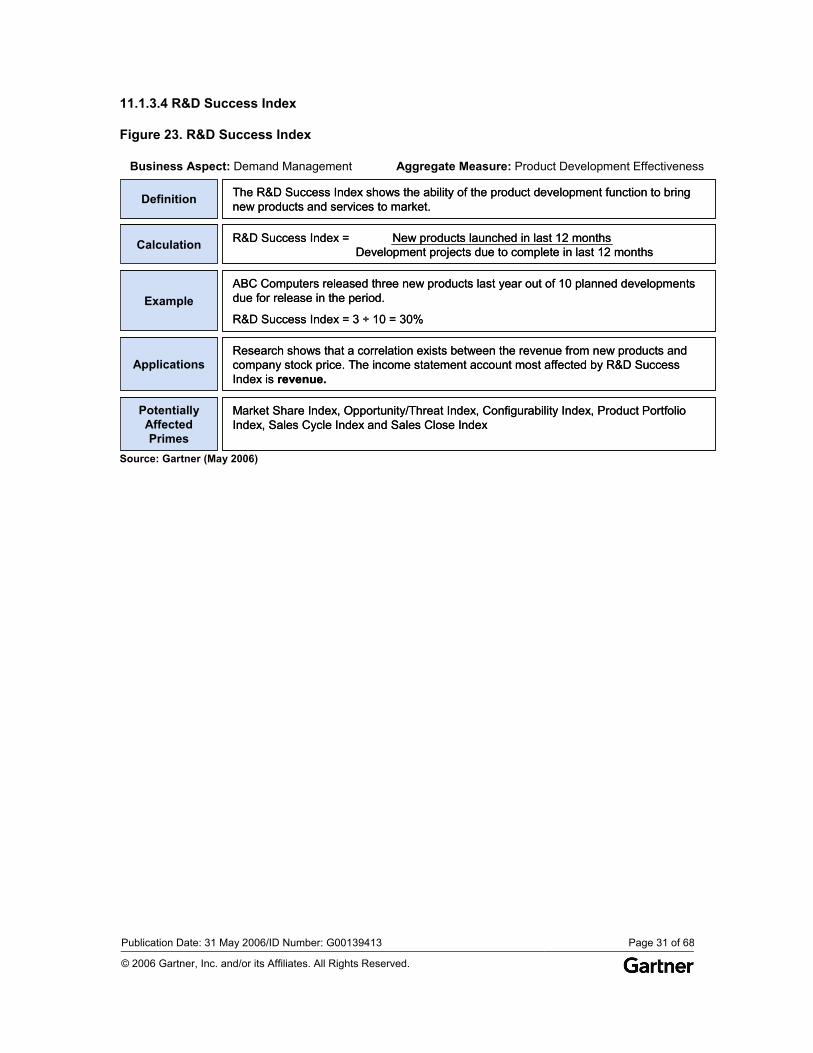
Publication Date: 31 May 2006/ID Number: G00139413 Page 31 of 68
© 2006 Gartner, Inc. and/or its Affiliates. All Rights Reserved.
11.1.3.4 R&D Success Index
Figure 23. R&D Success Index
Definition The R&D Success Index shows the ability of the product development function to bring new products and services to market.DefinitionDefinition The R&D Success Index shows the ability of the product development function to bring new products and services to market.
Calculation R&D Success Index = New products launched in last 12 monthsDevelopment projects due to complete in last 12 monthsCalculationCalculation R&D Success Index = New products launched in last 12 monthsDevelopment projects due to complete in last 12 months
ExampleABC Computers released three new products last year out of 10 planned developments due for release in the period.
R&D Success Index = 3 ÷ 10 = 30% ExampleExample
ABC Computers released three new products last year out of 10 planned developments due for release in the period.
R&D Success Index = 3 ÷ 10 = 30%
ApplicationsResearch shows that a correlation exists between the revenue from new products and company stock price. The income statement account most affected by R&D Success Index is revenue.
ApplicationsApplicationsResearch shows that a correlation exists between the revenue from new products and company stock price. The income statement account most affected by R&D Success Index is revenue.
PotentiallyAffectedPrimes
Market Share Index, Opportunity/Threat Index, Configurability Index, Product Portfolio Index, Sales Cycle Index and Sales Close Index
PotentiallyAffectedPrimes
PotentiallyAffectedPrimes
Market Share Index, Opportunity/Threat Index, Configurability Index, Product Portfolio Index, Sales Cycle Index and Sales Close Index
Business Aspect: Demand Management Aggregate Measure: Product Development Effectiveness
Source: Gartner (May 2006)
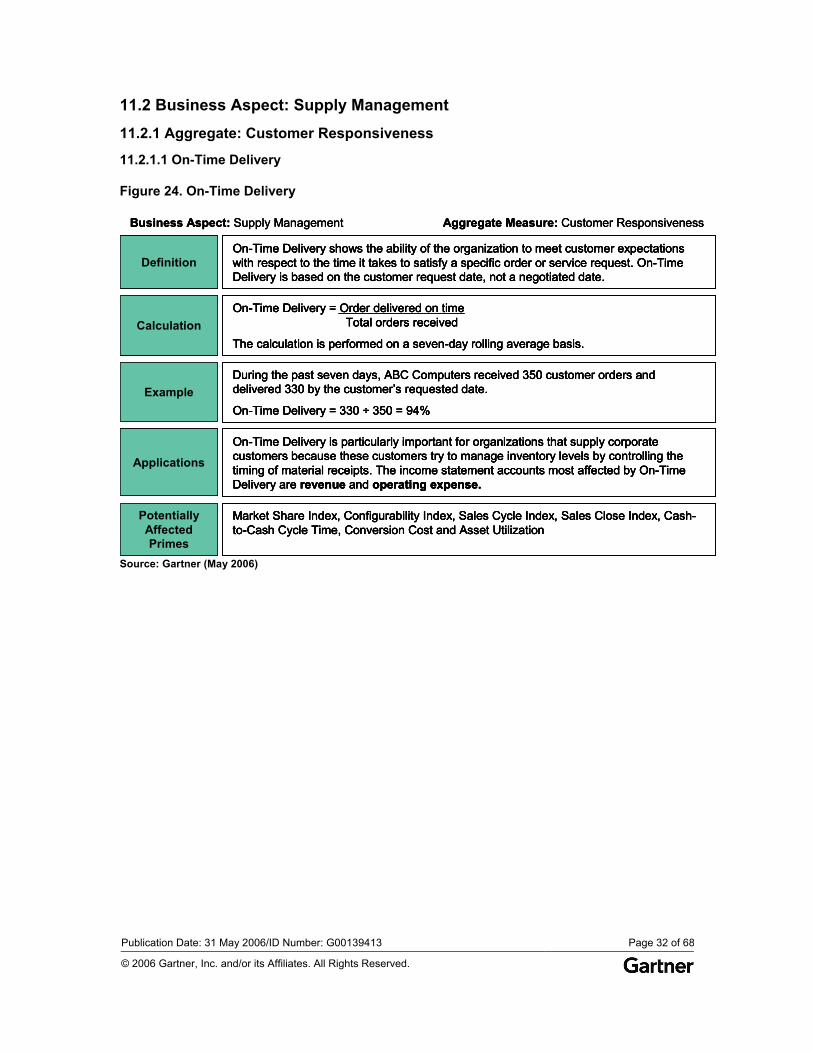
Publication Date: 31 May 2006/ID Number: G00139413 Page 32 of 68
© 2006 Gartner, Inc. and/or its Affiliates. All Rights Reserved.
11.2 Business Aspect: Supply Management
11.2.1 Aggregate: Customer Responsiveness
11.2.1.1 On-Time Delivery
Figure 24. On-Time Delivery
DefinitionOn-Time Delivery shows the ability of the organization to meet customer expectations with respect to the time it takes to satisfy a specific order or service request. On-Time Delivery is based on the customer request date, not a negotiated date.
CalculationOn-Time Delivery = Order delivered on time
Total orders received
The calculation is performed on a seven-day rolling average basis.
ExampleDuring the past seven days, ABC Computers received 350 customer orders and delivered 330 by the customer’s requested date.
On-Time Delivery = 330 ÷ 350 = 94%
Applications
On-Time Delivery is particularly important for organizations that supply corporate customers because these customers try to manage inventory levels by controlling the timing of material receipts. The income statement accounts most affected by On-Time Delivery are revenue and operating expense.
PotentiallyAffectedPrimes
Market Share Index, Configurability Index, Sales Cycle Index, Sales Close Index, Cash-to-Cash Cycle Time, Conversion Cost and Asset Utilization
Business Aspect: Supply Management Aggregate Measure: Customer Responsiveness
DefinitionOn-Time Delivery shows the ability of the organization to meet customer expectations with respect to the time it takes to satisfy a specific order or service request. On-Time Delivery is based on the customer request date, not a negotiated date.
DefinitionDefinitionOn-Time Delivery shows the ability of the organization to meet customer expectations with respect to the time it takes to satisfy a specific order or service request. On-Time Delivery is based on the customer request date, not a negotiated date.
CalculationOn-Time Delivery = Order delivered on time
Total orders received
The calculation is performed on a seven-day rolling average basis. CalculationCalculation
On-Time Delivery = Order delivered on timeTotal orders received
The calculation is performed on a seven-day rolling average basis.
ExampleDuring the past seven days, ABC Computers received 350 customer orders and delivered 330 by the customer’s requested date.
On-Time Delivery = 330 ÷ 350 = 94% ExampleExample
During the past seven days, ABC Computers received 350 customer orders and delivered 330 by the customer’s requested date.
On-Time Delivery = 330 ÷ 350 = 94%
Applications
On-Time Delivery is particularly important for organizations that supply corporate customers because these customers try to manage inventory levels by controlling the timing of material receipts. The income statement accounts most affected by On-Time Delivery are revenue and operating expense.
ApplicationsApplications
On-Time Delivery is particularly important for organizations that supply corporate customers because these customers try to manage inventory levels by controlling the timing of material receipts. The income statement accounts most affected by On-Time Delivery are revenue and operating expense.
PotentiallyAffectedPrimes
Market Share Index, Configurability Index, Sales Cycle Index, Sales Close Index, Cash-to-Cash Cycle Time, Conversion Cost and Asset Utilization
PotentiallyAffectedPrimes
PotentiallyAffectedPrimes
Market Share Index, Configurability Index, Sales Cycle Index, Sales Close Index, Cash-to-Cash Cycle Time, Conversion Cost and Asset Utilization
Business Aspect: Supply Management Aggregate Measure: Customer Responsiveness
Source: Gartner (May 2006)
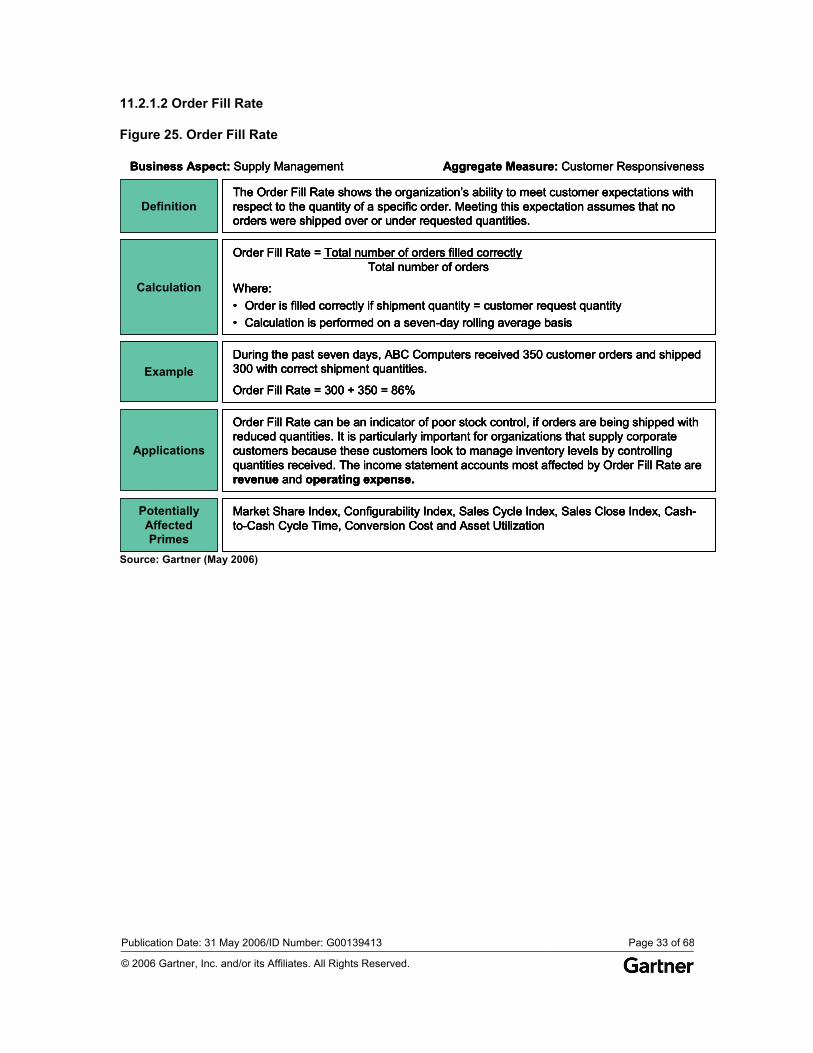
Publication Date: 31 May 2006/ID Number: G00139413 Page 33 of 68
© 2006 Gartner, Inc. and/or its Affiliates. All Rights Reserved.
11.2.1.2 Order Fill Rate
Figure 25. Order Fill Rate
DefinitionThe Order Fill Rate shows the organization’s ability to meet customer expectations with respect to the quantity of a specific order. Meeting this expectation assumes that no orders were shipped over or under requested quantities.
Calculation
Order Fill Rate = Total number of orders filled correctlyTotal number of orders
Where:• Order is filled correctly if shipment quantity = customer request quantity• Calculation is performed on a seven-day rolling average basis
ExampleDuring the past seven days, ABC Computers received 350 customer orders and shipped 300 with correct shipment quantities.
Order Fill Rate = 300 ÷ 350 = 86%
Applications
Order Fill Rate can be an indicator of poor stock control, if orders are being shipped with reduced quantities. It is particularly important for organizations that supply corporate customers because these customers look to manage inventory levels by controlling quantities received. The income statement accounts most affected by Order Fill Rate are revenue and operating expense.
PotentiallyAffectedPrimes
Market Share Index, Configurability Index, Sales Cycle Index, Sales Close Index, Cash-to-Cash Cycle Time, Conversion Cost and Asset Utilization
Business Aspect: Supply Management Aggregate Measure: Customer Responsiveness
DefinitionThe Order Fill Rate shows the organization’s ability to meet customer expectations with respect to the quantity of a specific order. Meeting this expectation assumes that no orders were shipped over or under requested quantities.
DefinitionDefinitionThe Order Fill Rate shows the organization’s ability to meet customer expectations with respect to the quantity of a specific order. Meeting this expectation assumes that no orders were shipped over or under requested quantities.
Calculation
Order Fill Rate = Total number of orders filled correctlyTotal number of orders
Where:• Order is filled correctly if shipment quantity = customer request quantity• Calculation is performed on a seven-day rolling average basis
CalculationCalculation
Order Fill Rate = Total number of orders filled correctlyTotal number of orders
Where:• Order is filled correctly if shipment quantity = customer request quantity• Calculation is performed on a seven-day rolling average basis
ExampleDuring the past seven days, ABC Computers received 350 customer orders and shipped 300 with correct shipment quantities.
Order Fill Rate = 300 ÷ 350 = 86% ExampleExample
During the past seven days, ABC Computers received 350 customer orders and shipped 300 with correct shipment quantities.
Order Fill Rate = 300 ÷ 350 = 86%
Applications
Order Fill Rate can be an indicator of poor stock control, if orders are being shipped with reduced quantities. It is particularly important for organizations that supply corporate customers because these customers look to manage inventory levels by controlling quantities received. The income statement accounts most affected by Order Fill Rate are revenue and operating expense.
ApplicationsApplications
Order Fill Rate can be an indicator of poor stock control, if orders are being shipped with reduced quantities. It is particularly important for organizations that supply corporate customers because these customers look to manage inventory levels by controlling quantities received. The income statement accounts most affected by Order Fill Rate are revenue and operating expense.
PotentiallyAffectedPrimes
Market Share Index, Configurability Index, Sales Cycle Index, Sales Close Index, Cash-to-Cash Cycle Time, Conversion Cost and Asset Utilization
PotentiallyAffectedPrimes
PotentiallyAffectedPrimes
Market Share Index, Configurability Index, Sales Cycle Index, Sales Close Index, Cash-to-Cash Cycle Time, Conversion Cost and Asset Utilization
Business Aspect: Supply Management Aggregate Measure: Customer Responsiveness
Source: Gartner (May 2006)
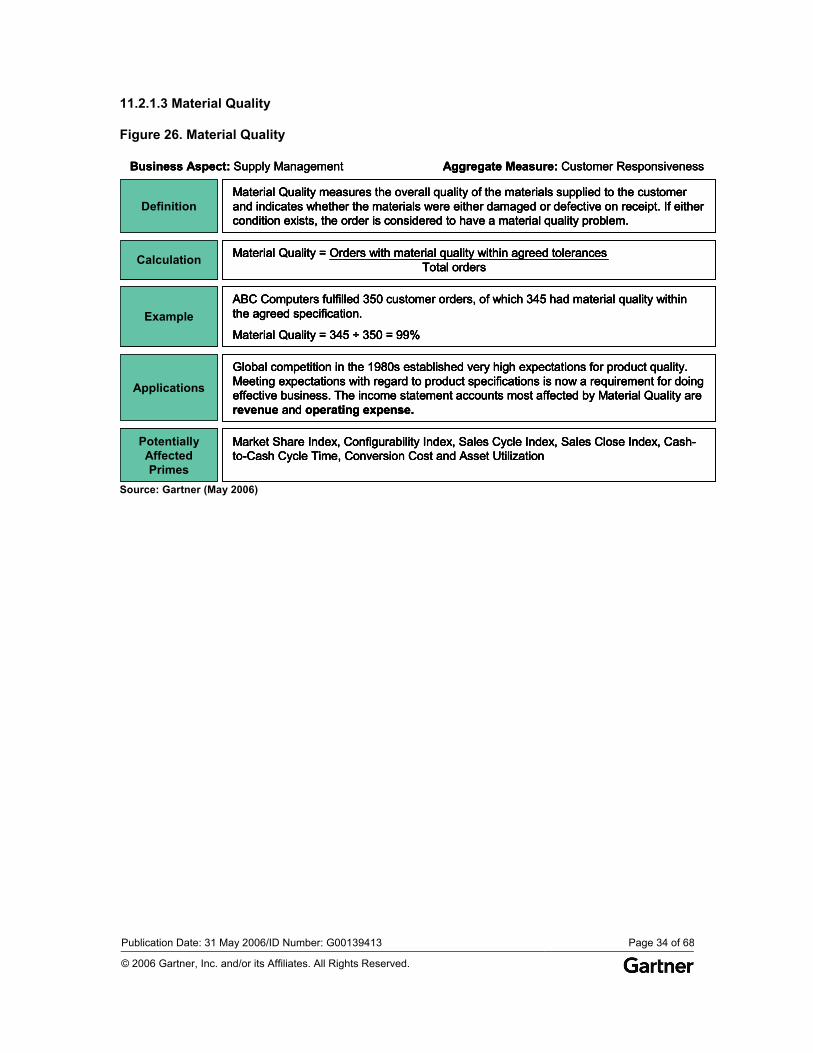
Publication Date: 31 May 2006/ID Number: G00139413 Page 34 of 68
© 2006 Gartner, Inc. and/or its Affiliates. All Rights Reserved.
11.2.1.3 Material Quality
Figure 26. Material Quality
DefinitionMaterial Quality measures the overall quality of the materials supplied to the customer and indicates whether the materials were either damaged or defective on receipt. If either condition exists, the order is considered to have a material quality problem.
Calculation Material Quality = Orders with material quality within agreed tolerancesTotal orders
ExampleABC Computers fulfilled 350 customer orders, of which 345 had material quality within the agreed specification.
Material Quality = 345 ÷ 350 = 99%
Applications
Global competition in the 1980s established very high expectations for product quality. Meeting expectations with regard to product specifications is now a requirement for doing effective business. The income statement accounts most affected by Material Quality are revenue and operating expense.
PotentiallyAffectedPrimes
Market Share Index, Configurability Index, Sales Cycle Index, Sales Close Index, Cash-to-Cash Cycle Time, Conversion Cost and Asset Utilization
Business Aspect: Supply Management Aggregate Measure: Customer Responsiveness
DefinitionMaterial Quality measures the overall quality of the materials supplied to the customer and indicates whether the materials were either damaged or defective on receipt. If either condition exists, the order is considered to have a material quality problem.
DefinitionDefinitionMaterial Quality measures the overall quality of the materials supplied to the customer and indicates whether the materials were either damaged or defective on receipt. If either condition exists, the order is considered to have a material quality problem.
Calculation Material Quality = Orders with material quality within agreed tolerancesTotal orders CalculationCalculation Material Quality = Orders with material quality within agreed tolerancesTotal orders
ExampleABC Computers fulfilled 350 customer orders, of which 345 had material quality within the agreed specification.
Material Quality = 345 ÷ 350 = 99% ExampleExample
ABC Computers fulfilled 350 customer orders, of which 345 had material quality within the agreed specification.
Material Quality = 345 ÷ 350 = 99%
Applications
Global competition in the 1980s established very high expectations for product quality. Meeting expectations with regard to product specifications is now a requirement for doing effective business. The income statement accounts most affected by Material Quality are revenue and operating expense.
ApplicationsApplications
Global competition in the 1980s established very high expectations for product quality. Meeting expectations with regard to product specifications is now a requirement for doing effective business. The income statement accounts most affected by Material Quality are revenue and operating expense.
PotentiallyAffectedPrimes
Market Share Index, Configurability Index, Sales Cycle Index, Sales Close Index, Cash-to-Cash Cycle Time, Conversion Cost and Asset Utilization
PotentiallyAffectedPrimes
PotentiallyAffectedPrimes
Market Share Index, Configurability Index, Sales Cycle Index, Sales Close Index, Cash-to-Cash Cycle Time, Conversion Cost and Asset Utilization
Business Aspect: Supply Management Aggregate Measure: Customer Responsiveness
Source: Gartner (May 2006)
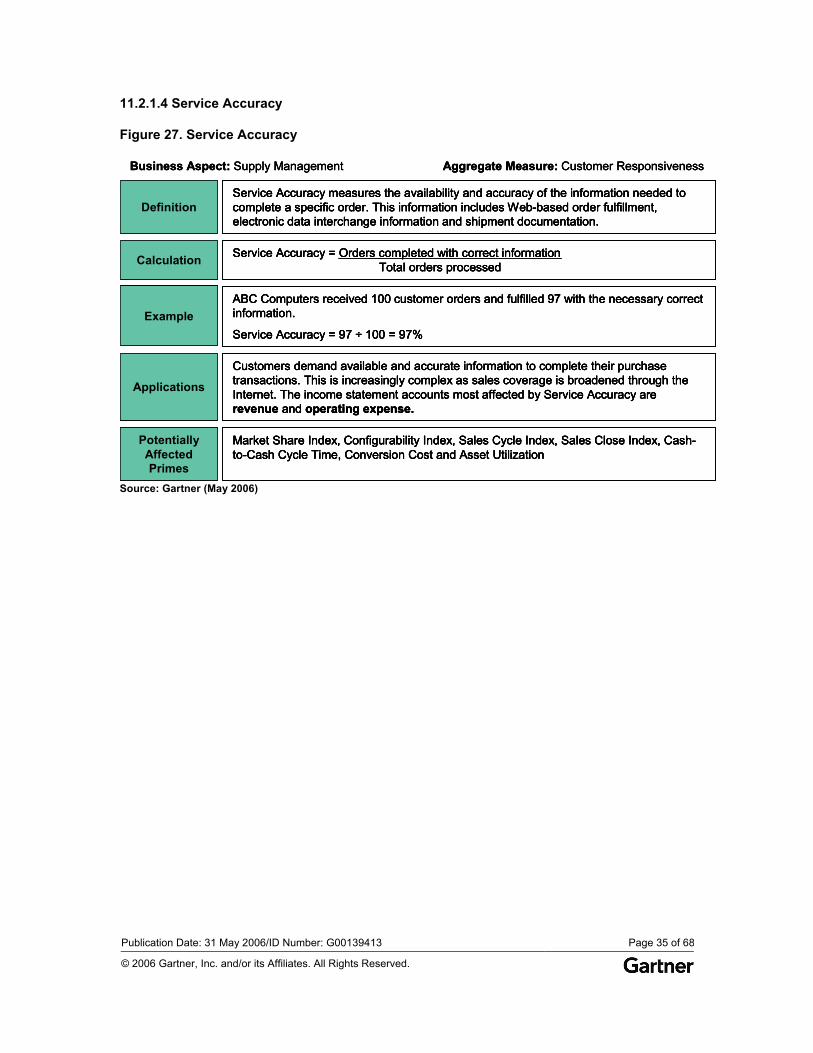
Publication Date: 31 May 2006/ID Number: G00139413 Page 35 of 68
© 2006 Gartner, Inc. and/or its Affiliates. All Rights Reserved.
11.2.1.4 Service Accuracy
Figure 27. Service Accuracy
DefinitionService Accuracy measures the availability and accuracy of the information needed to complete a specific order. This information includes Web-based order fulfillment, electronic data interchange information and shipment documentation.
Calculation Service Accuracy = Orders completed with correct informationTotal orders processed
ExampleABC Computers received 100 customer orders and fulfilled 97 with the necessary correct information.
Service Accuracy = 97 ÷ 100 = 97%
Applications
Customers demand available and accurate information to complete their purchase transactions. This is increasingly complex as sales coverage is broadened through the Internet. The income statement accounts most affected by Service Accuracy are revenue and operating expense.
PotentiallyAffectedPrimes
Market Share Index, Configurability Index, Sales Cycle Index, Sales Close Index, Cash-to-Cash Cycle Time, Conversion Cost and Asset Utilization
Business Aspect: Supply Management Aggregate Measure: Customer Responsiveness
DefinitionService Accuracy measures the availability and accuracy of the information needed to complete a specific order. This information includes Web-based order fulfillment, electronic data interchange information and shipment documentation.
DefinitionDefinitionService Accuracy measures the availability and accuracy of the information needed to complete a specific order. This information includes Web-based order fulfillment, electronic data interchange information and shipment documentation.
Calculation Service Accuracy = Orders completed with correct informationTotal orders processed CalculationCalculation Service Accuracy = Orders completed with correct informationTotal orders processed
ExampleABC Computers received 100 customer orders and fulfilled 97 with the necessary correct information.
Service Accuracy = 97 ÷ 100 = 97% ExampleExample
ABC Computers received 100 customer orders and fulfilled 97 with the necessary correct information.
Service Accuracy = 97 ÷ 100 = 97%
Applications
Customers demand available and accurate information to complete their purchase transactions. This is increasingly complex as sales coverage is broadened through the Internet. The income statement accounts most affected by Service Accuracy are revenue and operating expense.
ApplicationsApplications
Customers demand available and accurate information to complete their purchase transactions. This is increasingly complex as sales coverage is broadened through the Internet. The income statement accounts most affected by Service Accuracy are revenue and operating expense.
PotentiallyAffectedPrimes
Market Share Index, Configurability Index, Sales Cycle Index, Sales Close Index, Cash-to-Cash Cycle Time, Conversion Cost and Asset Utilization
PotentiallyAffectedPrimes
PotentiallyAffectedPrimes
Market Share Index, Configurability Index, Sales Cycle Index, Sales Close Index, Cash-to-Cash Cycle Time, Conversion Cost and Asset Utilization
Business Aspect: Supply Management Aggregate Measure: Customer Responsiveness
Source: Gartner (May 2006)
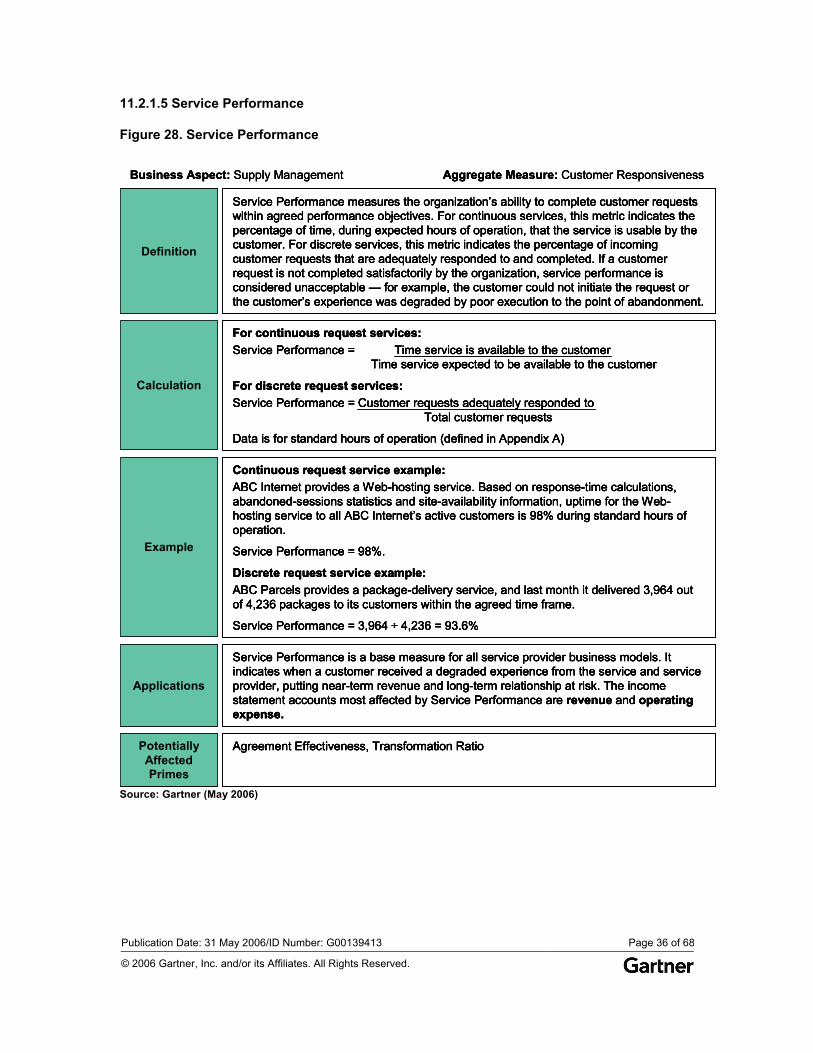
Publication Date: 31 May 2006/ID Number: G00139413 Page 36 of 68
© 2006 Gartner, Inc. and/or its Affiliates. All Rights Reserved.
11.2.1.5 Service Performance
Figure 28. Service Performance
Definition
Service Performance measures the organization’s ability to complete customer requests within agreed performance objectives. For continuous services, this metric indicates the percentage of time, during expected hours of operation, that the service is usable by the customer. For discrete services, this metric indicates the percentage of incoming customer requests that are adequately responded to and completed. If a customer request is not completed satisfactorily by the organization, service performance is considered unacceptable — for example, the customer could not initiate the request or the customer’s experience was degraded by poor execution to the point of abandonment.
Calculation
For continuous request services:Service Performance = Time service is available to the customer
Time service expected to be available to the customer
For discrete request services:Service Performance = Customer requests adequately responded to
Total customer requests
Data is for standard hours of operation (defined in Appendix A)
Example
Continuous request service example:ABC Internet provides a Web-hosting service. Based on response-time calculations, abandoned-sessions statistics and site-availability information, uptime for the Web-hosting service to all ABC Internet’s active customers is 98% during standard hours of operation.
Service Performance = 98%.
Discrete request service example:ABC Parcels provides a package-delivery service, and last month it delivered 3,964 out of 4,236 packages to its customers within the agreed time frame.
Service Performance = 3,964 ÷ 4,236 = 93.6%
Applications
Service Performance is a base measure for all service provider business models. It indicates when a customer received a degraded experience from the service and service provider, putting near-term revenue and long-term relationship at risk. The income statement accounts most affected by Service Performance are revenue and operating expense.
PotentiallyAffectedPrimes
Agreement Effectiveness, Transformation Ratio
Business Aspect: Supply Management Aggregate Measure: Customer Responsiveness
Definition
Service Performance measures the organization’s ability to complete customer requests within agreed performance objectives. For continuous services, this metric indicates the percentage of time, during expected hours of operation, that the service is usable by the customer. For discrete services, this metric indicates the percentage of incoming customer requests that are adequately responded to and completed. If a customer request is not completed satisfactorily by the organization, service performance is considered unacceptable — for example, the customer could not initiate the request or the customer’s experience was degraded by poor execution to the point of abandonment.
DefinitionDefinition
Service Performance measures the organization’s ability to complete customer requests within agreed performance objectives. For continuous services, this metric indicates the percentage of time, during expected hours of operation, that the service is usable by the customer. For discrete services, this metric indicates the percentage of incoming customer requests that are adequately responded to and completed. If a customer request is not completed satisfactorily by the organization, service performance is considered unacceptable — for example, the customer could not initiate the request or the customer’s experience was degraded by poor execution to the point of abandonment.
Calculation
For continuous request services:Service Performance = Time service is available to the customer
Time service expected to be available to the customer
For discrete request services:Service Performance = Customer requests adequately responded to
Total customer requests
Data is for standard hours of operation (defined in Appendix A)
CalculationCalculation
For continuous request services:Service Performance = Time service is available to the customer
Time service expected to be available to the customer
For discrete request services:Service Performance = Customer requests adequately responded to
Total customer requests
Data is for standard hours of operation (defined in Appendix A)
Example
Continuous request service example:ABC Internet provides a Web-hosting service. Based on response-time calculations, abandoned-sessions statistics and site-availability information, uptime for the Web-hosting service to all ABC Internet’s active customers is 98% during standard hours of operation.
Service Performance = 98%.
Discrete request service example:ABC Parcels provides a package-delivery service, and last month it delivered 3,964 out of 4,236 packages to its customers within the agreed time frame.
Service Performance = 3,964 ÷ 4,236 = 93.6%
ExampleExample
Continuous request service example:ABC Internet provides a Web-hosting service. Based on response-time calculations, abandoned-sessions statistics and site-availability information, uptime for the Web-hosting service to all ABC Internet’s active customers is 98% during standard hours of operation.
Service Performance = 98%.
Discrete request service example:ABC Parcels provides a package-delivery service, and last month it delivered 3,964 out of 4,236 packages to its customers within the agreed time frame.
Service Performance = 3,964 ÷ 4,236 = 93.6%
Applications
Service Performance is a base measure for all service provider business models. It indicates when a customer received a degraded experience from the service and service provider, putting near-term revenue and long-term relationship at risk. The income statement accounts most affected by Service Performance are revenue and operating expense.
ApplicationsApplications
Service Performance is a base measure for all service provider business models. It indicates when a customer received a degraded experience from the service and service provider, putting near-term revenue and long-term relationship at risk. The income statement accounts most affected by Service Performance are revenue and operating expense.
PotentiallyAffectedPrimes
Agreement Effectiveness, Transformation Ratio PotentiallyAffectedPrimes
PotentiallyAffectedPrimes
Agreement Effectiveness, Transformation Ratio
Business Aspect: Supply Management Aggregate Measure: Customer Responsiveness
Source: Gartner (May 2006)
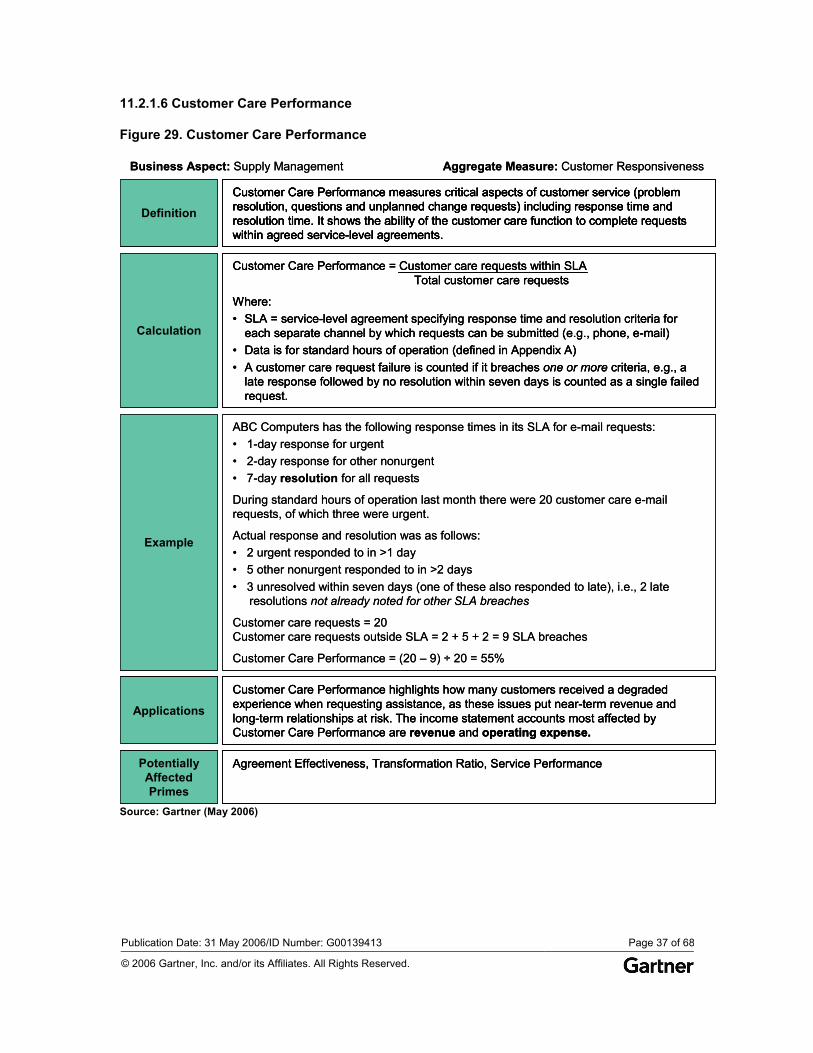
Publication Date: 31 May 2006/ID Number: G00139413 Page 37 of 68
© 2006 Gartner, Inc. and/or its Affiliates. All Rights Reserved.
11.2.1.6 Customer Care Performance
Figure 29. Customer Care Performance
Calculation
Customer Care Performance = Customer care requests within SLATotal customer care requests
Where:• SLA = service-level agreement specifying response time and resolution criteria for
each separate channel by which requests can be submitted (e.g., phone, e-mail)• Data is for standard hours of operation (defined in Appendix A)• A customer care request failure is counted if it breaches one or more criteria, e.g., a
late response followed by no resolution within seven days is counted as a single failed request.
Applications
Customer Care Performance highlights how many customers received a degraded experience when requesting assistance, as these issues put near-term revenue and long-term relationships at risk. The income statement accounts most affected by Customer Care Performance are revenue and operating expense.
PotentiallyAffectedPrimes
Agreement Effectiveness, Transformation Ratio, Service Performance
Business Aspect: Supply Management Aggregate Measure: Customer Responsiveness
Example
ABC Computers has the following response times in its SLA for e-mail requests:• 1-day response for urgent• 2-day response for other nonurgent• 7-day resolution for all requests
During standard hours of operation last month there were 20 customer care e-mail requests, of which three were urgent.
Actual response and resolution was as follows:• 2 urgent responded to in >1 day• 5 other nonurgent responded to in >2 days• 3 unresolved within seven days (one of these also responded to late), i.e., 2 late
resolutions not already noted for other SLA breaches
Customer care requests = 20Customer care requests outside SLA = 2 + 5 + 2 = 9 SLA breaches
Customer Care Performance = (20 – 9) ÷ 20 = 55%
Definition
Customer Care Performance measures critical aspects of customer service (problem resolution, questions and unplanned change requests) including response time and resolution time. It shows the ability of the customer care function to complete requests within agreed service-level agreements.
Calculation
Customer Care Performance = Customer care requests within SLATotal customer care requests
Where:• SLA = service-level agreement specifying response time and resolution criteria for
each separate channel by which requests can be submitted (e.g., phone, e-mail)• Data is for standard hours of operation (defined in Appendix A)• A customer care request failure is counted if it breaches one or more criteria, e.g., a
late response followed by no resolution within seven days is counted as a single failed request.
CalculationCalculation
Customer Care Performance = Customer care requests within SLATotal customer care requests
Where:• SLA = service-level agreement specifying response time and resolution criteria for
each separate channel by which requests can be submitted (e.g., phone, e-mail)• Data is for standard hours of operation (defined in Appendix A)• A customer care request failure is counted if it breaches one or more criteria, e.g., a
late response followed by no resolution within seven days is counted as a single failed request.
Applications
Customer Care Performance highlights how many customers received a degraded experience when requesting assistance, as these issues put near-term revenue and long-term relationships at risk. The income statement accounts most affected by Customer Care Performance are revenue and operating expense.
ApplicationsApplications
Customer Care Performance highlights how many customers received a degraded experience when requesting assistance, as these issues put near-term revenue and long-term relationships at risk. The income statement accounts most affected by Customer Care Performance are revenue and operating expense.
PotentiallyAffectedPrimes
Agreement Effectiveness, Transformation Ratio, Service Performance PotentiallyAffectedPrimes
PotentiallyAffectedPrimes
Agreement Effectiveness, Transformation Ratio, Service Performance
Business Aspect: Supply Management Aggregate Measure: Customer Responsiveness
ExampleExample
ABC Computers has the following response times in its SLA for e-mail requests:• 1-day response for urgent• 2-day response for other nonurgent• 7-day resolution for all requests
During standard hours of operation last month there were 20 customer care e-mail requests, of which three were urgent.
Actual response and resolution was as follows:• 2 urgent responded to in >1 day• 5 other nonurgent responded to in >2 days• 3 unresolved within seven days (one of these also responded to late), i.e., 2 late
resolutions not already noted for other SLA breaches
Customer care requests = 20Customer care requests outside SLA = 2 + 5 + 2 = 9 SLA breaches
Customer Care Performance = (20 – 9) ÷ 20 = 55%
Definition
Customer Care Performance measures critical aspects of customer service (problem resolution, questions and unplanned change requests) including response time and resolution time. It shows the ability of the customer care function to complete requests within agreed service-level agreements.
DefinitionDefinition
Customer Care Performance measures critical aspects of customer service (problem resolution, questions and unplanned change requests) including response time and resolution time. It shows the ability of the customer care function to complete requests within agreed service-level agreements.
Source: Gartner (May 2006)
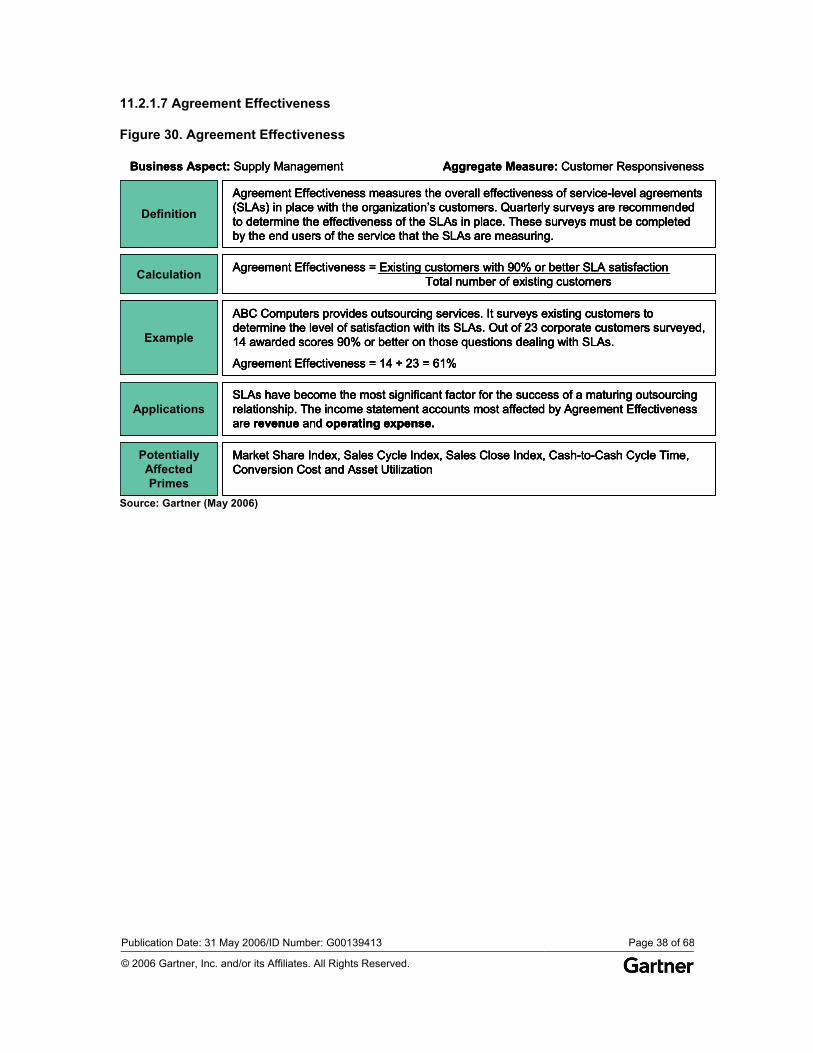
Publication Date: 31 May 2006/ID Number: G00139413 Page 38 of 68
© 2006 Gartner, Inc. and/or its Affiliates. All Rights Reserved.
11.2.1.7 Agreement Effectiveness
Figure 30. Agreement Effectiveness
Example
ABC Computers provides outsourcing services. It surveys existing customers to determine the level of satisfaction with its SLAs. Out of 23 corporate customers surveyed, 14 awarded scores 90% or better on those questions dealing with SLAs.
Agreement Effectiveness = 14 ÷ 23 = 61%
Definition
Agreement Effectiveness measures the overall effectiveness of service-level agreements (SLAs) in place with the organization’s customers. Quarterly surveys are recommended to determine the effectiveness of the SLAs in place. These surveys must be completed by the end users of the service that the SLAs are measuring.
Calculation Agreement Effectiveness = Existing customers with 90% or better SLA satisfactionTotal number of existing customers
ApplicationsSLAs have become the most significant factor for the success of a maturing outsourcing relationship. The income statement accounts most affected by Agreement Effectiveness are revenue and operating expense.
PotentiallyAffectedPrimes
Market Share Index, Sales Cycle Index, Sales Close Index, Cash-to-Cash Cycle Time, Conversion Cost and Asset Utilization
Business Aspect: Supply Management Aggregate Measure: Customer Responsiveness
Example
ABC Computers provides outsourcing services. It surveys existing customers to determine the level of satisfaction with its SLAs. Out of 23 corporate customers surveyed, 14 awarded scores 90% or better on those questions dealing with SLAs.
Agreement Effectiveness = 14 ÷ 23 = 61%
ExampleExample
ABC Computers provides outsourcing services. It surveys existing customers to determine the level of satisfaction with its SLAs. Out of 23 corporate customers surveyed, 14 awarded scores 90% or better on those questions dealing with SLAs.
Agreement Effectiveness = 14 ÷ 23 = 61%
Definition
Agreement Effectiveness measures the overall effectiveness of service-level agreements (SLAs) in place with the organization’s customers. Quarterly surveys are recommended to determine the effectiveness of the SLAs in place. These surveys must be completed by the end users of the service that the SLAs are measuring.
DefinitionDefinition
Agreement Effectiveness measures the overall effectiveness of service-level agreements (SLAs) in place with the organization’s customers. Quarterly surveys are recommended to determine the effectiveness of the SLAs in place. These surveys must be completed by the end users of the service that the SLAs are measuring.
Calculation Agreement Effectiveness = Existing customers with 90% or better SLA satisfactionTotal number of existing customersCalculationCalculation Agreement Effectiveness = Existing customers with 90% or better SLA satisfactionTotal number of existing customers
ApplicationsSLAs have become the most significant factor for the success of a maturing outsourcing relationship. The income statement accounts most affected by Agreement Effectiveness are revenue and operating expense.
ApplicationsApplicationsSLAs have become the most significant factor for the success of a maturing outsourcing relationship. The income statement accounts most affected by Agreement Effectiveness are revenue and operating expense.
PotentiallyAffectedPrimes
Market Share Index, Sales Cycle Index, Sales Close Index, Cash-to-Cash Cycle Time, Conversion Cost and Asset Utilization
PotentiallyAffectedPrimes
PotentiallyAffectedPrimes
Market Share Index, Sales Cycle Index, Sales Close Index, Cash-to-Cash Cycle Time, Conversion Cost and Asset Utilization
Business Aspect: Supply Management Aggregate Measure: Customer Responsiveness
Source: Gartner (May 2006)
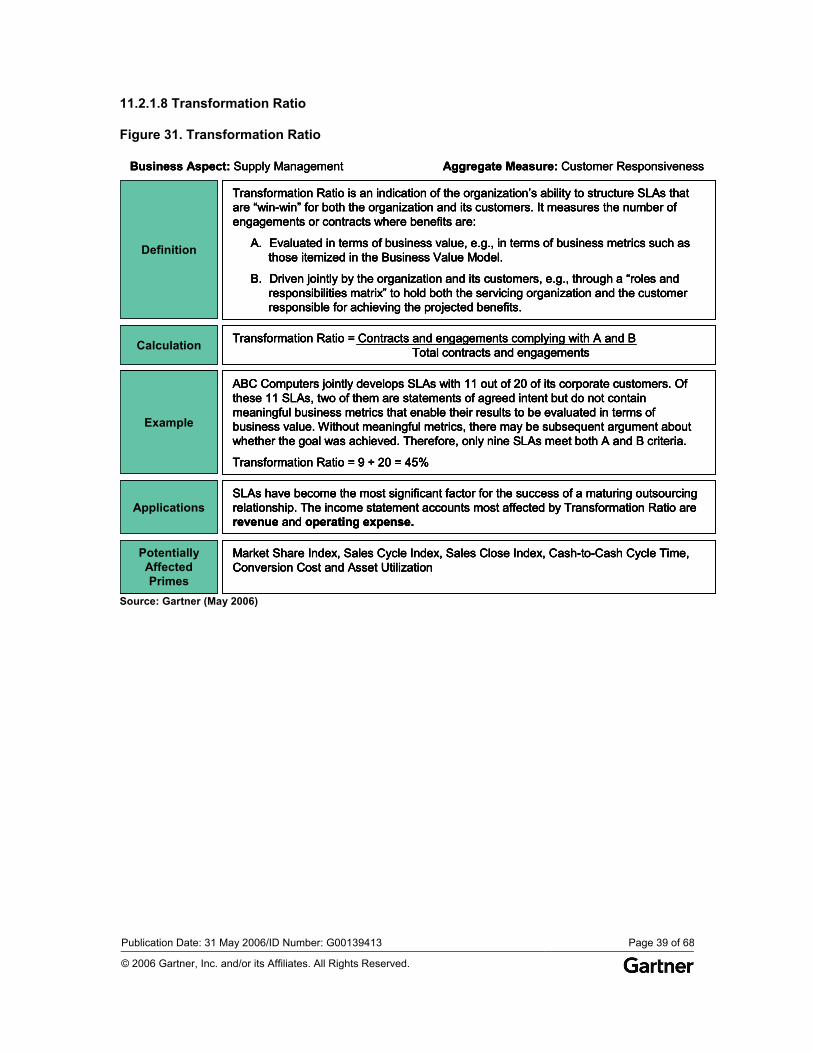
Publication Date: 31 May 2006/ID Number: G00139413 Page 39 of 68
© 2006 Gartner, Inc. and/or its Affiliates. All Rights Reserved.
11.2.1.8 Transformation Ratio
Figure 31. Transformation Ratio
Example
ABC Computers jointly develops SLAs with 11 out of 20 of its corporate customers. Of these 11 SLAs, two of them are statements of agreed intent but do not contain meaningful business metrics that enable their results to be evaluated in terms of business value. Without meaningful metrics, there may be subsequent argument about whether the goal was achieved. Therefore, only nine SLAs meet both A and B criteria.
Transformation Ratio = 9 ÷ 20 = 45%
Definition
Transformation Ratio is an indication of the organization’s ability to structure SLAs that are “win-win” for both the organization and its customers. It measures the number of engagements or contracts where benefits are:
A. Evaluated in terms of business value, e.g., in terms of business metrics such as those itemized in the Business Value Model.
B. Driven jointly by the organization and its customers, e.g., through a “roles and responsibilities matrix” to hold both the servicing organization and the customer responsible for achieving the projected benefits.
Calculation Transformation Ratio = Contracts and engagements complying with A and BTotal contracts and engagements
ApplicationsSLAs have become the most significant factor for the success of a maturing outsourcing relationship. The income statement accounts most affected by Transformation Ratio are revenue and operating expense.
PotentiallyAffectedPrimes
Market Share Index, Sales Cycle Index, Sales Close Index, Cash-to-Cash Cycle Time, Conversion Cost and Asset Utilization
Business Aspect: Supply Management Aggregate Measure: Customer Responsiveness
Example
ABC Computers jointly develops SLAs with 11 out of 20 of its corporate customers. Of these 11 SLAs, two of them are statements of agreed intent but do not contain meaningful business metrics that enable their results to be evaluated in terms of business value. Without meaningful metrics, there may be subsequent argument about whether the goal was achieved. Therefore, only nine SLAs meet both A and B criteria.
Transformation Ratio = 9 ÷ 20 = 45%
ExampleExample
ABC Computers jointly develops SLAs with 11 out of 20 of its corporate customers. Of these 11 SLAs, two of them are statements of agreed intent but do not contain meaningful business metrics that enable their results to be evaluated in terms of business value. Without meaningful metrics, there may be subsequent argument about whether the goal was achieved. Therefore, only nine SLAs meet both A and B criteria.
Transformation Ratio = 9 ÷ 20 = 45%
Definition
Transformation Ratio is an indication of the organization’s ability to structure SLAs that are “win-win” for both the organization and its customers. It measures the number of engagements or contracts where benefits are:
A. Evaluated in terms of business value, e.g., in terms of business metrics such as those itemized in the Business Value Model.
B. Driven jointly by the organization and its customers, e.g., through a “roles and responsibilities matrix” to hold both the servicing organization and the customer responsible for achieving the projected benefits.
DefinitionDefinition
Transformation Ratio is an indication of the organization’s ability to structure SLAs that are “win-win” for both the organization and its customers. It measures the number of engagements or contracts where benefits are:
A. Evaluated in terms of business value, e.g., in terms of business metrics such as those itemized in the Business Value Model.
B. Driven jointly by the organization and its customers, e.g., through a “roles and responsibilities matrix” to hold both the servicing organization and the customer responsible for achieving the projected benefits.
Calculation Transformation Ratio = Contracts and engagements complying with A and BTotal contracts and engagementsCalculationCalculation Transformation Ratio = Contracts and engagements complying with A and BTotal contracts and engagements
ApplicationsSLAs have become the most significant factor for the success of a maturing outsourcing relationship. The income statement accounts most affected by Transformation Ratio are revenue and operating expense.
ApplicationsApplicationsSLAs have become the most significant factor for the success of a maturing outsourcing relationship. The income statement accounts most affected by Transformation Ratio are revenue and operating expense.
PotentiallyAffectedPrimes
Market Share Index, Sales Cycle Index, Sales Close Index, Cash-to-Cash Cycle Time, Conversion Cost and Asset Utilization
PotentiallyAffectedPrimes
PotentiallyAffectedPrimes
Market Share Index, Sales Cycle Index, Sales Close Index, Cash-to-Cash Cycle Time, Conversion Cost and Asset Utilization
Business Aspect: Supply Management Aggregate Measure: Customer Responsiveness
Source: Gartner (May 2006)
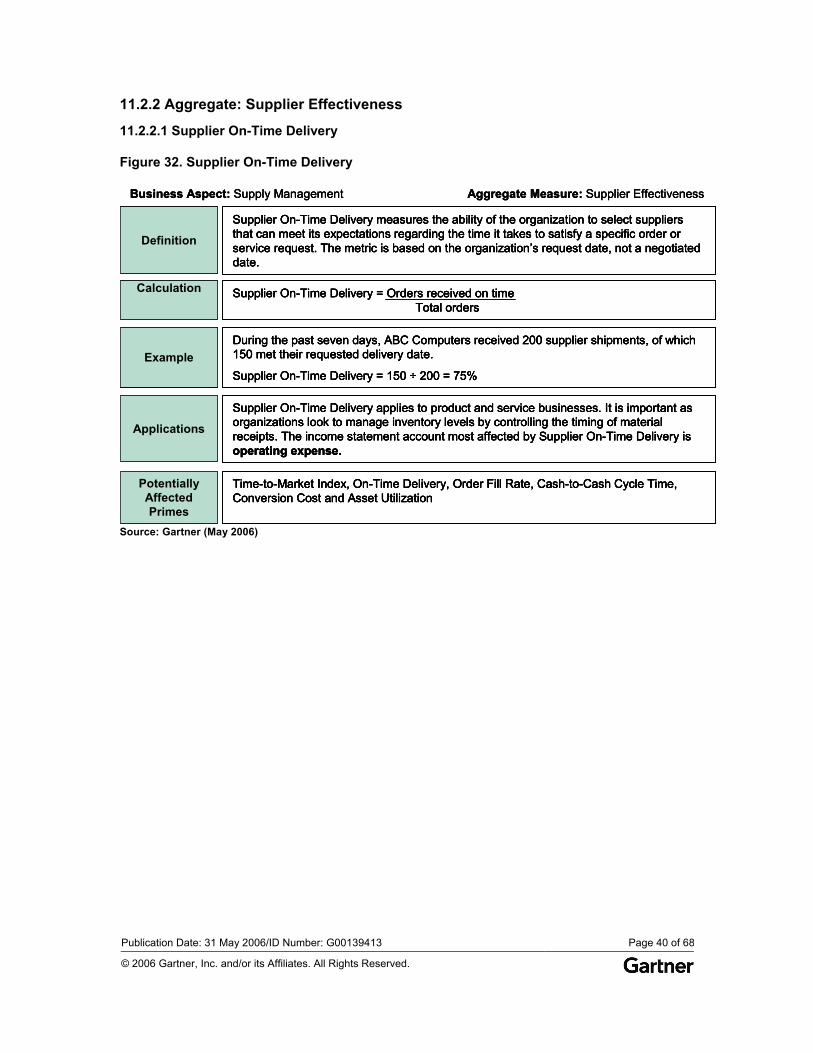
Publication Date: 31 May 2006/ID Number: G00139413 Page 40 of 68
© 2006 Gartner, Inc. and/or its Affiliates. All Rights Reserved.
11.2.2 Aggregate: Supplier Effectiveness
11.2.2.1 Supplier On-Time Delivery
Figure 32. Supplier On-Time Delivery
ExampleDuring the past seven days, ABC Computers received 200 supplier shipments, of which 150 met their requested delivery date.
Supplier On-Time Delivery = 150 ÷ 200 = 75%
Definition
Supplier On-Time Delivery measures the ability of the organization to select suppliers that can meet its expectations regarding the time it takes to satisfy a specific order or service request. The metric is based on the organization’s request date, not a negotiated date.
Calculation Supplier On-Time Delivery = Orders received on timeTotal orders
Applications
Supplier On-Time Delivery applies to product and service businesses. It is important as organizations look to manage inventory levels by controlling the timing of material receipts. The income statement account most affected by Supplier On-Time Delivery is operating expense.
PotentiallyAffectedPrimes
Time-to-Market Index, On-Time Delivery, Order Fill Rate, Cash-to-Cash Cycle Time, Conversion Cost and Asset Utilization
Business Aspect: Supply Management Aggregate Measure: Supplier Effectiveness
ExampleDuring the past seven days, ABC Computers received 200 supplier shipments, of which 150 met their requested delivery date.
Supplier On-Time Delivery = 150 ÷ 200 = 75% ExampleExample
During the past seven days, ABC Computers received 200 supplier shipments, of which 150 met their requested delivery date.
Supplier On-Time Delivery = 150 ÷ 200 = 75%
Definition
Supplier On-Time Delivery measures the ability of the organization to select suppliers that can meet its expectations regarding the time it takes to satisfy a specific order or service request. The metric is based on the organization’s request date, not a negotiated date.
DefinitionDefinition
Supplier On-Time Delivery measures the ability of the organization to select suppliers that can meet its expectations regarding the time it takes to satisfy a specific order or service request. The metric is based on the organization’s request date, not a negotiated date.
Calculation Supplier On-Time Delivery = Orders received on timeTotal orders
CalculationCalculation Supplier On-Time Delivery = Orders received on timeTotal orders
Applications
Supplier On-Time Delivery applies to product and service businesses. It is important as organizations look to manage inventory levels by controlling the timing of material receipts. The income statement account most affected by Supplier On-Time Delivery is operating expense.
ApplicationsApplications
Supplier On-Time Delivery applies to product and service businesses. It is important as organizations look to manage inventory levels by controlling the timing of material receipts. The income statement account most affected by Supplier On-Time Delivery is operating expense.
PotentiallyAffectedPrimes
Time-to-Market Index, On-Time Delivery, Order Fill Rate, Cash-to-Cash Cycle Time, Conversion Cost and Asset Utilization
PotentiallyAffectedPrimes
PotentiallyAffectedPrimes
Time-to-Market Index, On-Time Delivery, Order Fill Rate, Cash-to-Cash Cycle Time, Conversion Cost and Asset Utilization
Business Aspect: Supply Management Aggregate Measure: Supplier Effectiveness
Source: Gartner (May 2006)
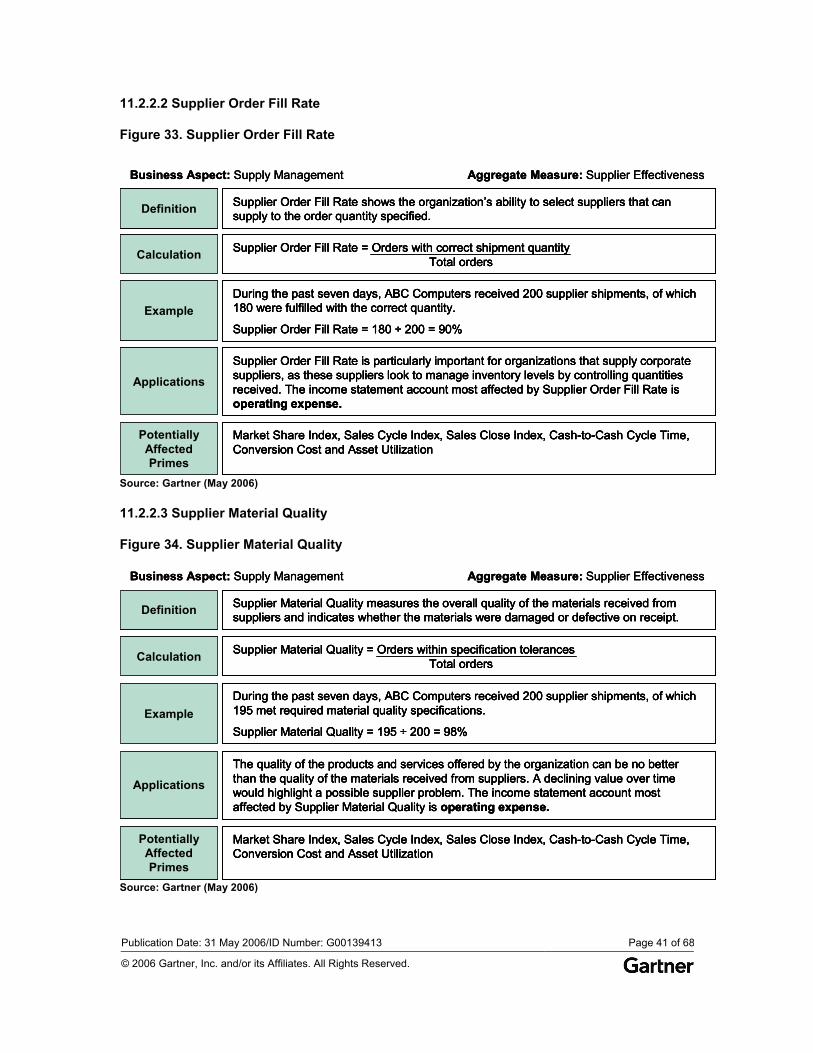
Publication Date: 31 May 2006/ID Number: G00139413 Page 41 of 68
© 2006 Gartner, Inc. and/or its Affiliates. All Rights Reserved.
11.2.2.2 Supplier Order Fill Rate
Figure 33. Supplier Order Fill Rate
ExampleDuring the past seven days, ABC Computers received 200 supplier shipments, of which 180 were fulfilled with the correct quantity.
Supplier Order Fill Rate = 180 ÷ 200 = 90%
Definition Supplier Order Fill Rate shows the organization’s ability to select suppliers that can supply to the order quantity specified.
Calculation Supplier Order Fill Rate = Orders with correct shipment quantityTotal orders
Applications
Supplier Order Fill Rate is particularly important for organizations that supply corporate suppliers, as these suppliers look to manage inventory levels by controlling quantities received. The income statement account most affected by Supplier Order Fill Rate is operating expense.
PotentiallyAffectedPrimes
Market Share Index, Sales Cycle Index, Sales Close Index, Cash-to-Cash Cycle Time, Conversion Cost and Asset Utilization
Business Aspect: Supply Management Aggregate Measure: Supplier Effectiveness
ExampleDuring the past seven days, ABC Computers received 200 supplier shipments, of which 180 were fulfilled with the correct quantity.
Supplier Order Fill Rate = 180 ÷ 200 = 90% ExampleExample
During the past seven days, ABC Computers received 200 supplier shipments, of which 180 were fulfilled with the correct quantity.
Supplier Order Fill Rate = 180 ÷ 200 = 90%
Definition Supplier Order Fill Rate shows the organization’s ability to select suppliers that can supply to the order quantity specified. DefinitionDefinition Supplier Order Fill Rate shows the organization’s ability to select suppliers that can supply to the order quantity specified.
Calculation Supplier Order Fill Rate = Orders with correct shipment quantityTotal ordersCalculationCalculation Supplier Order Fill Rate = Orders with correct shipment quantityTotal orders
Applications
Supplier Order Fill Rate is particularly important for organizations that supply corporate suppliers, as these suppliers look to manage inventory levels by controlling quantities received. The income statement account most affected by Supplier Order Fill Rate is operating expense.
ApplicationsApplications
Supplier Order Fill Rate is particularly important for organizations that supply corporate suppliers, as these suppliers look to manage inventory levels by controlling quantities received. The income statement account most affected by Supplier Order Fill Rate is operating expense.
PotentiallyAffectedPrimes
Market Share Index, Sales Cycle Index, Sales Close Index, Cash-to-Cash Cycle Time, Conversion Cost and Asset Utilization
PotentiallyAffectedPrimes
PotentiallyAffectedPrimes
Market Share Index, Sales Cycle Index, Sales Close Index, Cash-to-Cash Cycle Time, Conversion Cost and Asset Utilization
Business Aspect: Supply Management Aggregate Measure: Supplier Effectiveness
Source: Gartner (May 2006)
11.2.2.3 Supplier Material Quality
Figure 34. Supplier Material Quality
ExampleDuring the past seven days, ABC Computers received 200 supplier shipments, of which 195 met required material quality specifications.
Supplier Material Quality = 195 ÷ 200 = 98%
Definition Supplier Material Quality measures the overall quality of the materials received from suppliers and indicates whether the materials were damaged or defective on receipt.
Calculation Supplier Material Quality = Orders within specification tolerancesTotal orders
Applications
The quality of the products and services offered by the organization can be no better than the quality of the materials received from suppliers. A declining value over time would highlight a possible supplier problem. The income statement account most affected by Supplier Material Quality is operating expense.
PotentiallyAffectedPrimes
Market Share Index, Sales Cycle Index, Sales Close Index, Cash-to-Cash Cycle Time, Conversion Cost and Asset Utilization
Business Aspect: Supply Management Aggregate Measure: Supplier Effectiveness
ExampleDuring the past seven days, ABC Computers received 200 supplier shipments, of which 195 met required material quality specifications.
Supplier Material Quality = 195 ÷ 200 = 98% ExampleExample
During the past seven days, ABC Computers received 200 supplier shipments, of which 195 met required material quality specifications.
Supplier Material Quality = 195 ÷ 200 = 98%
Definition Supplier Material Quality measures the overall quality of the materials received from suppliers and indicates whether the materials were damaged or defective on receipt. DefinitionDefinition Supplier Material Quality measures the overall quality of the materials received from suppliers and indicates whether the materials were damaged or defective on receipt.
Calculation Supplier Material Quality = Orders within specification tolerancesTotal orders CalculationCalculation Supplier Material Quality = Orders within specification tolerancesTotal orders
Applications
The quality of the products and services offered by the organization can be no better than the quality of the materials received from suppliers. A declining value over time would highlight a possible supplier problem. The income statement account most affected by Supplier Material Quality is operating expense.
ApplicationsApplications
The quality of the products and services offered by the organization can be no better than the quality of the materials received from suppliers. A declining value over time would highlight a possible supplier problem. The income statement account most affected by Supplier Material Quality is operating expense.
PotentiallyAffectedPrimes
Market Share Index, Sales Cycle Index, Sales Close Index, Cash-to-Cash Cycle Time, Conversion Cost and Asset Utilization
PotentiallyAffectedPrimes
PotentiallyAffectedPrimes
Market Share Index, Sales Cycle Index, Sales Close Index, Cash-to-Cash Cycle Time, Conversion Cost and Asset Utilization
Business Aspect: Supply Management Aggregate Measure: Supplier Effectiveness
Source: Gartner (May 2006)
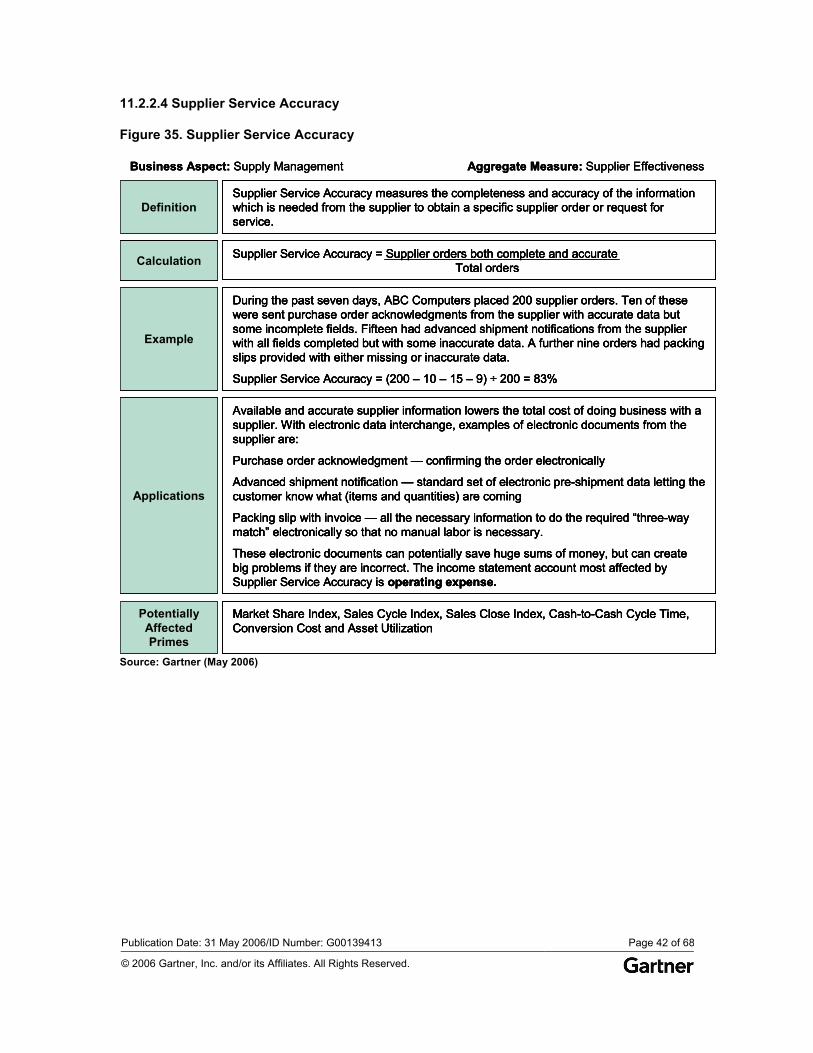
Publication Date: 31 May 2006/ID Number: G00139413 Page 42 of 68
© 2006 Gartner, Inc. and/or its Affiliates. All Rights Reserved.
11.2.2.4 Supplier Service Accuracy
Figure 35. Supplier Service Accuracy
Example
During the past seven days, ABC Computers placed 200 supplier orders. Ten of these were sent purchase order acknowledgments from the supplier with accurate data but some incomplete fields. Fifteen had advanced shipment notifications from the supplier with all fields completed but with some inaccurate data. A further nine orders had packing slips provided with either missing or inaccurate data.
Supplier Service Accuracy = (200 – 10 – 15 – 9) ÷ 200 = 83%
DefinitionSupplier Service Accuracy measures the completeness and accuracy of the information which is needed from the supplier to obtain a specific supplier order or request for service.
Calculation Supplier Service Accuracy = Supplier orders both complete and accurateTotal orders
Applications
Available and accurate supplier information lowers the total cost of doing business with a supplier. With electronic data interchange, examples of electronic documents from the supplier are:
Purchase order acknowledgment — confirming the order electronically
Advanced shipment notification — standard set of electronic pre-shipment data letting the customer know what (items and quantities) are coming
Packing slip with invoice — all the necessary information to do the required “three-way match” electronically so that no manual labor is necessary.
These electronic documents can potentially save huge sums of money, but can create big problems if they are incorrect. The income statement account most affected by Supplier Service Accuracy is operating expense.
PotentiallyAffectedPrimes
Market Share Index, Sales Cycle Index, Sales Close Index, Cash-to-Cash Cycle Time, Conversion Cost and Asset Utilization
Business Aspect: Supply Management Aggregate Measure: Supplier Effectiveness
Example
During the past seven days, ABC Computers placed 200 supplier orders. Ten of these were sent purchase order acknowledgments from the supplier with accurate data but some incomplete fields. Fifteen had advanced shipment notifications from the supplier with all fields completed but with some inaccurate data. A further nine orders had packing slips provided with either missing or inaccurate data.
Supplier Service Accuracy = (200 – 10 – 15 – 9) ÷ 200 = 83%
ExampleExample
During the past seven days, ABC Computers placed 200 supplier orders. Ten of these were sent purchase order acknowledgments from the supplier with accurate data but some incomplete fields. Fifteen had advanced shipment notifications from the supplier with all fields completed but with some inaccurate data. A further nine orders had packing slips provided with either missing or inaccurate data.
Supplier Service Accuracy = (200 – 10 – 15 – 9) ÷ 200 = 83%
DefinitionSupplier Service Accuracy measures the completeness and accuracy of the information which is needed from the supplier to obtain a specific supplier order or request for service.
DefinitionDefinitionSupplier Service Accuracy measures the completeness and accuracy of the information which is needed from the supplier to obtain a specific supplier order or request for service.
Calculation Supplier Service Accuracy = Supplier orders both complete and accurateTotal orders CalculationCalculation Supplier Service Accuracy = Supplier orders both complete and accurateTotal orders
Applications
Available and accurate supplier information lowers the total cost of doing business with a supplier. With electronic data interchange, examples of electronic documents from the supplier are:
Purchase order acknowledgment — confirming the order electronically
Advanced shipment notification — standard set of electronic pre-shipment data letting the customer know what (items and quantities) are coming
Packing slip with invoice — all the necessary information to do the required “three-way match” electronically so that no manual labor is necessary.
These electronic documents can potentially save huge sums of money, but can create big problems if they are incorrect. The income statement account most affected by Supplier Service Accuracy is operating expense.
ApplicationsApplications
Available and accurate supplier information lowers the total cost of doing business with a supplier. With electronic data interchange, examples of electronic documents from the supplier are:
Purchase order acknowledgment — confirming the order electronically
Advanced shipment notification — standard set of electronic pre-shipment data letting the customer know what (items and quantities) are coming
Packing slip with invoice — all the necessary information to do the required “three-way match” electronically so that no manual labor is necessary.
These electronic documents can potentially save huge sums of money, but can create big problems if they are incorrect. The income statement account most affected by Supplier Service Accuracy is operating expense.
PotentiallyAffectedPrimes
Market Share Index, Sales Cycle Index, Sales Close Index, Cash-to-Cash Cycle Time, Conversion Cost and Asset Utilization
PotentiallyAffectedPrimes
PotentiallyAffectedPrimes
Market Share Index, Sales Cycle Index, Sales Close Index, Cash-to-Cash Cycle Time, Conversion Cost and Asset Utilization
Business Aspect: Supply Management Aggregate Measure: Supplier Effectiveness
Source: Gartner (May 2006)
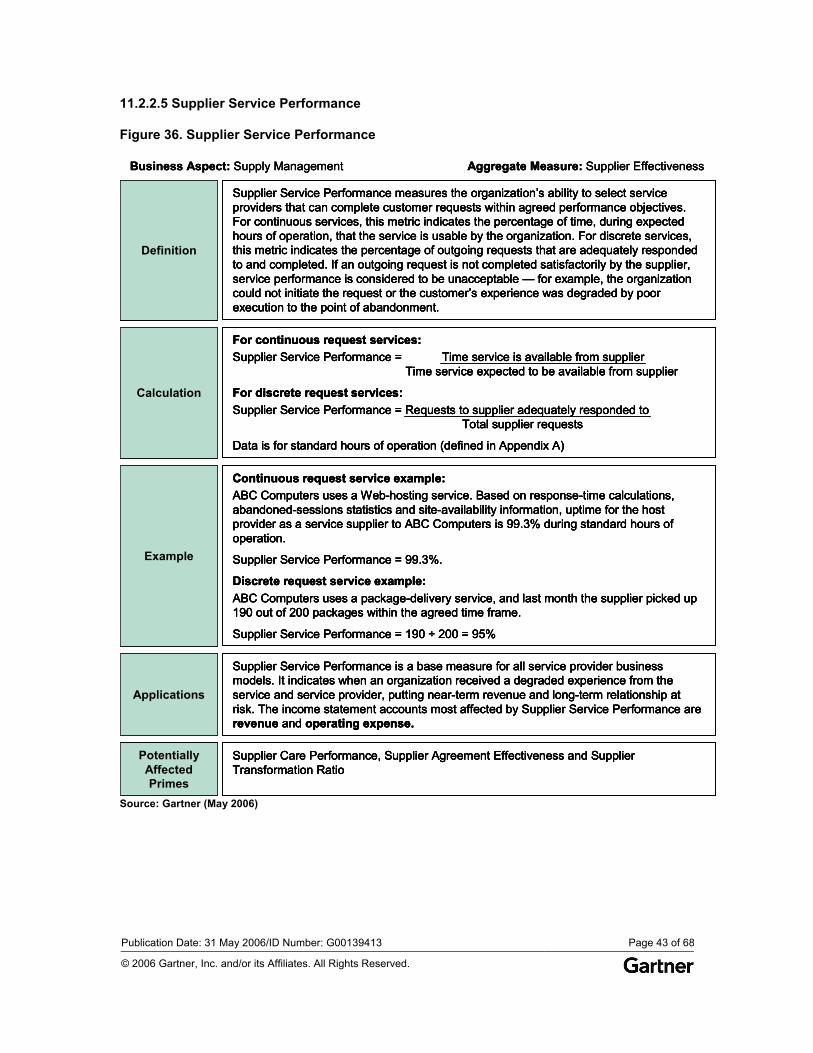
Publication Date: 31 May 2006/ID Number: G00139413 Page 43 of 68
© 2006 Gartner, Inc. and/or its Affiliates. All Rights Reserved.
11.2.2.5 Supplier Service Performance
Figure 36. Supplier Service Performance
Example
Continuous request service example:ABC Computers uses a Web-hosting service. Based on response-time calculations, abandoned-sessions statistics and site-availability information, uptime for the host provider as a service supplier to ABC Computers is 99.3% during standard hours of operation.
Supplier Service Performance = 99.3%.
Discrete request service example:ABC Computers uses a package-delivery service, and last month the supplier picked up 190 out of 200 packages within the agreed time frame.
Supplier Service Performance = 190 ÷ 200 = 95%
Definition
Supplier Service Performance measures the organization’s ability to select service providers that can complete customer requests within agreed performance objectives. For continuous services, this metric indicates the percentage of time, during expected hours of operation, that the service is usable by the organization. For discrete services, this metric indicates the percentage of outgoing requests that are adequately responded to and completed. If an outgoing request is not completed satisfactorily by the supplier, service performance is considered to be unacceptable — for example, the organization could not initiate the request or the customer’s experience was degraded by poor execution to the point of abandonment.
Calculation
For continuous request services:Supplier Service Performance = Time service is available from supplier
Time service expected to be available from supplier
For discrete request services:Supplier Service Performance = Requests to supplier adequately responded to
Total supplier requests
Data is for standard hours of operation (defined in Appendix A)
Applications
Supplier Service Performance is a base measure for all service provider business models. It indicates when an organization received a degraded experience from the service and service provider, putting near-term revenue and long-term relationship at risk. The income statement accounts most affected by Supplier Service Performance are revenue and operating expense.
PotentiallyAffectedPrimes
Supplier Care Performance, Supplier Agreement Effectiveness and Supplier Transformation Ratio
Business Aspect: Supply Management Aggregate Measure: Supplier Effectiveness
Example
Continuous request service example:ABC Computers uses a Web-hosting service. Based on response-time calculations, abandoned-sessions statistics and site-availability information, uptime for the host provider as a service supplier to ABC Computers is 99.3% during standard hours of operation.
Supplier Service Performance = 99.3%.
Discrete request service example:ABC Computers uses a package-delivery service, and last month the supplier picked up 190 out of 200 packages within the agreed time frame.
Supplier Service Performance = 190 ÷ 200 = 95%
ExampleExample
Continuous request service example:ABC Computers uses a Web-hosting service. Based on response-time calculations, abandoned-sessions statistics and site-availability information, uptime for the host provider as a service supplier to ABC Computers is 99.3% during standard hours of operation.
Supplier Service Performance = 99.3%.
Discrete request service example:ABC Computers uses a package-delivery service, and last month the supplier picked up 190 out of 200 packages within the agreed time frame.
Supplier Service Performance = 190 ÷ 200 = 95%
Definition
Supplier Service Performance measures the organization’s ability to select service providers that can complete customer requests within agreed performance objectives. For continuous services, this metric indicates the percentage of time, during expected hours of operation, that the service is usable by the organization. For discrete services, this metric indicates the percentage of outgoing requests that are adequately responded to and completed. If an outgoing request is not completed satisfactorily by the supplier, service performance is considered to be unacceptable — for example, the organization could not initiate the request or the customer’s experience was degraded by poor execution to the point of abandonment.
DefinitionDefinition
Supplier Service Performance measures the organization’s ability to select service providers that can complete customer requests within agreed performance objectives. For continuous services, this metric indicates the percentage of time, during expected hours of operation, that the service is usable by the organization. For discrete services, this metric indicates the percentage of outgoing requests that are adequately responded to and completed. If an outgoing request is not completed satisfactorily by the supplier, service performance is considered to be unacceptable — for example, the organization could not initiate the request or the customer’s experience was degraded by poor execution to the point of abandonment.
Calculation
For continuous request services:Supplier Service Performance = Time service is available from supplier
Time service expected to be available from supplier
For discrete request services:Supplier Service Performance = Requests to supplier adequately responded to
Total supplier requests
Data is for standard hours of operation (defined in Appendix A)
CalculationCalculation
For continuous request services:Supplier Service Performance = Time service is available from supplier
Time service expected to be available from supplier
For discrete request services:Supplier Service Performance = Requests to supplier adequately responded to
Total supplier requests
Data is for standard hours of operation (defined in Appendix A)
Applications
Supplier Service Performance is a base measure for all service provider business models. It indicates when an organization received a degraded experience from the service and service provider, putting near-term revenue and long-term relationship at risk. The income statement accounts most affected by Supplier Service Performance are revenue and operating expense.
ApplicationsApplications
Supplier Service Performance is a base measure for all service provider business models. It indicates when an organization received a degraded experience from the service and service provider, putting near-term revenue and long-term relationship at risk. The income statement accounts most affected by Supplier Service Performance are revenue and operating expense.
PotentiallyAffectedPrimes
Supplier Care Performance, Supplier Agreement Effectiveness and Supplier Transformation Ratio
PotentiallyAffectedPrimes
PotentiallyAffectedPrimes
Supplier Care Performance, Supplier Agreement Effectiveness and Supplier Transformation Ratio
Business Aspect: Supply Management Aggregate Measure: Supplier Effectiveness
Source: Gartner (May 2006)
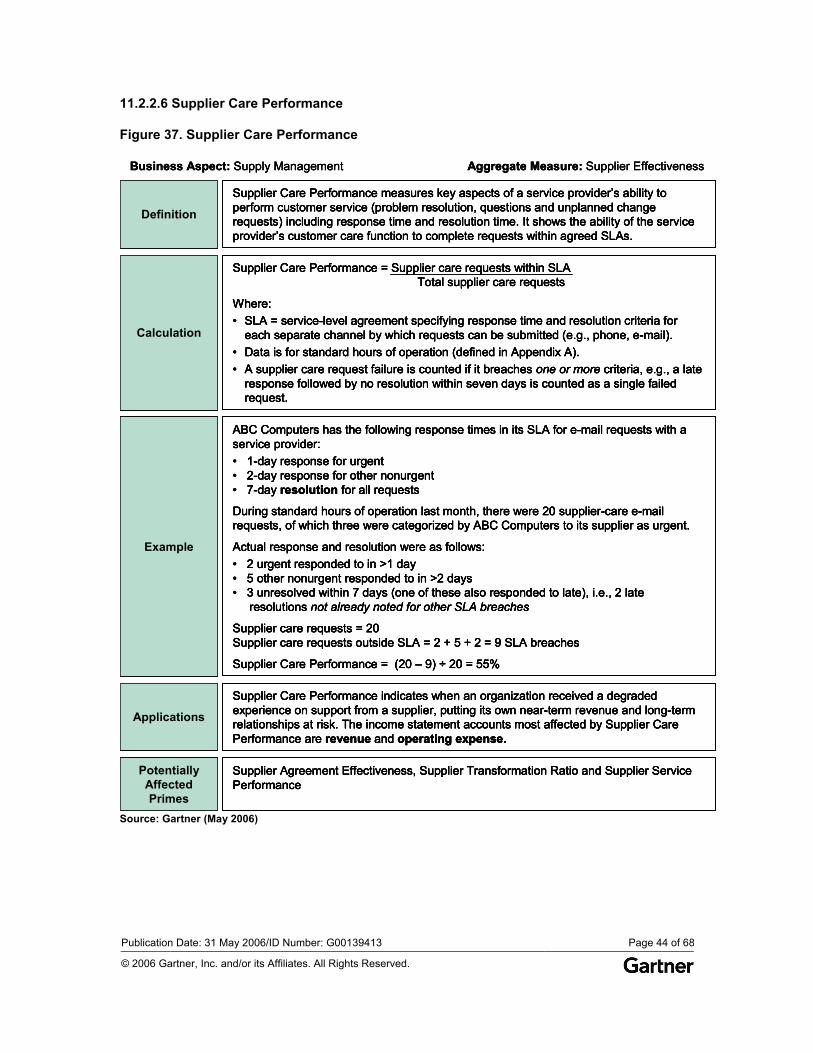
Publication Date: 31 May 2006/ID Number: G00139413 Page 44 of 68
© 2006 Gartner, Inc. and/or its Affiliates. All Rights Reserved.
11.2.2.6 Supplier Care Performance
Figure 37. Supplier Care Performance
Example
ABC Computers has the following response times in its SLA for e-mail requests with a service provider:• 1-day response for urgent• 2-day response for other nonurgent• 7-day resolution for all requests
During standard hours of operation last month, there were 20 supplier-care e-mail requests, of which three were categorized by ABC Computers to its supplier as urgent.
Actual response and resolution were as follows:• 2 urgent responded to in >1 day• 5 other nonurgent responded to in >2 days • 3 unresolved within 7 days (one of these also responded to late), i.e., 2 late
resolutions not already noted for other SLA breaches
Supplier care requests = 20Supplier care requests outside SLA = 2 + 5 + 2 = 9 SLA breaches
Supplier Care Performance = (20 – 9) ÷ 20 = 55%
Calculation
Supplier Care Performance = Supplier care requests within SLATotal supplier care requests
Where:• SLA = service-level agreement specifying response time and resolution criteria for
each separate channel by which requests can be submitted (e.g., phone, e-mail).• Data is for standard hours of operation (defined in Appendix A).• A supplier care request failure is counted if it breaches one or more criteria, e.g., a late
response followed by no resolution within seven days is counted as a single failed request.
Applications
Supplier Care Performance indicates when an organization received a degraded experience on support from a supplier, putting its own near-term revenue and long-term relationships at risk. The income statement accounts most affected by Supplier Care Performance are revenue and operating expense.
PotentiallyAffectedPrimes
Supplier Agreement Effectiveness, Supplier Transformation Ratio and Supplier Service Performance
Business Aspect: Supply Management Aggregate Measure: Supplier Effectiveness
Definition
Supplier Care Performance measures key aspects of a service provider’s ability to perform customer service (problem resolution, questions and unplanned change requests) including response time and resolution time. It shows the ability of the service provider’s customer care function to complete requests within agreed SLAs.
Example
ABC Computers has the following response times in its SLA for e-mail requests with a service provider:• 1-day response for urgent• 2-day response for other nonurgent• 7-day resolution for all requests
During standard hours of operation last month, there were 20 supplier-care e-mail requests, of which three were categorized by ABC Computers to its supplier as urgent.
Actual response and resolution were as follows:• 2 urgent responded to in >1 day• 5 other nonurgent responded to in >2 days • 3 unresolved within 7 days (one of these also responded to late), i.e., 2 late
resolutions not already noted for other SLA breaches
Supplier care requests = 20Supplier care requests outside SLA = 2 + 5 + 2 = 9 SLA breaches
Supplier Care Performance = (20 – 9) ÷ 20 = 55%
ExampleExample
ABC Computers has the following response times in its SLA for e-mail requests with a service provider:• 1-day response for urgent• 2-day response for other nonurgent• 7-day resolution for all requests
During standard hours of operation last month, there were 20 supplier-care e-mail requests, of which three were categorized by ABC Computers to its supplier as urgent.
Actual response and resolution were as follows:• 2 urgent responded to in >1 day• 5 other nonurgent responded to in >2 days • 3 unresolved within 7 days (one of these also responded to late), i.e., 2 late
resolutions not already noted for other SLA breaches
Supplier care requests = 20Supplier care requests outside SLA = 2 + 5 + 2 = 9 SLA breaches
Supplier Care Performance = (20 – 9) ÷ 20 = 55%
Calculation
Supplier Care Performance = Supplier care requests within SLATotal supplier care requests
Where:• SLA = service-level agreement specifying response time and resolution criteria for
each separate channel by which requests can be submitted (e.g., phone, e-mail).• Data is for standard hours of operation (defined in Appendix A).• A supplier care request failure is counted if it breaches one or more criteria, e.g., a late
response followed by no resolution within seven days is counted as a single failed request.
CalculationCalculation
Supplier Care Performance = Supplier care requests within SLATotal supplier care requests
Where:• SLA = service-level agreement specifying response time and resolution criteria for
each separate channel by which requests can be submitted (e.g., phone, e-mail).• Data is for standard hours of operation (defined in Appendix A).• A supplier care request failure is counted if it breaches one or more criteria, e.g., a late
response followed by no resolution within seven days is counted as a single failed request.
Applications
Supplier Care Performance indicates when an organization received a degraded experience on support from a supplier, putting its own near-term revenue and long-term relationships at risk. The income statement accounts most affected by Supplier Care Performance are revenue and operating expense.
ApplicationsApplications
Supplier Care Performance indicates when an organization received a degraded experience on support from a supplier, putting its own near-term revenue and long-term relationships at risk. The income statement accounts most affected by Supplier Care Performance are revenue and operating expense.
PotentiallyAffectedPrimes
Supplier Agreement Effectiveness, Supplier Transformation Ratio and Supplier Service Performance
PotentiallyAffectedPrimes
PotentiallyAffectedPrimes
Supplier Agreement Effectiveness, Supplier Transformation Ratio and Supplier Service Performance
Business Aspect: Supply Management Aggregate Measure: Supplier Effectiveness
Definition
Supplier Care Performance measures key aspects of a service provider’s ability to perform customer service (problem resolution, questions and unplanned change requests) including response time and resolution time. It shows the ability of the service provider’s customer care function to complete requests within agreed SLAs.
DefinitionDefinition
Supplier Care Performance measures key aspects of a service provider’s ability to perform customer service (problem resolution, questions and unplanned change requests) including response time and resolution time. It shows the ability of the service provider’s customer care function to complete requests within agreed SLAs.
Source: Gartner (May 2006)
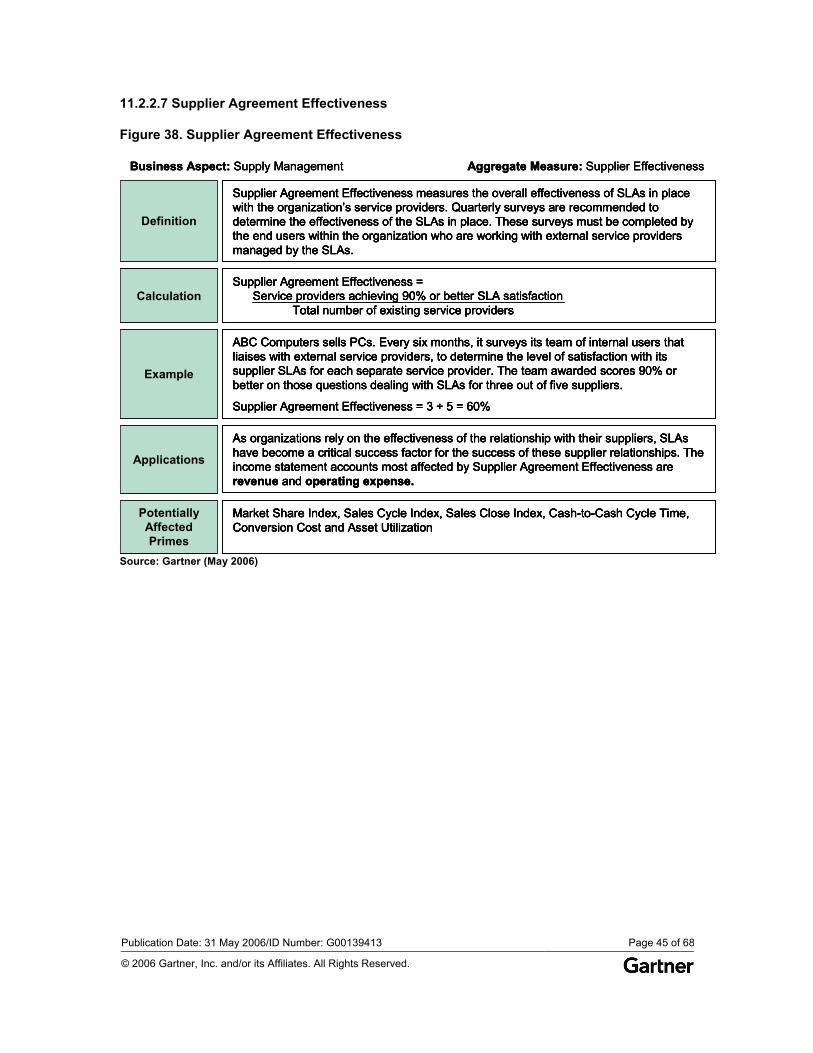
Publication Date: 31 May 2006/ID Number: G00139413 Page 45 of 68
© 2006 Gartner, Inc. and/or its Affiliates. All Rights Reserved.
11.2.2.7 Supplier Agreement Effectiveness
Figure 38. Supplier Agreement Effectiveness
Example
ABC Computers sells PCs. Every six months, it surveys its team of internal users that liaises with external service providers, to determine the level of satisfaction with its supplier SLAs for each separate service provider. The team awarded scores 90% or better on those questions dealing with SLAs for three out of five suppliers.
Supplier Agreement Effectiveness = 3 ÷ 5 = 60%
Definition
Supplier Agreement Effectiveness measures the overall effectiveness of SLAs in place with the organization’s service providers. Quarterly surveys are recommended to determine the effectiveness of the SLAs in place. These surveys must be completed by the end users within the organization who are working with external service providers managed by the SLAs.
CalculationSupplier Agreement Effectiveness =
Service providers achieving 90% or better SLA satisfactionTotal number of existing service providers
Applications
As organizations rely on the effectiveness of the relationship with their suppliers, SLAs have become a critical success factor for the success of these supplier relationships. The income statement accounts most affected by Supplier Agreement Effectiveness are revenue and operating expense.
PotentiallyAffectedPrimes
Market Share Index, Sales Cycle Index, Sales Close Index, Cash-to-Cash Cycle Time, Conversion Cost and Asset Utilization
Business Aspect: Supply Management Aggregate Measure: Supplier Effectiveness
Example
ABC Computers sells PCs. Every six months, it surveys its team of internal users that liaises with external service providers, to determine the level of satisfaction with its supplier SLAs for each separate service provider. The team awarded scores 90% or better on those questions dealing with SLAs for three out of five suppliers.
Supplier Agreement Effectiveness = 3 ÷ 5 = 60%
ExampleExample
ABC Computers sells PCs. Every six months, it surveys its team of internal users that liaises with external service providers, to determine the level of satisfaction with its supplier SLAs for each separate service provider. The team awarded scores 90% or better on those questions dealing with SLAs for three out of five suppliers.
Supplier Agreement Effectiveness = 3 ÷ 5 = 60%
Definition
Supplier Agreement Effectiveness measures the overall effectiveness of SLAs in place with the organization’s service providers. Quarterly surveys are recommended to determine the effectiveness of the SLAs in place. These surveys must be completed by the end users within the organization who are working with external service providers managed by the SLAs.
DefinitionDefinition
Supplier Agreement Effectiveness measures the overall effectiveness of SLAs in place with the organization’s service providers. Quarterly surveys are recommended to determine the effectiveness of the SLAs in place. These surveys must be completed by the end users within the organization who are working with external service providers managed by the SLAs.
CalculationSupplier Agreement Effectiveness =
Service providers achieving 90% or better SLA satisfactionTotal number of existing service providers
CalculationCalculationSupplier Agreement Effectiveness =
Service providers achieving 90% or better SLA satisfactionTotal number of existing service providers
Applications
As organizations rely on the effectiveness of the relationship with their suppliers, SLAs have become a critical success factor for the success of these supplier relationships. The income statement accounts most affected by Supplier Agreement Effectiveness are revenue and operating expense.
ApplicationsApplications
As organizations rely on the effectiveness of the relationship with their suppliers, SLAs have become a critical success factor for the success of these supplier relationships. The income statement accounts most affected by Supplier Agreement Effectiveness are revenue and operating expense.
PotentiallyAffectedPrimes
Market Share Index, Sales Cycle Index, Sales Close Index, Cash-to-Cash Cycle Time, Conversion Cost and Asset Utilization
PotentiallyAffectedPrimes
PotentiallyAffectedPrimes
Market Share Index, Sales Cycle Index, Sales Close Index, Cash-to-Cash Cycle Time, Conversion Cost and Asset Utilization
Business Aspect: Supply Management Aggregate Measure: Supplier Effectiveness
Source: Gartner (May 2006)
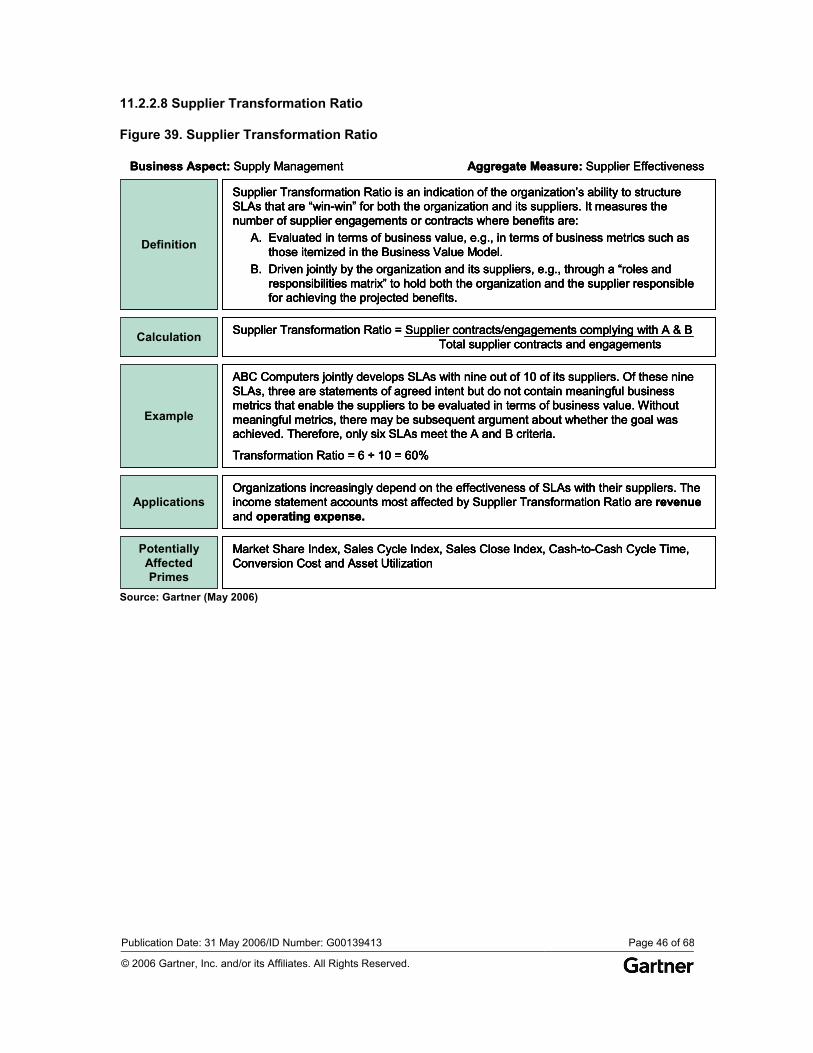
Publication Date: 31 May 2006/ID Number: G00139413 Page 46 of 68
© 2006 Gartner, Inc. and/or its Affiliates. All Rights Reserved.
11.2.2.8 Supplier Transformation Ratio
Figure 39. Supplier Transformation Ratio
Example
ABC Computers jointly develops SLAs with nine out of 10 of its suppliers. Of these nine SLAs, three are statements of agreed intent but do not contain meaningful business metrics that enable the suppliers to be evaluated in terms of business value. Without meaningful metrics, there may be subsequent argument about whether the goal was achieved. Therefore, only six SLAs meet the A and B criteria.
Transformation Ratio = 6 ÷ 10 = 60%
Definition
Supplier Transformation Ratio is an indication of the organization’s ability to structure SLAs that are “win-win” for both the organization and its suppliers. It measures the number of supplier engagements or contracts where benefits are:
A. Evaluated in terms of business value, e.g., in terms of business metrics such as those itemized in the Business Value Model.
B. Driven jointly by the organization and its suppliers, e.g., through a “roles and responsibilities matrix” to hold both the organization and the supplier responsible for achieving the projected benefits.
Calculation Supplier Transformation Ratio = Supplier contracts/engagements complying with A & BTotal supplier contracts and engagements
ApplicationsOrganizations increasingly depend on the effectiveness of SLAs with their suppliers. The income statement accounts most affected by Supplier Transformation Ratio are revenue and operating expense.
PotentiallyAffectedPrimes
Market Share Index, Sales Cycle Index, Sales Close Index, Cash-to-Cash Cycle Time, Conversion Cost and Asset Utilization
Business Aspect: Supply Management Aggregate Measure: Supplier Effectiveness
Example
ABC Computers jointly develops SLAs with nine out of 10 of its suppliers. Of these nine SLAs, three are statements of agreed intent but do not contain meaningful business metrics that enable the suppliers to be evaluated in terms of business value. Without meaningful metrics, there may be subsequent argument about whether the goal was achieved. Therefore, only six SLAs meet the A and B criteria.
Transformation Ratio = 6 ÷ 10 = 60%
ExampleExample
ABC Computers jointly develops SLAs with nine out of 10 of its suppliers. Of these nine SLAs, three are statements of agreed intent but do not contain meaningful business metrics that enable the suppliers to be evaluated in terms of business value. Without meaningful metrics, there may be subsequent argument about whether the goal was achieved. Therefore, only six SLAs meet the A and B criteria.
Transformation Ratio = 6 ÷ 10 = 60%
Definition
Supplier Transformation Ratio is an indication of the organization’s ability to structure SLAs that are “win-win” for both the organization and its suppliers. It measures the number of supplier engagements or contracts where benefits are:
A. Evaluated in terms of business value, e.g., in terms of business metrics such as those itemized in the Business Value Model.
B. Driven jointly by the organization and its suppliers, e.g., through a “roles and responsibilities matrix” to hold both the organization and the supplier responsible for achieving the projected benefits.
DefinitionDefinition
Supplier Transformation Ratio is an indication of the organization’s ability to structure SLAs that are “win-win” for both the organization and its suppliers. It measures the number of supplier engagements or contracts where benefits are:
A. Evaluated in terms of business value, e.g., in terms of business metrics such as those itemized in the Business Value Model.
B. Driven jointly by the organization and its suppliers, e.g., through a “roles and responsibilities matrix” to hold both the organization and the supplier responsible for achieving the projected benefits.
Calculation Supplier Transformation Ratio = Supplier contracts/engagements complying with A & BTotal supplier contracts and engagements CalculationCalculation Supplier Transformation Ratio = Supplier contracts/engagements complying with A & BTotal supplier contracts and engagements
ApplicationsOrganizations increasingly depend on the effectiveness of SLAs with their suppliers. The income statement accounts most affected by Supplier Transformation Ratio are revenue and operating expense.
ApplicationsApplicationsOrganizations increasingly depend on the effectiveness of SLAs with their suppliers. The income statement accounts most affected by Supplier Transformation Ratio are revenue and operating expense.
PotentiallyAffectedPrimes
Market Share Index, Sales Cycle Index, Sales Close Index, Cash-to-Cash Cycle Time, Conversion Cost and Asset Utilization
PotentiallyAffectedPrimes
PotentiallyAffectedPrimes
Market Share Index, Sales Cycle Index, Sales Close Index, Cash-to-Cash Cycle Time, Conversion Cost and Asset Utilization
Business Aspect: Supply Management Aggregate Measure: Supplier Effectiveness
Source: Gartner (May 2006)
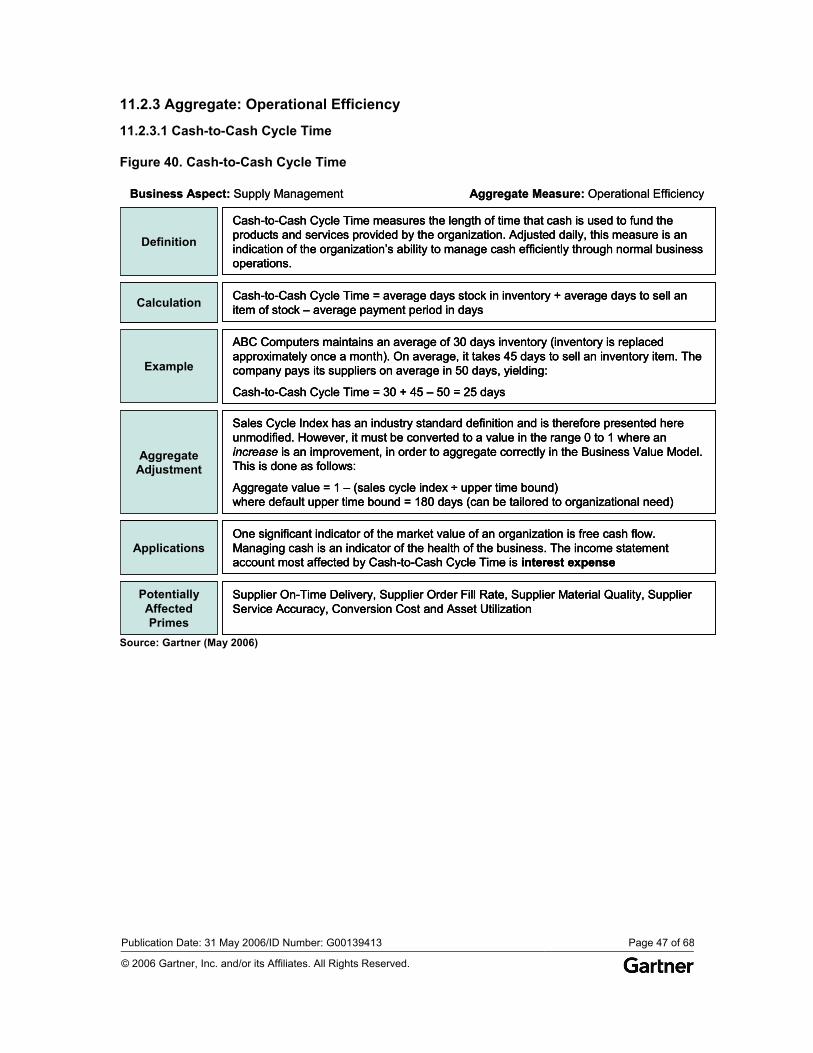
Publication Date: 31 May 2006/ID Number: G00139413 Page 47 of 68
© 2006 Gartner, Inc. and/or its Affiliates. All Rights Reserved.
11.2.3 Aggregate: Operational Efficiency
11.2.3.1 Cash-to-Cash Cycle Time
Figure 40. Cash-to-Cash Cycle Time
Business Aspect: Supply Management Aggregate Measure: Operational Efficiency
AggregateAdjustment
Sales Cycle Index has an industry standard definition and is therefore presented here unmodified. However, it must be converted to a value in the range 0 to 1 where an increase is an improvement, in order to aggregate correctly in the Business Value Model. This is done as follows:
Aggregate value = 1 – (sales cycle index ÷ upper time bound)where default upper time bound = 180 days (can be tailored to organizational need)
Example
ABC Computers maintains an average of 30 days inventory (inventory is replaced approximately once a month). On average, it takes 45 days to sell an inventory item. The company pays its suppliers on average in 50 days, yielding:
Cash-to-Cash Cycle Time = 30 + 45 – 50 = 25 days
Definition
Cash-to-Cash Cycle Time measures the length of time that cash is used to fund the products and services provided by the organization. Adjusted daily, this measure is an indication of the organization’s ability to manage cash efficiently through normal business operations.
Calculation Cash-to-Cash Cycle Time = average days stock in inventory + average days to sell an item of stock – average payment period in days
PotentiallyAffectedPrimes
Supplier On-Time Delivery, Supplier Order Fill Rate, Supplier Material Quality, Supplier Service Accuracy, Conversion Cost and Asset Utilization
ApplicationsOne significant indicator of the market value of an organization is free cash flow. Managing cash is an indicator of the health of the business. The income statement account most affected by Cash-to-Cash Cycle Time is interest expense
Business Aspect: Supply Management Aggregate Measure: Operational Efficiency
AggregateAdjustment
Sales Cycle Index has an industry standard definition and is therefore presented here unmodified. However, it must be converted to a value in the range 0 to 1 where an increase is an improvement, in order to aggregate correctly in the Business Value Model. This is done as follows:
Aggregate value = 1 – (sales cycle index ÷ upper time bound)where default upper time bound = 180 days (can be tailored to organizational need)
AggregateAdjustmentAggregate
Adjustment
Sales Cycle Index has an industry standard definition and is therefore presented here unmodified. However, it must be converted to a value in the range 0 to 1 where an increase is an improvement, in order to aggregate correctly in the Business Value Model. This is done as follows:
Aggregate value = 1 – (sales cycle index ÷ upper time bound)where default upper time bound = 180 days (can be tailored to organizational need)
Example
ABC Computers maintains an average of 30 days inventory (inventory is replaced approximately once a month). On average, it takes 45 days to sell an inventory item. The company pays its suppliers on average in 50 days, yielding:
Cash-to-Cash Cycle Time = 30 + 45 – 50 = 25 days
ExampleExample
ABC Computers maintains an average of 30 days inventory (inventory is replaced approximately once a month). On average, it takes 45 days to sell an inventory item. The company pays its suppliers on average in 50 days, yielding:
Cash-to-Cash Cycle Time = 30 + 45 – 50 = 25 days
Definition
Cash-to-Cash Cycle Time measures the length of time that cash is used to fund the products and services provided by the organization. Adjusted daily, this measure is an indication of the organization’s ability to manage cash efficiently through normal business operations.
DefinitionDefinition
Cash-to-Cash Cycle Time measures the length of time that cash is used to fund the products and services provided by the organization. Adjusted daily, this measure is an indication of the organization’s ability to manage cash efficiently through normal business operations.
Calculation Cash-to-Cash Cycle Time = average days stock in inventory + average days to sell an item of stock – average payment period in daysCalculationCalculation Cash-to-Cash Cycle Time = average days stock in inventory + average days to sell an item of stock – average payment period in days
PotentiallyAffectedPrimes
Supplier On-Time Delivery, Supplier Order Fill Rate, Supplier Material Quality, Supplier Service Accuracy, Conversion Cost and Asset Utilization
PotentiallyAffectedPrimes
PotentiallyAffectedPrimes
Supplier On-Time Delivery, Supplier Order Fill Rate, Supplier Material Quality, Supplier Service Accuracy, Conversion Cost and Asset Utilization
ApplicationsOne significant indicator of the market value of an organization is free cash flow. Managing cash is an indicator of the health of the business. The income statement account most affected by Cash-to-Cash Cycle Time is interest expense
ApplicationsApplicationsOne significant indicator of the market value of an organization is free cash flow. Managing cash is an indicator of the health of the business. The income statement account most affected by Cash-to-Cash Cycle Time is interest expense
Source: Gartner (May 2006)
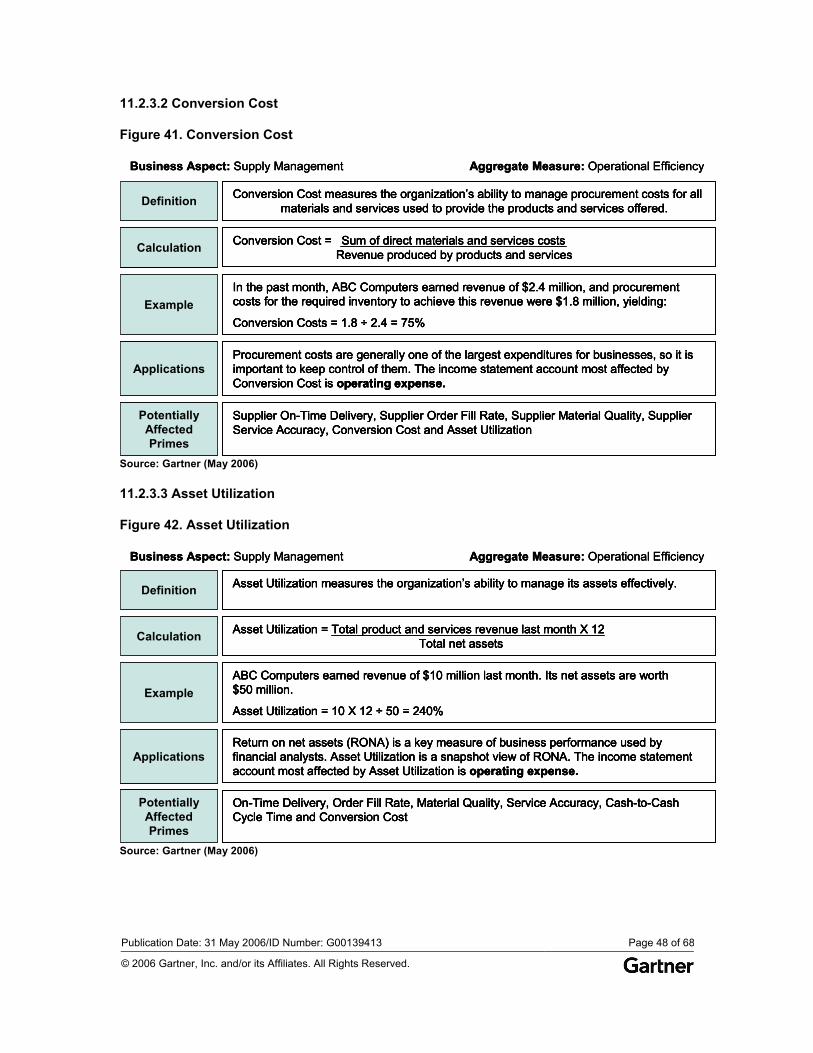
Publication Date: 31 May 2006/ID Number: G00139413 Page 48 of 68
© 2006 Gartner, Inc. and/or its Affiliates. All Rights Reserved.
11.2.3.2 Conversion Cost
Figure 41. Conversion Cost
Business Aspect: Supply Management Aggregate Measure: Operational Efficiency
ExampleIn the past month, ABC Computers earned revenue of $2.4 million, and procurement costs for the required inventory to achieve this revenue were $1.8 million, yielding:
Conversion Costs = 1.8 ÷ 2.4 = 75%
Definition Conversion Cost measures the organization’s ability to manage procurement costs for all materials and services used to provide the products and services offered.
Calculation Conversion Cost = Sum of direct materials and services costsRevenue produced by products and services
PotentiallyAffectedPrimes
Supplier On-Time Delivery, Supplier Order Fill Rate, Supplier Material Quality, Supplier Service Accuracy, Conversion Cost and Asset Utilization
ApplicationsProcurement costs are generally one of the largest expenditures for businesses, so it is important to keep control of them. The income statement account most affected by Conversion Cost is operating expense.
Business Aspect: Supply Management Aggregate Measure: Operational Efficiency
ExampleIn the past month, ABC Computers earned revenue of $2.4 million, and procurement costs for the required inventory to achieve this revenue were $1.8 million, yielding:
Conversion Costs = 1.8 ÷ 2.4 = 75%ExampleExample
In the past month, ABC Computers earned revenue of $2.4 million, and procurement costs for the required inventory to achieve this revenue were $1.8 million, yielding:
Conversion Costs = 1.8 ÷ 2.4 = 75%
Definition Conversion Cost measures the organization’s ability to manage procurement costs for all materials and services used to provide the products and services offered.DefinitionDefinition Conversion Cost measures the organization’s ability to manage procurement costs for all materials and services used to provide the products and services offered.
Calculation Conversion Cost = Sum of direct materials and services costsRevenue produced by products and servicesCalculationCalculation Conversion Cost = Sum of direct materials and services costsRevenue produced by products and services
PotentiallyAffectedPrimes
Supplier On-Time Delivery, Supplier Order Fill Rate, Supplier Material Quality, Supplier Service Accuracy, Conversion Cost and Asset Utilization
PotentiallyAffectedPrimes
PotentiallyAffectedPrimes
Supplier On-Time Delivery, Supplier Order Fill Rate, Supplier Material Quality, Supplier Service Accuracy, Conversion Cost and Asset Utilization
ApplicationsProcurement costs are generally one of the largest expenditures for businesses, so it is important to keep control of them. The income statement account most affected by Conversion Cost is operating expense.
ApplicationsApplicationsProcurement costs are generally one of the largest expenditures for businesses, so it is important to keep control of them. The income statement account most affected by Conversion Cost is operating expense.
Source: Gartner (May 2006)
11.2.3.3 Asset Utilization
Figure 42. Asset Utilization
Business Aspect: Supply Management Aggregate Measure: Operational Efficiency
ExampleABC Computers earned revenue of $10 million last month. Its net assets are worth $50 million.
Asset Utilization = 10 X 12 ÷ 50 = 240%
Definition Asset Utilization measures the organization’s ability to manage its assets effectively.
Calculation Asset Utilization = Total product and services revenue last month X 12Total net assets
PotentiallyAffectedPrimes
On-Time Delivery, Order Fill Rate, Material Quality, Service Accuracy, Cash-to-Cash Cycle Time and Conversion Cost
ApplicationsReturn on net assets (RONA) is a key measure of business performance used by financial analysts. Asset Utilization is a snapshot view of RONA. The income statement account most affected by Asset Utilization is operating expense.
Business Aspect: Supply Management Aggregate Measure: Operational Efficiency
ExampleABC Computers earned revenue of $10 million last month. Its net assets are worth $50 million.
Asset Utilization = 10 X 12 ÷ 50 = 240% ExampleExample
ABC Computers earned revenue of $10 million last month. Its net assets are worth $50 million.
Asset Utilization = 10 X 12 ÷ 50 = 240%
Definition Asset Utilization measures the organization’s ability to manage its assets effectively.DefinitionDefinition Asset Utilization measures the organization’s ability to manage its assets effectively.
Calculation Asset Utilization = Total product and services revenue last month X 12Total net assetsCalculationCalculation Asset Utilization = Total product and services revenue last month X 12Total net assets
PotentiallyAffectedPrimes
On-Time Delivery, Order Fill Rate, Material Quality, Service Accuracy, Cash-to-Cash Cycle Time and Conversion Cost
PotentiallyAffectedPrimes
PotentiallyAffectedPrimes
On-Time Delivery, Order Fill Rate, Material Quality, Service Accuracy, Cash-to-Cash Cycle Time and Conversion Cost
ApplicationsReturn on net assets (RONA) is a key measure of business performance used by financial analysts. Asset Utilization is a snapshot view of RONA. The income statement account most affected by Asset Utilization is operating expense.
ApplicationsApplicationsReturn on net assets (RONA) is a key measure of business performance used by financial analysts. Asset Utilization is a snapshot view of RONA. The income statement account most affected by Asset Utilization is operating expense.
Source: Gartner (May 2006)
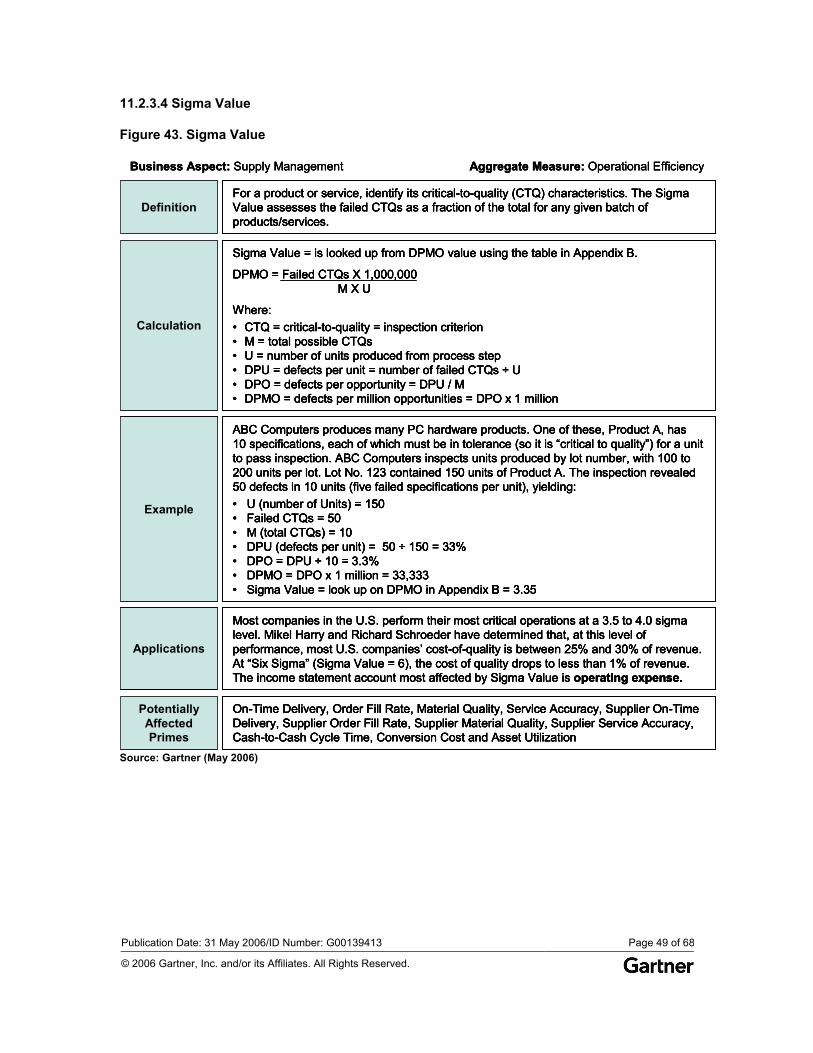
Publication Date: 31 May 2006/ID Number: G00139413 Page 49 of 68
© 2006 Gartner, Inc. and/or its Affiliates. All Rights Reserved.
11.2.3.4 Sigma Value
Figure 43. Sigma Value
Business Aspect: Supply Management Aggregate Measure: Operational Efficiency
Example
ABC Computers produces many PC hardware products. One of these, Product A, has 10 specifications, each of which must be in tolerance (so it is “critical to quality”) for a unit to pass inspection. ABC Computers inspects units produced by lot number, with 100 to 200 units per lot. Lot No. 123 contained 150 units of Product A. The inspection revealed 50 defects in 10 units (five failed specifications per unit), yielding:• U (number of Units) = 150• Failed CTQs = 50• M (total CTQs) = 10• DPU (defects per unit) = 50 ÷ 150 = 33%• DPO = DPU ÷ 10 = 3.3%• DPMO = DPO x 1 million = 33,333• Sigma Value = look up on DPMO in Appendix B = 3.35
DefinitionFor a product or service, identify its critical-to-quality (CTQ) characteristics. The Sigma Value assesses the failed CTQs as a fraction of the total for any given batch of products/services.
Calculation
Sigma Value = is looked up from DPMO value using the table in Appendix B.
DPMO = Failed CTQs X 1,000,000M X U
Where:• CTQ = critical-to-quality = inspection criterion • M = total possible CTQs• U = number of units produced from process step• DPU = defects per unit = number of failed CTQs ÷ U• DPO = defects per opportunity = DPU / M• DPMO = defects per million opportunities = DPO x 1 million
PotentiallyAffectedPrimes
On-Time Delivery, Order Fill Rate, Material Quality, Service Accuracy, Supplier On-Time Delivery, Supplier Order Fill Rate, Supplier Material Quality, Supplier Service Accuracy, Cash-to-Cash Cycle Time, Conversion Cost and Asset Utilization
Applications
Most companies in the U.S. perform their most critical operations at a 3.5 to 4.0 sigma level. Mikel Harry and Richard Schroeder have determined that, at this level of performance, most U.S. companies’ cost-of-quality is between 25% and 30% of revenue. At “Six Sigma” (Sigma Value = 6), the cost of quality drops to less than 1% of revenue. The income statement account most affected by Sigma Value is operating expense.
Business Aspect: Supply Management Aggregate Measure: Operational Efficiency
Example
ABC Computers produces many PC hardware products. One of these, Product A, has 10 specifications, each of which must be in tolerance (so it is “critical to quality”) for a unit to pass inspection. ABC Computers inspects units produced by lot number, with 100 to 200 units per lot. Lot No. 123 contained 150 units of Product A. The inspection revealed 50 defects in 10 units (five failed specifications per unit), yielding:• U (number of Units) = 150• Failed CTQs = 50• M (total CTQs) = 10• DPU (defects per unit) = 50 ÷ 150 = 33%• DPO = DPU ÷ 10 = 3.3%• DPMO = DPO x 1 million = 33,333• Sigma Value = look up on DPMO in Appendix B = 3.35
ExampleExample
ABC Computers produces many PC hardware products. One of these, Product A, has 10 specifications, each of which must be in tolerance (so it is “critical to quality”) for a unit to pass inspection. ABC Computers inspects units produced by lot number, with 100 to 200 units per lot. Lot No. 123 contained 150 units of Product A. The inspection revealed 50 defects in 10 units (five failed specifications per unit), yielding:• U (number of Units) = 150• Failed CTQs = 50• M (total CTQs) = 10• DPU (defects per unit) = 50 ÷ 150 = 33%• DPO = DPU ÷ 10 = 3.3%• DPMO = DPO x 1 million = 33,333• Sigma Value = look up on DPMO in Appendix B = 3.35
DefinitionFor a product or service, identify its critical-to-quality (CTQ) characteristics. The Sigma Value assesses the failed CTQs as a fraction of the total for any given batch of products/services.
DefinitionDefinitionFor a product or service, identify its critical-to-quality (CTQ) characteristics. The Sigma Value assesses the failed CTQs as a fraction of the total for any given batch of products/services.
Calculation
Sigma Value = is looked up from DPMO value using the table in Appendix B.
DPMO = Failed CTQs X 1,000,000M X U
Where:• CTQ = critical-to-quality = inspection criterion • M = total possible CTQs• U = number of units produced from process step• DPU = defects per unit = number of failed CTQs ÷ U• DPO = defects per opportunity = DPU / M• DPMO = defects per million opportunities = DPO x 1 million
CalculationCalculation
Sigma Value = is looked up from DPMO value using the table in Appendix B.
DPMO = Failed CTQs X 1,000,000M X U
Where:• CTQ = critical-to-quality = inspection criterion • M = total possible CTQs• U = number of units produced from process step• DPU = defects per unit = number of failed CTQs ÷ U• DPO = defects per opportunity = DPU / M• DPMO = defects per million opportunities = DPO x 1 million
PotentiallyAffectedPrimes
On-Time Delivery, Order Fill Rate, Material Quality, Service Accuracy, Supplier On-Time Delivery, Supplier Order Fill Rate, Supplier Material Quality, Supplier Service Accuracy, Cash-to-Cash Cycle Time, Conversion Cost and Asset Utilization
PotentiallyAffectedPrimes
PotentiallyAffectedPrimes
On-Time Delivery, Order Fill Rate, Material Quality, Service Accuracy, Supplier On-Time Delivery, Supplier Order Fill Rate, Supplier Material Quality, Supplier Service Accuracy, Cash-to-Cash Cycle Time, Conversion Cost and Asset Utilization
Applications
Most companies in the U.S. perform their most critical operations at a 3.5 to 4.0 sigma level. Mikel Harry and Richard Schroeder have determined that, at this level of performance, most U.S. companies’ cost-of-quality is between 25% and 30% of revenue. At “Six Sigma” (Sigma Value = 6), the cost of quality drops to less than 1% of revenue. The income statement account most affected by Sigma Value is operating expense.
ApplicationsApplications
Most companies in the U.S. perform their most critical operations at a 3.5 to 4.0 sigma level. Mikel Harry and Richard Schroeder have determined that, at this level of performance, most U.S. companies’ cost-of-quality is between 25% and 30% of revenue. At “Six Sigma” (Sigma Value = 6), the cost of quality drops to less than 1% of revenue. The income statement account most affected by Sigma Value is operating expense.
Source: Gartner (May 2006)
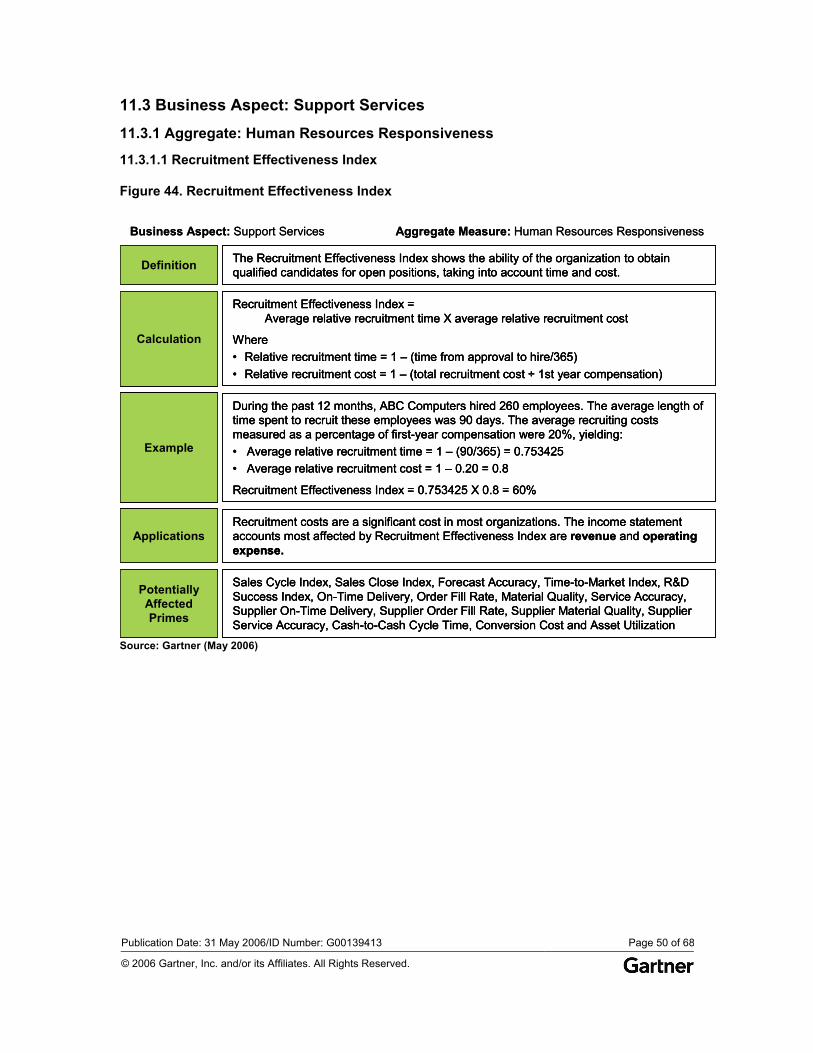
Publication Date: 31 May 2006/ID Number: G00139413 Page 50 of 68
© 2006 Gartner, Inc. and/or its Affiliates. All Rights Reserved.
11.3 Business Aspect: Support Services
11.3.1 Aggregate: Human Resources Responsiveness
11.3.1.1 Recruitment Effectiveness Index
Figure 44. Recruitment Effectiveness Index
Business Aspect: Support Services Aggregate Measure: Human Resources Responsiveness
Example
During the past 12 months, ABC Computers hired 260 employees. The average length of time spent to recruit these employees was 90 days. The average recruiting costs measured as a percentage of first-year compensation were 20%, yielding:• Average relative recruitment time = 1 – (90/365) = 0.753425• Average relative recruitment cost = 1 – 0.20 = 0.8
Recruitment Effectiveness Index = 0.753425 X 0.8 = 60%
Definition The Recruitment Effectiveness Index shows the ability of the organization to obtain qualified candidates for open positions, taking into account time and cost.
Calculation
Recruitment Effectiveness Index =Average relative recruitment time X average relative recruitment cost
Where• Relative recruitment time = 1 – (time from approval to hire/365)• Relative recruitment cost = 1 – (total recruitment cost ÷ 1st year compensation)
PotentiallyAffectedPrimes
Sales Cycle Index, Sales Close Index, Forecast Accuracy, Time-to-Market Index, R&D Success Index, On-Time Delivery, Order Fill Rate, Material Quality, Service Accuracy, Supplier On-Time Delivery, Supplier Order Fill Rate, Supplier Material Quality, Supplier Service Accuracy, Cash-to-Cash Cycle Time, Conversion Cost and Asset Utilization
ApplicationsRecruitment costs are a significant cost in most organizations. The income statement accounts most affected by Recruitment Effectiveness Index are revenue and operating expense.
Business Aspect: Support Services Aggregate Measure: Human Resources Responsiveness
Example
During the past 12 months, ABC Computers hired 260 employees. The average length of time spent to recruit these employees was 90 days. The average recruiting costs measured as a percentage of first-year compensation were 20%, yielding:• Average relative recruitment time = 1 – (90/365) = 0.753425• Average relative recruitment cost = 1 – 0.20 = 0.8
Recruitment Effectiveness Index = 0.753425 X 0.8 = 60%
ExampleExample
During the past 12 months, ABC Computers hired 260 employees. The average length of time spent to recruit these employees was 90 days. The average recruiting costs measured as a percentage of first-year compensation were 20%, yielding:• Average relative recruitment time = 1 – (90/365) = 0.753425• Average relative recruitment cost = 1 – 0.20 = 0.8
Recruitment Effectiveness Index = 0.753425 X 0.8 = 60%
Definition The Recruitment Effectiveness Index shows the ability of the organization to obtain qualified candidates for open positions, taking into account time and cost.DefinitionDefinition The Recruitment Effectiveness Index shows the ability of the organization to obtain qualified candidates for open positions, taking into account time and cost.
Calculation
Recruitment Effectiveness Index =Average relative recruitment time X average relative recruitment cost
Where• Relative recruitment time = 1 – (time from approval to hire/365)• Relative recruitment cost = 1 – (total recruitment cost ÷ 1st year compensation)
CalculationCalculation
Recruitment Effectiveness Index =Average relative recruitment time X average relative recruitment cost
Where• Relative recruitment time = 1 – (time from approval to hire/365)• Relative recruitment cost = 1 – (total recruitment cost ÷ 1st year compensation)
PotentiallyAffectedPrimes
Sales Cycle Index, Sales Close Index, Forecast Accuracy, Time-to-Market Index, R&D Success Index, On-Time Delivery, Order Fill Rate, Material Quality, Service Accuracy, Supplier On-Time Delivery, Supplier Order Fill Rate, Supplier Material Quality, Supplier Service Accuracy, Cash-to-Cash Cycle Time, Conversion Cost and Asset Utilization
PotentiallyAffectedPrimes
PotentiallyAffectedPrimes
Sales Cycle Index, Sales Close Index, Forecast Accuracy, Time-to-Market Index, R&D Success Index, On-Time Delivery, Order Fill Rate, Material Quality, Service Accuracy, Supplier On-Time Delivery, Supplier Order Fill Rate, Supplier Material Quality, Supplier Service Accuracy, Cash-to-Cash Cycle Time, Conversion Cost and Asset Utilization
ApplicationsRecruitment costs are a significant cost in most organizations. The income statement accounts most affected by Recruitment Effectiveness Index are revenue and operating expense.
ApplicationsApplicationsRecruitment costs are a significant cost in most organizations. The income statement accounts most affected by Recruitment Effectiveness Index are revenue and operating expense.
Source: Gartner (May 2006)
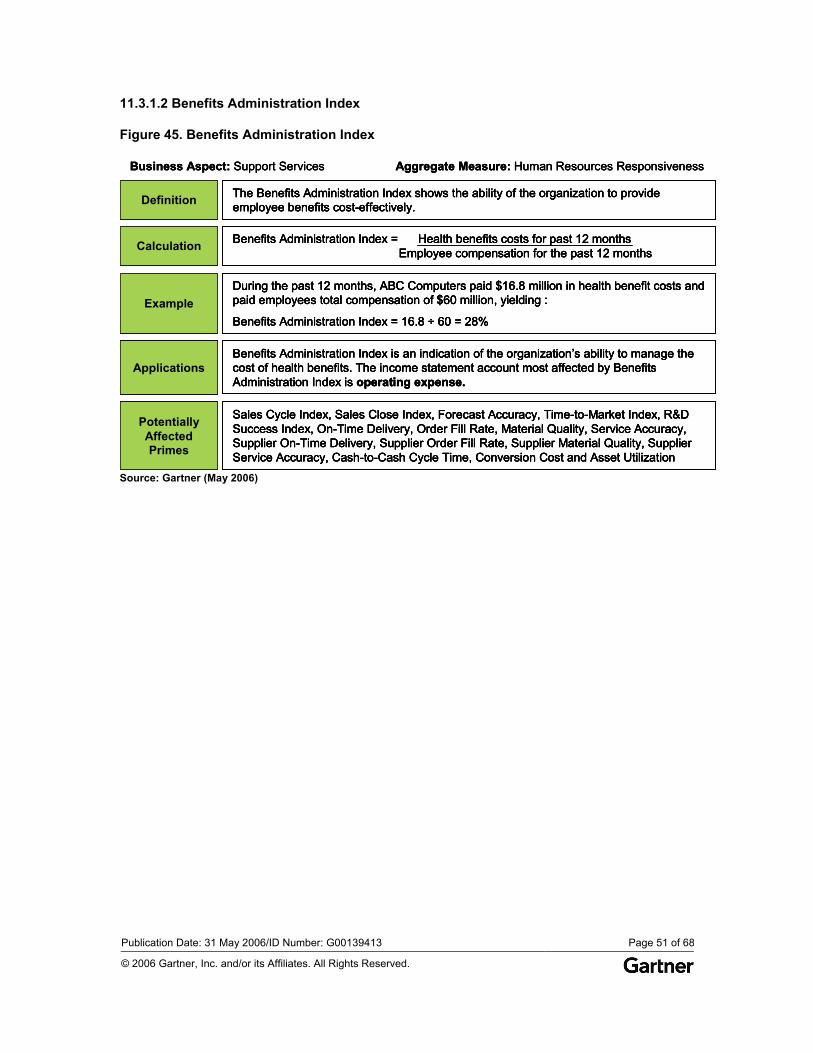
Publication Date: 31 May 2006/ID Number: G00139413 Page 51 of 68
© 2006 Gartner, Inc. and/or its Affiliates. All Rights Reserved.
11.3.1.2 Benefits Administration Index
Figure 45. Benefits Administration Index
Business Aspect: Support Services Aggregate Measure: Human Resources Responsiveness
ExampleDuring the past 12 months, ABC Computers paid $16.8 million in health benefit costs and paid employees total compensation of $60 million, yielding :
Benefits Administration Index = 16.8 ÷ 60 = 28%
Definition The Benefits Administration Index shows the ability of the organization to provide employee benefits cost-effectively.
Calculation Benefits Administration Index = Health benefits costs for past 12 monthsEmployee compensation for the past 12 months
PotentiallyAffectedPrimes
Sales Cycle Index, Sales Close Index, Forecast Accuracy, Time-to-Market Index, R&D Success Index, On-Time Delivery, Order Fill Rate, Material Quality, Service Accuracy, Supplier On-Time Delivery, Supplier Order Fill Rate, Supplier Material Quality, Supplier Service Accuracy, Cash-to-Cash Cycle Time, Conversion Cost and Asset Utilization
ApplicationsBenefits Administration Index is an indication of the organization’s ability to manage the cost of health benefits. The income statement account most affected by Benefits Administration Index is operating expense.
Business Aspect: Support Services Aggregate Measure: Human Resources Responsiveness
ExampleDuring the past 12 months, ABC Computers paid $16.8 million in health benefit costs and paid employees total compensation of $60 million, yielding :
Benefits Administration Index = 16.8 ÷ 60 = 28%ExampleExample
During the past 12 months, ABC Computers paid $16.8 million in health benefit costs and paid employees total compensation of $60 million, yielding :
Benefits Administration Index = 16.8 ÷ 60 = 28%
Definition The Benefits Administration Index shows the ability of the organization to provide employee benefits cost-effectively. DefinitionDefinition The Benefits Administration Index shows the ability of the organization to provide employee benefits cost-effectively.
Calculation Benefits Administration Index = Health benefits costs for past 12 monthsEmployee compensation for the past 12 monthsCalculationCalculation Benefits Administration Index = Health benefits costs for past 12 monthsEmployee compensation for the past 12 months
PotentiallyAffectedPrimes
Sales Cycle Index, Sales Close Index, Forecast Accuracy, Time-to-Market Index, R&D Success Index, On-Time Delivery, Order Fill Rate, Material Quality, Service Accuracy, Supplier On-Time Delivery, Supplier Order Fill Rate, Supplier Material Quality, Supplier Service Accuracy, Cash-to-Cash Cycle Time, Conversion Cost and Asset Utilization
PotentiallyAffectedPrimes
PotentiallyAffectedPrimes
Sales Cycle Index, Sales Close Index, Forecast Accuracy, Time-to-Market Index, R&D Success Index, On-Time Delivery, Order Fill Rate, Material Quality, Service Accuracy, Supplier On-Time Delivery, Supplier Order Fill Rate, Supplier Material Quality, Supplier Service Accuracy, Cash-to-Cash Cycle Time, Conversion Cost and Asset Utilization
ApplicationsBenefits Administration Index is an indication of the organization’s ability to manage the cost of health benefits. The income statement account most affected by Benefits Administration Index is operating expense.
ApplicationsApplicationsBenefits Administration Index is an indication of the organization’s ability to manage the cost of health benefits. The income statement account most affected by Benefits Administration Index is operating expense.
Source: Gartner (May 2006)
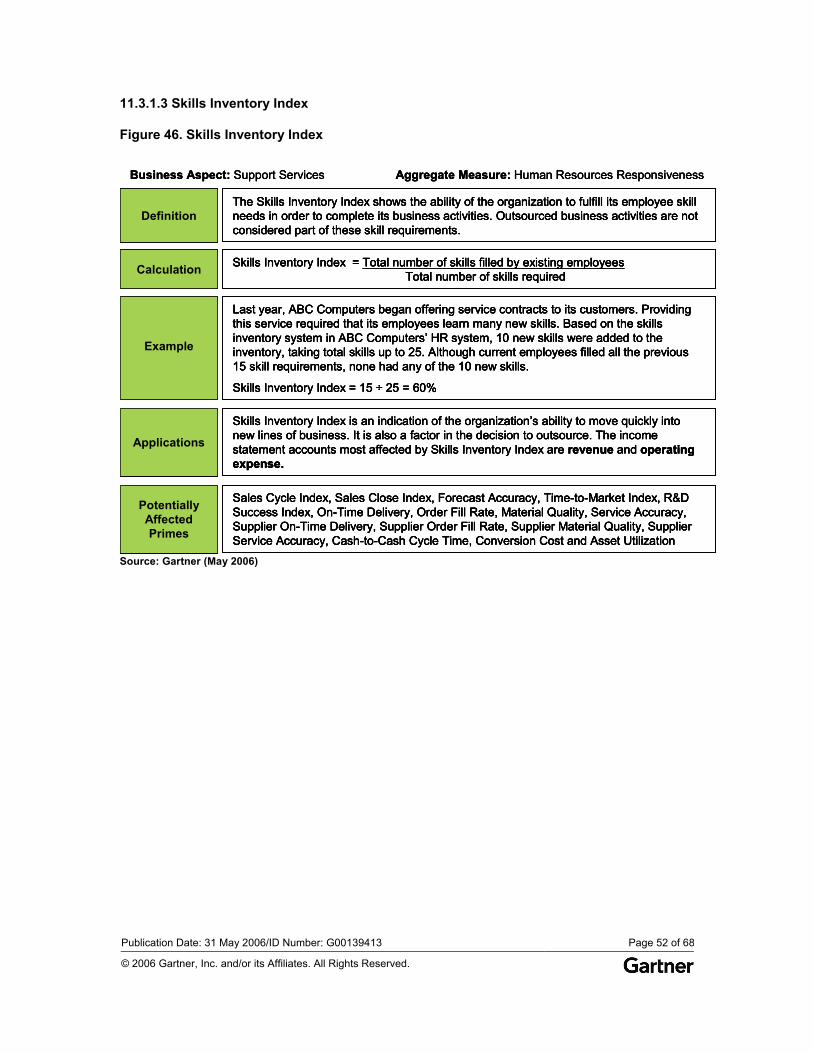
Publication Date: 31 May 2006/ID Number: G00139413 Page 52 of 68
© 2006 Gartner, Inc. and/or its Affiliates. All Rights Reserved.
11.3.1.3 Skills Inventory Index
Figure 46. Skills Inventory Index
Business Aspect: Support Services Aggregate Measure: Human Resources Responsiveness
Example
Last year, ABC Computers began offering service contracts to its customers. Providing this service required that its employees learn many new skills. Based on the skills inventory system in ABC Computers’ HR system, 10 new skills were added to the inventory, taking total skills up to 25. Although current employees filled all the previous 15 skill requirements, none had any of the 10 new skills.
Skills Inventory Index = 15 ÷ 25 = 60%
DefinitionThe Skills Inventory Index shows the ability of the organization to fulfill its employee skill needs in order to complete its business activities. Outsourced business activities are not considered part of these skill requirements.
Calculation Skills Inventory Index = Total number of skills filled by existing employeesTotal number of skills required
PotentiallyAffectedPrimes
Sales Cycle Index, Sales Close Index, Forecast Accuracy, Time-to-Market Index, R&D Success Index, On-Time Delivery, Order Fill Rate, Material Quality, Service Accuracy, Supplier On-Time Delivery, Supplier Order Fill Rate, Supplier Material Quality, Supplier Service Accuracy, Cash-to-Cash Cycle Time, Conversion Cost and Asset Utilization
Applications
Skills Inventory Index is an indication of the organization’s ability to move quickly into new lines of business. It is also a factor in the decision to outsource. The income statement accounts most affected by Skills Inventory Index are revenue and operating expense.
Business Aspect: Support Services Aggregate Measure: Human Resources Responsiveness
Example
Last year, ABC Computers began offering service contracts to its customers. Providing this service required that its employees learn many new skills. Based on the skills inventory system in ABC Computers’ HR system, 10 new skills were added to the inventory, taking total skills up to 25. Although current employees filled all the previous 15 skill requirements, none had any of the 10 new skills.
Skills Inventory Index = 15 ÷ 25 = 60%
ExampleExample
Last year, ABC Computers began offering service contracts to its customers. Providing this service required that its employees learn many new skills. Based on the skills inventory system in ABC Computers’ HR system, 10 new skills were added to the inventory, taking total skills up to 25. Although current employees filled all the previous 15 skill requirements, none had any of the 10 new skills.
Skills Inventory Index = 15 ÷ 25 = 60%
DefinitionThe Skills Inventory Index shows the ability of the organization to fulfill its employee skill needs in order to complete its business activities. Outsourced business activities are not considered part of these skill requirements.
DefinitionDefinitionThe Skills Inventory Index shows the ability of the organization to fulfill its employee skill needs in order to complete its business activities. Outsourced business activities are not considered part of these skill requirements.
Calculation Skills Inventory Index = Total number of skills filled by existing employeesTotal number of skills requiredCalculationCalculation Skills Inventory Index = Total number of skills filled by existing employeesTotal number of skills required
PotentiallyAffectedPrimes
Sales Cycle Index, Sales Close Index, Forecast Accuracy, Time-to-Market Index, R&D Success Index, On-Time Delivery, Order Fill Rate, Material Quality, Service Accuracy, Supplier On-Time Delivery, Supplier Order Fill Rate, Supplier Material Quality, Supplier Service Accuracy, Cash-to-Cash Cycle Time, Conversion Cost and Asset Utilization
PotentiallyAffectedPrimes
PotentiallyAffectedPrimes
Sales Cycle Index, Sales Close Index, Forecast Accuracy, Time-to-Market Index, R&D Success Index, On-Time Delivery, Order Fill Rate, Material Quality, Service Accuracy, Supplier On-Time Delivery, Supplier Order Fill Rate, Supplier Material Quality, Supplier Service Accuracy, Cash-to-Cash Cycle Time, Conversion Cost and Asset Utilization
Applications
Skills Inventory Index is an indication of the organization’s ability to move quickly into new lines of business. It is also a factor in the decision to outsource. The income statement accounts most affected by Skills Inventory Index are revenue and operating expense.
ApplicationsApplications
Skills Inventory Index is an indication of the organization’s ability to move quickly into new lines of business. It is also a factor in the decision to outsource. The income statement accounts most affected by Skills Inventory Index are revenue and operating expense.
Source: Gartner (May 2006)
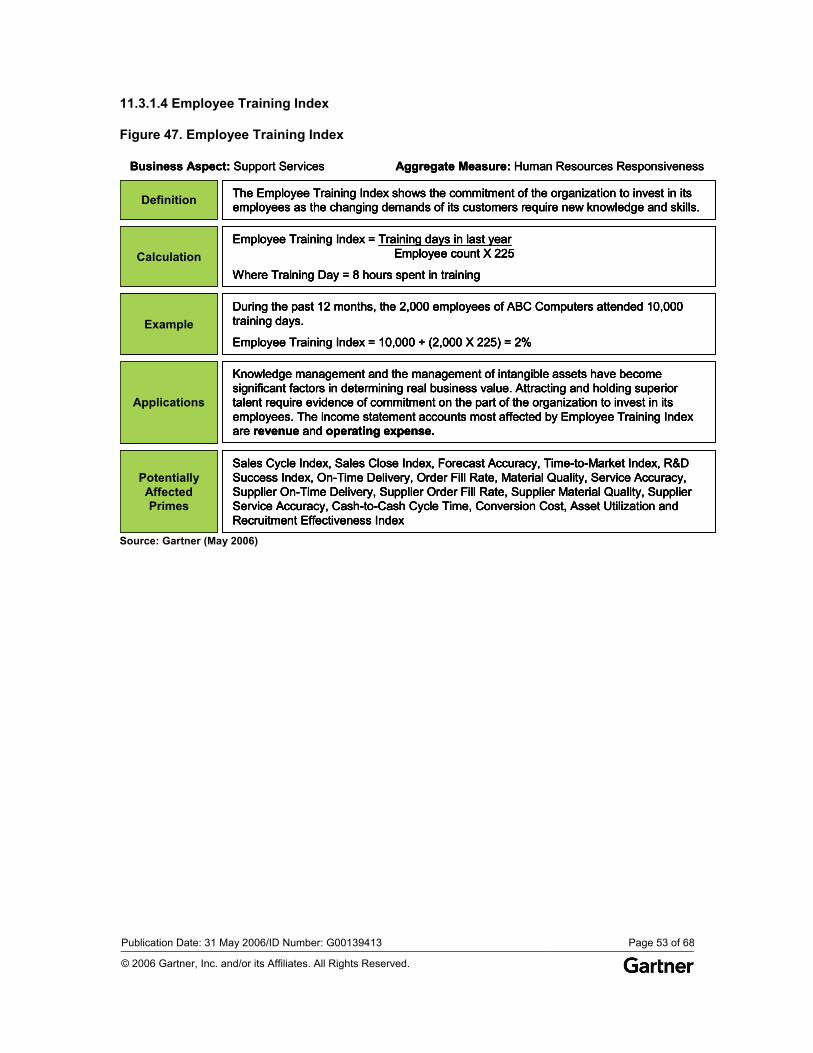
Publication Date: 31 May 2006/ID Number: G00139413 Page 53 of 68
© 2006 Gartner, Inc. and/or its Affiliates. All Rights Reserved.
11.3.1.4 Employee Training Index
Figure 47. Employee Training Index
Business Aspect: Support Services Aggregate Measure: Human Resources Responsiveness
ExampleDuring the past 12 months, the 2,000 employees of ABC Computers attended 10,000 training days.
Employee Training Index = 10,000 ÷ (2,000 X 225) = 2%
Definition The Employee Training Index shows the commitment of the organization to invest in its employees as the changing demands of its customers require new knowledge and skills.
CalculationEmployee Training Index = Training days in last year
Employee count X 225
Where Training Day = 8 hours spent in training
PotentiallyAffectedPrimes
Sales Cycle Index, Sales Close Index, Forecast Accuracy, Time-to-Market Index, R&D Success Index, On-Time Delivery, Order Fill Rate, Material Quality, Service Accuracy, Supplier On-Time Delivery, Supplier Order Fill Rate, Supplier Material Quality, Supplier Service Accuracy, Cash-to-Cash Cycle Time, Conversion Cost, Asset Utilization and Recruitment Effectiveness Index
Applications
Knowledge management and the management of intangible assets have become significant factors in determining real business value. Attracting and holding superior talent require evidence of commitment on the part of the organization to invest in its employees. The income statement accounts most affected by Employee Training Index are revenue and operating expense.
Business Aspect: Support Services Aggregate Measure: Human Resources Responsiveness
ExampleDuring the past 12 months, the 2,000 employees of ABC Computers attended 10,000 training days.
Employee Training Index = 10,000 ÷ (2,000 X 225) = 2% ExampleExample
During the past 12 months, the 2,000 employees of ABC Computers attended 10,000 training days.
Employee Training Index = 10,000 ÷ (2,000 X 225) = 2%
Definition The Employee Training Index shows the commitment of the organization to invest in its employees as the changing demands of its customers require new knowledge and skills.DefinitionDefinition The Employee Training Index shows the commitment of the organization to invest in its employees as the changing demands of its customers require new knowledge and skills.
CalculationEmployee Training Index = Training days in last year
Employee count X 225
Where Training Day = 8 hours spent in training CalculationCalculation
Employee Training Index = Training days in last yearEmployee count X 225
Where Training Day = 8 hours spent in training
PotentiallyAffectedPrimes
Sales Cycle Index, Sales Close Index, Forecast Accuracy, Time-to-Market Index, R&D Success Index, On-Time Delivery, Order Fill Rate, Material Quality, Service Accuracy, Supplier On-Time Delivery, Supplier Order Fill Rate, Supplier Material Quality, Supplier Service Accuracy, Cash-to-Cash Cycle Time, Conversion Cost, Asset Utilization and Recruitment Effectiveness Index
PotentiallyAffectedPrimes
PotentiallyAffectedPrimes
Sales Cycle Index, Sales Close Index, Forecast Accuracy, Time-to-Market Index, R&D Success Index, On-Time Delivery, Order Fill Rate, Material Quality, Service Accuracy, Supplier On-Time Delivery, Supplier Order Fill Rate, Supplier Material Quality, Supplier Service Accuracy, Cash-to-Cash Cycle Time, Conversion Cost, Asset Utilization and Recruitment Effectiveness Index
Applications
Knowledge management and the management of intangible assets have become significant factors in determining real business value. Attracting and holding superior talent require evidence of commitment on the part of the organization to invest in its employees. The income statement accounts most affected by Employee Training Index are revenue and operating expense.
ApplicationsApplications
Knowledge management and the management of intangible assets have become significant factors in determining real business value. Attracting and holding superior talent require evidence of commitment on the part of the organization to invest in its employees. The income statement accounts most affected by Employee Training Index are revenue and operating expense.
Source: Gartner (May 2006)
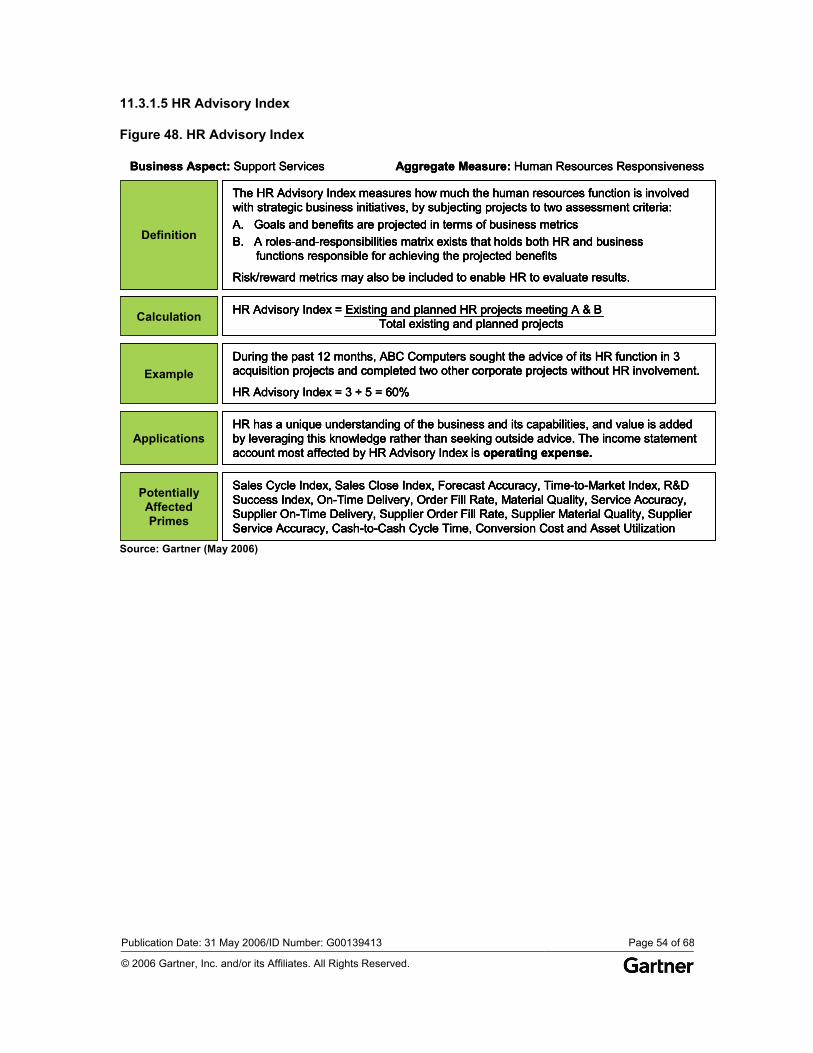
Publication Date: 31 May 2006/ID Number: G00139413 Page 54 of 68
© 2006 Gartner, Inc. and/or its Affiliates. All Rights Reserved.
11.3.1.5 HR Advisory Index
Figure 48. HR Advisory Index
Business Aspect: Support Services Aggregate Measure: Human Resources Responsiveness
ExampleDuring the past 12 months, ABC Computers sought the advice of its HR function in 3 acquisition projects and completed two other corporate projects without HR involvement.
HR Advisory Index = 3 ÷ 5 = 60%
Definition
The HR Advisory Index measures how much the human resources function is involved with strategic business initiatives, by subjecting projects to two assessment criteria:A. Goals and benefits are projected in terms of business metricsB. A roles-and-responsibilities matrix exists that holds both HR and business
functions responsible for achieving the projected benefits
Risk/reward metrics may also be included to enable HR to evaluate results.
Calculation HR Advisory Index = Existing and planned HR projects meeting A & BTotal existing and planned projects
PotentiallyAffectedPrimes
Sales Cycle Index, Sales Close Index, Forecast Accuracy, Time-to-Market Index, R&D Success Index, On-Time Delivery, Order Fill Rate, Material Quality, Service Accuracy, Supplier On-Time Delivery, Supplier Order Fill Rate, Supplier Material Quality, Supplier Service Accuracy, Cash-to-Cash Cycle Time, Conversion Cost and Asset Utilization
ApplicationsHR has a unique understanding of the business and its capabilities, and value is added by leveraging this knowledge rather than seeking outside advice. The income statement account most affected by HR Advisory Index is operating expense.
Business Aspect: Support Services Aggregate Measure: Human Resources Responsiveness
ExampleDuring the past 12 months, ABC Computers sought the advice of its HR function in 3 acquisition projects and completed two other corporate projects without HR involvement.
HR Advisory Index = 3 ÷ 5 = 60% ExampleExample
During the past 12 months, ABC Computers sought the advice of its HR function in 3 acquisition projects and completed two other corporate projects without HR involvement.
HR Advisory Index = 3 ÷ 5 = 60%
Definition
The HR Advisory Index measures how much the human resources function is involved with strategic business initiatives, by subjecting projects to two assessment criteria:A. Goals and benefits are projected in terms of business metricsB. A roles-and-responsibilities matrix exists that holds both HR and business
functions responsible for achieving the projected benefits
Risk/reward metrics may also be included to enable HR to evaluate results.
DefinitionDefinition
The HR Advisory Index measures how much the human resources function is involved with strategic business initiatives, by subjecting projects to two assessment criteria:A. Goals and benefits are projected in terms of business metricsB. A roles-and-responsibilities matrix exists that holds both HR and business
functions responsible for achieving the projected benefits
Risk/reward metrics may also be included to enable HR to evaluate results.
Calculation HR Advisory Index = Existing and planned HR projects meeting A & BTotal existing and planned projects CalculationCalculation HR Advisory Index = Existing and planned HR projects meeting A & BTotal existing and planned projects
PotentiallyAffectedPrimes
Sales Cycle Index, Sales Close Index, Forecast Accuracy, Time-to-Market Index, R&D Success Index, On-Time Delivery, Order Fill Rate, Material Quality, Service Accuracy, Supplier On-Time Delivery, Supplier Order Fill Rate, Supplier Material Quality, Supplier Service Accuracy, Cash-to-Cash Cycle Time, Conversion Cost and Asset Utilization
PotentiallyAffectedPrimes
PotentiallyAffectedPrimes
Sales Cycle Index, Sales Close Index, Forecast Accuracy, Time-to-Market Index, R&D Success Index, On-Time Delivery, Order Fill Rate, Material Quality, Service Accuracy, Supplier On-Time Delivery, Supplier Order Fill Rate, Supplier Material Quality, Supplier Service Accuracy, Cash-to-Cash Cycle Time, Conversion Cost and Asset Utilization
ApplicationsHR has a unique understanding of the business and its capabilities, and value is added by leveraging this knowledge rather than seeking outside advice. The income statement account most affected by HR Advisory Index is operating expense.
ApplicationsApplicationsHR has a unique understanding of the business and its capabilities, and value is added by leveraging this knowledge rather than seeking outside advice. The income statement account most affected by HR Advisory Index is operating expense.
Source: Gartner (May 2006)
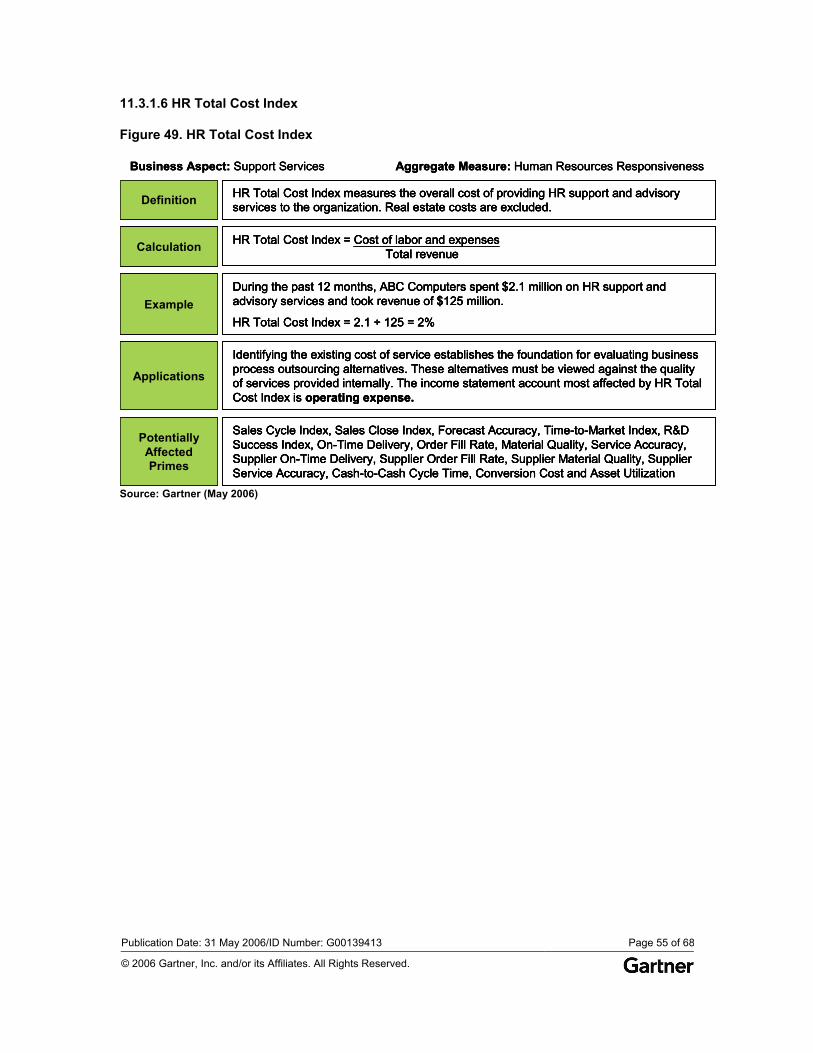
Publication Date: 31 May 2006/ID Number: G00139413 Page 55 of 68
© 2006 Gartner, Inc. and/or its Affiliates. All Rights Reserved.
11.3.1.6 HR Total Cost Index
Figure 49. HR Total Cost Index
Business Aspect: Support Services Aggregate Measure: Human Resources Responsiveness
ExampleDuring the past 12 months, ABC Computers spent $2.1 million on HR support and advisory services and took revenue of $125 million.
HR Total Cost Index = 2.1 ÷ 125 = 2%
Definition HR Total Cost Index measures the overall cost of providing HR support and advisory services to the organization. Real estate costs are excluded.
Calculation HR Total Cost Index = Cost of labor and expensesTotal revenue
PotentiallyAffectedPrimes
Sales Cycle Index, Sales Close Index, Forecast Accuracy, Time-to-Market Index, R&D Success Index, On-Time Delivery, Order Fill Rate, Material Quality, Service Accuracy, Supplier On-Time Delivery, Supplier Order Fill Rate, Supplier Material Quality, Supplier Service Accuracy, Cash-to-Cash Cycle Time, Conversion Cost and Asset Utilization
Applications
Identifying the existing cost of service establishes the foundation for evaluating business process outsourcing alternatives. These alternatives must be viewed against the quality of services provided internally. The income statement account most affected by HR Total Cost Index is operating expense.
Business Aspect: Support Services Aggregate Measure: Human Resources Responsiveness
ExampleDuring the past 12 months, ABC Computers spent $2.1 million on HR support and advisory services and took revenue of $125 million.
HR Total Cost Index = 2.1 ÷ 125 = 2%ExampleExample
During the past 12 months, ABC Computers spent $2.1 million on HR support and advisory services and took revenue of $125 million.
HR Total Cost Index = 2.1 ÷ 125 = 2%
Definition HR Total Cost Index measures the overall cost of providing HR support and advisory services to the organization. Real estate costs are excluded. DefinitionDefinition HR Total Cost Index measures the overall cost of providing HR support and advisory services to the organization. Real estate costs are excluded.
Calculation HR Total Cost Index = Cost of labor and expensesTotal revenueCalculationCalculation HR Total Cost Index = Cost of labor and expensesTotal revenue
PotentiallyAffectedPrimes
Sales Cycle Index, Sales Close Index, Forecast Accuracy, Time-to-Market Index, R&D Success Index, On-Time Delivery, Order Fill Rate, Material Quality, Service Accuracy, Supplier On-Time Delivery, Supplier Order Fill Rate, Supplier Material Quality, Supplier Service Accuracy, Cash-to-Cash Cycle Time, Conversion Cost and Asset Utilization
PotentiallyAffectedPrimes
PotentiallyAffectedPrimes
Sales Cycle Index, Sales Close Index, Forecast Accuracy, Time-to-Market Index, R&D Success Index, On-Time Delivery, Order Fill Rate, Material Quality, Service Accuracy, Supplier On-Time Delivery, Supplier Order Fill Rate, Supplier Material Quality, Supplier Service Accuracy, Cash-to-Cash Cycle Time, Conversion Cost and Asset Utilization
Applications
Identifying the existing cost of service establishes the foundation for evaluating business process outsourcing alternatives. These alternatives must be viewed against the quality of services provided internally. The income statement account most affected by HR Total Cost Index is operating expense.
ApplicationsApplications
Identifying the existing cost of service establishes the foundation for evaluating business process outsourcing alternatives. These alternatives must be viewed against the quality of services provided internally. The income statement account most affected by HR Total Cost Index is operating expense.
Source: Gartner (May 2006)
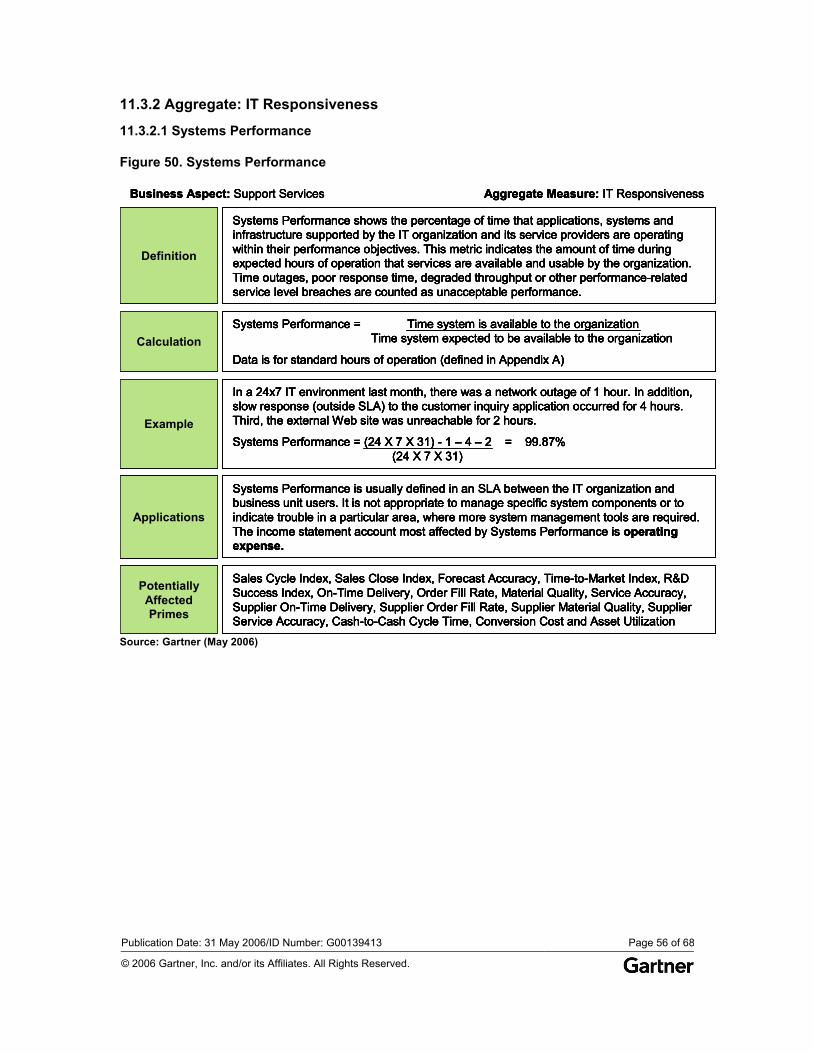
Publication Date: 31 May 2006/ID Number: G00139413 Page 56 of 68
© 2006 Gartner, Inc. and/or its Affiliates. All Rights Reserved.
11.3.2 Aggregate: IT Responsiveness
11.3.2.1 Systems Performance
Figure 50. Systems Performance
Business Aspect: Support Services Aggregate Measure: IT Responsiveness
Example
In a 24x7 IT environment last month, there was a network outage of 1 hour. In addition, slow response (outside SLA) to the customer inquiry application occurred for 4 hours. Third, the external Web site was unreachable for 2 hours.
Systems Performance = (24 X 7 X 31) - 1 – 4 – 2 = 99.87%(24 X 7 X 31)
Definition
Systems Performance shows the percentage of time that applications, systems and infrastructure supported by the IT organization and its service providers are operating within their performance objectives. This metric indicates the amount of time during expected hours of operation that services are available and usable by the organization. Time outages, poor response time, degraded throughput or other performance-related service level breaches are counted as unacceptable performance.
CalculationSystems Performance = Time system is available to the organization
Time system expected to be available to the organization
Data is for standard hours of operation (defined in Appendix A)
PotentiallyAffectedPrimes
Sales Cycle Index, Sales Close Index, Forecast Accuracy, Time-to-Market Index, R&D Success Index, On-Time Delivery, Order Fill Rate, Material Quality, Service Accuracy, Supplier On-Time Delivery, Supplier Order Fill Rate, Supplier Material Quality, Supplier Service Accuracy, Cash-to-Cash Cycle Time, Conversion Cost and Asset Utilization
Applications
Systems Performance is usually defined in an SLA between the IT organization and business unit users. It is not appropriate to manage specific system components or to indicate trouble in a particular area, where more system management tools are required. The income statement account most affected by Systems Performance is operating expense.
Business Aspect: Support Services Aggregate Measure: IT Responsiveness
Example
In a 24x7 IT environment last month, there was a network outage of 1 hour. In addition, slow response (outside SLA) to the customer inquiry application occurred for 4 hours. Third, the external Web site was unreachable for 2 hours.
Systems Performance = (24 X 7 X 31) - 1 – 4 – 2 = 99.87%(24 X 7 X 31)
ExampleExample
In a 24x7 IT environment last month, there was a network outage of 1 hour. In addition, slow response (outside SLA) to the customer inquiry application occurred for 4 hours. Third, the external Web site was unreachable for 2 hours.
Systems Performance = (24 X 7 X 31) - 1 – 4 – 2 = 99.87%(24 X 7 X 31)
Definition
Systems Performance shows the percentage of time that applications, systems and infrastructure supported by the IT organization and its service providers are operating within their performance objectives. This metric indicates the amount of time during expected hours of operation that services are available and usable by the organization. Time outages, poor response time, degraded throughput or other performance-related service level breaches are counted as unacceptable performance.
DefinitionDefinition
Systems Performance shows the percentage of time that applications, systems and infrastructure supported by the IT organization and its service providers are operating within their performance objectives. This metric indicates the amount of time during expected hours of operation that services are available and usable by the organization. Time outages, poor response time, degraded throughput or other performance-related service level breaches are counted as unacceptable performance.
CalculationSystems Performance = Time system is available to the organization
Time system expected to be available to the organization
Data is for standard hours of operation (defined in Appendix A) CalculationCalculation
Systems Performance = Time system is available to the organizationTime system expected to be available to the organization
Data is for standard hours of operation (defined in Appendix A)
PotentiallyAffectedPrimes
Sales Cycle Index, Sales Close Index, Forecast Accuracy, Time-to-Market Index, R&D Success Index, On-Time Delivery, Order Fill Rate, Material Quality, Service Accuracy, Supplier On-Time Delivery, Supplier Order Fill Rate, Supplier Material Quality, Supplier Service Accuracy, Cash-to-Cash Cycle Time, Conversion Cost and Asset Utilization
PotentiallyAffectedPrimes
PotentiallyAffectedPrimes
Sales Cycle Index, Sales Close Index, Forecast Accuracy, Time-to-Market Index, R&D Success Index, On-Time Delivery, Order Fill Rate, Material Quality, Service Accuracy, Supplier On-Time Delivery, Supplier Order Fill Rate, Supplier Material Quality, Supplier Service Accuracy, Cash-to-Cash Cycle Time, Conversion Cost and Asset Utilization
Applications
Systems Performance is usually defined in an SLA between the IT organization and business unit users. It is not appropriate to manage specific system components or to indicate trouble in a particular area, where more system management tools are required. The income statement account most affected by Systems Performance is operating expense.
ApplicationsApplications
Systems Performance is usually defined in an SLA between the IT organization and business unit users. It is not appropriate to manage specific system components or to indicate trouble in a particular area, where more system management tools are required. The income statement account most affected by Systems Performance is operating expense.
Source: Gartner (May 2006)
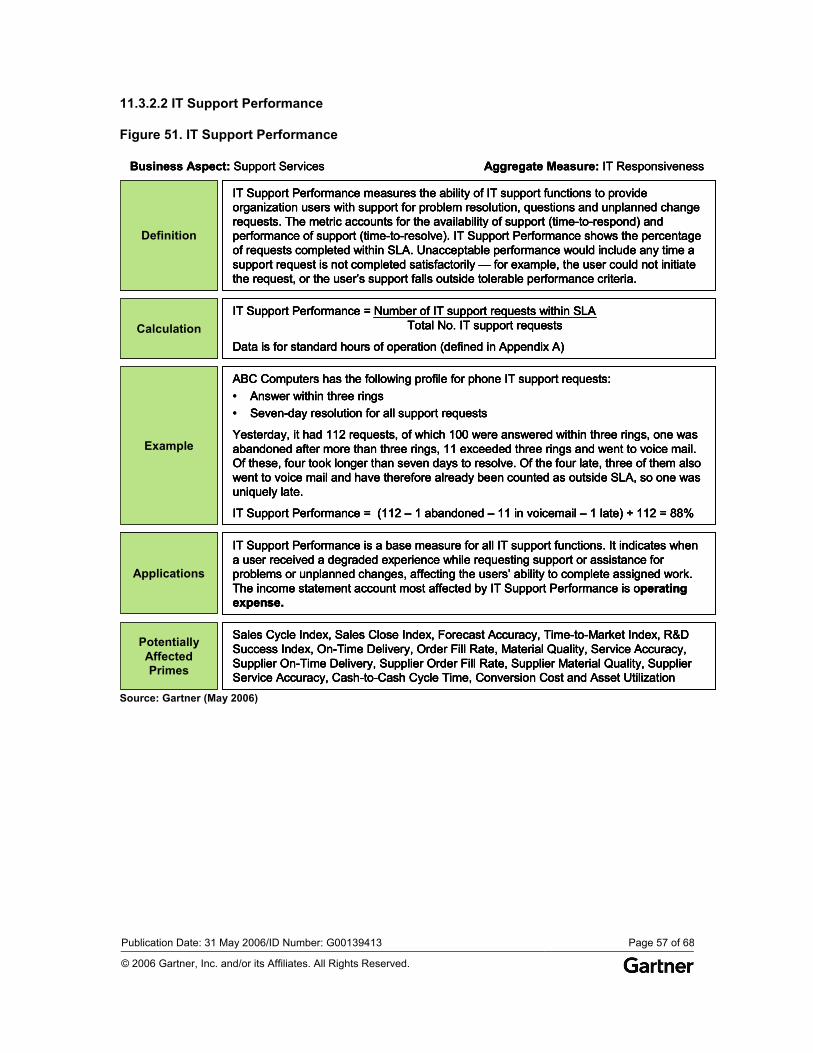
Publication Date: 31 May 2006/ID Number: G00139413 Page 57 of 68
© 2006 Gartner, Inc. and/or its Affiliates. All Rights Reserved.
11.3.2.2 IT Support Performance
Figure 51. IT Support Performance
Business Aspect: Support Services Aggregate Measure: IT Responsiveness
Example
ABC Computers has the following profile for phone IT support requests:• Answer within three rings• Seven-day resolution for all support requests
Yesterday, it had 112 requests, of which 100 were answered within three rings, one was abandoned after more than three rings, 11 exceeded three rings and went to voice mail. Of these, four took longer than seven days to resolve. Of the four late, three of them also went to voice mail and have therefore already been counted as outside SLA, so one was uniquely late.
IT Support Performance = (112 – 1 abandoned – 11 in voicemail – 1 late) ÷ 112 = 88%
Definition
IT Support Performance measures the ability of IT support functions to provide organization users with support for problem resolution, questions and unplanned change requests. The metric accounts for the availability of support (time-to-respond) and performance of support (time-to-resolve). IT Support Performance shows the percentage of requests completed within SLA. Unacceptable performance would include any time a support request is not completed satisfactorily — for example, the user could not initiate the request, or the user’s support falls outside tolerable performance criteria.
CalculationIT Support Performance = Number of IT support requests within SLA
Total No. IT support requests
Data is for standard hours of operation (defined in Appendix A)
PotentiallyAffectedPrimes
Sales Cycle Index, Sales Close Index, Forecast Accuracy, Time-to-Market Index, R&D Success Index, On-Time Delivery, Order Fill Rate, Material Quality, Service Accuracy, Supplier On-Time Delivery, Supplier Order Fill Rate, Supplier Material Quality, Supplier Service Accuracy, Cash-to-Cash Cycle Time, Conversion Cost and Asset Utilization
Applications
IT Support Performance is a base measure for all IT support functions. It indicates when a user received a degraded experience while requesting support or assistance for problems or unplanned changes, affecting the users’ ability to complete assigned work. The income statement account most affected by IT Support Performance is operating expense.
Business Aspect: Support Services Aggregate Measure: IT Responsiveness
Example
ABC Computers has the following profile for phone IT support requests:• Answer within three rings• Seven-day resolution for all support requests
Yesterday, it had 112 requests, of which 100 were answered within three rings, one was abandoned after more than three rings, 11 exceeded three rings and went to voice mail. Of these, four took longer than seven days to resolve. Of the four late, three of them also went to voice mail and have therefore already been counted as outside SLA, so one was uniquely late.
IT Support Performance = (112 – 1 abandoned – 11 in voicemail – 1 late) ÷ 112 = 88%
ExampleExample
ABC Computers has the following profile for phone IT support requests:• Answer within three rings• Seven-day resolution for all support requests
Yesterday, it had 112 requests, of which 100 were answered within three rings, one was abandoned after more than three rings, 11 exceeded three rings and went to voice mail. Of these, four took longer than seven days to resolve. Of the four late, three of them also went to voice mail and have therefore already been counted as outside SLA, so one was uniquely late.
IT Support Performance = (112 – 1 abandoned – 11 in voicemail – 1 late) ÷ 112 = 88%
Definition
IT Support Performance measures the ability of IT support functions to provide organization users with support for problem resolution, questions and unplanned change requests. The metric accounts for the availability of support (time-to-respond) and performance of support (time-to-resolve). IT Support Performance shows the percentage of requests completed within SLA. Unacceptable performance would include any time a support request is not completed satisfactorily — for example, the user could not initiate the request, or the user’s support falls outside tolerable performance criteria.
DefinitionDefinition
IT Support Performance measures the ability of IT support functions to provide organization users with support for problem resolution, questions and unplanned change requests. The metric accounts for the availability of support (time-to-respond) and performance of support (time-to-resolve). IT Support Performance shows the percentage of requests completed within SLA. Unacceptable performance would include any time a support request is not completed satisfactorily — for example, the user could not initiate the request, or the user’s support falls outside tolerable performance criteria.
CalculationIT Support Performance = Number of IT support requests within SLA
Total No. IT support requests
Data is for standard hours of operation (defined in Appendix A) CalculationCalculation
IT Support Performance = Number of IT support requests within SLATotal No. IT support requests
Data is for standard hours of operation (defined in Appendix A)
PotentiallyAffectedPrimes
Sales Cycle Index, Sales Close Index, Forecast Accuracy, Time-to-Market Index, R&D Success Index, On-Time Delivery, Order Fill Rate, Material Quality, Service Accuracy, Supplier On-Time Delivery, Supplier Order Fill Rate, Supplier Material Quality, Supplier Service Accuracy, Cash-to-Cash Cycle Time, Conversion Cost and Asset Utilization
PotentiallyAffectedPrimes
PotentiallyAffectedPrimes
Sales Cycle Index, Sales Close Index, Forecast Accuracy, Time-to-Market Index, R&D Success Index, On-Time Delivery, Order Fill Rate, Material Quality, Service Accuracy, Supplier On-Time Delivery, Supplier Order Fill Rate, Supplier Material Quality, Supplier Service Accuracy, Cash-to-Cash Cycle Time, Conversion Cost and Asset Utilization
Applications
IT Support Performance is a base measure for all IT support functions. It indicates when a user received a degraded experience while requesting support or assistance for problems or unplanned changes, affecting the users’ ability to complete assigned work. The income statement account most affected by IT Support Performance is operating expense.
ApplicationsApplications
IT Support Performance is a base measure for all IT support functions. It indicates when a user received a degraded experience while requesting support or assistance for problems or unplanned changes, affecting the users’ ability to complete assigned work. The income statement account most affected by IT Support Performance is operating expense.
Source: Gartner (May 2006)
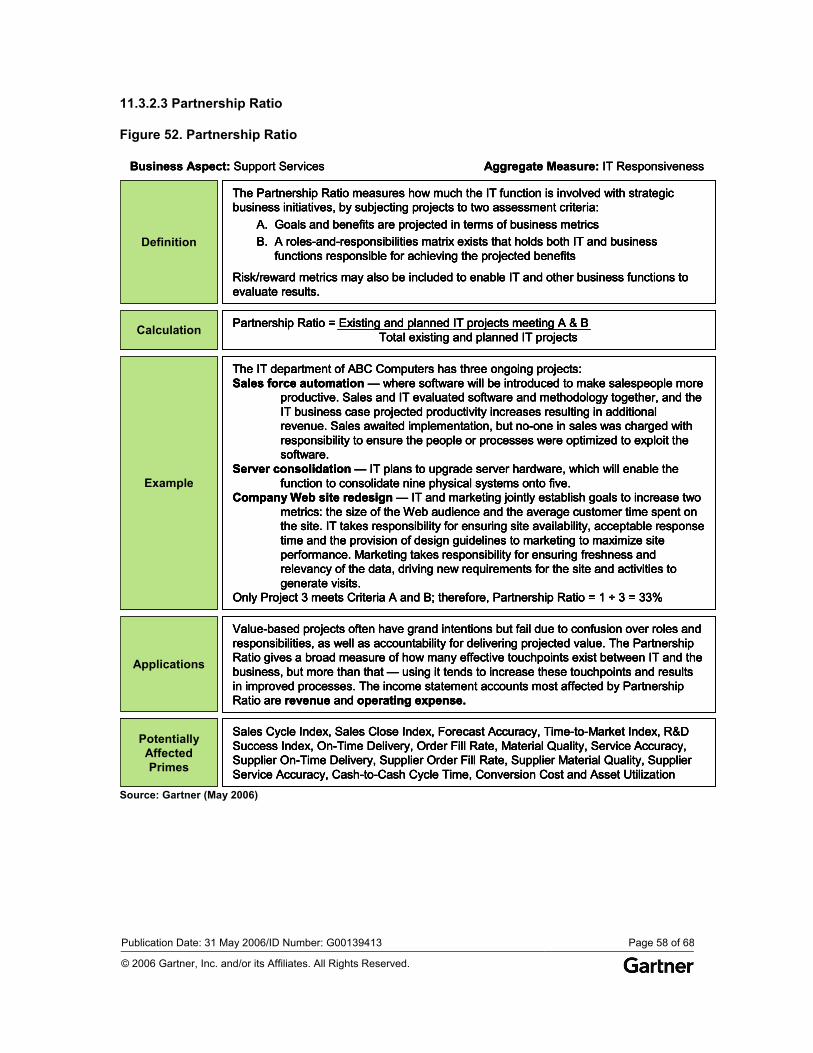
Publication Date: 31 May 2006/ID Number: G00139413 Page 58 of 68
© 2006 Gartner, Inc. and/or its Affiliates. All Rights Reserved.
11.3.2.3 Partnership Ratio
Figure 52. Partnership Ratio
Business Aspect: Support Services Aggregate Measure: IT Responsiveness
Example
The IT department of ABC Computers has three ongoing projects:Sales force automation — where software will be introduced to make salespeople more
productive. Sales and IT evaluated software and methodology together, and the IT business case projected productivity increases resulting in additional revenue. Sales awaited implementation, but no-one in sales was charged with responsibility to ensure the people or processes were optimized to exploit the software.
Server consolidation — IT plans to upgrade server hardware, which will enable the function to consolidate nine physical systems onto five.
Company Web site redesign — IT and marketing jointly establish goals to increase two metrics: the size of the Web audience and the average customer time spent on the site. IT takes responsibility for ensuring site availability, acceptable response time and the provision of design guidelines to marketing to maximize site performance. Marketing takes responsibility for ensuring freshness and relevancy of the data, driving new requirements for the site and activities to generate visits.
Only Project 3 meets Criteria A and B; therefore, Partnership Ratio = 1 ÷ 3 = 33%
Definition
The Partnership Ratio measures how much the IT function is involved with strategic business initiatives, by subjecting projects to two assessment criteria:
A. Goals and benefits are projected in terms of business metricsB. A roles-and-responsibilities matrix exists that holds both IT and business
functions responsible for achieving the projected benefits
Risk/reward metrics may also be included to enable IT and other business functions to evaluate results.
Calculation Partnership Ratio = Existing and planned IT projects meeting A & BTotal existing and planned IT projects
PotentiallyAffectedPrimes
Sales Cycle Index, Sales Close Index, Forecast Accuracy, Time-to-Market Index, R&D Success Index, On-Time Delivery, Order Fill Rate, Material Quality, Service Accuracy, Supplier On-Time Delivery, Supplier Order Fill Rate, Supplier Material Quality, Supplier Service Accuracy, Cash-to-Cash Cycle Time, Conversion Cost and Asset Utilization
Applications
Value-based projects often have grand intentions but fail due to confusion over roles and responsibilities, as well as accountability for delivering projected value. The Partnership Ratio gives a broad measure of how many effective touchpoints exist between IT and the business, but more than that — using it tends to increase these touchpoints and results in improved processes. The income statement accounts most affected by Partnership Ratio are revenue and operating expense.
Business Aspect: Support Services Aggregate Measure: IT Responsiveness
Example
The IT department of ABC Computers has three ongoing projects:Sales force automation — where software will be introduced to make salespeople more
productive. Sales and IT evaluated software and methodology together, and the IT business case projected productivity increases resulting in additional revenue. Sales awaited implementation, but no-one in sales was charged with responsibility to ensure the people or processes were optimized to exploit the software.
Server consolidation — IT plans to upgrade server hardware, which will enable the function to consolidate nine physical systems onto five.
Company Web site redesign — IT and marketing jointly establish goals to increase two metrics: the size of the Web audience and the average customer time spent on the site. IT takes responsibility for ensuring site availability, acceptable response time and the provision of design guidelines to marketing to maximize site performance. Marketing takes responsibility for ensuring freshness and relevancy of the data, driving new requirements for the site and activities to generate visits.
Only Project 3 meets Criteria A and B; therefore, Partnership Ratio = 1 ÷ 3 = 33%
ExampleExample
The IT department of ABC Computers has three ongoing projects:Sales force automation — where software will be introduced to make salespeople more
productive. Sales and IT evaluated software and methodology together, and the IT business case projected productivity increases resulting in additional revenue. Sales awaited implementation, but no-one in sales was charged with responsibility to ensure the people or processes were optimized to exploit the software.
Server consolidation — IT plans to upgrade server hardware, which will enable the function to consolidate nine physical systems onto five.
Company Web site redesign — IT and marketing jointly establish goals to increase two metrics: the size of the Web audience and the average customer time spent on the site. IT takes responsibility for ensuring site availability, acceptable response time and the provision of design guidelines to marketing to maximize site performance. Marketing takes responsibility for ensuring freshness and relevancy of the data, driving new requirements for the site and activities to generate visits.
Only Project 3 meets Criteria A and B; therefore, Partnership Ratio = 1 ÷ 3 = 33%
Definition
The Partnership Ratio measures how much the IT function is involved with strategic business initiatives, by subjecting projects to two assessment criteria:
A. Goals and benefits are projected in terms of business metricsB. A roles-and-responsibilities matrix exists that holds both IT and business
functions responsible for achieving the projected benefits
Risk/reward metrics may also be included to enable IT and other business functions to evaluate results.
DefinitionDefinition
The Partnership Ratio measures how much the IT function is involved with strategic business initiatives, by subjecting projects to two assessment criteria:
A. Goals and benefits are projected in terms of business metricsB. A roles-and-responsibilities matrix exists that holds both IT and business
functions responsible for achieving the projected benefits
Risk/reward metrics may also be included to enable IT and other business functions to evaluate results.
Calculation Partnership Ratio = Existing and planned IT projects meeting A & BTotal existing and planned IT projectsCalculationCalculation Partnership Ratio = Existing and planned IT projects meeting A & BTotal existing and planned IT projects
PotentiallyAffectedPrimes
Sales Cycle Index, Sales Close Index, Forecast Accuracy, Time-to-Market Index, R&D Success Index, On-Time Delivery, Order Fill Rate, Material Quality, Service Accuracy, Supplier On-Time Delivery, Supplier Order Fill Rate, Supplier Material Quality, Supplier Service Accuracy, Cash-to-Cash Cycle Time, Conversion Cost and Asset Utilization
PotentiallyAffectedPrimes
PotentiallyAffectedPrimes
Sales Cycle Index, Sales Close Index, Forecast Accuracy, Time-to-Market Index, R&D Success Index, On-Time Delivery, Order Fill Rate, Material Quality, Service Accuracy, Supplier On-Time Delivery, Supplier Order Fill Rate, Supplier Material Quality, Supplier Service Accuracy, Cash-to-Cash Cycle Time, Conversion Cost and Asset Utilization
Applications
Value-based projects often have grand intentions but fail due to confusion over roles and responsibilities, as well as accountability for delivering projected value. The Partnership Ratio gives a broad measure of how many effective touchpoints exist between IT and the business, but more than that — using it tends to increase these touchpoints and results in improved processes. The income statement accounts most affected by Partnership Ratio are revenue and operating expense.
ApplicationsApplications
Value-based projects often have grand intentions but fail due to confusion over roles and responsibilities, as well as accountability for delivering projected value. The Partnership Ratio gives a broad measure of how many effective touchpoints exist between IT and the business, but more than that — using it tends to increase these touchpoints and results in improved processes. The income statement accounts most affected by Partnership Ratio are revenue and operating expense.
Source: Gartner (May 2006)
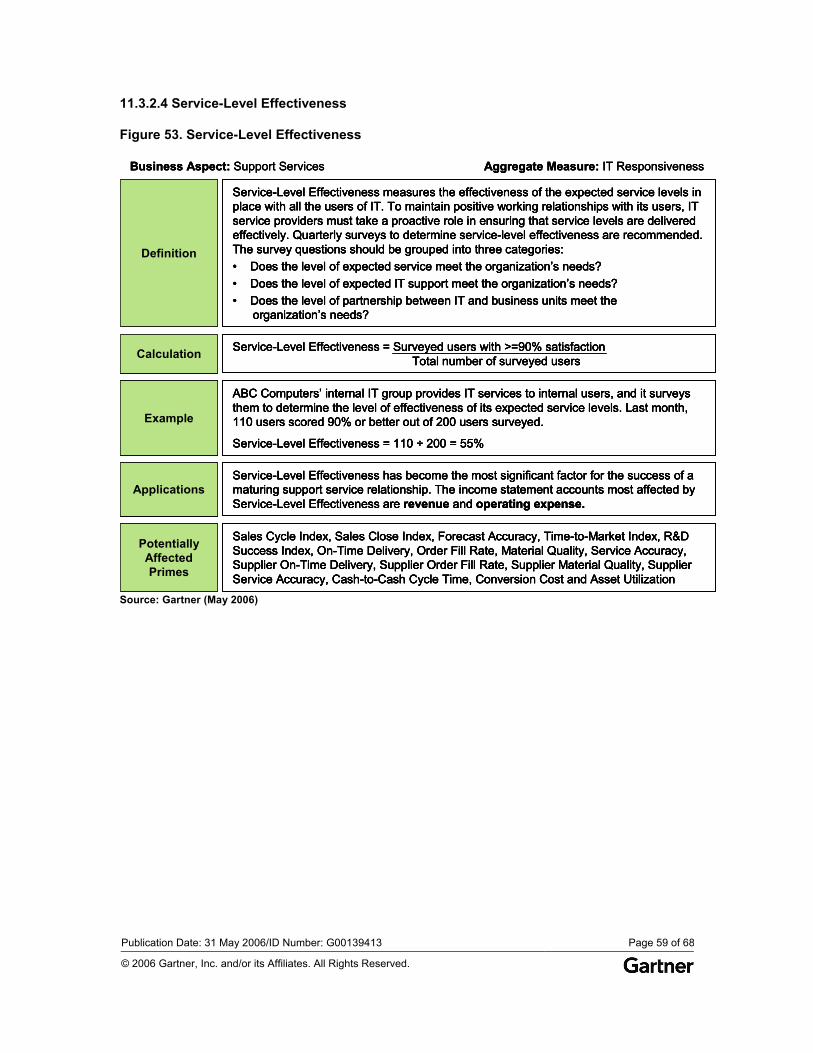
Publication Date: 31 May 2006/ID Number: G00139413 Page 59 of 68
© 2006 Gartner, Inc. and/or its Affiliates. All Rights Reserved.
11.3.2.4 Service-Level Effectiveness
Figure 53. Service-Level Effectiveness
Business Aspect: Support Services Aggregate Measure: IT Responsiveness
Example
ABC Computers’ internal IT group provides IT services to internal users, and it surveys them to determine the level of effectiveness of its expected service levels. Last month, 110 users scored 90% or better out of 200 users surveyed.
Service-Level Effectiveness = 110 ÷ 200 = 55%
Definition
Service-Level Effectiveness measures the effectiveness of the expected service levels in place with all the users of IT. To maintain positive working relationships with its users, IT service providers must take a proactive role in ensuring that service levels are delivered effectively. Quarterly surveys to determine service-level effectiveness are recommended. The survey questions should be grouped into three categories:• Does the level of expected service meet the organization’s needs?• Does the level of expected IT support meet the organization’s needs?• Does the level of partnership between IT and business units meet the
organization’s needs?
Calculation Service-Level Effectiveness = Surveyed users with >=90% satisfactionTotal number of surveyed users
PotentiallyAffectedPrimes
Sales Cycle Index, Sales Close Index, Forecast Accuracy, Time-to-Market Index, R&D Success Index, On-Time Delivery, Order Fill Rate, Material Quality, Service Accuracy, Supplier On-Time Delivery, Supplier Order Fill Rate, Supplier Material Quality, Supplier Service Accuracy, Cash-to-Cash Cycle Time, Conversion Cost and Asset Utilization
ApplicationsService-Level Effectiveness has become the most significant factor for the success of a maturing support service relationship. The income statement accounts most affected by Service-Level Effectiveness are revenue and operating expense.
Business Aspect: Support Services Aggregate Measure: IT Responsiveness
Example
ABC Computers’ internal IT group provides IT services to internal users, and it surveys them to determine the level of effectiveness of its expected service levels. Last month, 110 users scored 90% or better out of 200 users surveyed.
Service-Level Effectiveness = 110 ÷ 200 = 55%
ExampleExample
ABC Computers’ internal IT group provides IT services to internal users, and it surveys them to determine the level of effectiveness of its expected service levels. Last month, 110 users scored 90% or better out of 200 users surveyed.
Service-Level Effectiveness = 110 ÷ 200 = 55%
Definition
Service-Level Effectiveness measures the effectiveness of the expected service levels in place with all the users of IT. To maintain positive working relationships with its users, IT service providers must take a proactive role in ensuring that service levels are delivered effectively. Quarterly surveys to determine service-level effectiveness are recommended. The survey questions should be grouped into three categories:• Does the level of expected service meet the organization’s needs?• Does the level of expected IT support meet the organization’s needs?• Does the level of partnership between IT and business units meet the
organization’s needs?
DefinitionDefinition
Service-Level Effectiveness measures the effectiveness of the expected service levels in place with all the users of IT. To maintain positive working relationships with its users, IT service providers must take a proactive role in ensuring that service levels are delivered effectively. Quarterly surveys to determine service-level effectiveness are recommended. The survey questions should be grouped into three categories:• Does the level of expected service meet the organization’s needs?• Does the level of expected IT support meet the organization’s needs?• Does the level of partnership between IT and business units meet the
organization’s needs?
Calculation Service-Level Effectiveness = Surveyed users with >=90% satisfactionTotal number of surveyed users CalculationCalculation Service-Level Effectiveness = Surveyed users with >=90% satisfactionTotal number of surveyed users
PotentiallyAffectedPrimes
Sales Cycle Index, Sales Close Index, Forecast Accuracy, Time-to-Market Index, R&D Success Index, On-Time Delivery, Order Fill Rate, Material Quality, Service Accuracy, Supplier On-Time Delivery, Supplier Order Fill Rate, Supplier Material Quality, Supplier Service Accuracy, Cash-to-Cash Cycle Time, Conversion Cost and Asset Utilization
PotentiallyAffectedPrimes
PotentiallyAffectedPrimes
Sales Cycle Index, Sales Close Index, Forecast Accuracy, Time-to-Market Index, R&D Success Index, On-Time Delivery, Order Fill Rate, Material Quality, Service Accuracy, Supplier On-Time Delivery, Supplier Order Fill Rate, Supplier Material Quality, Supplier Service Accuracy, Cash-to-Cash Cycle Time, Conversion Cost and Asset Utilization
ApplicationsService-Level Effectiveness has become the most significant factor for the success of a maturing support service relationship. The income statement accounts most affected by Service-Level Effectiveness are revenue and operating expense.
ApplicationsApplicationsService-Level Effectiveness has become the most significant factor for the success of a maturing support service relationship. The income statement accounts most affected by Service-Level Effectiveness are revenue and operating expense.
Source: Gartner (May 2006)

Publication Date: 31 May 2006/ID Number: G00139413 Page 60 of 68
© 2006 Gartner, Inc. and/or its Affiliates. All Rights Reserved.
11.3.2.5 New Projects Index
Figure 54. New Projects Index
Business Aspect: Support Services Aggregate Measure: IT Responsiveness
ExampleABC Computers’ current IT project portfolio has four active projects of which only one is on-time, is within budget and is delivering projected value.
New Projects Index = 1 ÷ 4 = 25%
Definition The New Projects Index measures the ability of the IT function to deliver new projects into the organization within budget, time and value objectives.
Calculation New Projects Index = Total IT projects within budget & time & value objectivesTotal IT projects
PotentiallyAffectedPrimes
Sales Cycle Index, Sales Close Index, Forecast Accuracy, Time-to-Market Index, R&D Success Index, On-Time Delivery, Order Fill Rate, Material Quality, Service Accuracy, Supplier On-Time Delivery, Supplier Order Fill Rate, Supplier Material Quality, Supplier Service Accuracy, Cash-to-Cash Cycle Time, Conversion Cost and Asset Utilization
Applications
New projects account for a large portion of a company’s IT investment. The New Projects Index is a leading indicator to whether the value will be generated according to plan and whether the IT function is capable of future project work within plan. The income statement account most affected by New Projects Index is operating expense.
Business Aspect: Support Services Aggregate Measure: IT Responsiveness
ExampleABC Computers’ current IT project portfolio has four active projects of which only one is on-time, is within budget and is delivering projected value.
New Projects Index = 1 ÷ 4 = 25% ExampleExample
ABC Computers’ current IT project portfolio has four active projects of which only one is on-time, is within budget and is delivering projected value.
New Projects Index = 1 ÷ 4 = 25%
Definition The New Projects Index measures the ability of the IT function to deliver new projects into the organization within budget, time and value objectives. DefinitionDefinition The New Projects Index measures the ability of the IT function to deliver new projects into the organization within budget, time and value objectives.
Calculation New Projects Index = Total IT projects within budget & time & value objectivesTotal IT projects CalculationCalculation New Projects Index = Total IT projects within budget & time & value objectivesTotal IT projects
PotentiallyAffectedPrimes
Sales Cycle Index, Sales Close Index, Forecast Accuracy, Time-to-Market Index, R&D Success Index, On-Time Delivery, Order Fill Rate, Material Quality, Service Accuracy, Supplier On-Time Delivery, Supplier Order Fill Rate, Supplier Material Quality, Supplier Service Accuracy, Cash-to-Cash Cycle Time, Conversion Cost and Asset Utilization
PotentiallyAffectedPrimes
PotentiallyAffectedPrimes
Sales Cycle Index, Sales Close Index, Forecast Accuracy, Time-to-Market Index, R&D Success Index, On-Time Delivery, Order Fill Rate, Material Quality, Service Accuracy, Supplier On-Time Delivery, Supplier Order Fill Rate, Supplier Material Quality, Supplier Service Accuracy, Cash-to-Cash Cycle Time, Conversion Cost and Asset Utilization
Applications
New projects account for a large portion of a company’s IT investment. The New Projects Index is a leading indicator to whether the value will be generated according to plan and whether the IT function is capable of future project work within plan. The income statement account most affected by New Projects Index is operating expense.
ApplicationsApplications
New projects account for a large portion of a company’s IT investment. The New Projects Index is a leading indicator to whether the value will be generated according to plan and whether the IT function is capable of future project work within plan. The income statement account most affected by New Projects Index is operating expense.
Source: Gartner (May 2006)
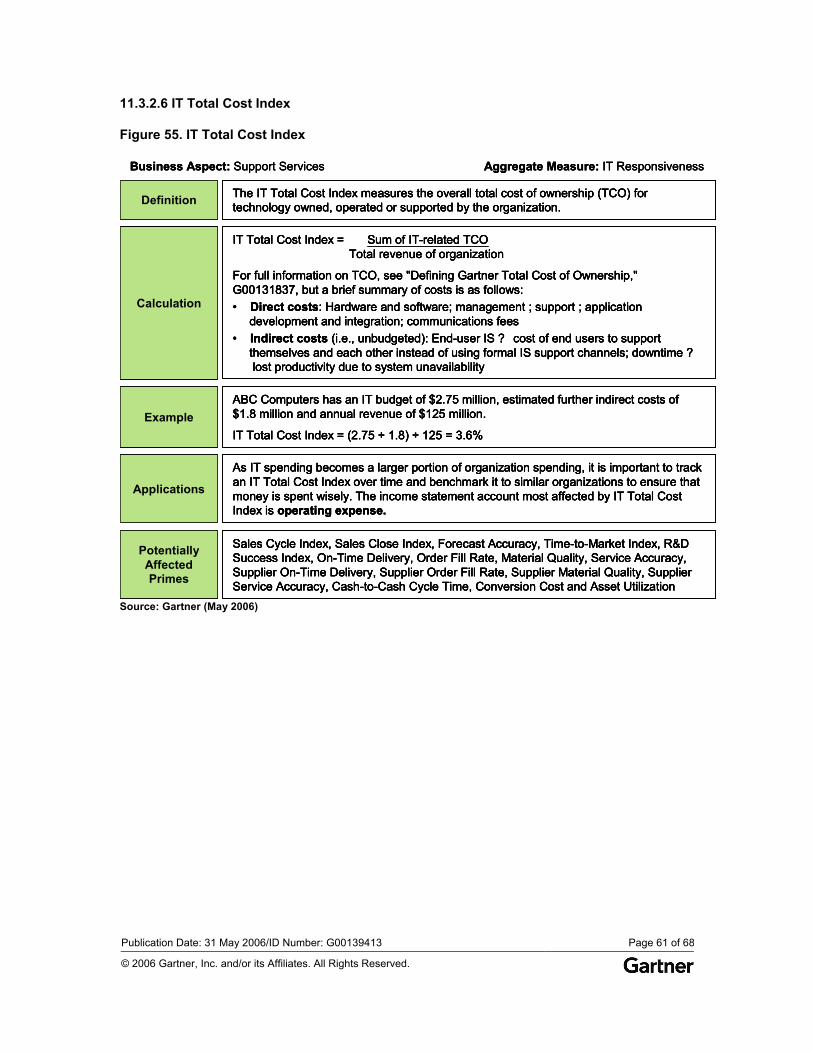
Publication Date: 31 May 2006/ID Number: G00139413 Page 61 of 68
© 2006 Gartner, Inc. and/or its Affiliates. All Rights Reserved.
11.3.2.6 IT Total Cost Index
Figure 55. IT Total Cost Index
Business Aspect: Support Services Aggregate Measure: IT Responsiveness
ExampleABC Computers has an IT budget of $2.75 million, estimated further indirect costs of $1.8 million and annual revenue of $125 million.
IT Total Cost Index = (2.75 + 1.8) ÷ 125 = 3.6%
Definition The IT Total Cost Index measures the overall total cost of ownership (TCO) for technology owned, operated or supported by the organization.
Calculation
IT Total Cost Index = Sum of IT-related TCOTotal revenue of organization
For full information on TCO, see "Defining Gartner Total Cost of Ownership," G00131837, but a brief summary of costs is as follows:• Direct costs: Hardware and software; management ; support ; application
development and integration; communications fees • Indirect costs (i.e., unbudgeted): End-user IS ? cost of end users to support
themselves and each other instead of using formal IS support channels; downtime ?lost productivity due to system unavailability
PotentiallyAffectedPrimes
Sales Cycle Index, Sales Close Index, Forecast Accuracy, Time-to-Market Index, R&D Success Index, On-Time Delivery, Order Fill Rate, Material Quality, Service Accuracy, Supplier On-Time Delivery, Supplier Order Fill Rate, Supplier Material Quality, Supplier Service Accuracy, Cash-to-Cash Cycle Time, Conversion Cost and Asset Utilization
Applications
As IT spending becomes a larger portion of organization spending, it is important to track an IT Total Cost Index over time and benchmark it to similar organizations to ensure that money is spent wisely. The income statement account most affected by IT Total Cost Index is operating expense.
Business Aspect: Support Services Aggregate Measure: IT Responsiveness
ExampleABC Computers has an IT budget of $2.75 million, estimated further indirect costs of $1.8 million and annual revenue of $125 million.
IT Total Cost Index = (2.75 + 1.8) ÷ 125 = 3.6% ExampleExample
ABC Computers has an IT budget of $2.75 million, estimated further indirect costs of $1.8 million and annual revenue of $125 million.
IT Total Cost Index = (2.75 + 1.8) ÷ 125 = 3.6%
Definition The IT Total Cost Index measures the overall total cost of ownership (TCO) for technology owned, operated or supported by the organization. DefinitionDefinition The IT Total Cost Index measures the overall total cost of ownership (TCO) for technology owned, operated or supported by the organization.
Calculation
IT Total Cost Index = Sum of IT-related TCOTotal revenue of organization
For full information on TCO, see "Defining Gartner Total Cost of Ownership," G00131837, but a brief summary of costs is as follows:• Direct costs: Hardware and software; management ; support ; application
development and integration; communications fees • Indirect costs (i.e., unbudgeted): End-user IS ? cost of end users to support
themselves and each other instead of using formal IS support channels; downtime ?lost productivity due to system unavailability
CalculationCalculation
IT Total Cost Index = Sum of IT-related TCOTotal revenue of organization
For full information on TCO, see "Defining Gartner Total Cost of Ownership," G00131837, but a brief summary of costs is as follows:• Direct costs: Hardware and software; management ; support ; application
development and integration; communications fees • Indirect costs (i.e., unbudgeted): End-user IS ? cost of end users to support
themselves and each other instead of using formal IS support channels; downtime ?lost productivity due to system unavailability
PotentiallyAffectedPrimes
Sales Cycle Index, Sales Close Index, Forecast Accuracy, Time-to-Market Index, R&D Success Index, On-Time Delivery, Order Fill Rate, Material Quality, Service Accuracy, Supplier On-Time Delivery, Supplier Order Fill Rate, Supplier Material Quality, Supplier Service Accuracy, Cash-to-Cash Cycle Time, Conversion Cost and Asset Utilization
PotentiallyAffectedPrimes
PotentiallyAffectedPrimes
Sales Cycle Index, Sales Close Index, Forecast Accuracy, Time-to-Market Index, R&D Success Index, On-Time Delivery, Order Fill Rate, Material Quality, Service Accuracy, Supplier On-Time Delivery, Supplier Order Fill Rate, Supplier Material Quality, Supplier Service Accuracy, Cash-to-Cash Cycle Time, Conversion Cost and Asset Utilization
Applications
As IT spending becomes a larger portion of organization spending, it is important to track an IT Total Cost Index over time and benchmark it to similar organizations to ensure that money is spent wisely. The income statement account most affected by IT Total Cost Index is operating expense.
ApplicationsApplications
As IT spending becomes a larger portion of organization spending, it is important to track an IT Total Cost Index over time and benchmark it to similar organizations to ensure that money is spent wisely. The income statement account most affected by IT Total Cost Index is operating expense.
Source: Gartner (May 2006)
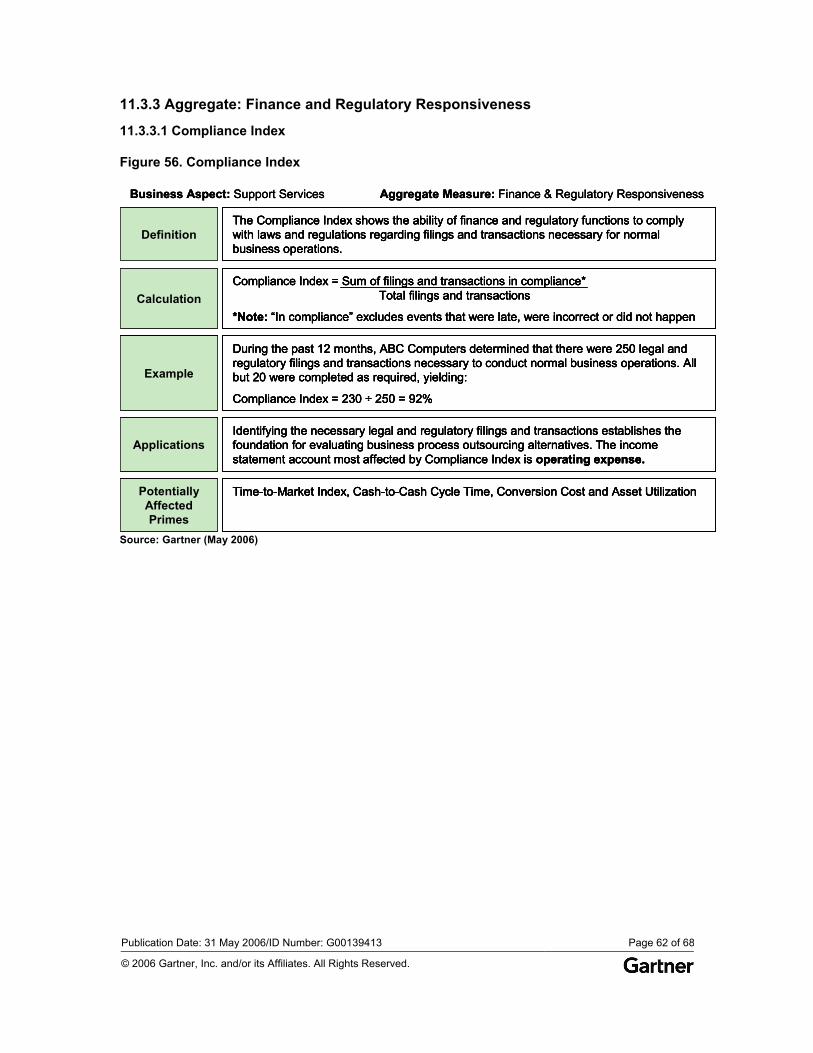
Publication Date: 31 May 2006/ID Number: G00139413 Page 62 of 68
© 2006 Gartner, Inc. and/or its Affiliates. All Rights Reserved.
11.3.3 Aggregate: Finance and Regulatory Responsiveness
11.3.3.1 Compliance Index
Figure 56. Compliance Index
Business Aspect: Support Services Aggregate Measure: Finance & Regulatory Responsiveness
Example
During the past 12 months, ABC Computers determined that there were 250 legal and regulatory filings and transactions necessary to conduct normal business operations. All but 20 were completed as required, yielding:
Compliance Index = 230 ÷ 250 = 92%
DefinitionThe Compliance Index shows the ability of finance and regulatory functions to comply with laws and regulations regarding filings and transactions necessary for normal business operations.
CalculationCompliance Index = Sum of filings and transactions in compliance*
Total filings and transactions
*Note: “In compliance” excludes events that were late, were incorrect or did not happen
PotentiallyAffectedPrimes
Time-to-Market Index, Cash-to-Cash Cycle Time, Conversion Cost and Asset Utilization
ApplicationsIdentifying the necessary legal and regulatory filings and transactions establishes the foundation for evaluating business process outsourcing alternatives. The income statement account most affected by Compliance Index is operating expense.
Business Aspect: Support Services Aggregate Measure: Finance & Regulatory Responsiveness
Example
During the past 12 months, ABC Computers determined that there were 250 legal and regulatory filings and transactions necessary to conduct normal business operations. All but 20 were completed as required, yielding:
Compliance Index = 230 ÷ 250 = 92%
ExampleExample
During the past 12 months, ABC Computers determined that there were 250 legal and regulatory filings and transactions necessary to conduct normal business operations. All but 20 were completed as required, yielding:
Compliance Index = 230 ÷ 250 = 92%
DefinitionThe Compliance Index shows the ability of finance and regulatory functions to comply with laws and regulations regarding filings and transactions necessary for normal business operations.
DefinitionDefinitionThe Compliance Index shows the ability of finance and regulatory functions to comply with laws and regulations regarding filings and transactions necessary for normal business operations.
CalculationCompliance Index = Sum of filings and transactions in compliance*
Total filings and transactions
*Note: “In compliance” excludes events that were late, were incorrect or did not happen CalculationCalculation
Compliance Index = Sum of filings and transactions in compliance*Total filings and transactions
*Note: “In compliance” excludes events that were late, were incorrect or did not happen
PotentiallyAffectedPrimes
Time-to-Market Index, Cash-to-Cash Cycle Time, Conversion Cost and Asset Utilization PotentiallyAffectedPrimes
PotentiallyAffectedPrimes
Time-to-Market Index, Cash-to-Cash Cycle Time, Conversion Cost and Asset Utilization
ApplicationsIdentifying the necessary legal and regulatory filings and transactions establishes the foundation for evaluating business process outsourcing alternatives. The income statement account most affected by Compliance Index is operating expense.
ApplicationsApplicationsIdentifying the necessary legal and regulatory filings and transactions establishes the foundation for evaluating business process outsourcing alternatives. The income statement account most affected by Compliance Index is operating expense.
Source: Gartner (May 2006)
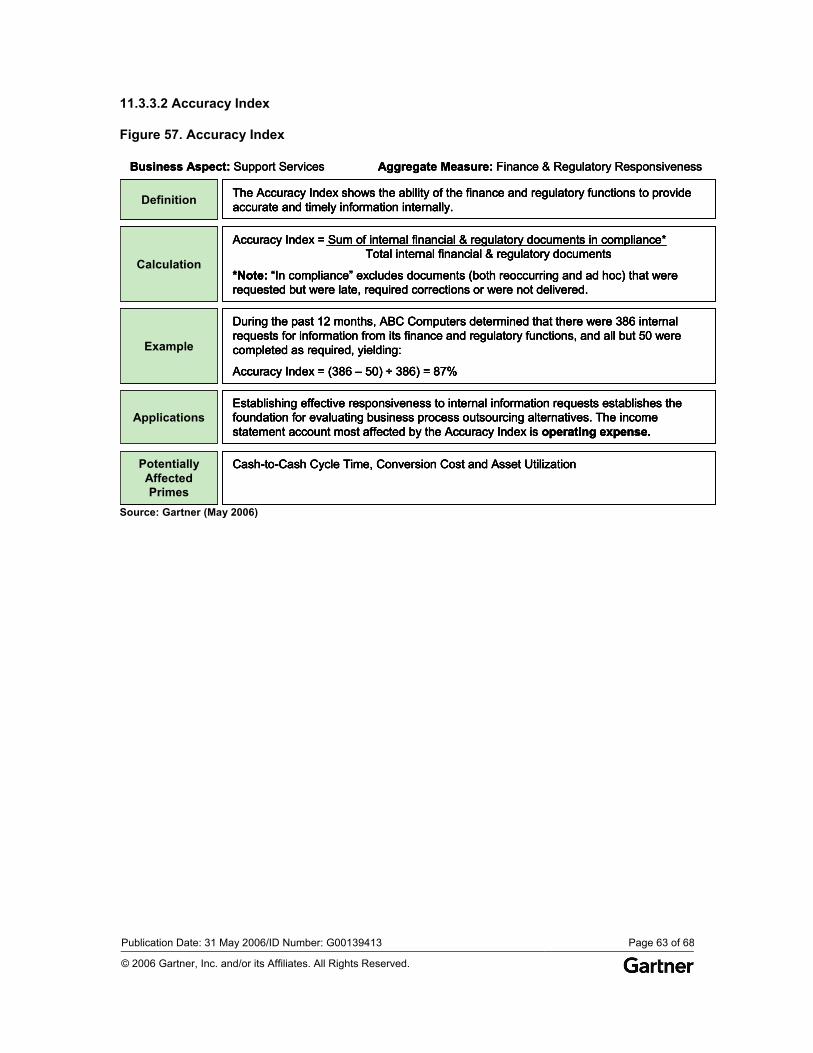
Publication Date: 31 May 2006/ID Number: G00139413 Page 63 of 68
© 2006 Gartner, Inc. and/or its Affiliates. All Rights Reserved.
11.3.3.2 Accuracy Index
Figure 57. Accuracy Index
Business Aspect: Support Services Aggregate Measure: Finance & Regulatory Responsiveness
Example
During the past 12 months, ABC Computers determined that there were 386 internal requests for information from its finance and regulatory functions, and all but 50 were completed as required, yielding:
Accuracy Index = (386 – 50) ÷ 386) = 87%
Definition The Accuracy Index shows the ability of the finance and regulatory functions to provide accurate and timely information internally.
Calculation
Accuracy Index = Sum of internal financial & regulatory documents in compliance*Total internal financial & regulatory documents
*Note: “In compliance” excludes documents (both reoccurring and ad hoc) that were requested but were late, required corrections or were not delivered.
PotentiallyAffectedPrimes
Cash-to-Cash Cycle Time, Conversion Cost and Asset Utilization
ApplicationsEstablishing effective responsiveness to internal information requests establishes the foundation for evaluating business process outsourcing alternatives. The income statement account most affected by the Accuracy Index is operating expense.
Business Aspect: Support Services Aggregate Measure: Finance & Regulatory Responsiveness
Example
During the past 12 months, ABC Computers determined that there were 386 internal requests for information from its finance and regulatory functions, and all but 50 were completed as required, yielding:
Accuracy Index = (386 – 50) ÷ 386) = 87%
ExampleExample
During the past 12 months, ABC Computers determined that there were 386 internal requests for information from its finance and regulatory functions, and all but 50 were completed as required, yielding:
Accuracy Index = (386 – 50) ÷ 386) = 87%
Definition The Accuracy Index shows the ability of the finance and regulatory functions to provide accurate and timely information internally. DefinitionDefinition The Accuracy Index shows the ability of the finance and regulatory functions to provide accurate and timely information internally.
Calculation
Accuracy Index = Sum of internal financial & regulatory documents in compliance*Total internal financial & regulatory documents
*Note: “In compliance” excludes documents (both reoccurring and ad hoc) that were requested but were late, required corrections or were not delivered.
CalculationCalculation
Accuracy Index = Sum of internal financial & regulatory documents in compliance*Total internal financial & regulatory documents
*Note: “In compliance” excludes documents (both reoccurring and ad hoc) that were requested but were late, required corrections or were not delivered.
PotentiallyAffectedPrimes
Cash-to-Cash Cycle Time, Conversion Cost and Asset Utilization PotentiallyAffectedPrimes
PotentiallyAffectedPrimes
Cash-to-Cash Cycle Time, Conversion Cost and Asset Utilization
ApplicationsEstablishing effective responsiveness to internal information requests establishes the foundation for evaluating business process outsourcing alternatives. The income statement account most affected by the Accuracy Index is operating expense.
ApplicationsApplicationsEstablishing effective responsiveness to internal information requests establishes the foundation for evaluating business process outsourcing alternatives. The income statement account most affected by the Accuracy Index is operating expense.
Source: Gartner (May 2006)
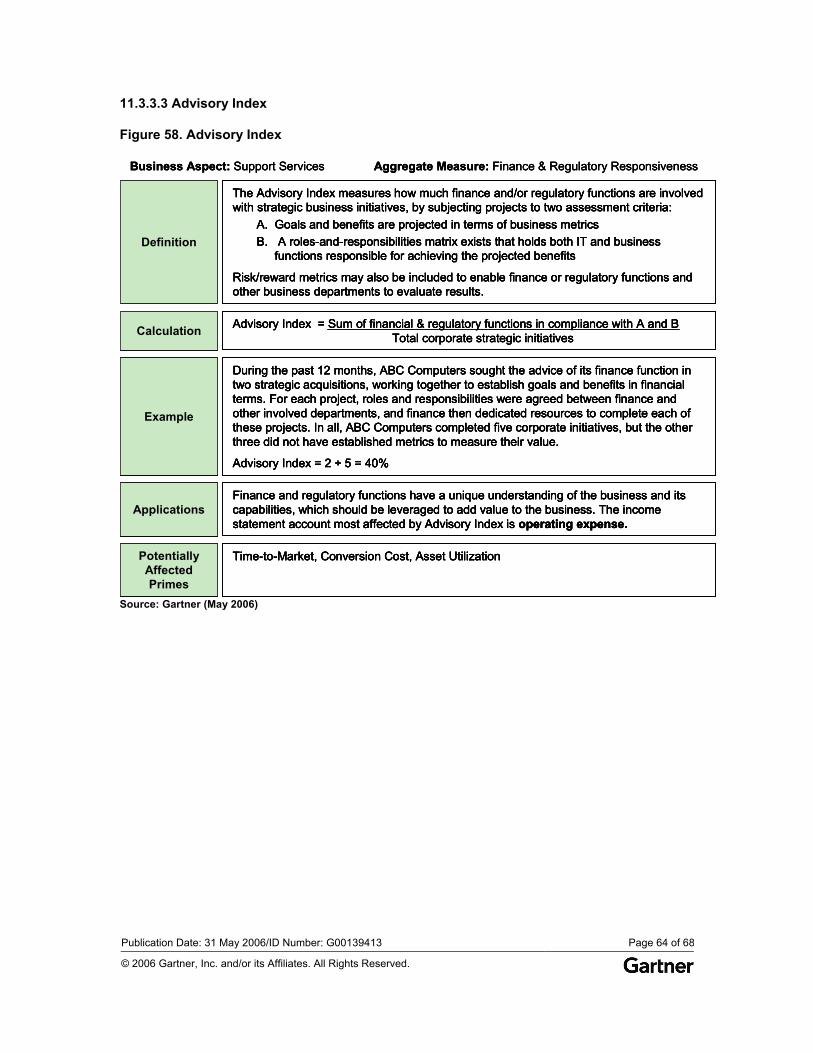
Publication Date: 31 May 2006/ID Number: G00139413 Page 64 of 68
© 2006 Gartner, Inc. and/or its Affiliates. All Rights Reserved.
11.3.3.3 Advisory Index
Figure 58. Advisory Index
Business Aspect: Support Services Aggregate Measure: Finance & Regulatory Responsiveness
Example
During the past 12 months, ABC Computers sought the advice of its finance function in two strategic acquisitions, working together to establish goals and benefits in financial terms. For each project, roles and responsibilities were agreed between finance and other involved departments, and finance then dedicated resources to complete each of these projects. In all, ABC Computers completed five corporate initiatives, but the other three did not have established metrics to measure their value.
Advisory Index = 2 ÷ 5 = 40%
Definition
The Advisory Index measures how much finance and/or regulatory functions are involved with strategic business initiatives, by subjecting projects to two assessment criteria:
A. Goals and benefits are projected in terms of business metricsB. A roles-and-responsibilities matrix exists that holds both IT and business
functions responsible for achieving the projected benefits
Risk/reward metrics may also be included to enable finance or regulatory functions and other business departments to evaluate results.
Calculation Advisory Index = Sum of financial & regulatory functions in compliance with A and BTotal corporate strategic initiatives
PotentiallyAffectedPrimes
Time-to-Market, Conversion Cost, Asset Utilization
ApplicationsFinance and regulatory functions have a unique understanding of the business and its capabilities, which should be leveraged to add value to the business. The income statement account most affected by Advisory Index is operating expense.
Business Aspect: Support Services Aggregate Measure: Finance & Regulatory Responsiveness
Example
During the past 12 months, ABC Computers sought the advice of its finance function in two strategic acquisitions, working together to establish goals and benefits in financial terms. For each project, roles and responsibilities were agreed between finance and other involved departments, and finance then dedicated resources to complete each of these projects. In all, ABC Computers completed five corporate initiatives, but the other three did not have established metrics to measure their value.
Advisory Index = 2 ÷ 5 = 40%
ExampleExample
During the past 12 months, ABC Computers sought the advice of its finance function in two strategic acquisitions, working together to establish goals and benefits in financial terms. For each project, roles and responsibilities were agreed between finance and other involved departments, and finance then dedicated resources to complete each of these projects. In all, ABC Computers completed five corporate initiatives, but the other three did not have established metrics to measure their value.
Advisory Index = 2 ÷ 5 = 40%
Definition
The Advisory Index measures how much finance and/or regulatory functions are involved with strategic business initiatives, by subjecting projects to two assessment criteria:
A. Goals and benefits are projected in terms of business metricsB. A roles-and-responsibilities matrix exists that holds both IT and business
functions responsible for achieving the projected benefits
Risk/reward metrics may also be included to enable finance or regulatory functions and other business departments to evaluate results.
DefinitionDefinition
The Advisory Index measures how much finance and/or regulatory functions are involved with strategic business initiatives, by subjecting projects to two assessment criteria:
A. Goals and benefits are projected in terms of business metricsB. A roles-and-responsibilities matrix exists that holds both IT and business
functions responsible for achieving the projected benefits
Risk/reward metrics may also be included to enable finance or regulatory functions and other business departments to evaluate results.
Calculation Advisory Index = Sum of financial & regulatory functions in compliance with A and BTotal corporate strategic initiatives CalculationCalculation Advisory Index = Sum of financial & regulatory functions in compliance with A and BTotal corporate strategic initiatives
PotentiallyAffectedPrimes
Time-to-Market, Conversion Cost, Asset Utilization PotentiallyAffectedPrimes
PotentiallyAffectedPrimes
Time-to-Market, Conversion Cost, Asset Utilization
ApplicationsFinance and regulatory functions have a unique understanding of the business and its capabilities, which should be leveraged to add value to the business. The income statement account most affected by Advisory Index is operating expense.
ApplicationsApplicationsFinance and regulatory functions have a unique understanding of the business and its capabilities, which should be leveraged to add value to the business. The income statement account most affected by Advisory Index is operating expense.
Source: Gartner (May 2006)
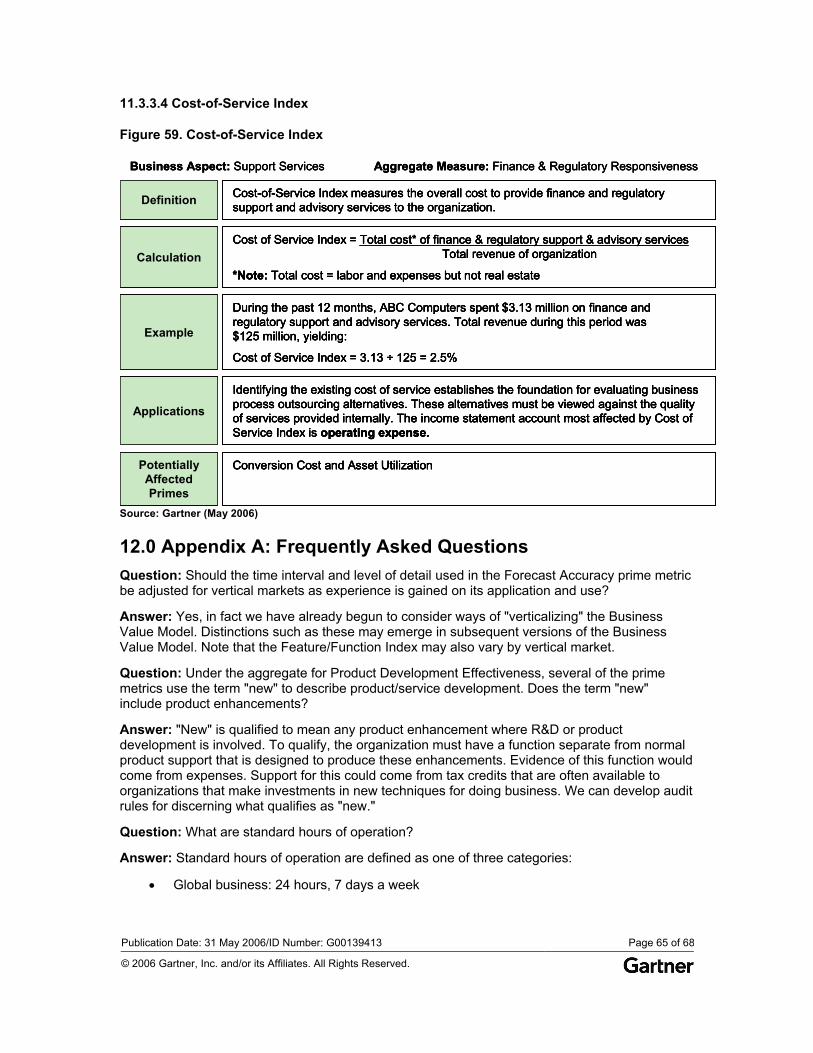
Publication Date: 31 May 2006/ID Number: G00139413 Page 65 of 68
© 2006 Gartner, Inc. and/or its Affiliates. All Rights Reserved.
11.3.3.4 Cost-of-Service Index
Figure 59. Cost-of-Service Index
Business Aspect: Support Services Aggregate Measure: Finance & Regulatory Responsiveness
Definition Cost-of-Service Index measures the overall cost to provide finance and regulatory support and advisory services to the organization.
CalculationCost of Service Index = Total cost* of finance & regulatory support & advisory services
Total revenue of organization
*Note: Total cost = labor and expenses but not real estate
Example
During the past 12 months, ABC Computers spent $3.13 million on finance and regulatory support and advisory services. Total revenue during this period was $125 million, yielding:
Cost of Service Index = 3.13 ÷ 125 = 2.5%
PotentiallyAffectedPrimes
Conversion Cost and Asset Utilization
Applications
Identifying the existing cost of service establishes the foundation for evaluating business process outsourcing alternatives. These alternatives must be viewed against the quality of services provided internally. The income statement account most affected by Cost of Service Index is operating expense.
Business Aspect: Support Services Aggregate Measure: Finance & Regulatory Responsiveness
Definition Cost-of-Service Index measures the overall cost to provide finance and regulatory support and advisory services to the organization. DefinitionDefinition Cost-of-Service Index measures the overall cost to provide finance and regulatory support and advisory services to the organization.
CalculationCost of Service Index = Total cost* of finance & regulatory support & advisory services
Total revenue of organization
*Note: Total cost = labor and expenses but not real estate CalculationCalculation
Cost of Service Index = Total cost* of finance & regulatory support & advisory servicesTotal revenue of organization
*Note: Total cost = labor and expenses but not real estate
Example
During the past 12 months, ABC Computers spent $3.13 million on finance and regulatory support and advisory services. Total revenue during this period was $125 million, yielding:
Cost of Service Index = 3.13 ÷ 125 = 2.5%
ExampleExample
During the past 12 months, ABC Computers spent $3.13 million on finance and regulatory support and advisory services. Total revenue during this period was $125 million, yielding:
Cost of Service Index = 3.13 ÷ 125 = 2.5%
PotentiallyAffectedPrimes
Conversion Cost and Asset Utilization PotentiallyAffectedPrimes
PotentiallyAffectedPrimes
Conversion Cost and Asset Utilization
Applications
Identifying the existing cost of service establishes the foundation for evaluating business process outsourcing alternatives. These alternatives must be viewed against the quality of services provided internally. The income statement account most affected by Cost of Service Index is operating expense.
ApplicationsApplications
Identifying the existing cost of service establishes the foundation for evaluating business process outsourcing alternatives. These alternatives must be viewed against the quality of services provided internally. The income statement account most affected by Cost of Service Index is operating expense.
Source: Gartner (May 2006)
12.0 Appendix A: Frequently Asked Questions Question: Should the time interval and level of detail used in the Forecast Accuracy prime metric be adjusted for vertical markets as experience is gained on its application and use?
Answer: Yes, in fact we have already begun to consider ways of "verticalizing" the Business Value Model. Distinctions such as these may emerge in subsequent versions of the Business Value Model. Note that the Feature/Function Index may also vary by vertical market.
Question: Under the aggregate for Product Development Effectiveness, several of the prime metrics use the term "new" to describe product/service development. Does the term "new" include product enhancements?
Answer: "New" is qualified to mean any product enhancement where R&D or product development is involved. To qualify, the organization must have a function separate from normal product support that is designed to produce these enhancements. Evidence of this function would come from expenses. Support for this could come from tax credits that are often available to organizations that make investments in new techniques for doing business. We can develop audit rules for discerning what qualifies as "new."
Question: What are standard hours of operation?
Answer: Standard hours of operation are defined as one of three categories:
• Global business: 24 hours, 7 days a week
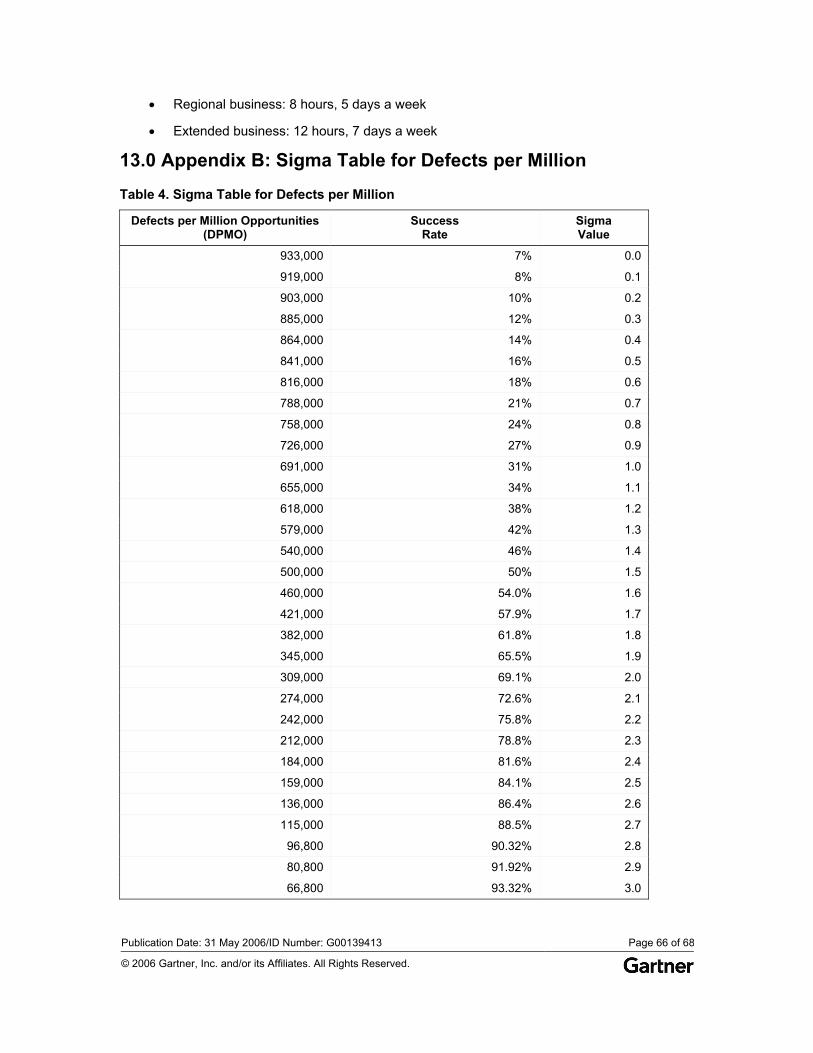
Publication Date: 31 May 2006/ID Number: G00139413 Page 66 of 68
© 2006 Gartner, Inc. and/or its Affiliates. All Rights Reserved.
• Regional business: 8 hours, 5 days a week
• Extended business: 12 hours, 7 days a week
13.0 Appendix B: Sigma Table for Defects per Million
Table 4. Sigma Table for Defects per Million
Defects per Million Opportunities (DPMO)
Success Rate
Sigma Value
933,000 7% 0.0
919,000 8% 0.1
903,000 10% 0.2
885,000 12% 0.3
864,000 14% 0.4
841,000 16% 0.5
816,000 18% 0.6
788,000 21% 0.7
758,000 24% 0.8
726,000 27% 0.9
691,000 31% 1.0
655,000 34% 1.1
618,000 38% 1.2
579,000 42% 1.3
540,000 46% 1.4
500,000 50% 1.5
460,000 54.0% 1.6
421,000 57.9% 1.7
382,000 61.8% 1.8
345,000 65.5% 1.9
309,000 69.1% 2.0
274,000 72.6% 2.1
242,000 75.8% 2.2
212,000 78.8% 2.3
184,000 81.6% 2.4
159,000 84.1% 2.5
136,000 86.4% 2.6
115,000 88.5% 2.7
96,800 90.32% 2.8
80,800 91.92% 2.9
66,800 93.32% 3.0
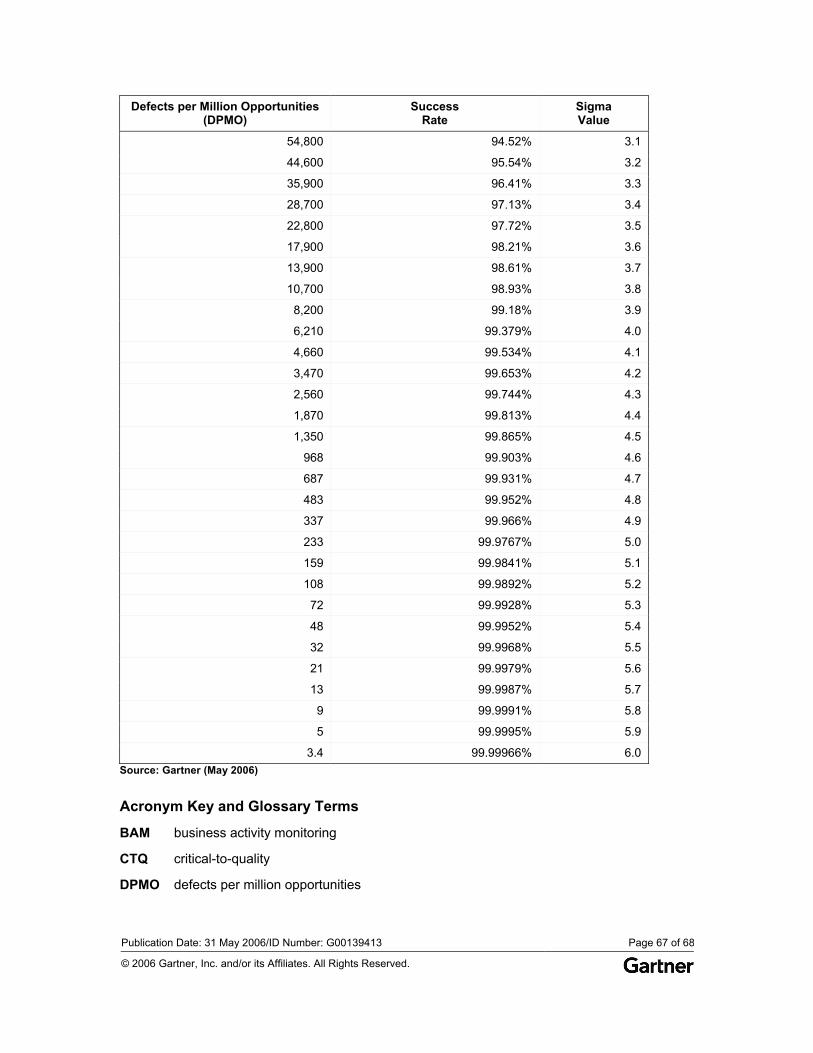
Publication Date: 31 May 2006/ID Number: G00139413 Page 67 of 68
© 2006 Gartner, Inc. and/or its Affiliates. All Rights Reserved.
Defects per Million Opportunities (DPMO)
Success Rate
Sigma Value
54,800 94.52% 3.1
44,600 95.54% 3.2
35,900 96.41% 3.3
28,700 97.13% 3.4
22,800 97.72% 3.5
17,900 98.21% 3.6
13,900 98.61% 3.7
10,700 98.93% 3.8
8,200 99.18% 3.9
6,210 99.379% 4.0
4,660 99.534% 4.1
3,470 99.653% 4.2
2,560 99.744% 4.3
1,870 99.813% 4.4
1,350 99.865% 4.5
968 99.903% 4.6
687 99.931% 4.7
483 99.952% 4.8
337 99.966% 4.9
233 99.9767% 5.0
159 99.9841% 5.1
108 99.9892% 5.2
72 99.9928% 5.3
48 99.9952% 5.4
32 99.9968% 5.5
21 99.9979% 5.6
13 99.9987% 5.7
9 99.9991% 5.8
5 99.9995% 5.9
3.4 99.99966% 6.0 Source: Gartner (May 2006)
Acronym Key and Glossary Terms
BAM business activity monitoring
CTQ critical-to-quality
DPMO defects per million opportunities
Publication Date: 31 May 2006/ID Number: G00139413 Page 68 of 68
© 2006 Gartner, Inc. and/or its Affiliates. All Rights Reserved.
ISIC International Standard Industry Classification
P&L profit and loss
RONA return on net assets
SLA service-level agreement
TCO total cost of ownership
TVO total value of opportunity
REGIONAL HEADQUARTERS
Corporate Headquarters 56 Top Gallant Road Stamford, CT 06902-7700 U.S.A. +1 203 964 0096
European Headquarters Tamesis The Glanty Egham Surrey, TW20 9AW UNITED KINGDOM +44 1784 431611
Asia/Pacific Headquarters Gartner Australasia Pty. Ltd. Level 9, 141 Walker Street North Sydney New South Wales 2060 AUSTRALIA +61 2 9459 4600
Japan Headquarters Gartner Japan Ltd. Aobadai Hills, 6F 7-7, Aobadai, 4-chome Meguro-ku, Tokyo 153-0042 JAPAN +81 3 3481 3670
Latin America Headquarters Gartner do Brazil Av. das Nações Unidas, 12551 9° andar—World Trade Center 04578-903—São Paulo SP BRAZIL +55 11 3443 1509