Embed Size (px)
Citation preview
Business Case forBusiness Case for CDISC Standards: Summary
PhRMA-Gartner-CDISC ProjectSeptember 2006
Carol Rozwell, GartnerRebecca Daniels Kush, CDISCRebecca Daniels Kush, CDISCEd Helton, SASFrank Newby, CDISCTanyss Mason, CDISCTanyss Mason, CDISC
© CDISC 2009
CDISC i t l fit i ti th t h
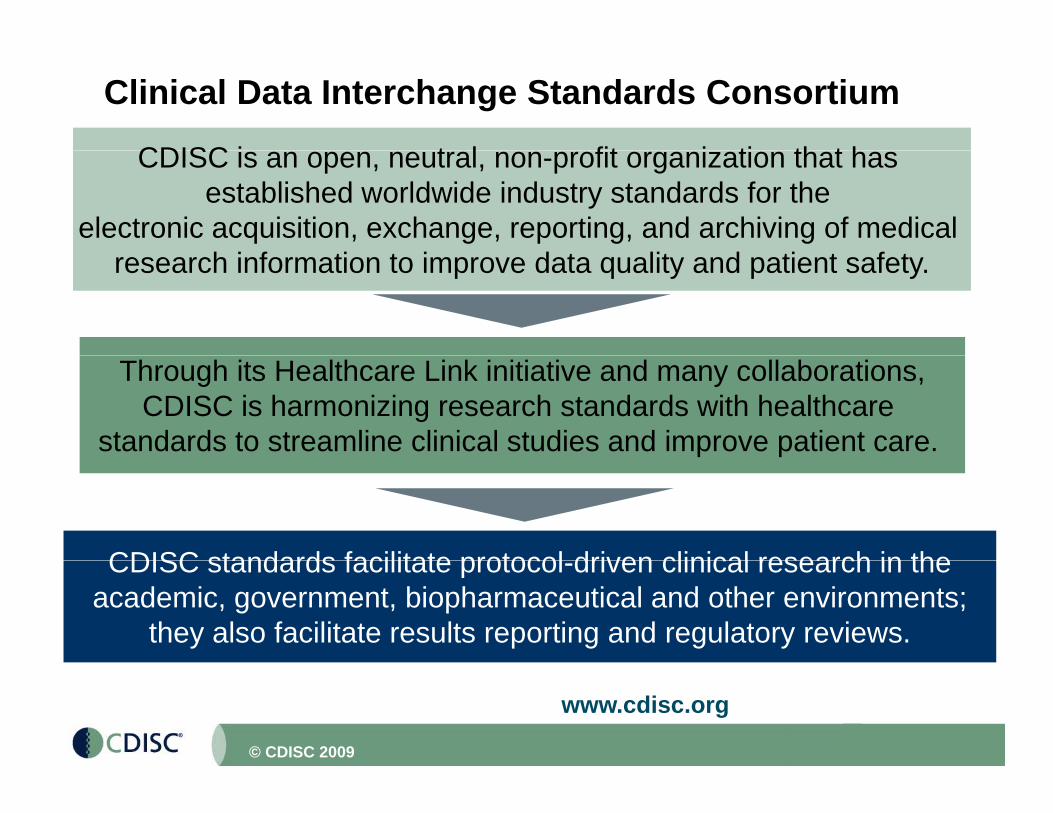
Clinical Data Interchange Standards Consortium
CDISC is an open, neutral, non-profit organization that has established worldwide industry standards for the
electronic acquisition, exchange, reporting, and archiving of medical h i f ti t i d t lit d ti t f tresearch information to improve data quality and patient safety.
Through its Healthcare Link initiative and many collaborations,CDISC is harmonizing research standards with healthcare
standards to streamline clinical studies and improve patient care.
CDISC standards facilitate protocol driven clinical research in theCDISC standards facilitate protocol-driven clinical research in the academic, government, biopharmaceutical and other environments;
they also facilitate results reporting and regulatory reviews.
2
www.cdisc.org
© CDISC 2009
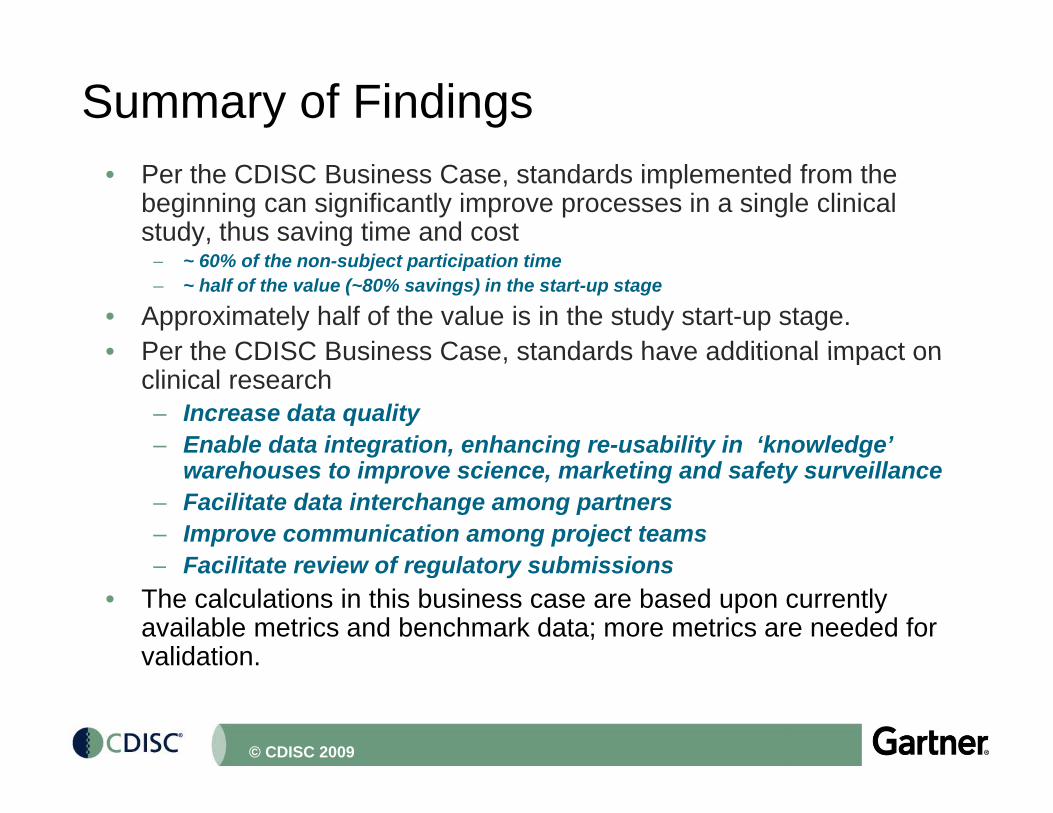
Summary of Findings• Per the CDISC Business Case, standards implemented from the
beginning can significantly improve processes in a single clinical study, thus saving time and cost
– ~ 60% of the non-subject participation time– ~ half of the value (~80% savings) in the start-up stage
• Approximately half of the value is in the study start-up stage.• Per the CDISC Business Case standards have additional impact onPer the CDISC Business Case, standards have additional impact on
clinical research – Increase data quality– Enable data integration, enhancing re-usability in ‘knowledge’
warehouses to improve science, marketing and safety surveillance– Facilitate data interchange among partners – Improve communication among project teams
Facilitate re ie of reg lator s bmissions– Facilitate review of regulatory submissions• The calculations in this business case are based upon currently
available metrics and benchmark data; more metrics are needed for validation.
3
validation.
© CDISC 2009
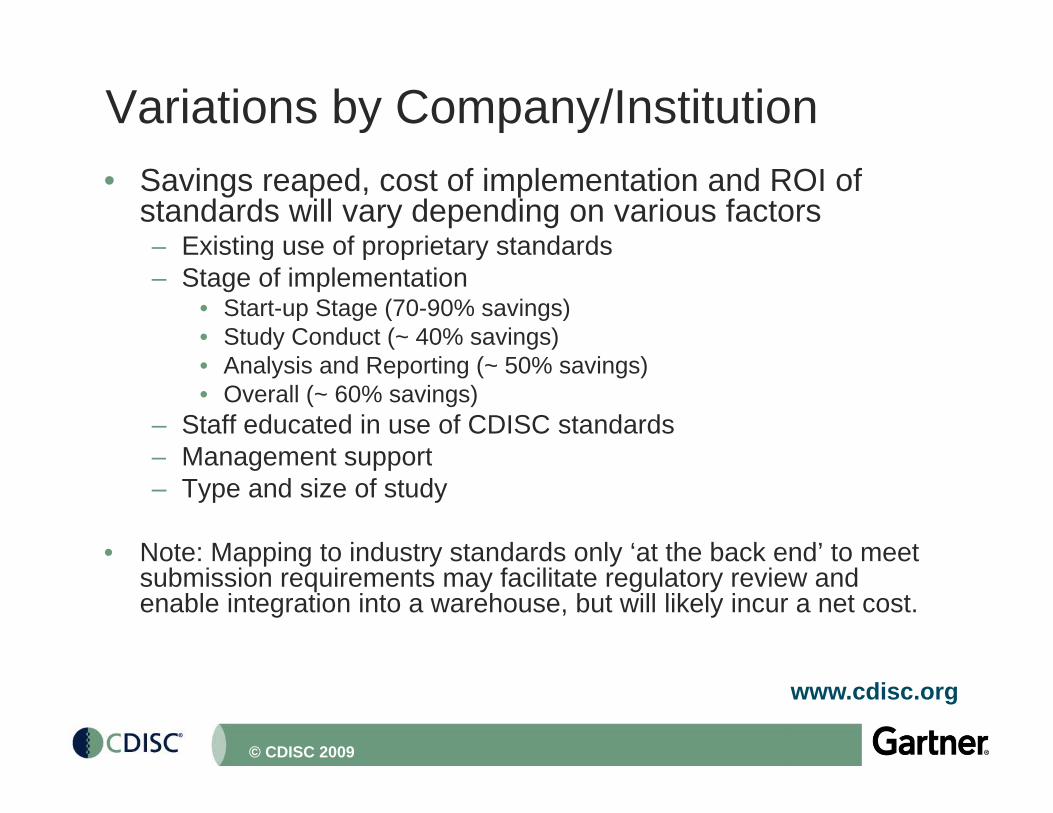
Variations by Company/Institution• Savings reaped, cost of implementation and ROI of
standards will vary depending on various factors– Existing use of proprietary standardsExisting use of proprietary standards– Stage of implementation
• Start-up Stage (70-90% savings)• Study Conduct (~ 40% savings)• Analysis and Reporting (~ 50% savings)• Overall (~ 60% savings)
– Staff educated in use of CDISC standards– Management support– Management support– Type and size of study
• Note: Mapping to industry standards only ‘at the back end’ to meetNote: Mapping to industry standards only at the back end to meet submission requirements may facilitate regulatory review and enable integration into a warehouse, but will likely incur a net cost.
4
www.cdisc.org
© CDISC 2009
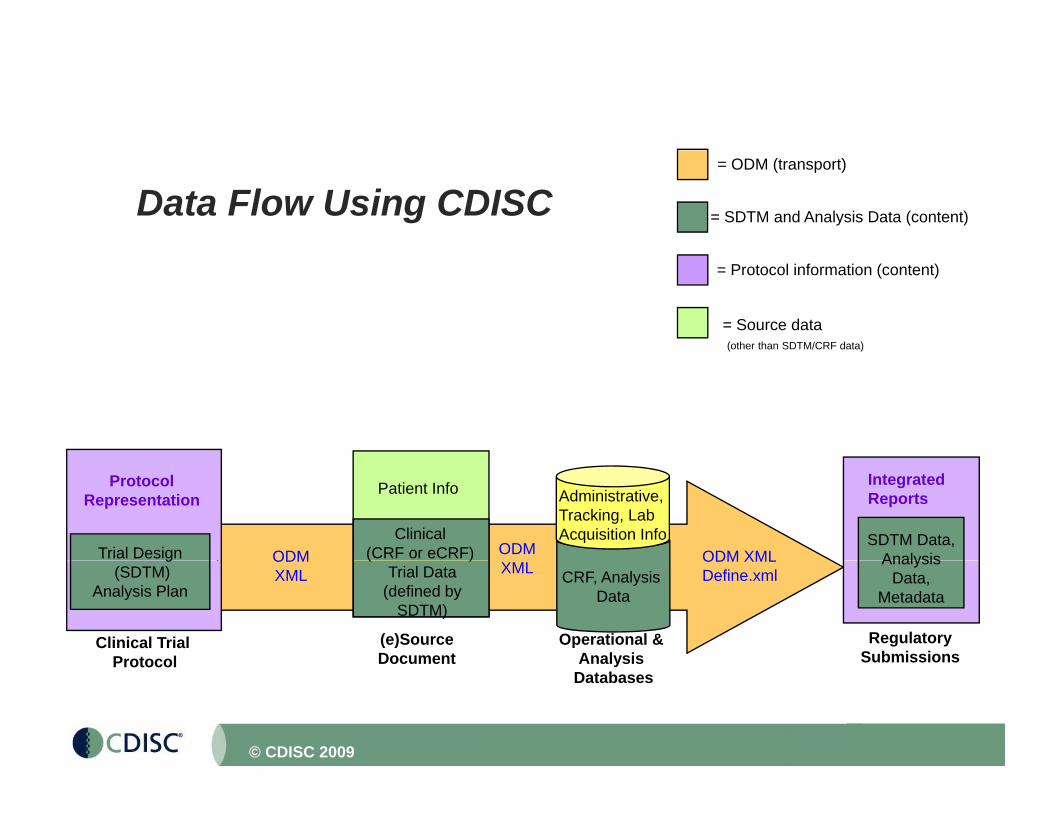
Data Flow Using CDISC = SDTM and Analysis Data (content)
= ODM (transport)
= Protocol information (content)
= Source data(other than SDTM/CRF data)
SDTM Data, Analysis
Patient Info
Clinical (CRF or eCRF) ODM ODM XMLODM
Administrative,Tracking, Lab Acquisition Info
IntegratedReports
Trial Design
ProtocolRepresentation
Analysis Data,
Metadata CRF, Analysis
Data
RegulatorySubmissions
(e)SourceDocument
Operational & Analysis
( )Trial Data
(defined bySDTM)
XMLODM XMLDefine.xml
ODMXML
g(SDTM)
Analysis Plan
Clinical Trial Protocol
5
Document Analysis Databases
Protocol
© CDISC 2009
The mission of CDISC is to develop and support global, platform-independent
data standards that enable information system interoperabilitysystem interoperability
to improve medical research and related areas of healthcareareas of healthcare.
6© CDISC 2009
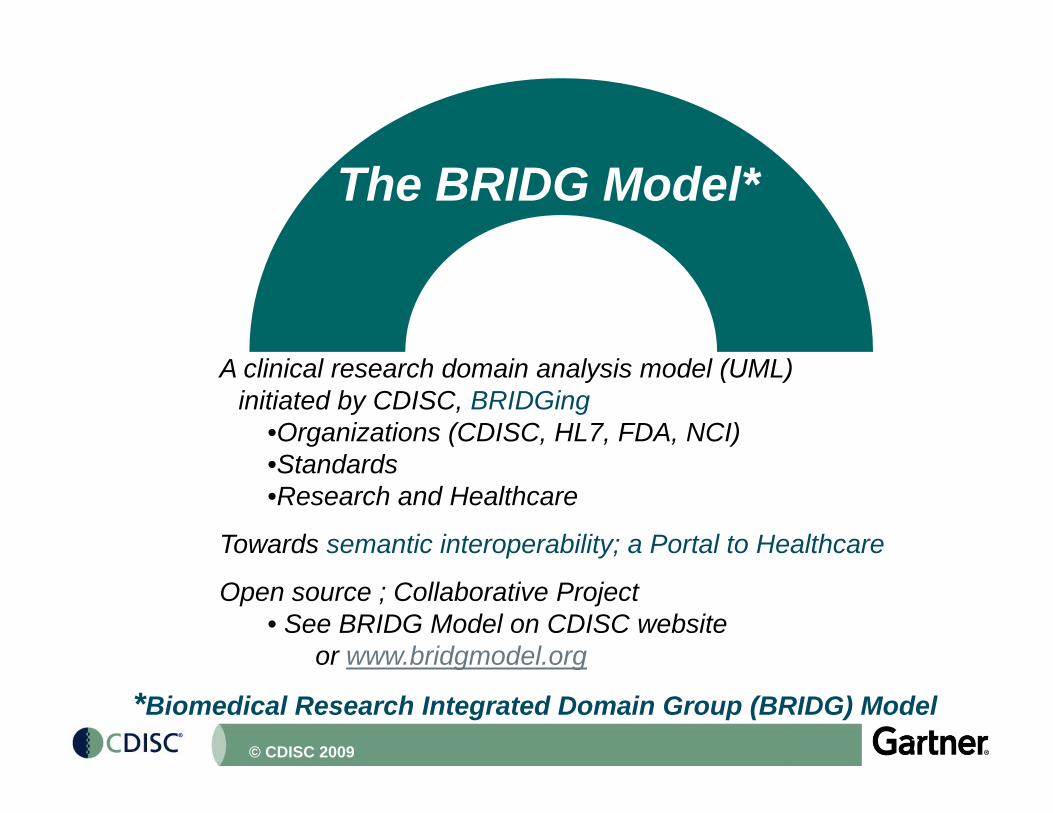
The BRIDG Model*
A clinical research domain analysis model (UML)initiated by CDISC, BRIDGing
•Organizations (CDISC, HL7, FDA, NCI)St d d•Standards
•Research and Healthcare
Towards semantic interoperability; a Portal to Healthcare
Open source ; Collaborative Project• See BRIDG Model on CDISC website
or www.bridgmodel.org
7
or www.bridgmodel.org
*Biomedical Research Integrated Domain Group (BRIDG) Model© CDISC 2009
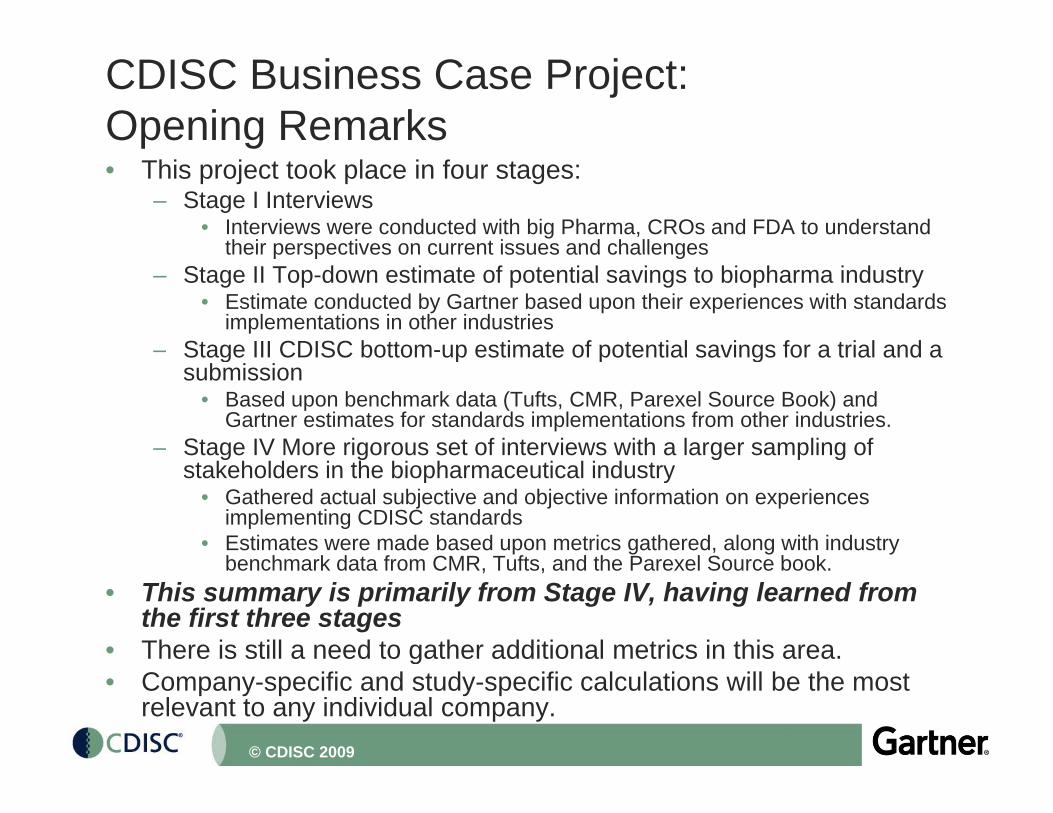
CDISC Business Case Project: Opening Remarks• This project took place in four stages:
– Stage I Interviews• Interviews were conducted with big Pharma, CROs and FDA to understand
their perspectives on current issues and challengestheir perspectives on current issues and challenges– Stage II Top-down estimate of potential savings to biopharma industry
• Estimate conducted by Gartner based upon their experiences with standards implementations in other industries
– Stage III CDISC bottom-up estimate of potential savings for a trial and aStage III CDISC bottom up estimate of potential savings for a trial and a submission
• Based upon benchmark data (Tufts, CMR, Parexel Source Book) and Gartner estimates for standards implementations from other industries.
– Stage IV More rigorous set of interviews with a larger sampling of g g g p gstakeholders in the biopharmaceutical industry
• Gathered actual subjective and objective information on experiences implementing CDISC standards
• Estimates were made based upon metrics gathered, along with industry benchmark data from CMR Tufts and the Parexel Source bookbenchmark data from CMR, Tufts, and the Parexel Source book.
• This summary is primarily from Stage IV, having learned from the first three stages
• There is still a need to gather additional metrics in this area.
8
g• Company-specific and study-specific calculations will be the most
relevant to any individual company.© CDISC 2009
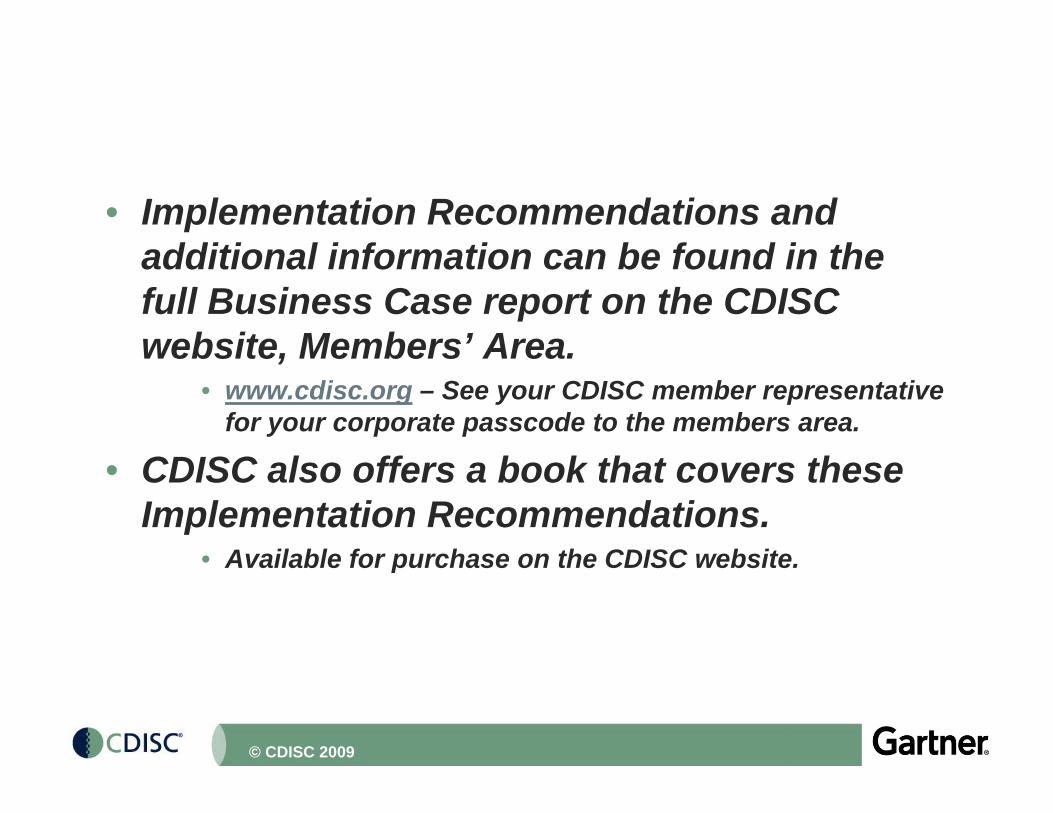
• Implementation Recommendations and additional information can be found in theadditional information can be found in the full Business Case report on the CDISC website, Members’ Area.website, Members Area.
• www.cdisc.org – See your CDISC member representative for your corporate passcode to the members area.
CDISC l ff b k th t th• CDISC also offers a book that covers these Implementation Recommendations.
• Available for purchase on the CDISC website• Available for purchase on the CDISC website.
9© CDISC 2009
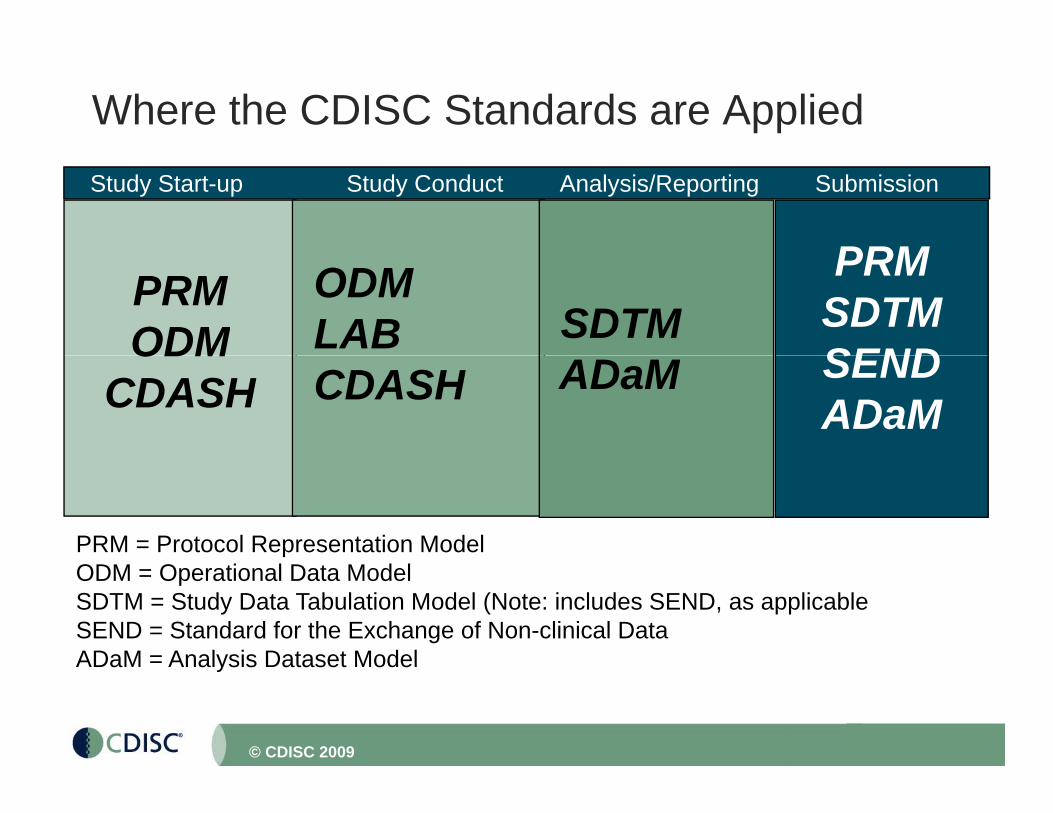
Where the CDISC Standards are AppliedStudy Start-up Study Conduct Analysis/Reporting
PRM
Submission
PRMODM
ODMLAB SDTM
PRMSDTMSENDODM
CDASH CDASH ADaM SENDADaM
PRM = Protocol Representation ModelODM = Operational Data ModelSDTM = Study Data Tabulation Model (Note: includes SEND, as applicableSEND = Standard for the Exchange of Non-clinical DataADaM = Analysis Dataset Model
10
ADaM Analysis Dataset Model
© CDISC 2009
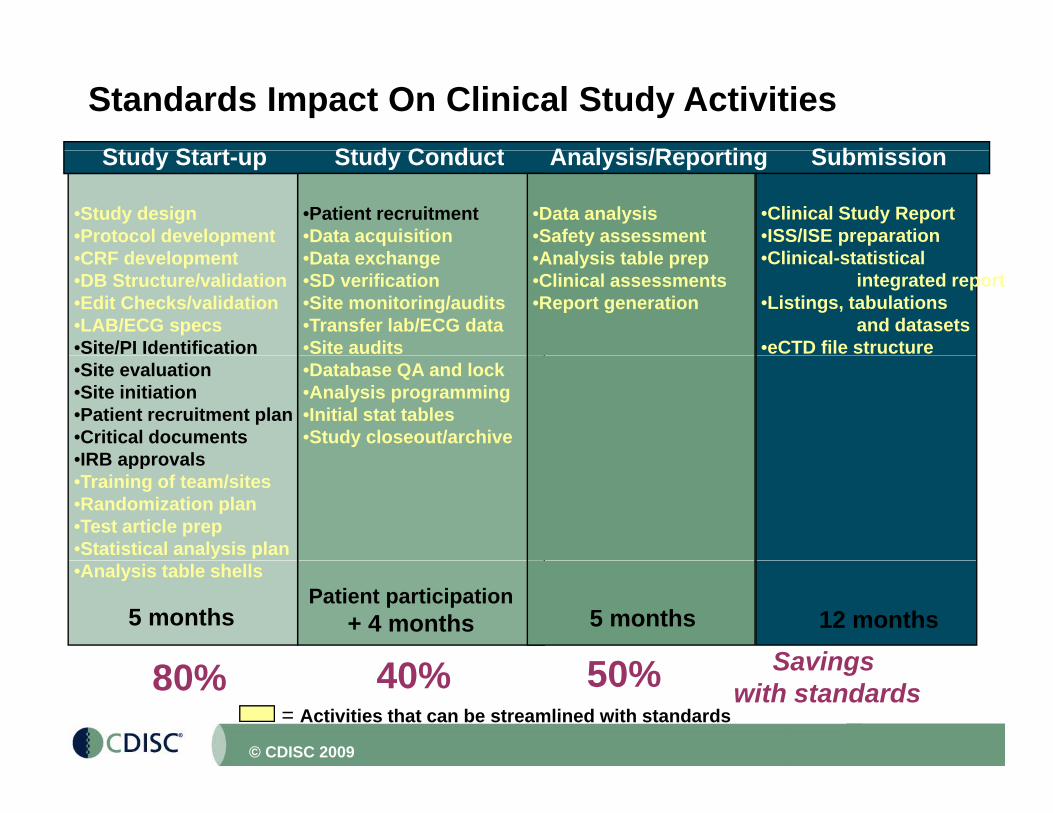
St d St t St d C d t A l i /R ti S b i i
Standards Impact On Clinical Study ActivitiesStudy Start-up Study Conduct Analysis/Reporting Submission
•Study design •Protocol developmentCRF d l t
•Patient recruitment•Data acquisitionD t h
•Data analysis•Safety assessmentA l i t bl
•Clinical Study Report•ISS/ISE preparationCli i l t ti ti l•CRF development
•DB Structure/validation•Edit Checks/validation•LAB/ECG specs•Site/PI Identification
•Data exchange•SD verification •Site monitoring/audits•Transfer lab/ECG data•Site audits
•Analysis table prep•Clinical assessments•Report generation
•Clinical-statistical integrated report
•Listings, tabulations and datasets
•eCTD file structure •Site evaluation •Site initiation•Patient recruitment plan•Critical documents•IRB approvals
•Database QA and lock•Analysis programming•Initial stat tables •Study closeout/archive
•IRB approvals•Training of team/sites•Randomization plan•Test article prep•Statistical analysis plan•Analysis table shells
5 monthsPatient participation
+ 4 months 5 months 12 months
40% 50% Savings
11
= Activities that can be streamlined with standards80% 40% 50% Savings
with standards
© CDISC 2009
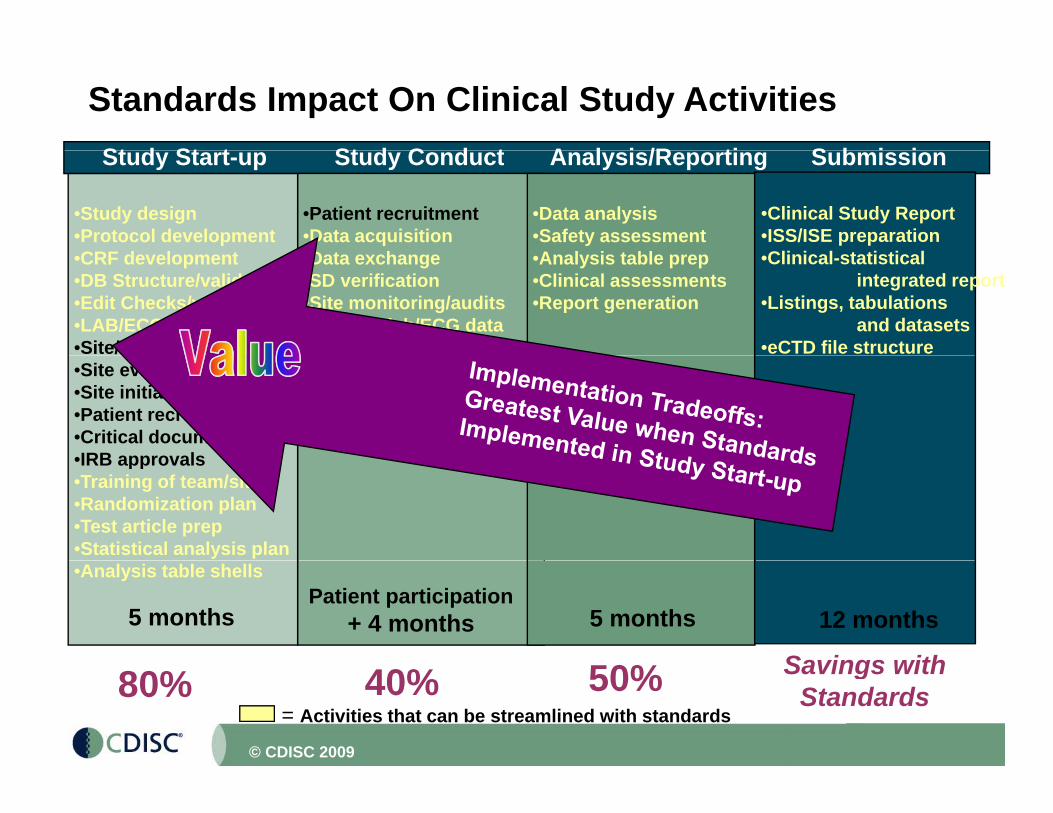
St d St t St d C d t A l i /R ti S b i i
Standards Impact On Clinical Study ActivitiesStudy Start-up Study Conduct Analysis/Reporting Submission
•Study design •Protocol developmentCRF d l t
•Patient recruitment•Data acquisitionD t h
•Data analysis•Safety assessmentA l i t bl
•Clinical Study Report•ISS/ISE preparationCli i l t ti ti l•CRF development
•DB Structure/validation•Edit Checks/validation•LAB/ECG specs•Site/PI Identification
•Data exchange•SD verification •Site monitoring/audits•Transfer lab/ECG data•Site audits
•Analysis table prep•Clinical assessments•Report generation
•Clinical-statistical integrated report
•Listings, tabulations and datasets
•eCTD file structure •Site evaluation •Site initiation•Patient recruitment plan•Critical documents•IRB approvals
•Database QA and lock•Analysis programming•Initial stat tables •Study closeout/archive
•IRB approvals•Training of team/sites•Randomization plan•Test article prep•Statistical analysis plan•Analysis table shells
5 monthsPatient participation
+ 4 months 5 months 12 months
Savings with
12
= Activities that can be streamlined with standards80% 40% 50% Savings with
Standards
© CDISC 2009
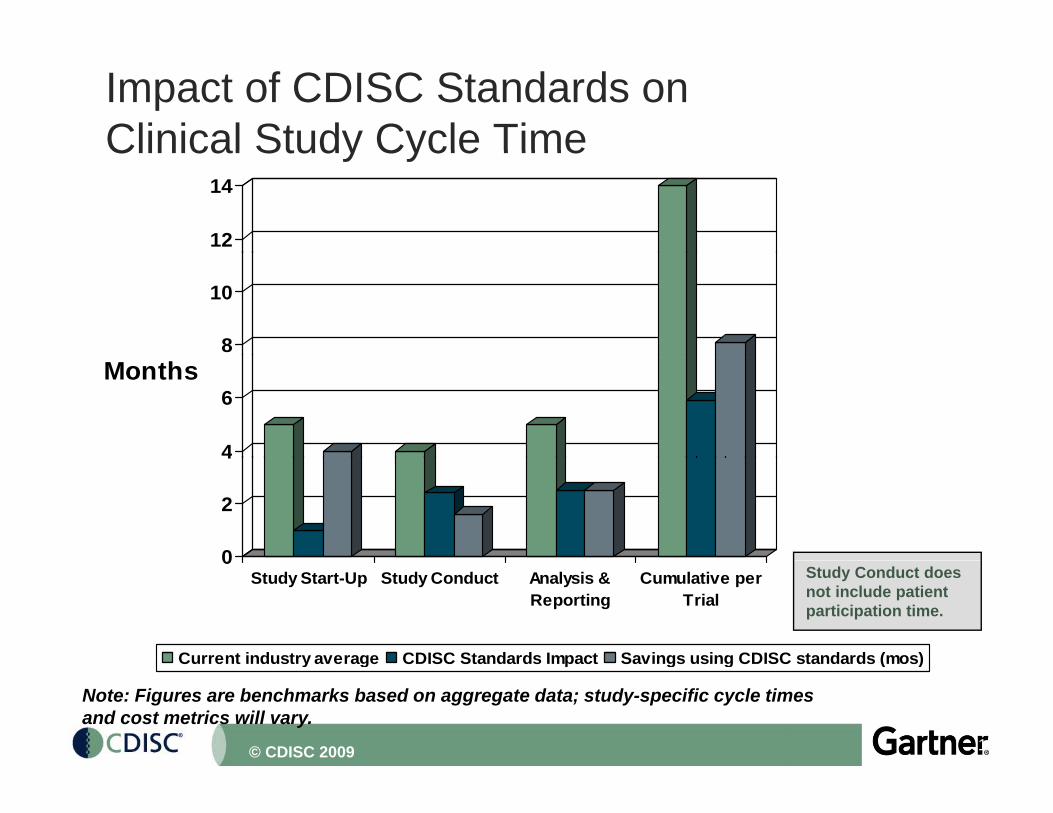
Impact of CDISC Standards onClinical Study Cycle TimeClinical Study Cycle Time
12
14
8
10
4
6Months
0
2
4
0Study Start-Up Study Conduct Analysis &
ReportingCumulative per
Trial
Current industry average CDISC Standards Impact Savings using CDISC standards (mos)
Study Conduct does not include patient participation time.
13
Current industry average CDISC Standards Impact Savings using CDISC standards (mos)
Note: Figures are benchmarks based on aggregate data; study-specific cycle times and cost metrics will vary.
© CDISC 2009
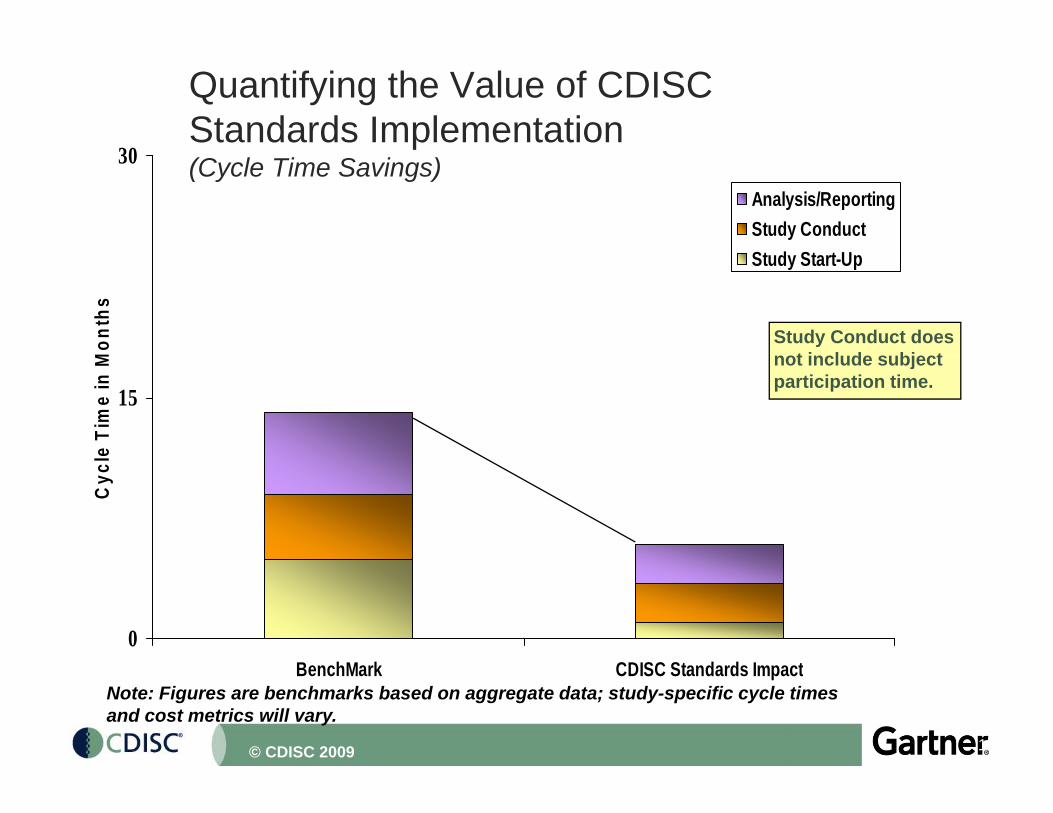
Quantifying the Value of CDISCStandards Implementation
30 (Cycle Time Savings)30
Analysis/ReportingStudy ConductSt d St t U
Mon
ths
Study Start-Up
Study Conduct does t i l d bj t
15
e Ti
me
in M not include subject
participation time.
Cyc
l
0B hM k CDISC St d d I t
14
BenchMark CDISC Standards ImpactNote: Figures are benchmarks based on aggregate data; study-specific cycle times and cost metrics will vary.
© CDISC 2009
Start-up
% Savings
Net mos
Conduct mos w/o
% Svngs
Net mos
Analysis &
% Svngs
Net mos
Total mos
Cost Savings
“Value”(Cost of
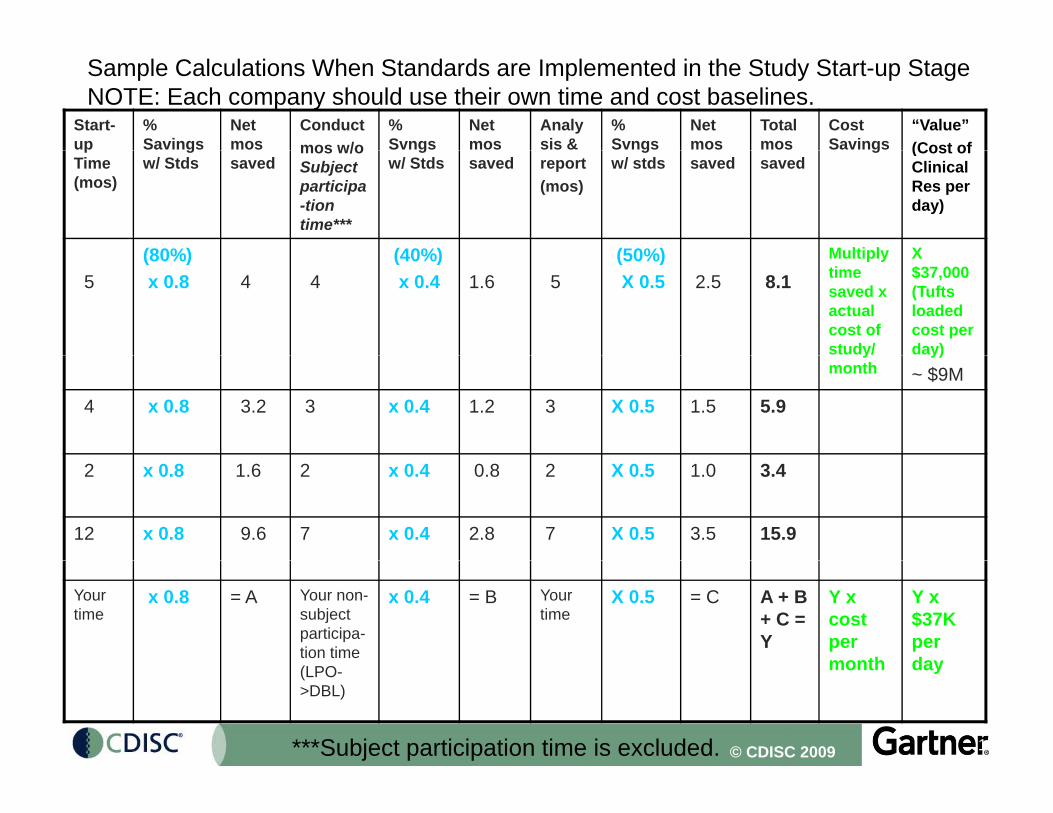
Sample Calculations When Standards are Implemented in the Study Start-up StageNOTE: Each company should use their own time and cost baselines.
pTime (mos)
gw/ Stds saved
mos w/o Subject participa-tion time***
gw/ Stds saved report
(mos)
gw/ stds saved saved
g (Cost of Clinical Res per day)
(80%) (40%) (50%) Multiply X
5(80%)x 0.8 4 4
(40%)x 0.4 1.6 5
(50%)X 0.5 2.5 8.1
Multiply time saved x actual cost of study/
X $37,000 (Tufts loaded cost per day) y
monthy)
~ $9M
4 x 0.8 3.2 3 x 0.4 1.2 3 X 0.5 1.5 5.9
2 x 0.8 1.6 2 x 0.4 0.8 2 X 0.5 1.0 3.4
12 x 0.8 9.6 7 x 0.4 2.8 7 X 0.5 3.5 15.9
Your time
x 0.8 = A Your non-subject participa-tion time
x 0.4 = B Your time
X 0.5 = C A + B + C = Y
Y x cost per month
Y x $37K per day
© CDISC 2009 15
(LPO->DBL)
month day
***Subject participation time is excluded.
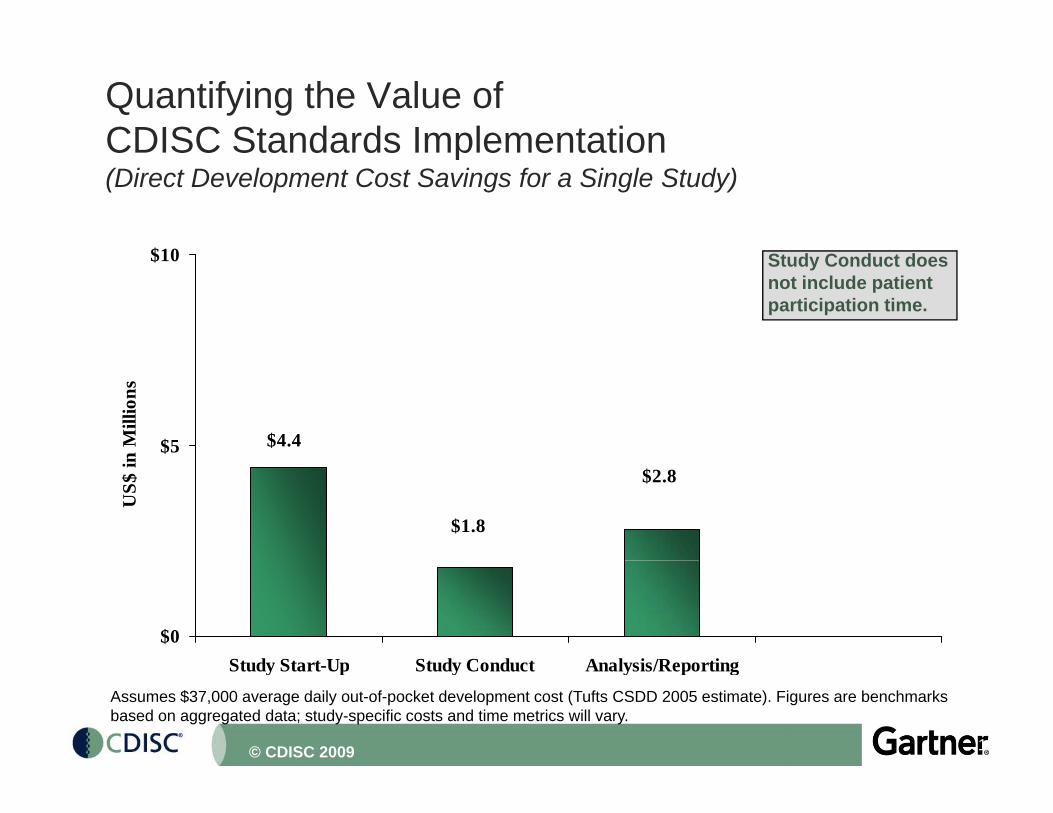
Quantifying the Value of CDISC Standards ImplementationCDISC Standards Implementation(Direct Development Cost Savings for a Single Study)
$10$10 Study Conduct does not include patient participation time.
$4.4$5n M
illio
ns
$2.8
$1.8
US$
in
$0Study Start Up Study Conduct Analysis/Reporting
16
Study Start-Up Study Conduct Analysis/ReportingAssumes $37,000 average daily out-of-pocket development cost (Tufts CSDD 2005 estimate). Figures are benchmarksbased on aggregated data; study-specific costs and time metrics will vary.
© CDISC 2009
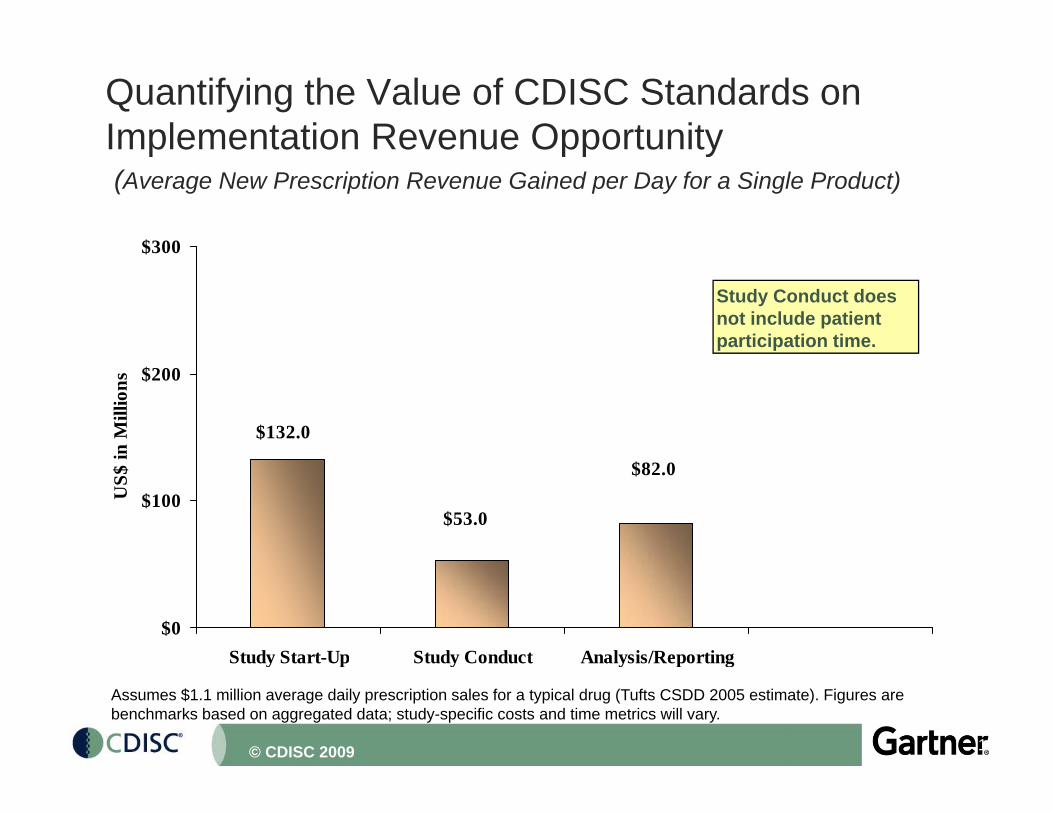
Quantifying the Value of CDISC Standards on Implementation Revenue Opportunityp pp y(Average New Prescription Revenue Gained per Day for a Single Product)
$300$300
Study Conduct does not include patient participation time.
$132.0
$200
in M
illio
ns
$82.0
$53.0$100U
S$ i
$0Study Start-Up Study Conduct Analysis/Reporting
17
Study Start Up Study Conduct Analysis/Reporting
Assumes $1.1 million average daily prescription sales for a typical drug (Tufts CSDD 2005 estimate). Figures are benchmarks based on aggregated data; study-specific costs and time metrics will vary.
© CDISC 2009
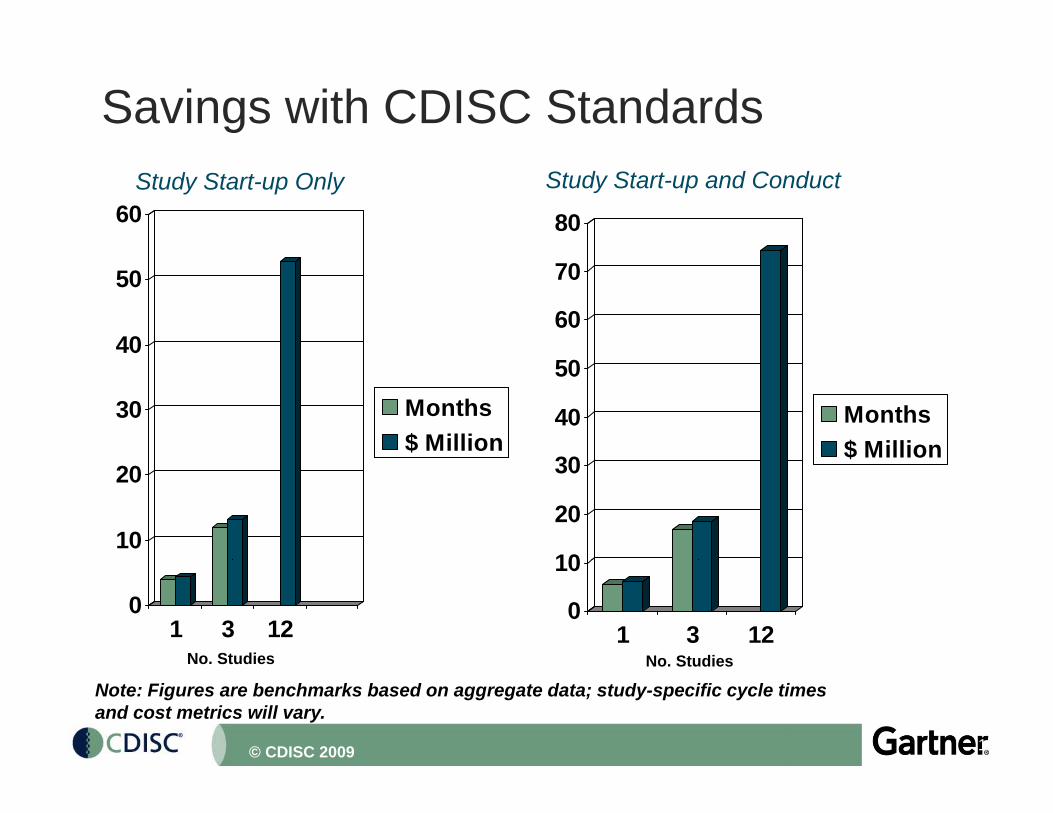
Savings with CDISC Standards
60 80Study Start-up Only Study Start-up and Conduct
40
5060
70
30 Months$ Million
30
40
50
Months$ Million
10
20
10
20
30 $
01 3 12
0
10
1 3 12No. Studies No Studies
18
No. Studies No. Studies
Note: Figures are benchmarks based on aggregate data; study-specific cycle times and cost metrics will vary.
© CDISC 2009
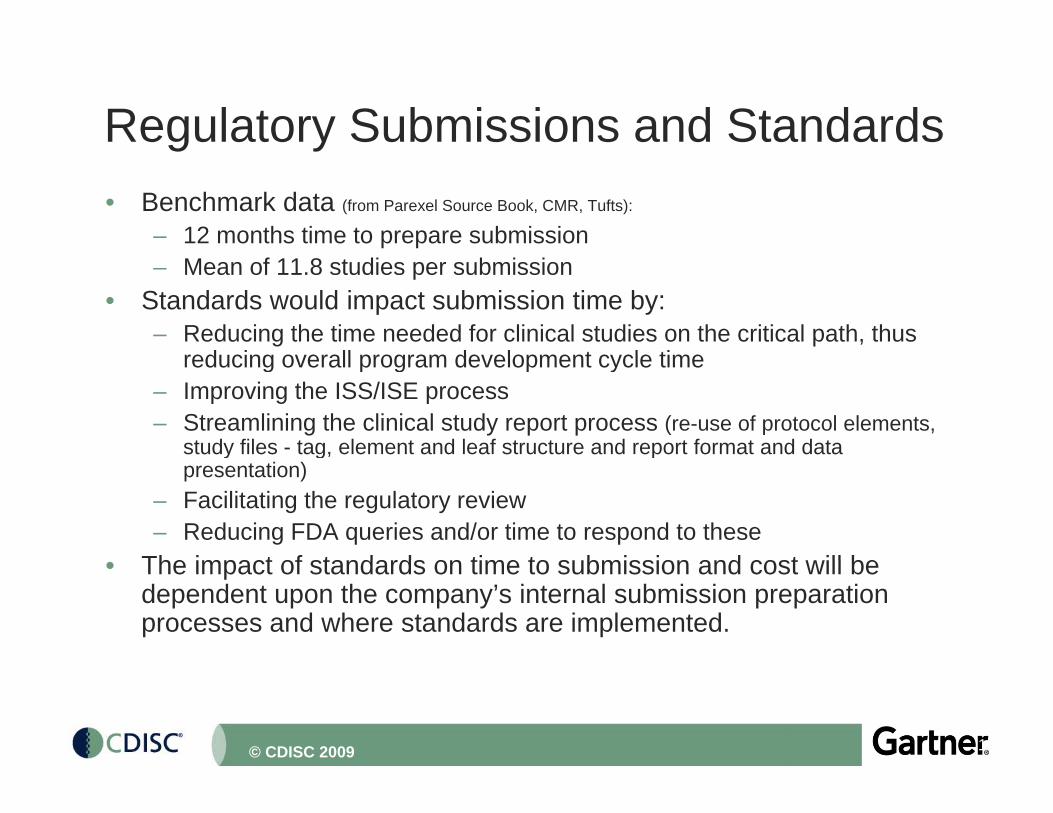
Regulatory Submissions and Standardsg y• Benchmark data (from Parexel Source Book, CMR, Tufts):
– 12 months time to prepare submission– Mean of 11.8 studies per submission
• Standards would impact submission time by:– Reducing the time needed for clinical studies on the critical path, thus
reducing overall program development cycle timereducing overall program development cycle time– Improving the ISS/ISE process– Streamlining the clinical study report process (re-use of protocol elements,
study files - tag, element and leaf structure and report format and data y g ppresentation)
– Facilitating the regulatory review – Reducing FDA queries and/or time to respond to these
The impact of standards on time to submission and cost will be• The impact of standards on time to submission and cost will be dependent upon the company’s internal submission preparation processes and where standards are implemented.
19© CDISC 2009
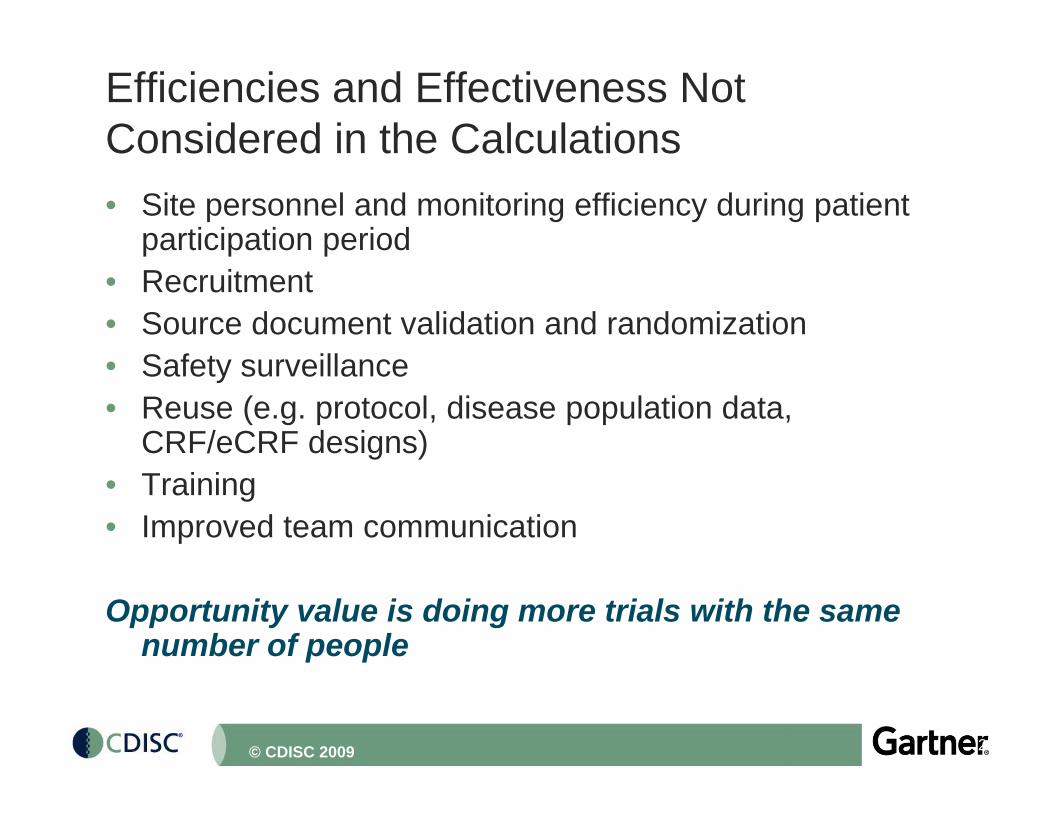
Efficiencies and Effectiveness Not Considered in the CalculationsConsidered in the Calculations• Site personnel and monitoring efficiency during patient
participation periodp p p• Recruitment• Source document validation and randomization
S f t ill• Safety surveillance• Reuse (e.g. protocol, disease population data,
CRF/eCRF designs)g )• Training• Improved team communication
Opportunity value is doing more trials with the same number of people
20© CDISC 2009
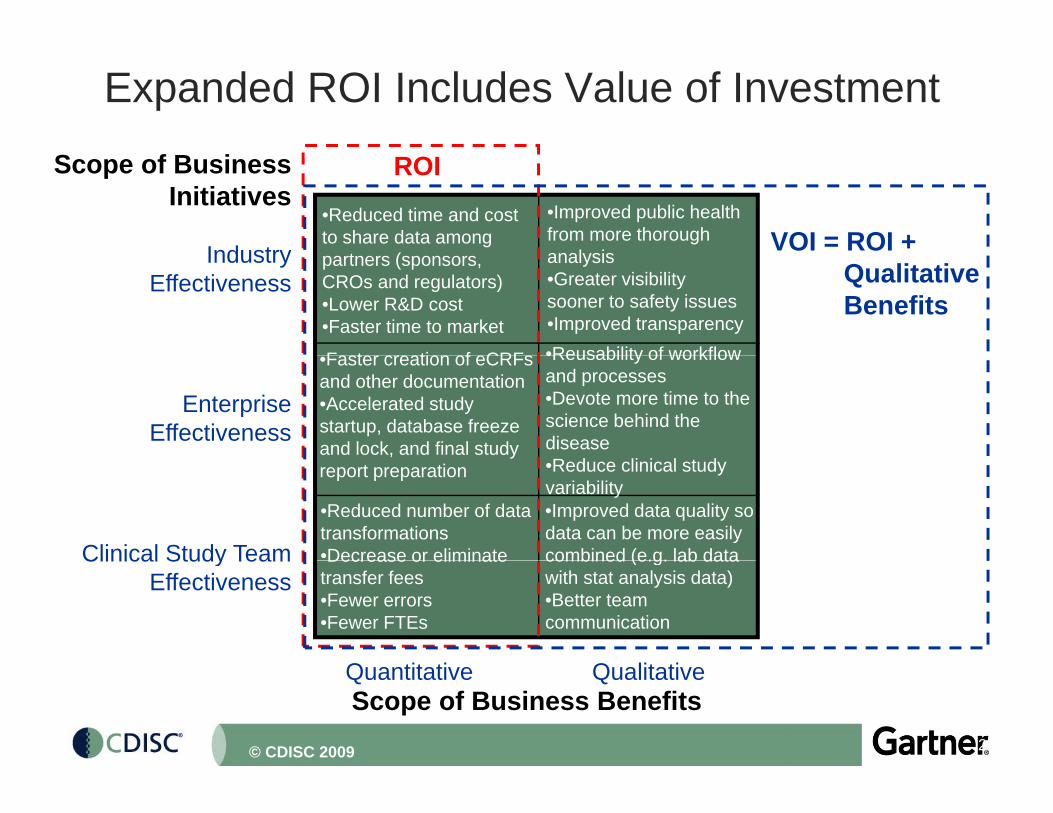
Expanded ROI Includes Value of Investment
Scope of BusinessInitiatives
ROI
VOI = ROI +Industry
•Improved public health from more thorough
l i
•Reduced time and cost to share data among
t ( QualitativeBenefits
IndustryEffectiveness
F t ti f CRF •Reusability of workflow
analysis•Greater visibility sooner to safety issues•Improved transparency
partners (sponsors, CROs and regulators)•Lower R&D cost•Faster time to market
EnterpriseEffectiveness
•Faster creation of eCRFs and other documentation•Accelerated study startup, database freeze and lock, and final study
•Reusability of workflow and processes•Devote more time to the science behind the disease
Clinical Study Team
•Reduced number of data transformations•Decrease or eliminate
•Improved data quality so data can be more easily combined (e.g. lab data
yreport preparation •Reduce clinical study
variability
Q tit ti Q lit ti
Clinical Study TeamEffectiveness
Decrease or eliminate transfer fees•Fewer errors•Fewer FTEs
combined (e.g. lab data with stat analysis data)•Better team communication
21
Scope of Business BenefitsQuantitative Qualitative
© CDISC 2009
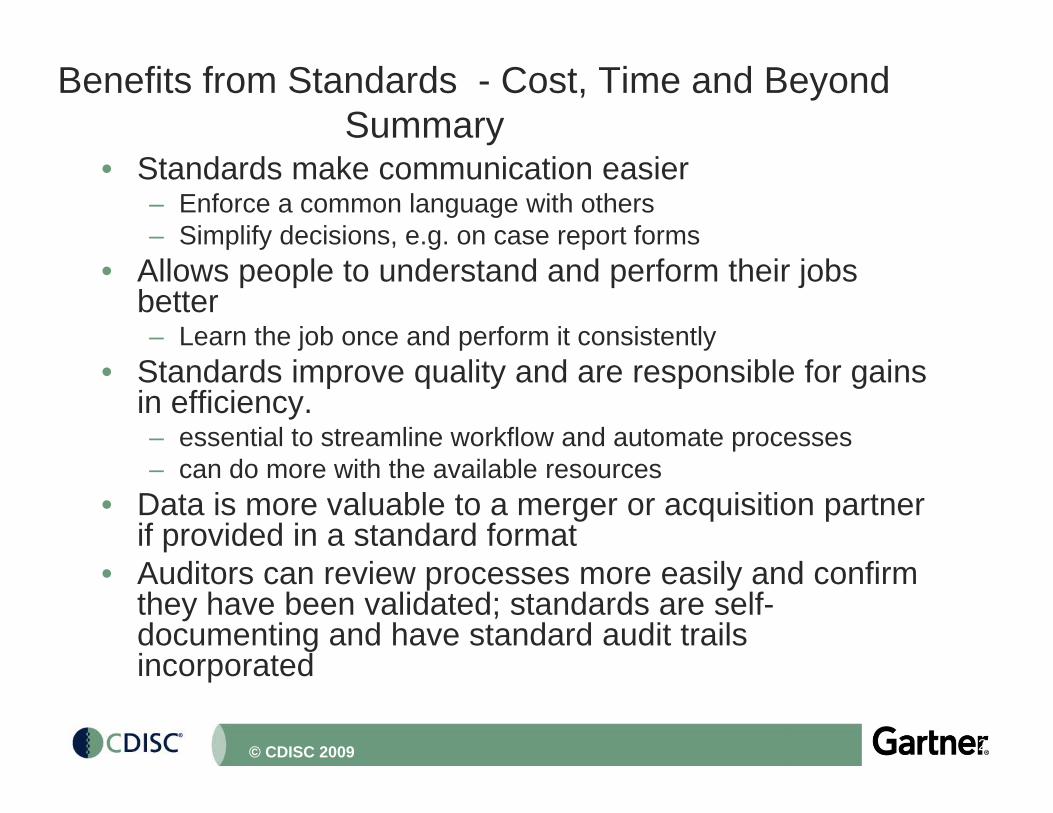
Benefits from Standards - Cost, Time and BeyondSummary
• Standards make communication easier – Enforce a common language with others – Simplify decisions, e.g. on case report forms
• Allows people to understand and perform their jobs better– Learn the job once and perform it consistently
• Standards improve quality and are responsible for gains in efficiency.– essential to streamline workflow and automate processes– can do more with the available resources
• Data is more valuable to a merger or acquisition partner if provided in a standard format
• Auditors can review processes more easily and confirm they have been validated; standards are self-documenting and have standard audit trails incorporated
22
incorporated
© CDISC 2009
Benefits from Standards - Cost, Time and Beyond Summary (2)
• Standards provide new opportunities to use data better because it can be readily integrated; easy joins and merges; can integrate on an ongoing basis– ‘Re-use without re-work’– Ability to respond to regulatory queries more easily (Value up to
$8 M in resources)Eliminate some proposed post marketing studies because– Eliminate some proposed post marketing studies because information and knowledge can be extracted from a standards-based repository
– Information available for trial simulation, knowledge-based trial d i i d f t ill d ffi l ddesign, improved safety surveillance and efficacy analyses and other new insights
• Enables ‘plug and play’ tool/application selection and facilitates retirement of old systemsfacilitates retirement of old systems
• Can use common viewing tools if data are in standard format
• CDISC and HL7 will help make EHR real standards will
23
• CDISC and HL7 will help make EHR real – standards will enable the healthcare and research link
© CDISC 2009
Key Messages for Management from the PhRMA-Gartner-CDISC Projectj
• The value of standards extends far beyond process efficiency.– Higher quality data/information– Realtime integrated data e g safety surveillance marketing submission– Realtime integrated data e.g. safety surveillance, marketing, submission,
study design– Reusability of information to enhance science– Improved communication among project teams and business partners– Facilitated regulatory review process
• Standards save significant time and money, especially when implemented in the study startup stage.
• Organizations are becoming proactively compliant with CDISC standards.– FDA’s endorsement important; mandate still needed
H i ti f t d d li i l h d ith• Harmonization of standards across clinical research and with healthcare is a core strategic goal.– Enter the data only once - at the site
Streamline investigator participation in research
24
– Streamline investigator participation in research
© CDISC 2009
Gartner’s Summary ConclusionsGartner s Summary Conclusions• Most biopharmaceutical companies are:
– spending more money and taking more time to complete clinicalspending more money and taking more time to complete clinical research than is necessary
– not gathering metrics on the industry’s $60B investmenthave duplicate IT infrastructure applications and personnel– have duplicate IT infrastructure, applications and personnel
– getting charged more by vendors (CROs and tech providers) because of extra work for data conversions
i th i i t t ti l liti ti b th– exposing their companies to potential litigation because they cannot routinely mine the data for safety signals
– leaving money on the table because they cannot get realtime i f ti th ‘ t i ’ ( finformation on the ‘customer experience’ (e.g. for new indications)
25© CDISC 2009
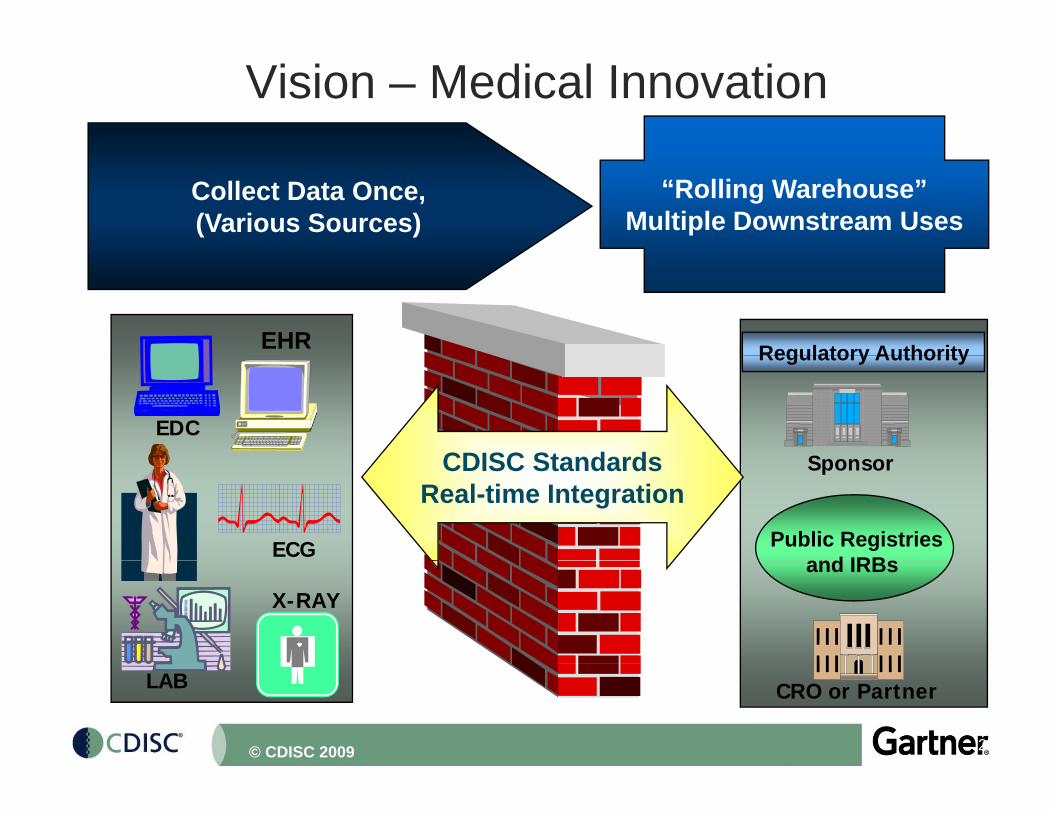
Vision – Medical InnovationData Sources
Collect Data Once,(Various Sources)
“Rolling Warehouse”Multiple Downstream Uses
Regulatory AuthorityEHR
S
Regulatory Authority
EDC
CDISC Standards Sponsor
Public Registriesd IRB
ECG
CDISC StandardsReal-time Integration
and IRBsX-RAY
26
CRO or PartnerLAB
© CDISC 2009
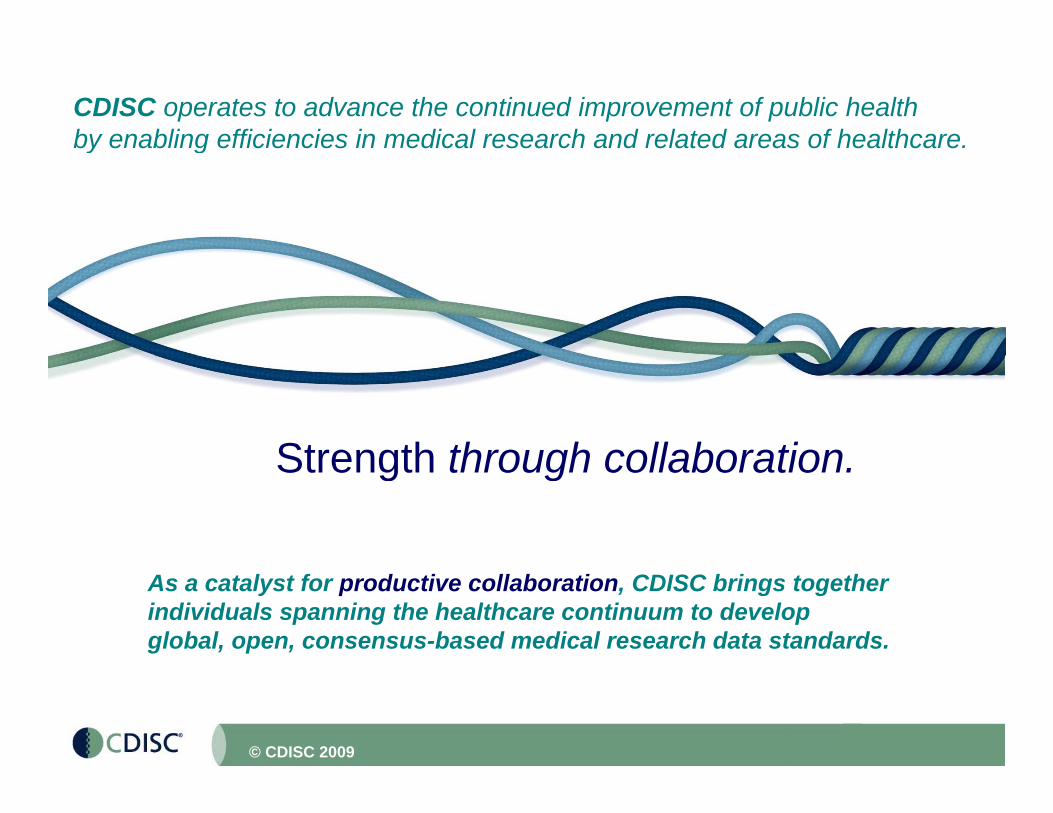
CDISC operates to advance the continued improvement of public health by enabling efficiencies in medical research and related areas of healthcare. y g
Strength through collaborationStrength through collaboration.
As a catalyst for productive collaboration, CDISC brings together individuals spanning the healthcare continuum to develop global, open, consensus-based medical research data standards.
27© CDISC 2009