Embed Size (px)
Citation preview
Volume 4, Number 2, April – June’ 2015
ISSN (Print):2319-9059, (Online):2319-9067
PEZZOTTAITE JOURNALS SJIF (2012): 3.946, SJIF (2013): 5.017, SJIF (2014): 5.912
International Journal of Trade & Global Business Perspectives© Pezzottaite Journals. 1687 |P a g e
THE FINANCIAL LEVERAGE IN INDIA: AN EMPIRICAL STUDY
Gurnam Singh Rasoolpur11
ABSTRACT
This empirical paper makes an attempt to study the financial leverage in India through a case of Shree Digvijay Cement Co.
Ltd. which is lying in top ten companies of cement industry of the Indian corporate sector on the basis of sales for the year
1991-92 by studying its impact either favourable or unfavourable on the equity networth by comparing the rate of return on
total networth (RONat) with cost of preference share capital (Kpat) on after tax basis during the period under study which
covers a time period of ten years (effective nine years) extending from the year 1983 to 1991-92 for the purpose of our study.
The study reveals that leverage ratio2 has rising trend during the period under study, whereas, aggregate leverage ratio2 of the
company is worked out 58.84 percent during the period under study. It is found that preference share capital to equity
networth ratio2 is declining over the period under study. It is below 3.03 percent during the period under study excepting the
year 1983 when it is 5.76 percent which shows that amount of preference share capital in the equity networth is very small
during the period under study. However, on aggregate basis, aggregate preference share capital to equity networth ratio2 of the
company is worked out 1.89 percent during the period under study. It is observed that cost of preference share capital (Kpat) is
varying from 8.63 percent to 14 percent with rising trend during the period under study. Aggregate cost of preference share
capital (Kpat) of the company is worked out 9.66 percent during the period under study. It is also found that for five out of nine
years under study, the company incurred losses leading to negative rate of return on total networth (RONat) and rate of return
on equity networth (ROENat) on after tax basis. This happened for the years 1986, 1987, 1988-89, 1989-90 and 1990-91during
the period under study. On aggregate basis, aggregate rate of return on total networth (RONat) and rate of return on equity
networth (ROENat) on after basis have been worked out -4.86 percent and -5.14 percent, respectively, during the period under
study. In nutshell, it is concluded that the company is suffering from unfavourable leverage with regard to use of preference
share capital during eight out of nine years as well as on aggregate basis under study period. Consequently, rate of return on
equity networth (ROENat) is less than cost of preference share capital (Kpat) as well as rate of return on total networth (RONat)
in the above said eight years over the period under study. It means that use of preference share capital in the capital structure
of the company has negative impact on the profitability of the company during eight out of nine years under study, whereas,
on aggregate basis, it has also same impact on the profitability of the company during study period which consequently is not
contributing to the equity networth of the company which ultimately is not benefitting to the equity share holders of the
company. It is also found that amount of preference share capital in the equity networth is very small during the period under
study.
KEYWORDS
Return on Networth, Return on Equity Networth, Cost of Preference Share Capital etc.
INTRODUCTION
The main purpose of a firm for using financial advantage is to magnify the shareholders‘ return under favourable economic
conditions with the ultimate aim of increasing the value of each share. ―The use of the fixed charges funds, such as debt and
preference capital along with the owner‘s equity in the capital structure is described as financial leverage or trading on equity. The
financial leverage employed by a company is intended to earn more on the fixed charges funds than their costs. The surplus will
increase the return on the owners‘ equity i.e. the rate of return on the owner‘s equity is levered above the rate of return on total
assets‖(Pandey, I. M., 2010, p 317-18). Cost of preference share capital is lower than the cost of equity share capital because
preference shareholders are having two preferences (i.e. payment of dividend and repayment of principal amount at the time of
liquidation) over the equity shareholders. However, cost of debt is lower than cost of preference share capital as well as equity
share capital because the debt holders are the first claimants on the firm‘s assets at time of its liquidation. Similarly, they are the
first to be paid their interest before any dividend is paid to preference and equity shareholders. Interest paid to the debt holders is
an item chargeable to profits of a firm. However, the interest and principal repayment on debt are definite obligations that are
payable irrespective of the financial situation of a firm. Therefore, debt is riskier. It enhances the financial risk. Also, if interest
and principal payments on debt are not promptly met when due, bankruptcy, loss of control for the owners may occur. It will turn
out that use of some debt by the firm is desirable and a strong case can be made for the existence of an optimal capital structure, or
debt/equity mix. A firm should make a judicious mix of both debt and equity to achieve a capital structure, which may be the
optimal capital structure. Modigiliani and Miller (1959) gave logically consistent behavioral justification for this relationship and
denied the existence of an optimum capital structure. Barges (1963) tested the M-M hypothesis and found that the cost of capital
comes down with leverage. Singh (1998) observed that cost of capital is a significant factor in case of large-size companies, while
it is not a significant factor affecting capital structure of companies in case of medium and small-size companies. The primary aim
11Associate Professor (Commerce), P.G. Department of Commerce & Business Management, Guru Nanak College, Punjab, India,
Volume 4, Number 2, April – June’ 2015
ISSN (Print):2319-9059, (Online):2319-9067
PEZZOTTAITE JOURNALS SJIF (2012): 3.946, SJIF (2013): 5.017, SJIF (2014): 5.912
International Journal of Trade & Global Business Perspectives© Pezzottaite Journals. 1688 |P a g e
of corporate management is to maximize shareholders‘ value and the value of a firm in a legal and ethical manner. So, a financial
manager should consider a number of factors to set an optimal capital structure for a firm giving considerable weight to earning
rate, collateral value of assets, age, cash flow coverage ratio, cost of borrowing, size (net sales), dividend payout ratio, debt
service ratio, cost of borrowing, corporate tax rate, current ratio, growth rate, operating leverage and uniqueness (selling
cost/sales) etc. The choice between debt and equity to finance a firm‘s assets involves a trade-off between risk and return (Pandey,
Chotigeat & Ranjit, 2000). The excessive use of debt may endanger the survival of a firm, while a conservative use of debt may
deprive the firm in leveraging return to equity owners. Therefore, for taking more benefits of debt capital also by keeping away
firms from risks, a desirable debt equity combination must be used in the total capital structure. Thus, the decision regarding debt
equity mix in the capital structure of a firm is of critical one and has to be approached with a great care.
OBJECTIVES OF STUDY
The present study has been undertaken with the following objectives:
To measure the extent of leverage of Shree Digvijay Cement Co. Ltd. from the cement industry of the Indian corporate
sector.
To examine the impact of use and cost of preference share capital on the equity networth of Shree Digvijay Cement Co.
Ltd. of cement industry from the Indian corporate sector.
RESEARCH METHODOLOGY
Data Source, Sample Size & Methodology
For studying the financial leverage in India through a case study, Shree Digvijay Cement Co. Ltd. from the cement industry of the
Indian corporate sector is selected. The study covers a time of ten years (effective nine years) extending from the year 1983 to
1991-92 for the purpose of our research study. The company is lying in top ten companies of cement industry of the Indian
corporate sector based on sales for the year 1991-92 for the purpose of this study. For conducting the present study, data has been
compiled from the different volumes of the Bombay Stock Exchange Official Directory.
In the present study, a maiden attempt has been made to make an in-depth analysis of the financial leverage in India through a
case of Shree Digvijay Cement Co. Ltd. from cement industry of the Indian corporate sector. To analyze the data, the following
ratios along with simple statistical tools like tables, percentages, etc. have been used for achieving the objectives of present study.
Preference Share Capital to Equity Networth Ratio: It can be calculated in the following manner:
Leverage Ratio: It can be calculated in the following manner:
Return on Total Networth on Before Tax Basis (RONbt): It can be calculated in the following manner:
( )
Volume 4, Number 2, April – June’ 2015
ISSN (Print):2319-9059, (Online):2319-9067
PEZZOTTAITE JOURNALS SJIF (2012): 3.946, SJIF (2013): 5.017, SJIF (2014): 5.912
International Journal of Trade & Global Business Perspectives© Pezzottaite Journals. 1689 |P a g e
Return on Total Networth on After Tax Basis (RONat): It can be calculated in the following manner:
( )
Return on Equity Networth (ROENat): It is calculated in the following manner:
Return on Equity Networth (ROENat) =
Cost of Preference Share Capital (Kpat): The following formula is used to calculate the cost of preference share capital:
Cost of Preference Share Capital (Kpat) =
Net Gain: The following is the formula for calculating the Net Gain:
Net Gain = Return on Equity Networth (ROENat) - Return on Total Networth (RONat)
Spread: The following is the formula for calculating the Spread:
Spread = Return on Total Networth (RONat) - Cost of Preference Share Capital (Kpat)
Here Term Debt plus Short Term Loans & Advances comprise of debentures, long-term loans and short-term loans & advances.
Total Networth includes equity share capital, preference share capital, capital reserves including share premium and other
reserves & surplus less intangible assets. Intangible Assets include preliminary expenses, expenses on issue of shares and
debentures, goodwill, technical expertise charges, drawings & designs, patents, trademarks and copyright. While computing total
networth usually accumulated losses are deducted from the aggregate of paid up share capital plus reserves & surplus. However,
in the present study in addition to accumulated losses, goodwill, trademark, patents, & copyright have also been deducted. It is so
because separate amount of accumulated losses is not available in the Bombay Stock Exchange Official Directory. Total networth
has been also adjusted for the accounting year 1988-89 due to the change in the length of accounting year from 1st of April to 31st
of March in the next year. Depreciation, interest charges and profits and/or losses have been changed proportionately.
EMPIRICAL RESULTS
Preference Share Capital to Equity Networth Ratio
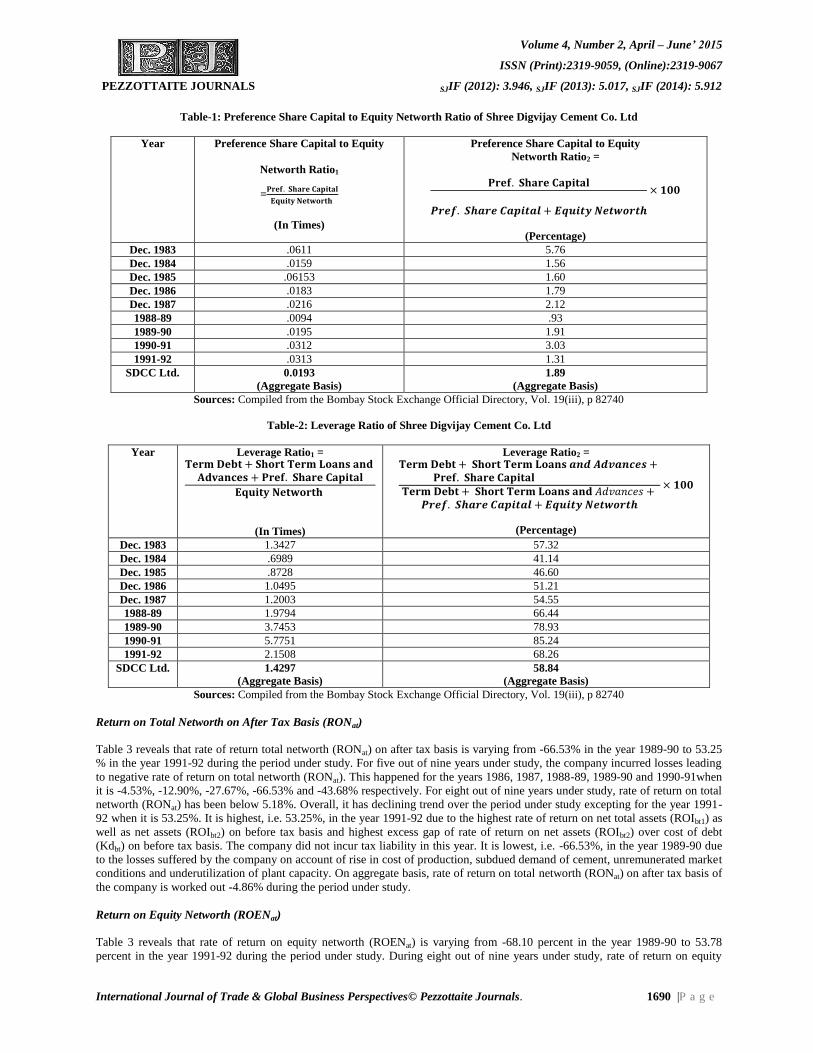
Table 1 reveals that preference share capital to equity networth ratio2 is varying from 5.76 percent in the year 1983 to 0.93 percent
in the year 1988-89 during the period under study. It is below 3.03 percent during the period under study excepting the year 1983
when it is 5.76 percent which shows that amount of preference share capital in the equity networth is very small during the period
under study. Overall, it has declining trend during the period under study. It is highest, i.e. 5.76 percent, in the year 1983 and
lowest, i.e. .93 percent, in the year 1988-89 over the period under study. On aggregate basis, aggregate preference share capital to
equity networth ratio2 of the company is worked out 1.89 percent during the period under study.
Leverage Ratio
Table 2 reveals that leverage ratio2 is varying from 41.14 percent in the year 1984 to 85.24 percent in the year 1990-91 during the
period under study. For five out of nine under study, it is below 58 percent. It is 57.32 percent in the year 1983 then it declines to
41.14 percent in the year 1984, after that it starts rising and touches the level of 85.24 percent in the year 1990-91. Overall,
leverage ratio2 has rising trend during the period under study. It is highest, i.e. 85.24 percent, in the year 1990-91 due to the losses
suffered by the company. It is lowest, i.e. 41.14 percent, in the year 1984 on account of lower amount of interest bearing debt and
higher profits earned by the company. On aggregate basis, aggregate leverage ratio2 of the company is worked out 58.84 percent
during the period under study.
Cost of Preference Share Capital (Kpat)
Table 3 shows that cost of preference share capital (Kpat) is varying from 8.63 percent in the year 1983 to 14 percent in the year
1991-92 during the period under study. Overall, it has rising trend during the period under study. It remains constant to 8.63
percent from the year 1983 to 1987. Subsequently, it starts rising and touched the level of 14 percent in the year 1991-92. On
aggregate basis, aggregate cost of preference share capital (Kpat) of the company is worked out 9.66 percent during the period
under study.
Volume 4, Number 2, April – June’ 2015
ISSN (Print):2319-9059, (Online):2319-9067
PEZZOTTAITE JOURNALS SJIF (2012): 3.946, SJIF (2013): 5.017, SJIF (2014): 5.912
International Journal of Trade & Global Business Perspectives© Pezzottaite Journals. 1690 |P a g e
Table-1: Preference Share Capital to Equity Networth Ratio of Shree Digvijay Cement Co. Ltd
Year Preference Share Capital to Equity
Networth Ratio1
=
(In Times)
Preference Share Capital to Equity
Networth Ratio2 =
(Percentage)
Dec. 1983 .0611 5.76
Dec. 1984 .0159 1.56
Dec. 1985 .06153 1.60
Dec. 1986 .0183 1.79
Dec. 1987 .0216 2.12
1988-89 .0094 .93
1989-90 .0195 1.91
1990-91 .0312 3.03
1991-92 .0313 1.31
SDCC Ltd. 0.0193
(Aggregate Basis)
1.89
(Aggregate Basis)
Sources: Compiled from the Bombay Stock Exchange Official Directory, Vol. 19(iii), p 82740
Table-2: Leverage Ratio of Shree Digvijay Cement Co. Ltd
Year Leverage Ratio1 =
(In Times)
Leverage Ratio2 =
(Percentage)
Dec. 1983 1.3427 57.32
Dec. 1984 .6989 41.14
Dec. 1985 .8728 46.60
Dec. 1986 1.0495 51.21
Dec. 1987 1.2003 54.55
1988-89 1.9794 66.44
1989-90 3.7453 78.93
1990-91 5.7751 85.24
1991-92 2.1508 68.26
SDCC Ltd. 1.4297
(Aggregate Basis)
58.84
(Aggregate Basis)
Sources: Compiled from the Bombay Stock Exchange Official Directory, Vol. 19(iii), p 82740
Return on Total Networth on After Tax Basis (RONat)
Table 3 reveals that rate of return total networth (RONat) on after tax basis is varying from -66.53% in the year 1989-90 to 53.25
% in the year 1991-92 during the period under study. For five out of nine years under study, the company incurred losses leading
to negative rate of return on total networth (RONat). This happened for the years 1986, 1987, 1988-89, 1989-90 and 1990-91when
it is -4.53%, -12.90%, -27.67%, -66.53% and -43.68% respectively. For eight out of nine years under study, rate of return on total
networth (RONat) has been below 5.18%. Overall, it has declining trend over the period under study excepting for the year 1991-
92 when it is 53.25%. It is highest, i.e. 53.25%, in the year 1991-92 due to the highest rate of return on net total assets (ROIbt1) as
well as net assets (ROIbt2) on before tax basis and highest excess gap of rate of return on net assets (ROIbt2) over cost of debt
(Kdbt) on before tax basis. The company did not incur tax liability in this year. It is lowest, i.e. -66.53%, in the year 1989-90 due
to the losses suffered by the company on account of rise in cost of production, subdued demand of cement, unremunerated market
conditions and underutilization of plant capacity. On aggregate basis, rate of return on total networth (RONat) on after tax basis of
the company is worked out -4.86% during the period under study.
Return on Equity Networth (ROENat)
Table 3 reveals that rate of return on equity networth (ROENat) is varying from -68.10 percent in the year 1989-90 to 53.78
percent in the year 1991-92 during the period under study. During eight out of nine years under study, rate of return on equity
Volume 4, Number 2, April – June’ 2015
ISSN (Print):2319-9059, (Online):2319-9067
PEZZOTTAITE JOURNALS SJIF (2012): 3.946, SJIF (2013): 5.017, SJIF (2014): 5.912
International Journal of Trade & Global Business Perspectives© Pezzottaite Journals. 1691 |P a g e
networth (ROENat) is below 5 percent. For five out of nine years under study, the company incurred losses leading to negative rate
of return on equity networth (ROENat). This happened for the years 1986, 1987, 1988-89, 1989-90 and 1990-91when it is -4.77
percent, -13.36 percent, -28.06 percent, -68.10 percent and -45.48 percent respectively. Overall, it has declining trend over the
period under study excepting for the year 1991-92 when it is 53.78 percent. It is highest, i.e. 53.78 percent, in the year 1991-92
due to the highest rate of return on net total assets (ROIbt1) as well as net assets (ROIbt2) on before tax basis and highest excess gap
of rate of return on total networth (RONat) over cost of preference share capital (Kpat). The company did not incur tax liability in
this year. It is lowest, i.e. -68.10 percent, in the year 1989-90 due to the losses suffered by the company on account of rise in cost
of production, subdued demand of cement, unremunerated market conditions and underutilization of plant capacity. On aggregate
basis, rate of return on equity networth (ROENat) of the company is worked out -5.14 percent during the period under study.
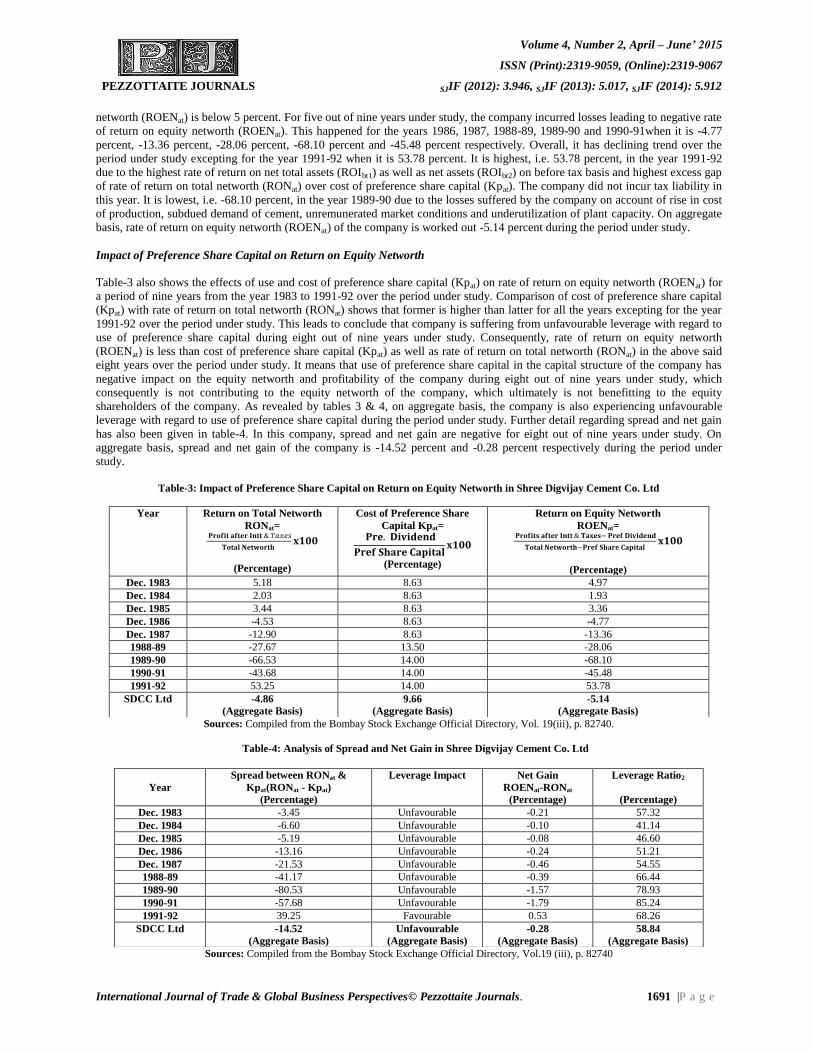
Impact of Preference Share Capital on Return on Equity Networth
Table-3 also shows the effects of use and cost of preference share capital (Kpat) on rate of return on equity networth (ROENat) for
a period of nine years from the year 1983 to 1991-92 over the period under study. Comparison of cost of preference share capital
(Kpat) with rate of return on total networth (RONat) shows that former is higher than latter for all the years excepting for the year
1991-92 over the period under study. This leads to conclude that company is suffering from unfavourable leverage with regard to
use of preference share capital during eight out of nine years under study. Consequently, rate of return on equity networth
(ROENat) is less than cost of preference share capital (Kpat) as well as rate of return on total networth (RONat) in the above said
eight years over the period under study. It means that use of preference share capital in the capital structure of the company has
negative impact on the equity networth and profitability of the company during eight out of nine years under study, which
consequently is not contributing to the equity networth of the company, which ultimately is not benefitting to the equity
shareholders of the company. As revealed by tables 3 & 4, on aggregate basis, the company is also experiencing unfavourable
leverage with regard to use of preference share capital during the period under study. Further detail regarding spread and net gain
has also been given in table-4. In this company, spread and net gain are negative for eight out of nine years under study. On
aggregate basis, spread and net gain of the company is -14.52 percent and -0.28 percent respectively during the period under
study.
Table-3: Impact of Preference Share Capital on Return on Equity Networth in Shree Digvijay Cement Co. Ltd
Sources: Compiled from the Bombay Stock Exchange Official Directory, Vol. 19(iii), p. 82740.
Table-4: Analysis of Spread and Net Gain in Shree Digvijay Cement Co. Ltd
Sources: Compiled from the Bombay Stock Exchange Official Directory, Vol.19 (iii), p. 82740
Year Return on Total Networth
RONat=
(Percentage)
Cost of Preference Share
Capital Kpat=
(Percentage)
Return on Equity Networth
ROENat=
(Percentage)
Dec. 1983 5.18 8.63 4.97
Dec. 1984 2.03 8.63 1.93
Dec. 1985 3.44 8.63 3.36
Dec. 1986 -4.53 8.63 -4.77
Dec. 1987 -12.90 8.63 -13.36
1988-89 -27.67 13.50 -28.06
1989-90 -66.53 14.00 -68.10
1990-91 -43.68 14.00 -45.48
1991-92 53.25 14.00 53.78
SDCC Ltd -4.86
(Aggregate Basis)
9.66
(Aggregate Basis)
-5.14
(Aggregate Basis)
Year
Spread between RONat &
Kpat(RONat - Kpat)
(Percentage)
Leverage Impact
Net Gain
ROENat-RONat
(Percentage)
Leverage Ratio2
(Percentage)
Dec. 1983 -3.45 Unfavourable -0.21 57.32
Dec. 1984 -6.60 Unfavourable -0.10 41.14
Dec. 1985 -5.19 Unfavourable -0.08 46.60
Dec. 1986 -13.16 Unfavourable -0.24 51.21
Dec. 1987 -21.53 Unfavourable -0.46 54.55
1988-89 -41.17 Unfavourable -0.39 66.44
1989-90 -80.53 Unfavourable -1.57 78.93
1990-91 -57.68 Unfavourable -1.79 85.24
1991-92 39.25 Favourable 0.53 68.26
SDCC Ltd -14.52
(Aggregate Basis)
Unfavourable
(Aggregate Basis)
-0.28
(Aggregate Basis)
58.84
(Aggregate Basis)
Volume 4, Number 2, April – June’ 2015
ISSN (Print):2319-9059, (Online):2319-9067
PEZZOTTAITE JOURNALS SJIF (2012): 3.946, SJIF (2013): 5.017, SJIF (2014): 5.912
International Journal of Trade & Global Business Perspectives© Pezzottaite Journals. 1692 |P a g e
SUMMARY AND CONCLUSIONS
The primary aim of the corporate management is to maximize shareholders‘ value and the value of a firm in a legal and ethical
manner. So, a financial manager should consider a number of factors to set an optimal capital structure for a firm giving
considerable weight to earning rate, collateral value of assets, age, cash flow coverage ratio, cost of borrowing, size (net sales),
dividend payout ratio, debt service ratio, cost of borrowing, corporate tax rate, current ratio, growth rate, operating leverage and
uniqueness (selling cost/sales) etc. In the present study, a maiden attempt has been made to make an in-depth analysis of the
financial leverage in India through a case of Shree Digvijay Cement Co. Ltd. from cement industry of the Indian corporate sector
which covers a time period of ten years (effective nine years) extending from the year 1983 to 1991-92 where the company is
lying in top ten companies of cement industry of the Indian corporate sector on the basis of sales for the year 1991-92 for the
purpose of this study. The following are the conclusion and findings of the present study.
It is observed that leverage ratio2 is rising during the period under study, whereas, aggregate leverage ratio2 of the
company is worked out 58.84 percent during the period under study.
It is found that preference share capital to equity networth ratio2 is declining over the period under study. It is below
3.03 percent during the period under study excepting the year 1983 when it is 5.76 percent which shows that amount of
preference share capital in the equity networth is very small during the period under study. However, on aggregate basis,
aggregate preference share capital to equity networth ratio2 of the company is worked out 1.89 percent during the period
under study.
It is observed that cost of preference share capital (Kpat) is varying from 8.63 percent to 14 percent with rising trend
during the period under study. Aggregate cost of preference share capital (Kpat) of the company is worked out 9.66
percent during the period under study.
It is also found that rate of return on total networth (RONat) on after tax basis has declining trend over the period under
study excepting for the year 1991-92 when it is 53.25 percent. For five out of nine years under study, the company
incurred losses leading to negative rate of return on total networth (RONat). This happened for the years 1986, 1987,
1988-89, 1989-90 and 1990-91when it is -4.53 percent, -12.90 percent, -27.67 percent, -66.53 percent and -43.68
percent respectively. On aggregate basis, aggregate rate of return on total networth (RONat) on after tax basis has been
worked out -4.86 percent during the period under study.
It is also found that rate of return on equity networth on after tax basis (ROENat) has declining trend over the period
under study excepting for the year 1991-92 when it is 53.78 percent. For five out of nine years under study, the
company incurred losses leading to negative rate of return on equity networth (ROENat). This happened for the years
1986, 1987, 1988-89, 1989-90 and 1990-91when it is -4.77 percent, -13.36 percent, -28.06 percent, -68.10 percent and -
45.48 percent respectively. On aggregate basis, aggregate rate of return on equity networth on after tax basis (ROENat)
has been worked out -5.14 percent during the period under study.
It is also observed that that company is suffering from unfavourable leverage with regard to use of preference share
capital during eight out of nine years under study. Consequently, rate of return on equity networth (ROENat) is less than
cost of preference share capital (Kpat) as well as rate of return on total networth (RONat) in the above said eight years
over the period under study. However, on aggregate basis, the company is also experiencing unfavourable leverage with
regard to use of preference share capital over the period under study.
It is found that, in this company, spread and net gain are negative for eight out of nine years under study. On aggregate
basis, spread and net gain of the company are -14.52 percent and -.28 percent respectively during the period under
study.
In nutshell, it is concluded that the company is suffering from unfavourable leverage with regard to use of preference share capital
during eight out of nine years under study. Consequently, rate of return on equity networth (ROENat) is less than cost of
preference share capital (Kpat) as well as rate of return on total networth (RONat) in the above said eight years over the period
under study. On aggregate basis, the company is also experiencing unfavourable leverage with regard to use of preference share
capital during the period under study. It means that use of preference share capital in the capital structure of the company has
negative impact on the equity networth and profitability of the company during eight out of nine years under study, whereas, on
aggregate basis, it has also same impact on the equity networth and profitability of the company during the study period which
consequently is not contributing to the equity networth of the company which ultimately is not benefitting to the equity share
holders of the company. It is also found that preference share capital to equity networth ratio2 is declining and below 3.03 percent
during the period under study excepting the year, 1983 when it is 5.76 percent which shows that amount of preference share
capital in the equity networth is very small during the period under study.
Volume 4, Number 2, April – June’ 2015
ISSN (Print):2319-9059, (Online):2319-9067
PEZZOTTAITE JOURNALS SJIF (2012): 3.946, SJIF (2013): 5.017, SJIF (2014): 5.912
International Journal of Trade & Global Business Perspectives© Pezzottaite Journals. 1693 |P a g e
REFERENCES
1. Allen, D. E., & Mizuno, H. (1989, May). The Determinants of Corporate Capital Structure: Japanese Evidence. Applied
Economics, 21(5), 569-585.
2. Anthony, Robert N., & Reece, James S. (1982). Management Accounting Principles. New Delhi: D.S. Taraporewala
and Sons.
3. Chandra, Prasanna. (1984). Financial Management Theory and Practice. New Delhi: Tata McGraw Hill Publishing
Company Limited.
4. Chandra, Prasanna. (1985). Management’s Guide to Finance and Accounting. New Delhi: Tata McGraw Hill
Publishing Company Limited.
5. Guthman, Harry G. Analysis of Financial Statements (4th Edition). New Delhi: Prentice Hall of India.
6. Gangadhar, V., & Begum, Arifa. (October 2002-March 2003). Impact of Leverage on Profitability. Journal of
Accounting & Finance, 17(1), 58-72.
7. Garg, Mahesh Chand, & Shekhar, Chander. (2002, February). Determents of Capital Structure in India. The
Management Accountant, 37(2), 86-92.
8. Khan, M. V., & Jain, P. K. (1983). Financial Management. New Delhi: Tata McGraw Hill.
9. Kraus, Alan, & Litzenberger, Robert H. (1973, September). A State Preference Model of Optimal Financial Leverage.
The Journal of Finance, 28, 911-921.
10. Kulkarni, P. V. Business Finance-Principles & Problems. Bombay: Himalaya Publishing House.
11. Narender, & Sharma. (2006). Determinants of Capital Structure in Public Enterprises. Finance, 12(7), 14-28.
12. Narang, & Kaushal. (2006). Business Ethics. Ludhiana: Kalyani Publishers.
13. Pandey, Indra Mohan. (1978, March). Leverage, Risk and the Choice of Capital Structure. The Management
Accountant, 13(3), 203-208.
14. Pandey, Indra Mohan. (1978, July). Impact of Corporate Debt on the Cost of Equity. The Chartered Accountant, 27(I),
14-20.
15. Pandey, I. M. (2003). Financial Management. New Delhi: Vikas Publishing House.
16. Pandey, I. M. (1985, March). The Financial Leverage in India: A Study. Indian Management, 21-34.
17. Rasoolpur, G. S. (2012, September). An Empirical Analysis of Capital Structure Determinants: Evidence from the
Indian Corporate Sector. International Journal of Management & Information Technology, 1(3), 1-12.
18. Rasoolpur, G. S. (2012, December). Composition of Capital Structure Decisions: Comparative Empirical Evidence from
India. International Journal of Research in Business and Technology, 1(1), 1-12.
19. Rasoolpur, G. S. (2013, May). Leverage Decisions: A Case of Textile & Readymade Garments Industry of the Indian
Corporate Sector. International Journal of Research in Business and Technology, 2(2), 27-32.
20. Rasoolpur, G. S. (2014, August). Impact of Cash Flow Coverage, Debt Service, & Current Ratio on Capital Structure
Decisions: Empirical Evidence from the Indian Corporate Sector. Journal of Research in Marketing, 3(1), 232-238.
21. Titman, S., & Wessells, R. (1988, March). The Determinants of Capital Structure Choice. The Journal of Finance,
XLIII (1), 1-19.
22. Venkatesan, S. (1983, January). Determinants of Financial Leverage an Empirical Extension. The Chartered Account,
32, 519-527.

Volume 4, Number 2, April – June’ 2015
ISSN (Print):2319-9059, (Online):2319-9067
PEZZOTTAITE JOURNALS SJIF (2012): 3.946, SJIF (2013): 5.017, SJIF (2014): 5.912
International Journal of Trade & Global Business Perspectives© Pezzottaite Journals. 1694 |P a g e
23. Vashishth, Neeru, & Rajput, Namita. (2010). Corporate Governance Value & Ethics. New Delhi: Taxmann
Publications (P) Limited.
24. Retrieved from
http://zenithresearch.org.in/images/stories/pdf/2013/JULY/EIJMMS/14%20_EIJMMS_VOL3_ISSUE7_JULY2013.p...
25. Retrieved from http://www.ukessays.com/essays/finance/a-study-of-the-indian-corporate-sector-finance-essay.php
26. Retrieved from http://crackmba.com/cost-of-preference-share-capital/
27. Retrieved from http://crackmba.com/cost-of-preference-share-capital
28. Retrieved from http://msue.anr.msu.edu/news/financial_ratios_part_9_of_21_rate_of_return_on_equity
29. Retrieved from http://shodhganga.inflibnet.ac.in:8080/jspui/bitstream/10603/10460/10/10_chapter%203.pdf
30. Retrieved from http://www.ird.gov.hk/eng/tax/bus_pft.htm
*****