Embed Size (px)
Citation preview

Volume 4, Number 3, July – September’ 2015
ISSN (Print):2279-0977, (Online):2279-0985
PEZZOTTAITE JOURNALS SJIF (2012): 3.23, SJIF (2013): 5.057, SJIF (2014): 5.871
International Journal of Applied Services Marketing Perspectives© Pezzottaite Journals. 1768 |P a g e
A STUDY ON CONSUMER BEHAVIOUR IN THE FOOTWEAR INDUSTRY
Geetha Anand26 U. Alekya27
ABSTRACT
The fashion industry has seen a spurt of growth in the past few years, more so in India. An important part of this fashion boom
is the footwear industry. An industry as varied as any other, the footwear industry in India is one of the most competitive and
vibrant. This paper seeks to analyses the footwear industry in India, and the buying process that goes into a purchase. With
customers becoming increasingly fashion conscious and spendthrift, and the industry becoming more global in its appeal, the
consumers‟ purchase pattern has also seen a shift in terms of various parameters. However, in a diverse Indian market, the
entire consumer base can be segmented to use the Bottom of the Pyramid approach. This paper seeks to analyze spending
patterns and consumer behavior across the pyramid in the Indian market.
KEYWORDS
Bottom of the Pyramid, Consumer Preference, Footwear etc.
INTRODUCTION
Footwear is the product to protect human feet from effects of all biological damages. The necessity of using footwear was
recognized back in the Ice Ages when people realized that they had to keep their feet warm in order to keep themselves healthy.
Footwear has undergone a series of changes passing through a journey of inventions. While initially leather and dried grasses were
used to wrap around the feet for protection, it evolved into more comfortable wear with leather strapping for a better hold. Eventually
it metamorphosed into an accessory and a fashion statement besides providing protection for the feet. Today, footwear is made out a
number of materials like leather, PVC, artificial leather, canvas, wood, plastics and cloth. Called by different names, footwear is
classified as boots, slippers, flip-flops, shoes, sandals, ballerinas, stilettos and many more depending on the style, make and
purpose. A host of demographics, lifestyle, and fashion trends drives the footwear business. Ideally, the market for this industry is
as big as the population itself. It would therefore, not be an exaggeration to say that globally the footwear industry is having an
expanding market, rather it is axiomatic. Even today, there is a large part of the population who go about bare feet especially in
the under-developed countries for the simple reason that they cannot afford them. As the world population increases; so, the living
standards of people rise thus increasing the demand for footwear. India is already riding the wave of a retail boom fuelled by fast
evolving lifestyles and behavioural changes towards shopping. Therefore, the footwear industry will be directly benefitted in
terms of an exponentially expanding market.
RESEARCH PROBLEM
The study on consumer behaviour in the footwear industry enables us to analyze one‟s buying decision. Footwear is a necessity
and is therefore bought by the consumers of every income group whether at the top of the pyramid or at the bottom of the
pyramid. The present project is an attempt to understand the differences in buying patterns of footwear of people belonging to
different income groups; the difference in buying patterns of men and women. Category motivators identified are price, looks,
purpose, brand name, style, variety and durability.
SIGNIFICANCE OF STUDY
The present research will help to portray a detailed picture of consumer preferences towards purchasing footwear. The research
will help in segmenting consumers based on various parameters like gender preferences, spending patterns, type of footwear
purchased, fashion consciousness; understanding the concepts of bottom and top of the pyramid and its reference to the Indian
footwear industry; focus on the new path to purchase footwear viz; online shopping.
OBJECTIVES OF STUDY
To study the present status of the Indian Footwear Industry.
To analyze and compare the consumer behaviour at the Bottom of the pyramid and Top of the pyramid in the Footwear
Industry.
To study the factors influencing the purchase of footwear.
26Lecturer, St. Francis College for Women, Telangana, India, [email protected] 27Consultant, DE Shaw India Software Private Limited, Telangana, India, [email protected]

Volume 4, Number 3, July – September’ 2015
ISSN (Print):2279-0977, (Online):2279-0985
PEZZOTTAITE JOURNALS SJIF (2012): 3.23, SJIF (2013): 5.057, SJIF (2014): 5.871
International Journal of Applied Services Marketing Perspectives© Pezzottaite Journals. 1769 |P a g e
To analyze the consumer behaviour towards shopping footwear online, as well as the shopping behavior of men and
women.
METHODOLOGY OF RESEARCH
Methodology: Primary and secondary data has been collected for an analytical study to understand the buying behaviour of the
consumers.
Sample Design: The total sample size of 110 respondents was drawn from a variety of consumer groups having diverse
demographic backgrounds and societal lifestyles.
Tools and Techniques of Analysis: Statistical tools like frequency distribution, percentages and statistical techniques like Likert
scale analysis, Chi-square test have been used to test the association between the variables.
SCOPE OF STUDY
The area of study was restricted to the twin cities of Hyderabad and Secunderabad. Sample size is 110; hence, the results of the
study may not be 100% accurate.
REVIEW OF LITERATURE
U.S. President Franklin D. Roosevelt in his April 7, 1932 radio address used the phrase “Bottom of the pyramid”. BOP refers to
the billions of people living on less than $2 per day, as first defined in 1998 by Professors C.K. Prahalad and Stuart L. Hart.
Subsequently, they expanded it in “The Fortune at the Bottom of the Pyramid” by Prahalad in 2004[2] and Capitalism at the
Crossroads by Hart in 2005[3].
The Bottom of the Pyramid (BOP) is a socio-economic concept. This is a group of over four billion poorest citizens across the
world that is usually ignored when strategizing and need to be recognized as an integral part of the society with aspirations and
desires to be included in the main stream. Since this is a cross-section of people comprising a very diverse mix in terms of
literacy, location ( rural-urban), culture, religion and more differences, segmentation becomes very complex. Financial inclusion
for them is a myth. This segment offers a vast opportunity for marketers with their demand as consumers of products worth about
$5 trillion in purchasing power parity terms.
Marketing strategy in BOP market segments needs to look at profits by volume rather than through margin. The consumers are
looking for value for money. Marketing at the Bottom of the Pyramid requires a different mindset and thinking along lines, which
address the differences in the background, aspirations, cultural norms and buying behavior of the BOP consumers. Self-esteem
and social recognition play an important role in the lives of the poorest consumers too. They would buy products that would make
them look and feel good.
Figure-1: Income Pyramid
The Basis for the Survey Conducted
At the next rung, there has been a shift in income levels over the past decade or so,
resulting in an emerging middle class having high ambitions, and a strong desire to
improve their standards of living. Their spending patterns are changing and
priorities have changed to include higher expenditure on education, health, energy,
transportation, and personal care. The present status of Indian footwear industry:
This sub-topic deals with the first objective of the study and hence secondary data
forms a major part of reference. Footwear is an ancient, traditional industry in India
and over the years has undergone a sea change. The industry is segmented into
different classes- casual-wear, dress-wear and sportswear. An emerging market for
medical purposes like diabetic footwear is fast becoming popular. The footwear
industry is gaining ground as the foot-care industry. Brands such as Dr. Scholl are
making a foray into the market offering solutions for various foot problems. It has
been observed that many companies used the demographic segmentation of gender
and age to concentrate on different segments like men‟s, women‟s and children‟s-
wear separately.
Footwear industry has been generating considerable employment in the nation especially among weaker sections and minority
sections of society due to population growth, exports, and increasing domestic markets. Traditionally, India had a huge
unorganized and protected footwear industry. With the change in the economic scenario, which gave way to the opening up of the
economy, a large number of international players have found their way into India. This has created a competitive market and is
giving the customers a lot more choice. It has also made the older players rise from their slumber and become less complacent.
Volume 4, Number 3, July – September’ 2015
ISSN (Print):2279-0977, (Online):2279-0985
PEZZOTTAITE JOURNALS SJIF (2012): 3.23, SJIF (2013): 5.057, SJIF (2014): 5.871
International Journal of Applied Services Marketing Perspectives© Pezzottaite Journals. 1770 |P a g e
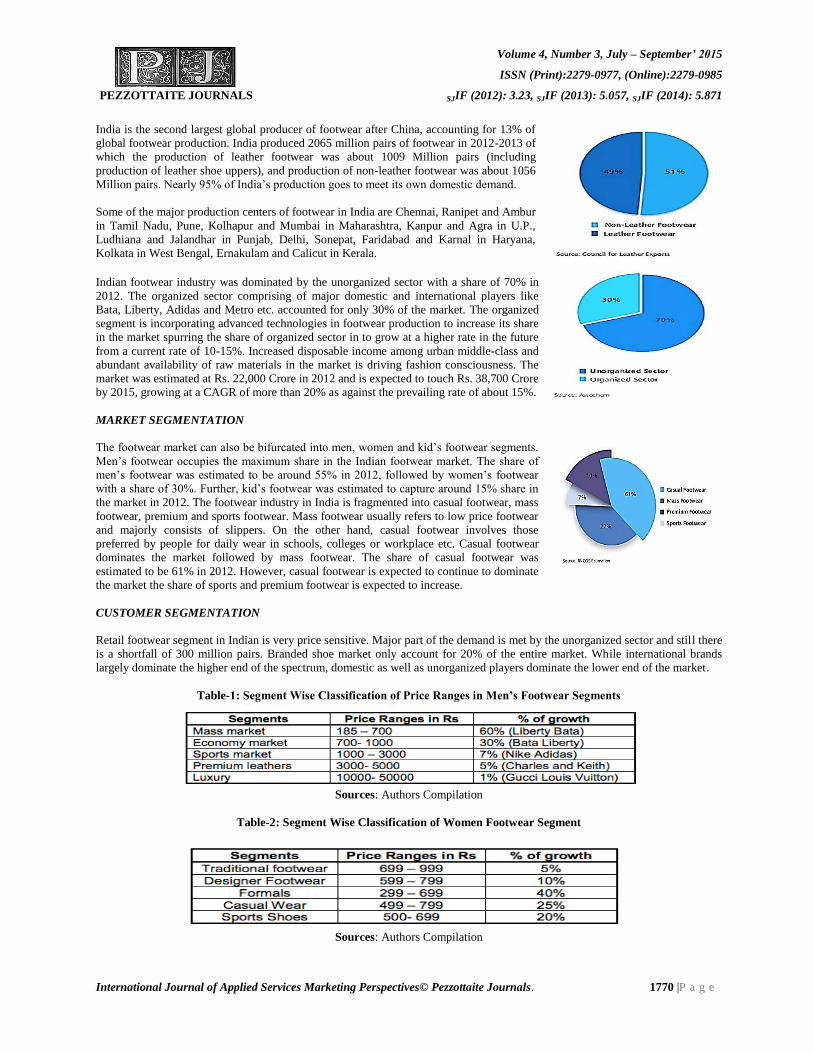
India is the second largest global producer of footwear after China, accounting for 13% of
global footwear production. India produced 2065 million pairs of footwear in 2012-2013 of
which the production of leather footwear was about 1009 Million pairs (including
production of leather shoe uppers), and production of non-leather footwear was about 1056
Million pairs. Nearly 95% of India‟s production goes to meet its own domestic demand.
Some of the major production centers of footwear in India are Chennai, Ranipet and Ambur
in Tamil Nadu, Pune, Kolhapur and Mumbai in Maharashtra, Kanpur and Agra in U.P.,
Ludhiana and Jalandhar in Punjab, Delhi, Sonepat, Faridabad and Karnal in Haryana,
Kolkata in West Bengal, Ernakulam and Calicut in Kerala.
Indian footwear industry was dominated by the unorganized sector with a share of 70% in
2012. The organized sector comprising of major domestic and international players like
Bata, Liberty, Adidas and Metro etc. accounted for only 30% of the market. The organized
segment is incorporating advanced technologies in footwear production to increase its share
in the market spurring the share of organized sector in to grow at a higher rate in the future
from a current rate of 10-15%. Increased disposable income among urban middle-class and
abundant availability of raw materials in the market is driving fashion consciousness. The
market was estimated at Rs. 22,000 Crore in 2012 and is expected to touch Rs. 38,700 Crore
by 2015, growing at a CAGR of more than 20% as against the prevailing rate of about 15%.
MARKET SEGMENTATION
The footwear market can also be bifurcated into men, women and kid‟s footwear segments.
Men‟s footwear occupies the maximum share in the Indian footwear market. The share of
men‟s footwear was estimated to be around 55% in 2012, followed by women‟s footwear
with a share of 30%. Further, kid‟s footwear was estimated to capture around 15% share in
the market in 2012. The footwear industry in India is fragmented into casual footwear, mass
footwear, premium and sports footwear. Mass footwear usually refers to low price footwear
and majorly consists of slippers. On the other hand, casual footwear involves those
preferred by people for daily wear in schools, colleges or workplace etc. Casual footwear
dominates the market followed by mass footwear. The share of casual footwear was
estimated to be 61% in 2012. However, casual footwear is expected to continue to dominate
the market the share of sports and premium footwear is expected to increase.
CUSTOMER SEGMENTATION
Retail footwear segment in Indian is very price sensitive. Major part of the demand is met by the unorganized sector and still there
is a shortfall of 300 million pairs. Branded shoe market only account for 20% of the entire market. While international brands
largely dominate the higher end of the spectrum, domestic as well as unorganized players dominate the lower end of the market.
Table-1: Segment Wise Classification of Price Ranges in Men’s Footwear Segments
Sources: Authors Compilation
Table-2: Segment Wise Classification of Women Footwear Segment
Sources: Authors Compilation

Volume 4, Number 3, July – September’ 2015
ISSN (Print):2279-0977, (Online):2279-0985
PEZZOTTAITE JOURNALS SJIF (2012): 3.23, SJIF (2013): 5.057, SJIF (2014): 5.871
International Journal of Applied Services Marketing Perspectives© Pezzottaite Journals. 1771 |P a g e
DATA ANALYSIS AND INTERPRETATION
The primary data for the study has been collected from a random sample using a questionnaire. The respondents of various age
groups, income levels, occupations were asked for their opinions.
Table-3: Demographic Profile
Category Respondents Percentage Category Respondents Percentage
Gender
Male
Female
50
60
45%
55%
Age
12-25 years
25-45 years
45-60 years
Above 60 years
30
44
28
8
27%
40%
25%
7%
Annual Income
No Income
Below Rs.2,00,000
Rs.2,00,000– Rs. 5,00,000
Rs.5,00,000–Rs 10,00,000
Above Rs 10,00,000
28
35
21
13
13
25%
32%
19%
12%
12%
Occupation
Student
Homemaker
Entrepreneur
Working Professional
Daily wage earners
Others
17
14
15
36
23
5
15%
13%
14%
33%
21%
5%
Sources: Authors Compilation
Table-4: Cross Tabulation between Gender and the Amount
The Respondents Are Ready To Spend On a Pair of Branded Footwear
Gender Upto Rs.2000 Rs.2000 – Rs. 4000 Rs.4000 - Rs.6000 Above Rs.6000 Total
Male 23 37% 13 65% 2 50% 1 50% 39 44%
Female 39 63% 7 35% 2 50% 1 50% 49 56%
Total 62 100% 20 100% 4 100% 2 100% 88 100%
Sources: Authors Compilation
Table-5: Cross Tabulation between Gender and the Amount the
Respondents Are Ready to Spend on a Pair of Unbranded Footwear
Gender Rs100-250 Rs250-500 Rs. 500-1000 Rs.1000-1500 Total
Male 15 (56%) 14 (36%) 14 (45%) 7 (54%) 50 (45%)
Female 12 (44%) 25 (64%) 17 (55%) 6 (46%) 60 (55%)
Total 27 (100%) 39 (100%) 31 (100%) 13 (100%) 110 (100%)
Sources: Authors Compilation
Table-6: Cross Tabulation between Gender of the Respondents
and the Most Important Factor Considered While Purchasing Footwear
Gender Price Quality Comfort Fashion/Trends Total
Male 11 65% 17 57% 19 40% 3 19% 50 45%
Female 6 35% 13 43% 28 60% 13 81% 60 55%
Total 17 100% 30 100% 47 100% 16 100% 110 100%
Sources: Authors Compilation
Table-7: Cross Tabulation between Age of the Respondents and the Medium through
Which They Gain Awareness about Footwear Stores / Brands
Age Word of
Mouth
Online
Promotions
Advertising
(Newspapers, Billboards)
Television
Ads
Total
12-25 years 9 (21%) 2 (50%) 10 (21%) 7 (47%) 28 (26%)
25-45 years 22 (52%) 0 (0%) 20 (43%) 2 (13%) 44 (41%)
45-60 years 11 (26%) 2 (50%) 11 (23%) 4 (27%) 28 (26%)
Above60 years 0 (0%) 0 (0%) 6 (13%) 2 (13%) 8 (7%)
Total 42 (100%) 4 (100%) 47 (100%) 15 (100%) 108 (100%)
Sources: Authors Compilation

Volume 4, Number 3, July – September’ 2015
ISSN (Print):2279-0977, (Online):2279-0985
PEZZOTTAITE JOURNALS SJIF (2012): 3.23, SJIF (2013): 5.057, SJIF (2014): 5.871
International Journal of Applied Services Marketing Perspectives© Pezzottaite Journals. 1772 |P a g e
Table-8: Cross Tabulation between Age of the Respondents and the
One Most Important factor they Consider While Purchasing Footwear
Age Price Quality Comfort Fashion Total
12-25 years 3 4 13 10 30
25-45 years 6 13 20 5 44
45-60 years 6 13 8 1 28
Above 60 years 2 0 6 0 8
Total 17 30 47 16 110
Sources: Authors Compilation
Table-9: Chi Square Test between Age of the Respondents and the one
Most Important Factor They Consider While Purchasing Footwear
Age Price Quality Comfort Fashion Total
12-25 years O.F=3
E.F=4.63
CHI= 0.57
O.F=4
E.F=8.18
CHI= 2.13
O.F=13
E.F=12.81
CHI= 0.00
O.F=10
E.F=4.36
CHI= 7.29
30
25-45 years O.F=6
E.F=6.80
CHI= 0.09
O.F=13
E.F=12
CHI= 0.08
O.F=20
E.F=18.8
CHI= 0.07
O.F=5
E.F=6.4
CHI= 0.3
44
45-60 years O.F=6
E.F=4.32
CHI= 0.65
O.F=13
E.F=7.63
CHI= 3.77
O.F=8
E.F=11.96
CHI= 1.31
O.F=1
E.F=4.07
CHI= 2.31
28
Above 60 years O.F=2
E.F=1.23
CHI= 0.47
O.F=0
E.F=2.18
CHI=2.17
O.F=6
E.F=3.41
CHI= 1.96
O.F=0
E.F=1.16
CHI= 1.15
8
Total 17 30 47 16 110
Sources: Authors Compilation
Interpretation
Null hypothesis: The two variables age of the respondents and the one most important factor they consider while purchasing
footwear are independent of each other.
Alternative Hypothesis: The two variables age of the respondents and the one most important factor they consider while
purchasing footwear are dependent of each other.
Total Chi square value =24.32; Degree‟s of freedom (d.f.) = 9
Pearson‟s table value at p=0.05 is 16.919
Result: The calculated value of chi-square i.e. 24.32 is greater than the Pearson‟s table value i.e. 16.919 at p=0.05. This indicates
that the null hypothesis is rejected and the alternate hypothesis is accepted. Thus, the 2 variables age and the one most important
factor they consider while purchasing footwear are associated with each other.
Decision: From the above interpretation, we can say that as the needs of different age group are varied the retailers must try to
understand and fulfill these different needs to gain new customers and retain the existing ones.
Table-10: Cross Tabulation between the Annual Income of the
Respondents and Number of Pairs of Footwear, They Have
Income Below 5 pairs 5-10 pairs 10-15 pairs Above 15 pairs Total
Below Rs. 2 lakhs 20 7 0 0 27
Rs. 2 lakhs- Rs. 5 lakhs 27 6 0 1 34
Rs.5 lakhs- Rs. 10 lakhs 8 7 4 2 21
Above Rs. 10 lakhs 1 6 3 3 13
Total 51 33 12 12 108
Sources: Authors Compilation
The above cross tabulation states that out of 34 people of the income group Rs. 2 lakhs–Rs. 5 lakhs, 27 of them have footwear
below 5 pairs and 6 people out of 13 respondents belonging to income category Above 10 lakhs have 5-10 pairs of footwear. To
understand better chi-square test is done. The respondents who have more than one pair in the no income category are those who
are dependents and their family income is in the middle or high-income category.
Volume 4, Number 3, July – September’ 2015
ISSN (Print):2279-0977, (Online):2279-0985
PEZZOTTAITE JOURNALS SJIF (2012): 3.23, SJIF (2013): 5.057, SJIF (2014): 5.871
International Journal of Applied Services Marketing Perspectives© Pezzottaite Journals. 1773 |P a g e
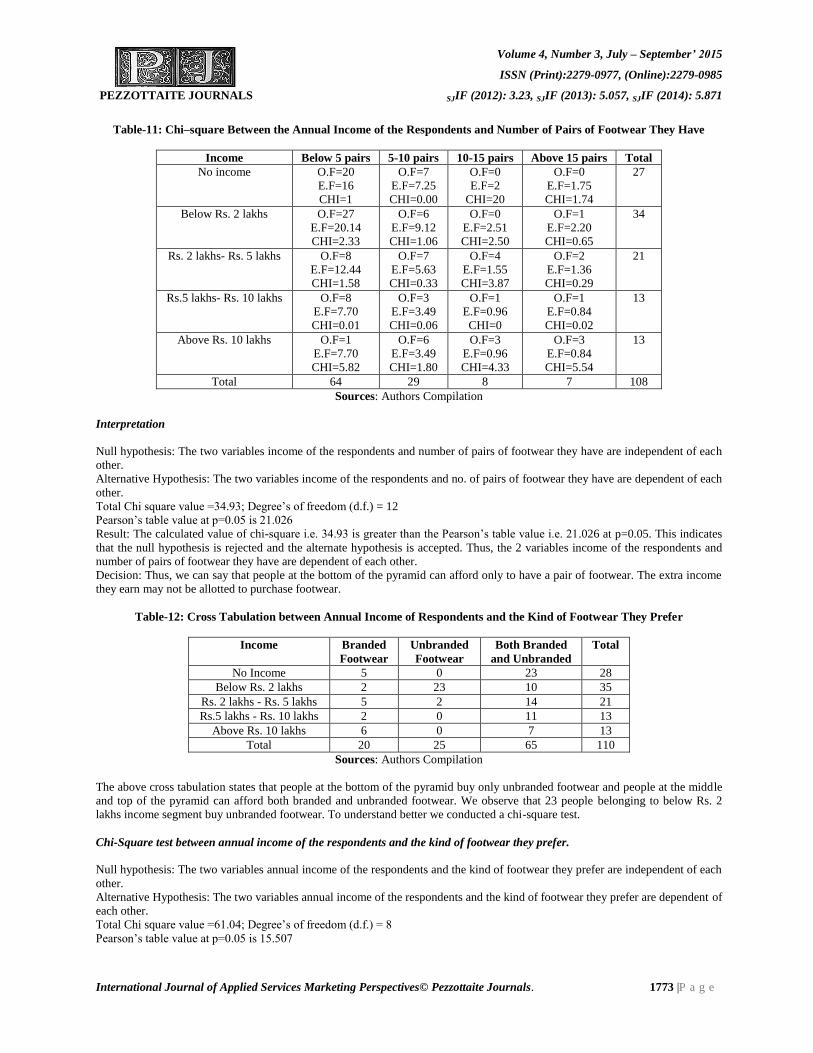
Table-11: Chi–square Between the Annual Income of the Respondents and Number of Pairs of Footwear They Have
Income Below 5 pairs 5-10 pairs 10-15 pairs Above 15 pairs Total
No income O.F=20
E.F=16
CHI=1
O.F=7
E.F=7.25
CHI=0.00
O.F=0
E.F=2
CHI=20
O.F=0
E.F=1.75
CHI=1.74
27
Below Rs. 2 lakhs O.F=27
E.F=20.14
CHI=2.33
O.F=6
E.F=9.12
CHI=1.06
O.F=0
E.F=2.51
CHI=2.50
O.F=1
E.F=2.20
CHI=0.65
34
Rs. 2 lakhs- Rs. 5 lakhs O.F=8
E.F=12.44
CHI=1.58
O.F=7
E.F=5.63
CHI=0.33
O.F=4
E.F=1.55
CHI=3.87
O.F=2
E.F=1.36
CHI=0.29
21
Rs.5 lakhs- Rs. 10 lakhs O.F=8
E.F=7.70
CHI=0.01
O.F=3
E.F=3.49
CHI=0.06
O.F=1
E.F=0.96
CHI=0
O.F=1
E.F=0.84
CHI=0.02
13
Above Rs. 10 lakhs O.F=1
E.F=7.70
CHI=5.82
O.F=6
E.F=3.49
CHI=1.80
O.F=3
E.F=0.96
CHI=4.33
O.F=3
E.F=0.84
CHI=5.54
13
Total 64 29 8 7 108
Sources: Authors Compilation
Interpretation
Null hypothesis: The two variables income of the respondents and number of pairs of footwear they have are independent of each
other.
Alternative Hypothesis: The two variables income of the respondents and no. of pairs of footwear they have are dependent of each
other.
Total Chi square value =34.93; Degree‟s of freedom (d.f.) = 12
Pearson‟s table value at p=0.05 is 21.026
Result: The calculated value of chi-square i.e. 34.93 is greater than the Pearson‟s table value i.e. 21.026 at p=0.05. This indicates
that the null hypothesis is rejected and the alternate hypothesis is accepted. Thus, the 2 variables income of the respondents and
number of pairs of footwear they have are dependent of each other.
Decision: Thus, we can say that people at the bottom of the pyramid can afford only to have a pair of footwear. The extra income
they earn may not be allotted to purchase footwear.
Table-12: Cross Tabulation between Annual Income of Respondents and the Kind of Footwear They Prefer
Income Branded
Footwear
Unbranded
Footwear
Both Branded
and Unbranded
Total
No Income 5 0 23 28
Below Rs. 2 lakhs 2 23 10 35
Rs. 2 lakhs - Rs. 5 lakhs 5 2 14 21
Rs.5 lakhs - Rs. 10 lakhs 2 0 11 13
Above Rs. 10 lakhs 6 0 7 13
Total 20 25 65 110
Sources: Authors Compilation
The above cross tabulation states that people at the bottom of the pyramid buy only unbranded footwear and people at the middle
and top of the pyramid can afford both branded and unbranded footwear. We observe that 23 people belonging to below Rs. 2
lakhs income segment buy unbranded footwear. To understand better we conducted a chi-square test.
Chi-Square test between annual income of the respondents and the kind of footwear they prefer.
Null hypothesis: The two variables annual income of the respondents and the kind of footwear they prefer are independent of each
other.
Alternative Hypothesis: The two variables annual income of the respondents and the kind of footwear they prefer are dependent of
each other.
Total Chi square value =61.04; Degree‟s of freedom (d.f.) = 8
Pearson‟s table value at p=0.05 is 15.507
Volume 4, Number 3, July – September’ 2015
ISSN (Print):2279-0977, (Online):2279-0985
PEZZOTTAITE JOURNALS SJIF (2012): 3.23, SJIF (2013): 5.057, SJIF (2014): 5.871
International Journal of Applied Services Marketing Perspectives© Pezzottaite Journals. 1774 |P a g e
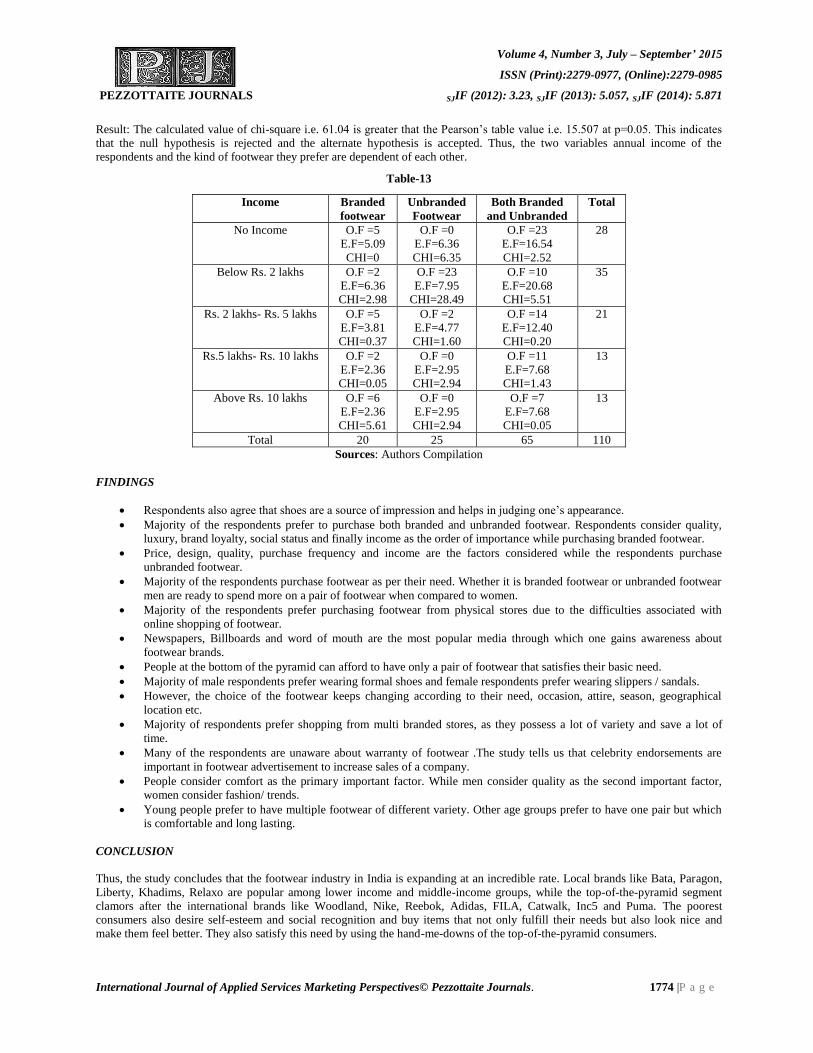
Result: The calculated value of chi-square i.e. 61.04 is greater that the Pearson‟s table value i.e. 15.507 at p=0.05. This indicates
that the null hypothesis is rejected and the alternate hypothesis is accepted. Thus, the two variables annual income of the
respondents and the kind of footwear they prefer are dependent of each other.
Table-13
Income Branded
footwear
Unbranded
Footwear
Both Branded
and Unbranded
Total
No Income O.F =5
E.F=5.09
CHI=0
O.F =0
E.F=6.36
CHI=6.35
O.F =23
E.F=16.54
CHI=2.52
28
Below Rs. 2 lakhs O.F =2
E.F=6.36
CHI=2.98
O.F =23
E.F=7.95
CHI=28.49
O.F =10
E.F=20.68
CHI=5.51
35
Rs. 2 lakhs- Rs. 5 lakhs O.F =5
E.F=3.81
CHI=0.37
O.F =2
E.F=4.77
CHI=1.60
O.F =14
E.F=12.40
CHI=0.20
21
Rs.5 lakhs- Rs. 10 lakhs O.F =2
E.F=2.36
CHI=0.05
O.F =0
E.F=2.95
CHI=2.94
O.F =11
E.F=7.68
CHI=1.43
13
Above Rs. 10 lakhs O.F =6
E.F=2.36
CHI=5.61
O.F =0
E.F=2.95
CHI=2.94
O.F =7
E.F=7.68
CHI=0.05
13
Total 20 25 65 110
Sources: Authors Compilation
FINDINGS
Respondents also agree that shoes are a source of impression and helps in judging one‟s appearance.
Majority of the respondents prefer to purchase both branded and unbranded footwear. Respondents consider quality,
luxury, brand loyalty, social status and finally income as the order of importance while purchasing branded footwear.
Price, design, quality, purchase frequency and income are the factors considered while the respondents purchase
unbranded footwear.
Majority of the respondents purchase footwear as per their need. Whether it is branded footwear or unbranded footwear
men are ready to spend more on a pair of footwear when compared to women.
Majority of the respondents prefer purchasing footwear from physical stores due to the difficulties associated with
online shopping of footwear.
Newspapers, Billboards and word of mouth are the most popular media through which one gains awareness about
footwear brands.
People at the bottom of the pyramid can afford to have only a pair of footwear that satisfies their basic need.
Majority of male respondents prefer wearing formal shoes and female respondents prefer wearing slippers / sandals.
However, the choice of the footwear keeps changing according to their need, occasion, attire, season, geographical
location etc.
Majority of respondents prefer shopping from multi branded stores, as they possess a lot of variety and save a lot of
time.
Many of the respondents are unaware about warranty of footwear .The study tells us that celebrity endorsements are
important in footwear advertisement to increase sales of a company.
People consider comfort as the primary important factor. While men consider quality as the second important factor,
women consider fashion/ trends.
Young people prefer to have multiple footwear of different variety. Other age groups prefer to have one pair but which
is comfortable and long lasting.
CONCLUSION
Thus, the study concludes that the footwear industry in India is expanding at an incredible rate. Local brands like Bata, Paragon,
Liberty, Khadims, Relaxo are popular among lower income and middle-income groups, while the top-of-the-pyramid segment
clamors after the international brands like Woodland, Nike, Reebok, Adidas, FILA, Catwalk, Inc5 and Puma. The poorest
consumers also desire self-esteem and social recognition and buy items that not only fulfill their needs but also look nice and
make them feel better. They also satisfy this need by using the hand-me-downs of the top-of-the-pyramid consumers.

Volume 4, Number 3, July – September’ 2015
ISSN (Print):2279-0977, (Online):2279-0985
PEZZOTTAITE JOURNALS SJIF (2012): 3.23, SJIF (2013): 5.057, SJIF (2014): 5.871
International Journal of Applied Services Marketing Perspectives© Pezzottaite Journals. 1775 |P a g e
REFERENCES
1. Prahalad .(2004). The Fortune at the Bottom of the Pyramid.
2. Hart. (2005). Capitalism at the Crossroads.
3. Kodag, V. B., & Yadav, Jyoti Indupratap. (2013, January). Impact of Brand Preference Dimensions on Women
Satisfaction – A Meta Analysis for Footwear Brands, 2(1).
4. Bloemer, Kasper. The complex relationship between consumers satisfaction and brand preference. Journal of
Psychology, 16.
5. S., Bhaskar. (2010). India’s Footwear Retail Entry: Opportunities, Issues and Challenges.
6. RNCOS. (2013, December). Indian Premium Footwear Market.
7. (2010, November). Google/ Compete, US “The Footwear Path to Purchase and how Shoppers Search” .
8. S., Ramesh Kumar, Yogesh, Gaur, Vikas, Kumar, Saritha, V., & Tejas. (2014). Revival of a Footwear Brand Using
Attitudinal Dimensions.
9. RNCOS E-Services Private Limited, 2008, “Indian Footwear Industry Analysis”. September 01, 2011.
10. Anna, Varghese. (2013, October 12). Industry analysis on shoe industry.
11. Retrieved from http://www.business.mapsofindia.com/top-brands-india/top-shoe-brands-in-india
12. Retrieved from http://www.slideshare.net/shushmul/Indian-footwear-industry-dec13
13. Retrieved from
http://www.researchgate.net/figure/260005090_fig5_Pearson-correlation-between-age-of-the-respondents...
14. Retrieved from http://en.wikipedia.org/wiki/Bottom_of_the_pyramid#History
15. Retrieved from http://en.wikipedia.org/wiki/Bottom_of_the_pyramid#Examples
16. Retrieved from http://en.wikipedia.org/wiki/Bottom_of_the_pyramid
*****