Embed Size (px)
Citation preview
Volume 4, Number 3, July – September’ 2015
ISSN (Print):2279-0896, (Online):2279-090X
PEZZOTTAITE JOURNALS SJIF (2012): 2.844, SJIF (2013): 5.049, SJIF (2014): 5.81
International Journal of Applied Financial Management Perspectives © Pezzottaite Journals. 1917 |P a g e
TECHNICAL ANALYSIS OF SELECTED PHARMACEUTICAL COMPANIES OF INDIA
Nikhil Kaushik27 Dr. Madhur Raj Jain28
ABSTRACT
Technical analysis is the study of forecasting stock prices for future and is aimed to generate returns. Financial analyst
decides the time of entry and exit in the security market. Technical analysis relates to factors affecting the supply and demand
of stocks. It helps us in understanding the true value of shares and in knowing whether the shares are undervalued or
overvalued. Technical analysis market indicators would help the investor to identify major market turning points.
Although the academicians were uncertain about the practicality of technical analysis, this method was widely used by
practitioners in the industry owing to the increasing applicability in forecasting price trends. Many researchers point towards
the importance of technical analysis coupled with fundamental analysis for the industry and the company in predicting price
trends effectively.
The current research study was carried out on the top 6 pharmaceutical companies stock prices (based on market
capitalization) taken on a daily basis for the last five years (April 2010 to March 2015). Moving Average Convergence and
Divergence (MACD), Rate of Change (ROC) and Relative Strength Index (RSI) were some of the technical tools used for
analyzing daily closing price and Sensex (BSE 100). Mix trends were obtained from the study. Results suggest that investing in
the current period for long-term purpose requires fundamental analysis along with technical analysis.
KEYWORDS
Technical Analysis, Pharmaceutical Companies, Moving Average Convergence and Divergence (MACD), Rate of
Change (ROC), Relative Strength Index (RSI) etc.
INTRODUCTION
In the world of stock analysis, fundamental and technical analysis is akin to opposite sides of a coin. These two techniques are
used for researching and forecasting future prices of stocks. Fundamental analysis is valuation of stock through financial and
economic information to predict stock price movements. Financial and economic information include company's financial reports,
and non-financial information such as demand for products manufactured by the company, industry comparisons, economic
condition of the country, changes in government policies, etc. On the other hand, technical analysis is the method of forecasting
future prices of stocks based on past price movements. These decisions are made by applying simple rules to historical price
information. For example, technical trading rule might suggest buying a currency if its exchange rate price increases more than
one percent from its value five days earlier. Such rules are being much used by traders in stock, commodity and foreign exchange
markets. Technical methods came into existence back in 1700 but Dow Theory proposed by Wall Street Journal editors Charles
Dow and William Peter Hamilton popularized them in the late nineteenth and the early twentieth centuries.
Technical analysis was widely used by practitioners but academicians have been uncertain about the practicality of technical
analysis. This behavior could be explained due to firstly, the lack of theoretical basis, secondly, the ruling out of profitability from
technical trading by assumption of random walk model by earlier theoretical studies, and thirdly, the mixed and inconclusive
nature of earlier empirical findings, such as of Cowles (1933) and Fama and Blume (1966). Recently, however, Brock et al (1992)
and Lo et al (2000) found strong evidence of profitability in technical trading based on large amount of data and much elaborate
strategies.
Fundamental analysis was the prominent investment method that was used in the past. Analysts are now using technical analysis
as an investment method by the arrival of high-speed computers has made technical analysis easier. Many large investment firms
use black box trading, or computer modeling, to determine their entry and exit points.
In technical analysis, top seven tools which are in practice are, on-balance volume indicator (OBV), accumulation/distribution line
(A/D line), average directional index (ADX), Aroon Indicator, moving average convergence divergence (MACD), relative
strength index (RSI) and stochastic oscillator. These tools are used to get a vision of supply and demand of securities in the
market.
27Research Scholar, FPM, Indian Institute of Forest Management, Madhya Pradesh, India, [email protected] 28Assistant Professor, Indian Institute of Forest Management, Madhya Pradesh, India, [email protected]
Volume 4, Number 3, July – September’ 2015
ISSN (Print):2279-0896, (Online):2279-090X
PEZZOTTAITE JOURNALS SJIF (2012): 2.844, SJIF (2013): 5.049, SJIF (2014): 5.81
International Journal of Applied Financial Management Perspectives © Pezzottaite Journals. 1918 |P a g e
LITERATURE REVIEW
Technical analysis and fundamental analysis are the two main schools of thought in the financial markets. Technical analysis uses
statistics generated by market activities like stock‟s past prices or volume to predict future price movements. Conversely,
fundamental analysis looks at economic factors to forecast price movements of stocks in future. Suresh A.S. (2015) tried to
emphasize the importance of fundamental and technical analysis in Indian stock market. In fundamental analysis, author stressed
investors to known about macro-economic environment and development of the country, future prospects of the industry to which
the firm belongs and projected performance of the company. As far as technical analysis is concerned, author advised few tools
like line chart, bar chart, point and figure chart, trend chart, moving average analysis, relative strength, resistance and support
levels, break-out theory, head and shoulders pattern, double top and bottom formation to predict future stock prices.
Fundamental analysis was the only investment method that was given any sincerity in the past. Now that has changed as the
arrival of high-speed computing has made technical analysis easier. Many large investment firms use black box trading, or
computer modeling, to determine their entry and exit points. However, it was found that financial managers are not able to use
right tools to analyze future market trends. Shirur S. (2013) stated the reason why finance managers arrive at wrong decisions like
the subprime crisis. The reason explained by author was, investors are dealing with the fundamental analysis issues while the tools
used are applicable for technical analysis. The author also suggested that instead of segregating risk into systematic and
unsystematic risk, it should be segregated into bankruptcy and liquidity risk, to determine the true value of the company, which
helps investors to determine in which security to invest.
Lo A. W., Mamaysky H. and Wang J. (2000) tried to assess the effectiveness of technical analysis by studying U.S. stocks from
1962 to 1996. Authors proposed new approaches to evaluating the efficacy of technical analysis such as nonparametric kernel
regression. They found that technical analysis provide incredible information about the stocks over the time period, but technical
analysis can be improved by using automated algorithms such as head-and-shoulders and rectangles chart patterns.
Several studies are conducted by researchers based on the technical analysis to predict price movements of securities of different
sectors in Indian stock market. Upadhyay, A., Bandyopadhyay, G., Dutta, A. (2012) tried to find out those stocks which are
outperforming in Indian Stock Market with the help of Multinomial Logistic Regression (MLR). The securities were categorize
into three, good, average and poor by using seven financial ratios, book value (BV), PBIDT/Sales (PBIDTS), earnings per share
(EPS), percentage change in operating profit (OP), percentage change in net sales (NS), price to cash earnings per share
(PECEPS), price to book value (PEBV) as selection criteria to determine the performance of securities in stock market. Sample
study was of top 30 companies in terms of market capitalization of four years, which are actively traded at Indian Stock Exchange,
and it was found 17 companies were categorize as good.
In another study, Franklin N. R. B. (2012) talked about buying and selling decisions of stocks of few selected Indian Banks. Study
is based on secondary data for the year 2010 for five banks, Axis Bank, State Bank of India, ICICI Bank, HDFC Bank and Punjab
National Bank. Author used 2 technical analysis tools, moving average, support and resistance level for predicting future prices of
these banks. Author analyzed that all these five banks must perform well in next two coming years in Indian stock market. As
Information Technology was one of the fasting growing sectors in India, Pandya H. (2013) tried to analyze few IT companies with
the support of technical analysis. Data was collected for five leading IT companies: HCL, INFOSYS, MPHASIS, WIPRO and
TCS, which were listed in both BSE and NSE for two financial years, April, 2010 to March, 2012. The major tools and techniques
used in this study are: line chart, column chart, stock (candlestick) chart, exponential moving average (EMA), moving average
convergence divergence (MACD), relative strength index (RSI) and rate of change (ROC). After analyzing the data collected it
was found that these five IT companies have less fluctuations in stock prices as compared to other IT companies so invest in these
companies will be more beneficial.
Chordia T., Sarkar A. and Subrahmanyam A. (2005) tried to determine common factors, which drives liquidity and volatility in
stock and bond market over the period 1991 through 1998 in New York Stock Exchange (NYSE). It was suggested that past
volatility and liquidity were the most important variables in forecasting future liquidity. Other two factors, which explained the
forecasting of both stock and bond market liquidity were unexpected loosening of monetary policy and innovations to bond fund
flows. It was found that Friday is the lowest-liquidity day of the week for both markets and liquidity tends to be higher during the
months from July to September.
RESEARCH METHODOLOGY
This is a descriptive research based study carried out using on secondary data. Top 6 pharmaceutical companies were selected
based on market capitalization namely, Sun Pharmaceutical Inds. Ltd., Lupin Ltd., Dr. Reddy's Laboratories Ltd., Cipla Ltd.,
Aurobindo Pharma Ltd. and Cadila Healthcare Ltd. Daily closing price of stock for a time of 5 years from April 2010 to March
2015 was collected from Prowess 4.15 database of CMIE. Moving Average Convergence and Divergence (MACD), Rate of
Change (ROC) and Relative Strength Index (RSI) were used as technical tools to analyze the collected data.
Volume 4, Number 3, July – September’ 2015
ISSN (Print):2279-0896, (Online):2279-090X
PEZZOTTAITE JOURNALS SJIF (2012): 2.844, SJIF (2013): 5.049, SJIF (2014): 5.81
International Journal of Applied Financial Management Perspectives © Pezzottaite Journals. 1919 |P a g e
MACD is one of the most renowned indicators in technical analysis specifying both trends and momentum behind a security. The
indicator comprises of two exponential moving averages (EMA), covering two different times, which help to measure momentum
in the security. Short-term momentum is compared with long-term momentum to determine future movements of security to get
an idea about the security‟s performance. MACD in the study is 5-day exponential moving averages less 10-day exponential
moving averages. Positive MACD indicates that the 5-day EMA is above the 10-day EMA. Positive values of MACD increase as
the shorter EMA diverges further from the longer EMA.
Calculating MACD
(i) Calculate a 5 day EMA of closing prices
(ii) Calculate a 10 day EMA of closing prices
(iii) Subtract the longer EMA in (ii) from the shorter EMA in (i)
ROC measures percentage price change over a given time period which fluctuates above and below zero. In this study, 5-day
percentage price change is measured over five year time. The bigger the difference between the current price and the price 5 days
ago, the higher the value of the ROC. When percentage price change is positive (bullish), the indicator is above 0, and when
percentage price change is negative (bearish), the indicator is below 0. RSI is used to understand velocity and magnitude of
directional price movements of stocks. The index computes momentum as the ratio of higher closes to lower closes. It further
illustrates that a higher RSI relates to stronger positive changes while a lower RSI to stronger negative changes in stocks. RSI
calculation is based on 5 days period.
Where, RS = relative strength
INTERPRETATION AND ANALYSIS
MACD and Closing Price Analysis
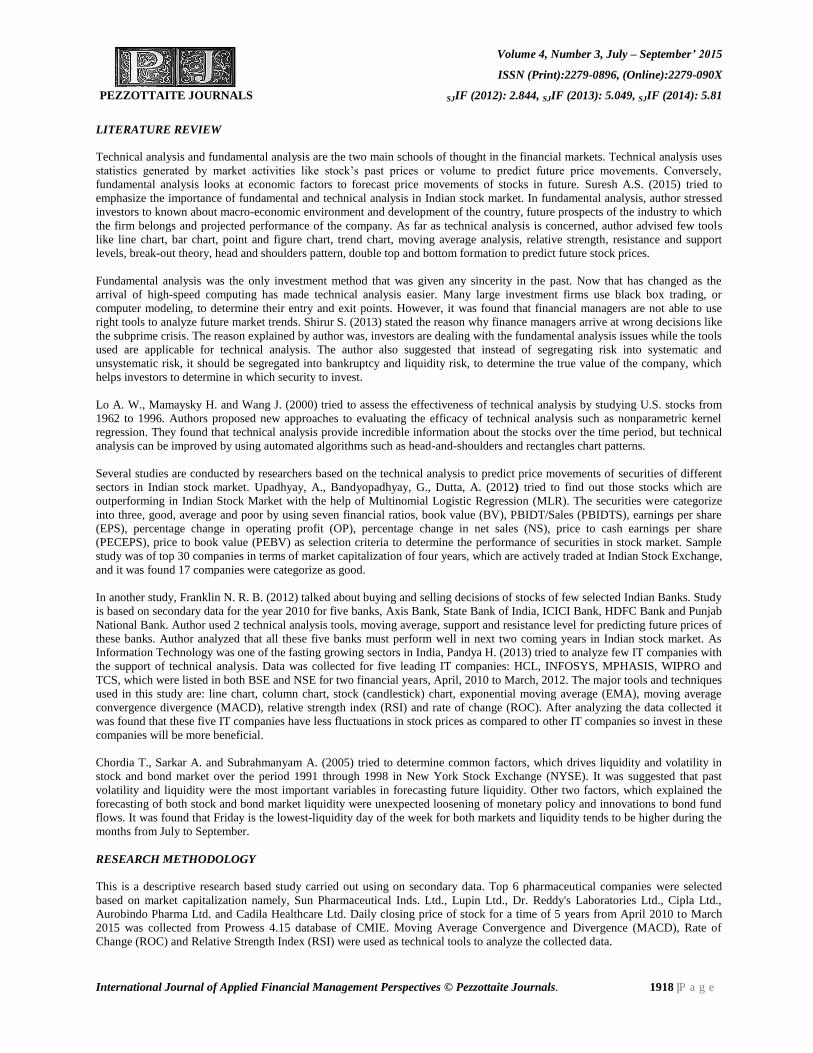
Figure-1: MACD and Closing Price Curves based on Calculations
Sources: Authors Compilation
Initially, MACD line of Cadila Healthcare Ltd. showed upward trend from April 2010 to January 2011 but afterward it showed
bearish trend for next 21 months. Again, from November 2013 to November 2014, it showed upward trend and reached its highest
-60
-40
-20
0
20
40
60
0
500
1000
1500
2000
19-Apr-10 19-Apr-11 19-Apr-12 19-Apr-13 19-Apr-14
MA
CD
Clo
sin
g P
rice
DATES
Closing Price
MACD
Volume 4, Number 3, July – September’ 2015
ISSN (Print):2279-0896, (Online):2279-090X
PEZZOTTAITE JOURNALS SJIF (2012): 2.844, SJIF (2013): 5.049, SJIF (2014): 5.81
International Journal of Applied Financial Management Perspectives © Pezzottaite Journals. 1920 |P a g e
value in November 2014. However, after November 2014, MACD line again showed downward trend and it touched its lowest
point in February 2015. Overall MACD line shows upward trend. In comparison to MACD, Close price showed higher degree of
upward trend and it was not following the MACD completely, although there were some occasions when closing price showed
upward trend but MACD was at downward trend and vice-versa. MACD curve of Sun Pharmaceutical Inds. is quite stable, except
in November 2010 and July 2013 where it showed downward trend. In case of Lupin Ltd. also, it showed downward trend in the
months August 2010 and September 2010, except that it has steady MACD curve. Dr. Reddy's Laboratories Ltd. and Cipla Ltd.
showed fluctuations in MACD curve from August 2014 to February 2015, while Aurobindo Pharma Ltd. displayed downward
trend in January 2011 and February 2011.
ROC and Sensex Analysis
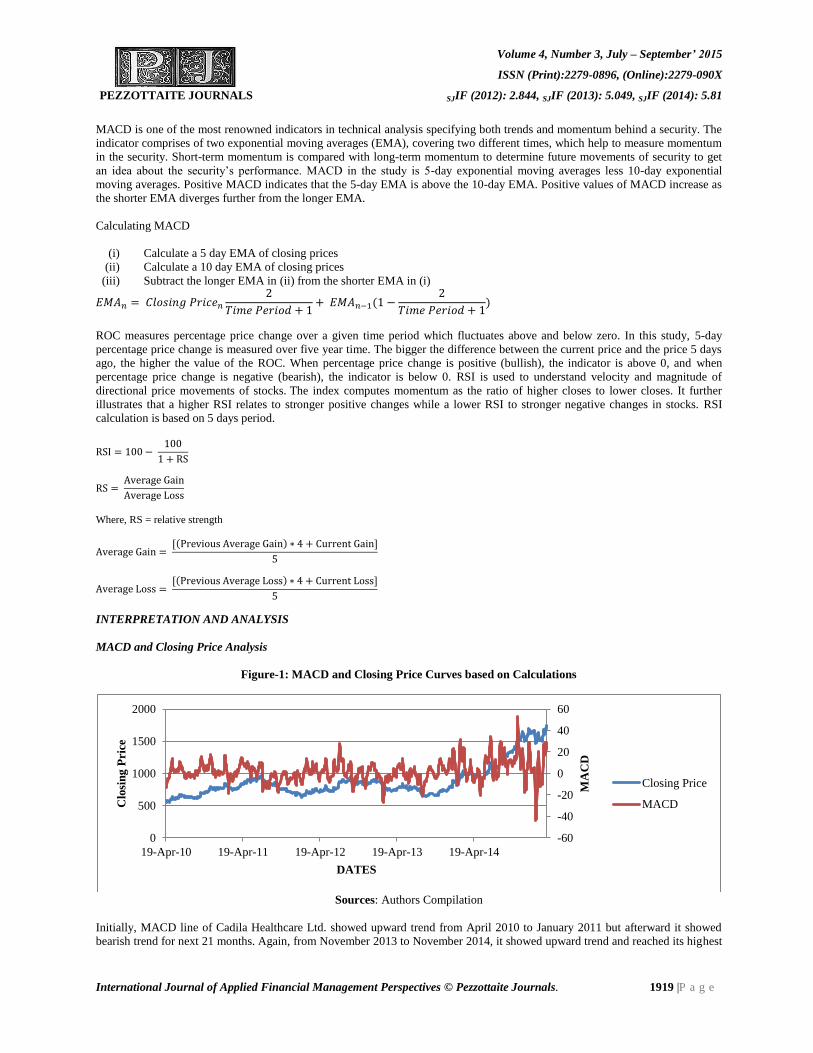
Figure-2: ROC and Sensex Curves Based on Calculations
Sources: Authors Compilation
ROC curve of Cadila Healthcare Ltd. revealed upward trend at the beginning but depicted downward trend after January 2011
remaining in the same state for 22 months. It showed some bearish and bullish trend during this time and reached close to its top
most point in July 2012. Then it started moving up at the end of 2013 and reached its highest point in November 2014 however,
slipped downward in December 2014 and then touched its lowest point in February 2015. Many up down fluctuations were
observed in Sensex, and then it went upward in next years. From the starting Sensex curve was upward to MACD curve and
reached its utmost point in January 2015.
Sun Pharmaceutical Inds Ltd. ROC curve was quite stable throughout 5 years, gaining highest point on September 2013 and
lowest point at August 2011. Lupin Ltd. followed similar pattern as Sun Pharmaceutical Inds. Ltd. but there was a steep fall in
ROC curve in August 2011. Dr. Reddy's Laboratories Ltd. showed upward trend in the year 2010 but it the next year it had
downward trend. After 2011, it showed upward trend in next three years except a sharp fall in ROC curve on May 2014. Cipla
Ltd. had high fluctuations in its ROC curve (unstable) having several unexpected difficulties. Aurobindo Pharma Ltd. trailed
similar pattern as that of Lupin Ltd. but it had a steep decline in February 2010 in ROC curve.
RSI and Sensex Analysis
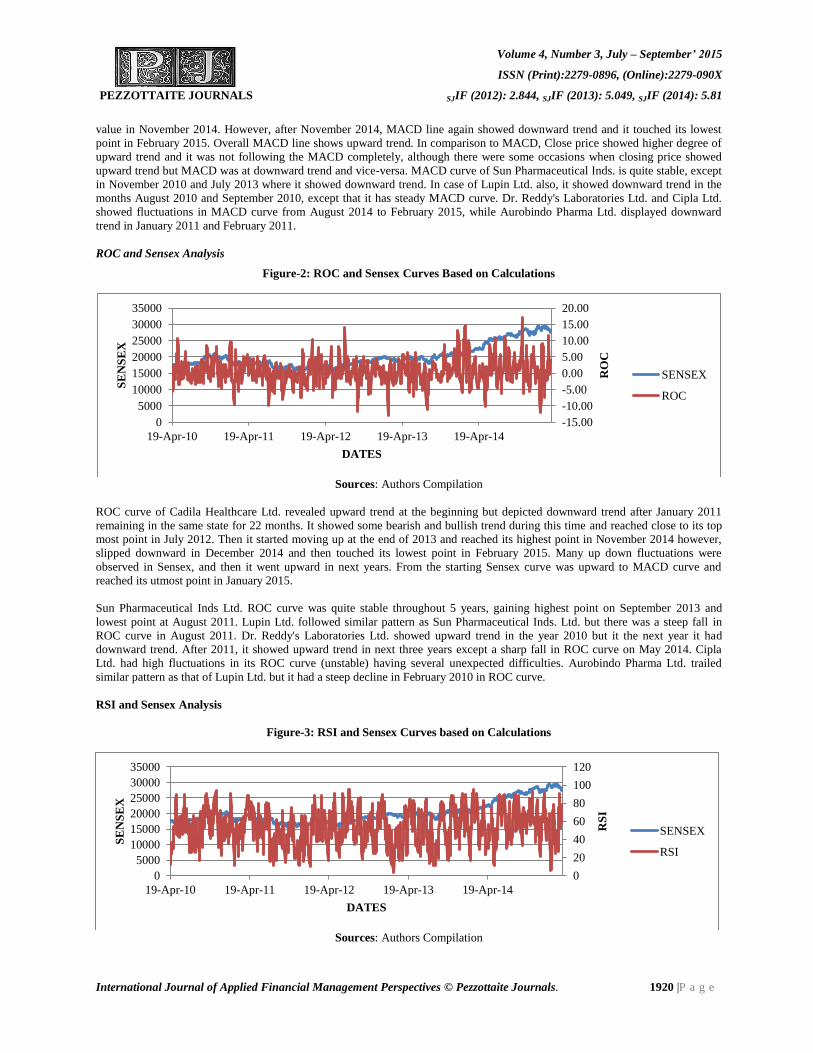
Figure-3: RSI and Sensex Curves based on Calculations
Sources: Authors Compilation
-15.00
-10.00
-5.00
0.00
5.00
10.00
15.00
20.00
0
5000
10000
15000
20000
25000
30000
35000
19-Apr-10 19-Apr-11 19-Apr-12 19-Apr-13 19-Apr-14
RO
C
SE
NS
EX
DATES
SENSEX
ROC
0
20
40
60
80
100
120
0
5000
10000
15000
20000
25000
30000
35000
19-Apr-10 19-Apr-11 19-Apr-12 19-Apr-13 19-Apr-14
RS
I
SE
NS
EX
DATES
SENSEX
RSI
Volume 4, Number 3, July – September’ 2015
ISSN (Print):2279-0896, (Online):2279-090X
PEZZOTTAITE JOURNALS SJIF (2012): 2.844, SJIF (2013): 5.049, SJIF (2014): 5.81
International Journal of Applied Financial Management Perspectives © Pezzottaite Journals. 1921 |P a g e
Initially RSI line of Cadila Healthcare Ltd. showed downward trend from April 2010 to February 2012. After a month, it showed
upward trend for 12 months from March 2012 to February 2013 and it attained its peak in July 2012. It started declining and
moved down to its lowest point in March 2013 and after that, RSI could not gain any upward trend. Sun Pharmaceutical Inds Ltd.
showed downward trend in RSI curve throughout five-year time, similar pattern was followed by Lupin Ltd., and Aurobindo
Pharma Ltd. Dr. Reddy's Laboratories Ltd. showed high fluctuation in RSI curve and reached its highest and lowest point on May
2014 and July 2014 respectively. Cipla Ltd. indicated upward trend in contrast with Sun Pharmaceutical Inds. Ltd., Lupin Ltd. and
Aurobindo Pharma Ltd., which showed downward trend throughout five year.
CONCLUSION
Technical analysis of top 6 pharmaceutical companies reflect mix trends and guide investors about the future trends. MACD and
closing price curves follow each other throughout the 5-year period in all 6 companies. Curve is stable throughout the time except
few down trends. As charts of Relative Strength Index and Sensex are compared, it is found that Sun Pharmaceutical Inds. Ltd.,
Dr. Reddy's Laboratories Ltd., Cipla Ltd. and Cadila Healthcare Ltd. show opposite characteristics. Most of the time, in a period
of 5 years there is an opposite trend and high level of volatility is seen in Relative Strength Index curve, which point towards
downward trend in the market.
ROC of Sun Pharmaceutical Inds. Ltd., Lupin Ltd., Cadila Healthcare Ltd. and Aurobindo Pharma Ltd. display high level of
volatility. Mostly, this curve shows positive intent, which means it, is bullish in nature. ROC curve for other two companies are
found to be stable, this clearly indicate towards less activity on buying and selling front. It can be concluded that technical
analysis indicates downward trend currently, which means companies are moving downward in a low range, indicating towards
correction in the prices. Investing at this point of time for a long-term purpose requires fundamental analysis.
REFERENCES
1. Brock, W., Lakonishok, J., & LeBaron, B. (1992). Simple technical trading rules and the stochastic properties of stock
returns. Journal of Finance, 1731-1764.
2. Chordia, T., Sarkar, A., & Subrahmanyam, A. (2005). An Empirical Analysis of Stock and Bond Market Liquidity. The
Review of Financial Studies, 18(1), 85-129.
3. Cowles, A. (1933). Can stock market forecasters forecast?. Econometrica: Journal of the Econometric Society, 309-324.
4. Fama, E. F., & Blume, M. E. (1966). Filter rules and stock-market trading. Journal of Business, 226-241.
5. Franklin, N. R. B. (2000). Technical Analysis of Selected Indian Banks. Research Journal of Commerce & Behavioral
Science, 1(2), 51-58.
6. Gupta, O. P., & Sehgal, S. (1999). Relationship between Accounting Variables and Systematic Risk: The Indian
Experience. Indian Accounting Review, 3(1).
7. Lee, S., Ryu, J. & Kim, L. (2007). Landslide Susceptibility Analysis and Its Verification Using Likelihood Ratio,
Logistic Regression, and Artificial Neural Network Models: Case Study of Youngin, Korea. Landslides. 4: 327–338.
8. Lo, A. W., Mamaysky, H., & Wang, J. (2000). Foundations of technical analysis: Computational algorithms, statistical
inference, and empirical implementation. The Journal of Finance, 55(4), 1705-1765.
9. Pandya, H. (2013). Technical Analysis for Selected Companies of Indian IT Sector. International Journal of Advanced
Research, 1(4), 430-446.
10. Shirur, S. (2013). Are Managers Measuring the Financial Risk in the Right Manner? An Exploratory
Study. VIKALPA, 38(2), 81-94.
11. Suresh, A. S. (2013). A study on fundamental and technical analysis. International Journal of Marketing, Financial
Services & Management Research, 2(5), 44-59.
12. Upadhyay, A., Bandyopadhyay, G., & Dutta, A. (2012). Forecasting stock performance in Indian market using
multinomial logistic regression. Journal of Business Studies Quarterly, 3(3), 16-39.
13. Retrieved from https://research.stlouisfed.org/wp/2011/2011-001.pdf
Volume 4, Number 3, July – September’ 2015
ISSN (Print):2279-0896, (Online):2279-090X
PEZZOTTAITE JOURNALS SJIF (2012): 2.844, SJIF (2013): 5.049, SJIF (2014): 5.81
International Journal of Applied Financial Management Perspectives © Pezzottaite Journals. 1922 |P a g e
14. Retrieved from http://www.investopedia.com/slide-show/tools-of-the-trade/
15. Retrieved from http://www.ijcst.com/ijmbs/research1/chitra.pdf
16. Retrieved from http://www.ciitresearch.org/dl/index.php/aiml/article/view/AIML012014004
17. Retrieved from http://www.springerprofessional.de/038---belief-fusion-of-predictions-of-industries-in-chinas-stock-...
18. Retrieved from
http://www.managementparadise.com/ROSS%20the%20ERUDITE/documents/23234/study-on-technical-analysis-a...
19. Retrieved from http://www.iexplain.org/calculate-macd/
*****