Embed Size (px)
Citation preview
Marshall UniversityMarshall Digital Scholar
Theses, Dissertations and Capstones
2014
The Effectiveness of Graphic Organizers on theComprehension of Social Studies Content byStudents with DisabilitiesMartha Lynn [email protected]
Follow this and additional works at: http://mds.marshall.edu/etd
Part of the Special Education and Teaching Commons
This Research Paper is brought to you for free and open access by Marshall Digital Scholar. It has been accepted for inclusion in Theses, Dissertationsand Capstones by an authorized administrator of Marshall Digital Scholar. For more information, please contact [email protected].
Recommended CitationMann, Martha Lynn, "The Effectiveness of Graphic Organizers on the Comprehension of Social Studies Content by Students withDisabilities" (2014). Theses, Dissertations and Capstones. Paper 890.
Effectiveness of Graphic Organizers
1
The Effectiveness of Graphic Organizers on the Comprehension of Social Studies Content by
Students with Disabilities
Research Paper
“Submitted to the Special Education Faculty of Marshall University College of Education and
Professional Development in Partial Fulfilment of the Requirements for the Degree
Masters of Arts”
By
Martha Lynn Mann
May 8, 2014
Keywords: graphic organizers, social studies, comprehension, students
with disabilities
Effectiveness of Graphic Organizers
2
Abstract
Today, more students with disabilities are being served in inclusive classrooms and are
required to achieve the high expectations set by the 21st Century standards. Many are not being
successful, due to the difficulty of differentiating between what is important and is not important
in the social studies textbooks. Research suggests that graphic organizers can help facilitate
learning through visual representations, but they are not being utilized to help students in the
comprehension and achievement of the curriculum content. This study focused on the
effectiveness of “concept/event maps and sequence chains.” These two types of graphic
organizers were utilized during class discussions, reading, and homework assignments to aid in
the comprehension of the eighth grade social studies content as determined by the achievement
on posttest measures in four middle school classrooms in rural West Virginia.
Effectiveness of Graphic Organizers
3
Dedication
I dedicate my research study to my husband, Danny. I want to thank him for his patience,
understanding, and support over the past two years. I would like to thank my family and friends,
especially Heather, for listening and offering advice as I journeyed through this process. I
appreciate her support through the countless hours of working together to reach the end. I want
to thank my very special daughter, Maggie, she is my inspiration and the reason I love my job. In
addition, I want to thank the faculty and staff at Marshall University Graduate College for their
dedication to ensure my success in the special education program. Lastly, thanks to the students
and staff at my middle school for allowing me to complete this study.

Effectiveness of Graphic Organizers
4
Table of Contents
Chapter 1: Introduction .................................................................................................................. 6
Statement of the Problem ............................................................................................................ 6
Purpose of the Study ................................................................................................................... 7
Rationale for the Study ............................................................................................................... 8
Research Question ...................................................................................................................... 8
Chapter 2: Review of the Literature............................................................................................... 9
Graphic Organizers in Social Studies ....................................................................................... 11
Graphic Organizers and Students with Disabilities .................................................................. 11
Graphic Organizers – Organizing/Classifying and Sequencing ............................................... 13
Graphic Organizers and Implementation .................................................................................. 15
Effectiveness of Graphic Organizers ........................................................................................ 17
Statement of the Hypothesis ..................................................................................................... 18
Summary of the Literature ........................................................................................................ 19
Chapter 3: Methods ...................................................................................................................... 20
Participants ................................................................................................................................ 20
Procedures ................................................................................................................................. 20
Materials ................................................................................................................................... 21
Effectiveness of Graphic Organizers
5
Data Collection and Analysis.................................................................................................... 21
Chapter 4: Results ........................................................................................................................ 23
Class Data ................................................................................................................................. 23
Chapter 5: Discussion .................................................................................................................. 27
Implications of the Study .......................................................................................................... 27
Informal Observations .............................................................................................................. 28
Limitations to the Study ............................................................................................................ 28
Conclusions ............................................................................................................................... 29
References………………………………………………………………………………………..30
Appendices .................................................................................................................................... 33

Effectiveness of Graphic Organizers
6
Chapter 1: Introduction
According to Myers & Savage (2005) graphic organizers are a research based strategy
that promotes comprehension and aids in student learning with the complex content often
addressed in social studies. Ausubel (1963) suggested that the use of graphic organizers greatly
influences learning by providing students with a meaningful framework to relate existing
knowledge to new information. Utilizing visuals, such as those provided by graphic organizers,
in social studies curriculum facilitates memory and content achievement (Tate, 2003).
With the increased demands in the 21st century and the Common Core Standards, known
in West Virginia as the Next Generation Standards, schools are under pressure to ensure student
learning and achievement. These standards are based on clear, consistent, high expectations,
relevant to real world, provide equality, and reflect the knowledge all students need for success
(National Governors Association Center for Best Practices, Council of Chief State School
Officers, 2010). Schools also must demonstrate that students are effectively progressing based on
assessments, thus meeting the demands of the Next Generation Standards. Giving students
strategies, such as graphic organizers in order to achieve in the classroom, especially in social
studies is vital in comprehending the curriculum.
Statement of the Problem
Today, more students with disabilities are being served in inclusive classrooms and are
required to achieve the high expectations set by the standards (Scruggs, Mastropieri, & Okolo,
2008b). Many are not being successful even though they are capable of achieving at the same
level as typically developing peers (Stein, 2013). Many students also have difficulty
Effectiveness of Graphic Organizers
7
differentiating between what is and is not important in the social studies textbooks (Myers &
Savage, 2005). Scruggs, Mastropieri, & Okolo (2008) also suggested that the social studies
curriculum is a challenge for students with disabilities due to the constraints of cognitive
development and limited background knowledge of the material presented during instruction.
Research shows that utilizing graphic organizers in social studies classrooms does aid in
the comprehension of the content. The amount of information presented in the social studies
curriculum and textbooks can be overwhelming to students. Graphic organizers give them a
means to organize the material, recognize the key concepts, and focus on the important
information (Farris, 2001).
According to Marchand-Martella, Miller, and MacQueen (1998) graphic organizers are a
simple tool utilized by students to help them grasp key information. They also allow the learning
process to be more efficient and effective, especially for students with disabilities (Dexter &
Hughes, 2011). Instructional practices that include the use of graphic organizers, effectively
improve the performance and achievement of students with disabilities in the social studies
classroom (Scruggs et al., 2008b).
Purpose of the Study
The purpose of this research is to study the effectiveness of graphic organizers,
specifically concept/event maps and sequence chains, on the comprehension of the social studies
content by students with and without disabilities. Concept/event maps are used to organize and
represent important information within the text. Sequence chains allow students to list events
from beginning to end in order to understand the content (Walch, 2005).
Effectiveness of Graphic Organizers
8
This study focuses on utilizing concept/event maps and sequence chains, in inclusive
social studies classrooms. One hundred and four students in the eighth grade, with and without
disabilities in a small rural West Virginia middle school will participate in the research with a
timeline of six weeks. A pretest and posttest will be given, designed by the authors of the social
studies curriculum utilized at the school. Teacher made assessments at the end of each chapter
will also be utilized in the data. Information to be included are scores from both pretest and
posttest and teacher made assessments, class sizes, gender, ethnicity, number of students with
and without disabilities.
Rationale for the Study
Graphic organizers facilitate the students understanding of the social studies curriculum
through visual representations (Kim, Vaughn, Wanzek, & Wei, 2004). This study is one step in
a series of studies to demonstrate the effectiveness of graphic organizers on comprehension.
Predicting whether graphic organizers aid in comprehension, specifically the concept/event maps
and sequence chains utilized in this research, will be determined by student achievement on the
posttest measures of the social studies content. However, if students, especially those with
disabilities, are to be successful in the 21st century, they must be given effective strategies and
supports to increase achievement.
Research Question
What effect do graphic organizers, specifically concept/event maps and sequence chains
have on the achievement of the social studies content by students with and without disabilities?
Effectiveness of Graphic Organizers
9
Chapter 2: Review of the Literature
This chapter will provide a review of the literature concerning the use of graphic
organizers in the classroom to aid in the comprehension of the social studies content. The
researched literature is divided into five categories: (A) the use of graphic organizers in the
social studies classroom, (B) how graphic organizers help students with disabilities, (C) graphic
organizers utilized to organize/classify and sequence events, (D) methods of implementing
graphic organizers, and (E) the effectiveness of graphic organizers.
Graphic Organizers in Social Studies
What is social studies? The National Council for the Social Studies (1992) defined
social studies as the integrated study of the social sciences and humanities to promote civic
competence. The primary purpose of social studies is to help young people develop the ability to
make informed and reasoned decisions for the public good as citizens of a culturally diverse,
democratic society in an interdependent world.
According to the recent amendments of the Individuals with Disabilities Education
Improvement Act of 2004 (IDEA 2004) students with disabilities are being included in general
education classrooms such as social studies. Furthermore, the No Child Left Behind Act of 2001
(NCLB 2001) regulations require that all students work on the appropriate grade-level
curriculum. The focus of the social studies curriculum is on skills and strategies that include
problem solving, analysis, synthesis, and evaluation. These high-level thinking skills and the
requirements of inclusion in general education creates a significant challenge for students with
disabilities in the social studies classroom (Steele, 2008).
Effectiveness of Graphic Organizers
10
Social studies is an information rich subject with an estimate of 85 to 95 percent of the
content addressed emerging from the textbook. Therefore, interacting with the text is critical for
students to learn the social studies content (Myers & Savage, 2005). Graphic organizers utilized
in the social studies curriculum help students to focus on the important information within the
text. Massey & Heffner (2004) found in their study that using outlines and graphic organizers in
social studies classrooms allowed students to learn the key concepts within the text through
visual representations.
Learners need to understand the context and the structure of the text in order to
understand the content, yet many students lack the necessary skills to comprehend the complex
relationships among ideas, facts, and concepts often found in social studies. Farris (2001)
suggested that graphic organizers give the students control over the text and assist in
comprehension. Students need to be given the necessary tools to make sense of social studies
texts, graphic organizers can be utilized as a valuable tool in the comprehension of the content
(Guzzetti, 1992).
According to the research, students better connect and comprehend the social studies
content when utilizing graphic organizers. Gallavan and Kottler (2007) suggested that graphic
organizers aid in students’ motivation, short term recall, and long term achievement by allowing
students to summarize, manipulate, and manage the complex social studies curriculum.
In the social studies classroom graphic organizers help students to preview new material,
make connections, recognize patterns, identify main ideas, understand relationships between key
concepts, organize information, take notes, and review material. Graphic organizers also help
foster higher level critical thinking skills by asking students to recall, evaluate, synthesize,
Effectiveness of Graphic Organizers
11
analyze, and apply what they have learned. Research shows that graphic organizers contribute to
better test scores in social studies content because they help students understand the key
relationships and ideas of the curriculum thus enabling them to be more focused as they study
(Walch, 2005).
Graphic organizers provide an essential tool for learning social studies content. They aid
in the comprehension of concepts that guide student achievement. Graphic organizers make
learning a manageable and fun task for all students especially those with disabilities (Gallavan &
Kottler, 2007).
Graphic Organizers and Students with Disabilities
Research suggests that graphic organizers provide multiple benefits for students with
disabilities. They allow access to the content, provide tailored instruction to meet student needs,
and support learning the curriculum in the classroom (Scruggs, Mastropieri, & Okolo, 2008).
Students with disabilities have shown to benefit from the use of graphic organizers due to the
fact that they reduce the cognitive demand on learning and aid in recalling information quickly
and clearly. Graphic organizers also help students with disabilities to organize the content, take
concise notes, retain, and apply what they have learned (Walch, 2005).
Many students with disabilities often have difficulty connecting new material to prior
knowledge, identifying and ignoring extraneous information, identifying main ideas and
supporting details, drawing inferences, and creating efficient problem-solving strategies
(Baumann, 1984; Holmes, 1985; Johnson, Graham, & Harris, 1997; Kim, Vaughn, Wanzek, &
Wei, 2004; Williams, 1993). Because many textbooks are written above grade-level reading
ability and lack organizational clarity (Gajria et al., 2007), these learning difficulties make
Effectiveness of Graphic Organizers
12
interpreting and comprehending texts especially challenging. Students with disabilities need
explicit content enhancements to assist in comprehension. Graphic organizers have often been
recommended as an instructional tool to assist students in understanding complex concepts, such
as in the social studies curriculum (Dexter & Hughes, 2011).
Expository text is more information driven and may contain unfamiliar technical
vocabulary. These texts are often organized poorly and require students to perform complex
cognitive tasks in order to comprehend the material (Lapp, Flood, & Ranck-Buhr, 1995). Many
students with disabilities who already have difficulty with reading and study skills are challenged
by the academic demands of reading and interpreting the text (Bryant, Ugel, Thompson, &
Hamff, 1999; Bryant et al., 2000). Therefore, these students can benefit from learning strategies
that facilitate the comprehension of this type of text. One strategy that has often been
recommended to assist students with disabilities in learning from expository text is the use of
graphic organizers (Bos & Vaughn, 2002; Rivera & Smith, 1997; Taylor, Harris, & Pearson,
1988).
Kim et al. (2004) examined the effects of graphic organizers on reading comprehension
of students with disabilities. The examination revealed overall beneficial outcomes across the
studies. In general, the findings support the use of graphic organizers to promote these students’
reading comprehension. Across the board, when the students were taught to use graphic
organizers, large effect sizes were demonstrated on teacher developed reading comprehension
posttests. Visual displays of information such as those provided by graphic organizers enhance
the reading comprehension of students with disabilities. (Kim et al., 2004).
Effectiveness of Graphic Organizers
13
Graphic organizers have been recommended as tools to help students with disabilities
read for meaning and understand relationships between concepts in all subject areas (Kim,
Vaughn, Wanzek, & Wei, 2004). In addition, the research shows that they are effective in
helping students with disabilities to comprehend and learn from social studies text in particular
(Boon, Fore, Ayres, & Spencer, 2005; DiCecco & Gleason, 2002; Scanlon, Deshler, &
Schumaker, 1997).
Graphic organizers allow teachers to differentiate instruction based on the needs of
students and the content being learned by the students in order to comprehend the complex and
key concepts in social studies curriculum (Hall, Kent, McCulley, Davis, & Wanzek, 2013).
Teachers that utilize graphic organizers in their instructional practices provide a means for
students with disabilities to organize information around the main ideas. This support has shown
many benefits on student learning of the social studies material (Scruggs, Mastropieri, & Okolo,
2008). Many researchers have identified graphic organizers as useful tools to aid students in
their ability to comprehend the content presented in the social studies classroom, especially those
students with disabilities.
Graphic Organizers – Organizing/Classifying and Sequencing
Graphic organizers are an essential strategy to aid in the organizing/classifying and
sequencing of materials and events in the social studies curriculum to help students with
disabilities comprehend the content (Marchand-Martella et al., 1998). This study will focus on
utilizing graphic organizers to aid in comprehension and thus achievement on social studies
assessments. Specifically, students will utilize two types of organizers, concept/event maps and
sequence chains, to help performance in the social studies classroom.
Effectiveness of Graphic Organizers
14
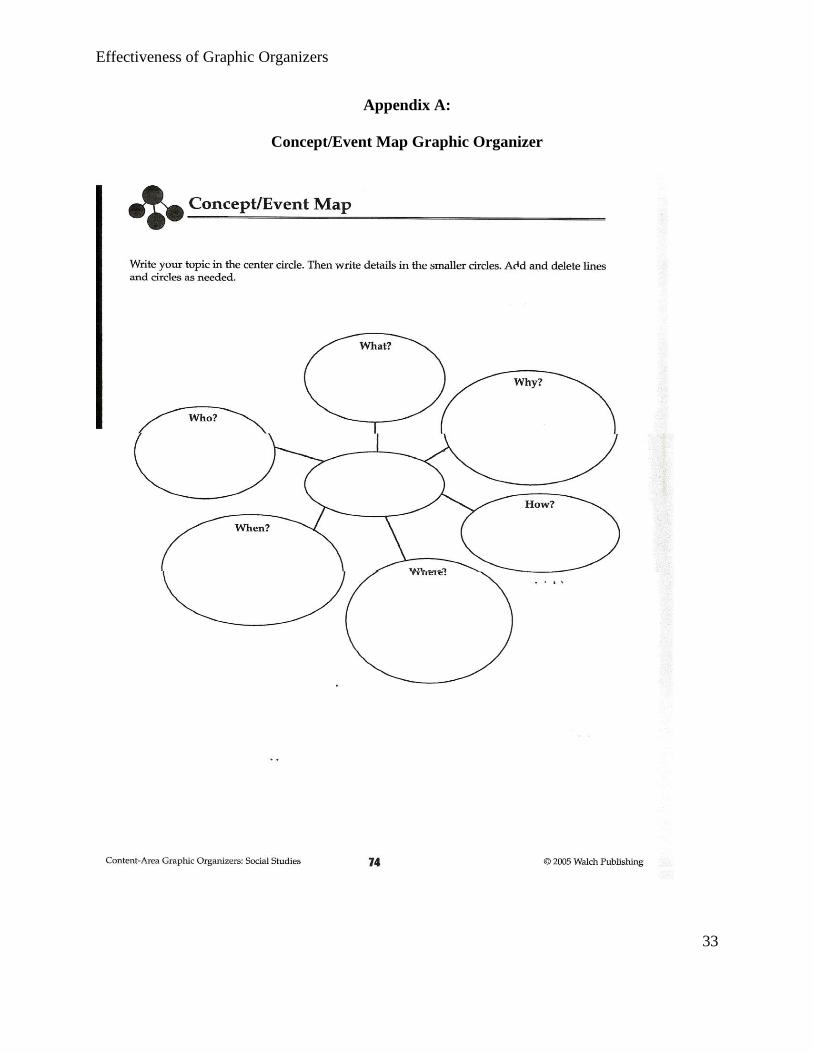
A concept/event map is a graphical tool used to organize and represent information. It
uses the questions who, what, where, when, how, and why to identify key points. The main idea,
concept, or event is written in the middle of the page with lines drawn from the center with the
key questions to be answered as a student reads the social studies content. These maps help
students to sort out key points to better comprehend the material read (Walch, 2005).
Another important characteristic of concept maps is the inclusion of cross-links. These
are relationships or links between concepts in different segments or areas of the concept/event
map. Cross-links show how a concept in one area of knowledge represented on the map is related
to a concept in another area shown on the map. There are two features of concept/event maps
that are important in the facilitation of creative thinking: the hierarchical structure that is
represented in a good map and the ability to search for and characterize new cross-links (Novak
& Canas, 2008).
Concept/event maps serve several purposes for learners. They help students brainstorm
and generate new ideas. They encourage students to discover new concepts and the keys that
connect them. They allow students to more clearly communicate ideas, thoughts, and
information. They help students integrate new concepts with older concepts. They enable
students to gain enhanced knowledge of any topic and evaluate the information (Inspiration.com,
2013).
According to Atkins (2009) numerous studies have found that students with disabilities
benefit from concept mapping. Improvements in verbal and written abilities as well as reading
and comprehension abilities, increased when students with learning disabilities used
concept/event maps. One study in particular he noted was completed by the Office of Special
Effectiveness of Graphic Organizers
15
Education Programs, within the U.S. Department of Education. This study showed a slight but
consistent improvement in comprehension and a moderate improvement in vocabulary when
students used concept/event mapping during their general studies. The research indicates that
concept/event maps do provide a meaningful learning experience by allowing students to clearly
structure and organize information in order to comprehend important information.
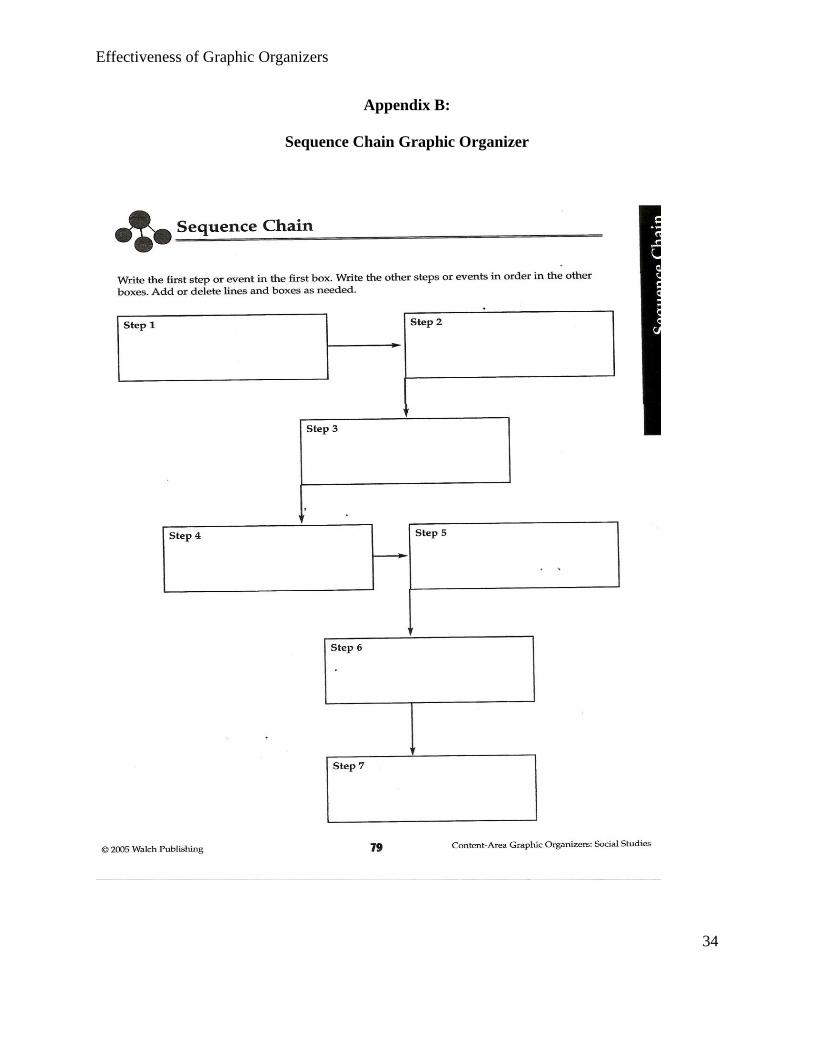
The second graphic organizer for this study is sequence chains. Sequencing or order of
events is a key concept in social studies. Students have to understand what happened first, then
next, and last in order to make sense of the content. Being able to determine how events
happened and in what order aids in the comprehension of why those events occurred (Walch,
2005).
Walch (2005) defined sequence chains as a way to organize and describe a series of
events. They show students stages of development, phases of an era, or the actions taken by an
individual or group. They also represent the outcomes of all the steps in a sequence. Sequence
chains aid in students comprehension of complex social studies content by identifying the steps
in an event or process.
Limited research has been found on the effectiveness of sequence chains in the
comprehension of social studies content. This study may provide some evidence that this specific
graphic organizer is as effective as other types that have been studied.
Graphic Organizers and Implementation
Merkley & Jeffries (2000) suggest that teachers follow a set of guidelines in order to
make the implementation of graphic organizers more successful. This section will review some
suggestions in operating procedures for implementing graphic organizers in the classroom.
Effectiveness of Graphic Organizers
16
According to Merkley and Jefferies (2000) there are five essential steps in implementing
graphic organizers. The first step is to verbalize relationships among concepts expressed by the
visual, in other words, reminding students that the graphic organizer is an overview of the
material that will be read. Secondly, the teacher must provide opportunities for student input and
involvement in class discussions. Third, the teacher should make a connection between current
and past instruction and knowledge. The fourth step is to reference the upcoming reading or
lesson. Finally, help students decode the text and make sense of what was read or learned.
Another idea about the implementation and usage of graphic organizers comes from
McCoy & Ketterlin-Geller (2004). They suggest that teachers should think about the main ideas
and supporting details first. They should also consider how the supporting details fit with the
main idea. This should be the basis of the teacher’s visual representation of the information in
the graphic organizer. The graphic organizer should include space for examples and non-
examples of the main ideas. This design enables students to identify important information, draw
meaning from text, provide concrete examples, and distinguish between details or facts.
Research revealed another strategy in implementing graphic organizers that suggested as
a first step teacher’s explain and model each section of the graphic organizer to students. Then
students are given time to answer questions and complete the graphic organizer. The teacher’s
role is to observe and assist students where needed. Once the assignment is completed, class
discussion and review of the graphic organizer ensures that the students understood the main
concept of the lesson. The final aspect is that the graphic organizer can be utilized for another
activity such as an essay, timeline, or model (Strong, Silver, Perini, & Tuculescu, 2002).
Effectiveness of Graphic Organizers
17
Although the implementation techniques between these studies vary, the goal remains the
same: provide students a means to make connections, think critically about the material, enhance
comprehension, and to become independent learners.
Effectiveness of Graphic Organizers
Graphic organizers are effective tools in learning of the content. Bellanca (2007)
referenced a study done by the Institute for Advancement of Research in Education (IARE)
concerning graphic organizers. The authors of this study found that graphic organizers have a
number of positive benefits for student learning and achievement. Among the findings reported
were increased reading comprehension, improved student achievement over grade levels and
content areas, and a more extended period of information retention. In addition, students showed
an increased ability to organize information, identify relationships, and categorize essential
textbook materials. Furthermore, students with learning disabilities exhibited a higher
achievement level in school (Bellanca, 2007).
Tileston (2004) reported that graphic organizers help students organize their notebooks,
their notes, and the essential information that will be helpful to them as a guide to use in the
future. Note taking using organizers was found to help some students improve their writing.
Fordham, Wellman, & Sandmann (2002) reported that students can more easily summarize a
section of text through writing or prepare for an essay about a certain topic if they used
organizers and with this type of support, students at all levels can approach a writing task more
confidently. Farris (2000) agrees that graphic organizers can help with everyday classroom tasks
like reading, writing, note taking, and group work.
Effectiveness of Graphic Organizers
18
Bellanca (2007) suggested that graphic organizers can help students develop important
cognitive functions because the organizers help students think about specific operations and
outcomes in the material. His research also states that graphic organizers can help strengthen
study habits. Some authors found that graphic organizers were useful for improving cognitive
skills in a variety of ways. Gillet & Temple (1994) found that some organizers help students
think critically about plot and text structures like sequential ordering, cause and effect, literal
and implied information, and comparing and contrasting. Strong, Silver, Perini, & Tuculescu
(2002) found similar results in their studies. They found that after using graphic organizers,
students saw information more clearly in six main categories: sequences, topic descriptions,
cycle structures, problem and solution, and cause/effect relationships.
Walch (2005) described graphic organizers as a powerful tool that not only tells students
the relationships between concepts; it shows them visually the connections. Students can use
graphic organizers before a lesson to lay the foundation for new ideas, to recall what they know,
and to make connections between the two. Graphic organizers can be utilized to take and
organize notes to review and prepare for tests. They also help students to identify main ideas,
important information, compare/contrast, recognize patterns, and comprehend the content. These
uses of graphic organizers make them an effective strategy for students.
Statement of the Hypothesis
Eighth grade students with and without disabilities in a social studies classroom who
utilize graphic organizers, specifically concept/event maps and sequence chains, to aid in the
achievement of content perform better on assessments than eighth grade students who do not
utilize graphic organizers.
Effectiveness of Graphic Organizers
19
Summary of the Literature
By reviewing the literature of graphic organizers in five areas (the use of graphic
organizers in the social studies classroom, how graphic organizers help students with disabilities,
graphic organizers utilized to organize/classify and sequence events, methods of implementing
graphic organizers, and the effectiveness of graphic organizers) the studies suggest that by
utilizing graphic organizers in the classroom, students are more equipped to comprehend and
apply what they have learned, contributing to better scores on assessments. Despite the amount
of research on graphic organizers and their effectiveness, Marzano (2001) reports that the
graphic organizer is the most underused of high effective strategies in the classroom. This
valuable tool should be used on a more frequent basis to allow students to retain and apply what
they have learned to ensure success.
Effectiveness of Graphic Organizers
20
Chapter 3: Methods
This research study analyzed the effectiveness of graphic organizers in classrooms on
the achievement of the social studies content. It was completed at a small, rural middle school
in southern West Virginia. The school had approximately 400 students in fifth through eighth
grades. One of the primary goals within this school was that all students were progressing and
meeting the demands of the 21st Century. In order for students to succeed, they must be given
strategies or tools that allow them to comprehend the curriculum. Graphic organizers could be
one possible solution to meeting this need. Therefore, my research hypothesis for this study
became: Did eighth grade students with and without disabilities in a social studies classroom
who utilized graphic organizers, specifically concept/event maps and sequence chains, to aid in
the achievement of content perform better on assessments than eighth grade students who did not
utilize graphic organizers?
Participants
The study was conducted with 92 students in eighth grade West Virginia Social Studies
classes. Students ranged from 13 to 15 years of age. Approximately 48 students were males and
44 were females. 83 students were white, 6 were black, and 3 were considered other. In addition,
13 students had been identified with Individual Education Plans (IEPs). All students had been
placed into the appropriate grade level social studies program, which was designed to prepare
students for college and/or the 21st Century workforce. Both the general education teacher and
the special education teacher facilitated the study. Students post- test scores were analyzed to
determine if using graphic organizers was more effective than using traditional/typical strategies
in the classroom.
Procedures
The research study lasted for approximately six weeks. It was noted during this time,
school was interrupted on several days due to weather related snow days or scheduled breaks.
Effectiveness of Graphic Organizers
21
Over the course of this period, the students covered approximately three chapters/units in
the textbook. This time frame allowed the teacher(s) to discover if the use of graphic
organizers improved the students’ performance and achievement of the social studies content.
Student grades on pre and post-test assessments were analyzed for improvement (see below –
Data Collection and Analysis). The six week period also gave the students enough time to
effectively utilize graphic organizers in the classroom. During the first week of the study, the
students were given a pre-test on the chapters/units to be covered. Then, the students were
provided with the concept/event maps and sequence chains that they utilized during the study.
The teacher(s) explained each method and modeled an example for the students to observe and
follow. Students used these graphic organizers during class discussions, reading assignments,
and homework assignments. A post-test was given on the information covered to determine the
effectiveness of graphic organizers on the comprehension of the social studies content.
Materials
Students in the eighth grade social studies classes utilized the same materials for the
foundation of the study. The textbook the students used throughout the study was: West Virginia
150 Years of Statehood – author Vicki Wood, published by Clairmont Press, Inc. (2013). They
were also exposed to identical reading assignments, workbook activities, review activities, and
tests during the study. Two types of graphic organizers, concept/event maps and sequence chains
(adapted from Content- Area Graphic Organizers Social Studies 2005) were utilized by the
students for reading assignments and class discussions (see Appendix A and B).
Data Collection and Analysis
Data was collected and compared from the pre and post-test assessments to chart student
improvement. This assessment data collected over the six weeks came from three chapters from
the West Virginia 150 Years of Statehood textbook. These summative assessments were used at
the start with a pre-test and at the end with a post-test with questions from each chapter/unit (see
Appendix C and D). The assessments were analyzed and assisted in determining the
Effectiveness of Graphic Organizers
22
effectiveness of graphic organizers on student achievement of the social studies content.
Overall, this study focused on what effect do graphic organizers, specifically
concept/event maps and sequence chains have on the achievement of the social studies content
by students with and without disabilities?
Effectiveness of Graphic Organizers
23
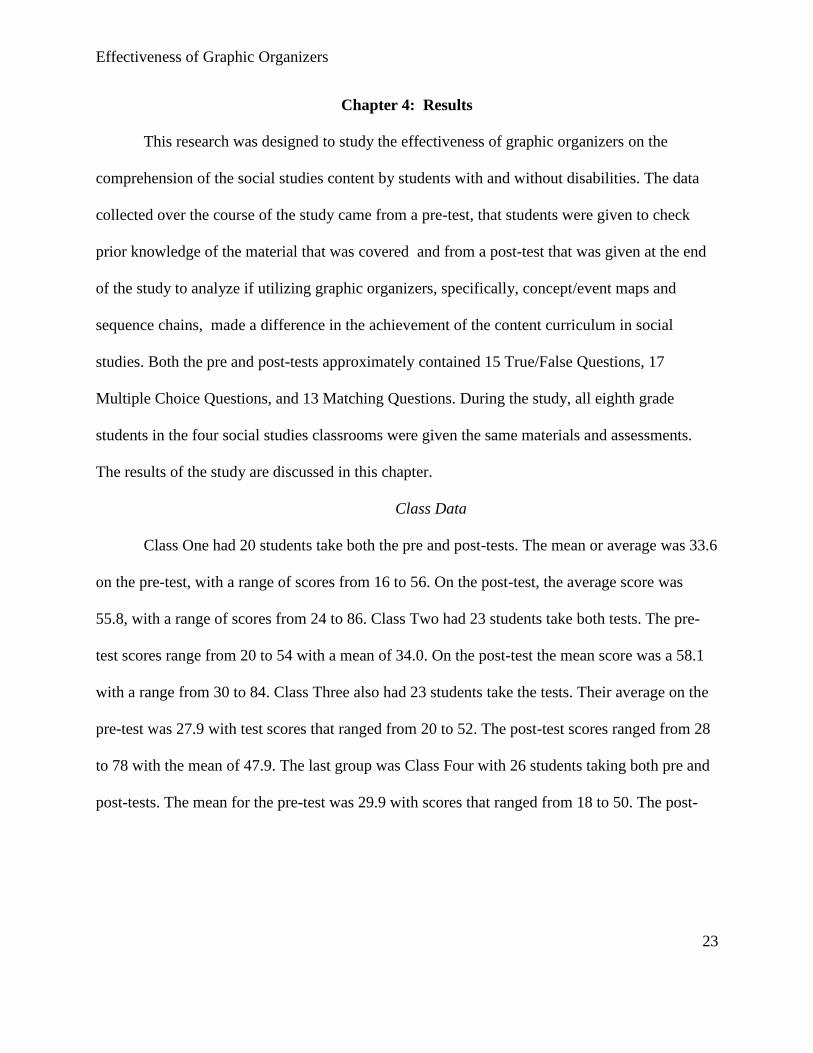
Chapter 4: Results
This research was designed to study the effectiveness of graphic organizers on the
comprehension of the social studies content by students with and without disabilities. The data
collected over the course of the study came from a pre-test, that students were given to check
prior knowledge of the material that was covered and from a post-test that was given at the end
of the study to analyze if utilizing graphic organizers, specifically, concept/event maps and
sequence chains, made a difference in the achievement of the content curriculum in social
studies. Both the pre and post-tests approximately contained 15 True/False Questions, 17
Multiple Choice Questions, and 13 Matching Questions. During the study, all eighth grade
students in the four social studies classrooms were given the same materials and assessments.
The results of the study are discussed in this chapter.
Class Data
Class One had 20 students take both the pre and post-tests. The mean or average was 33.6
on the pre-test, with a range of scores from 16 to 56. On the post-test, the average score was
55.8, with a range of scores from 24 to 86. Class Two had 23 students take both tests. The pre-
test scores range from 20 to 54 with a mean of 34.0. On the post-test the mean score was a 58.1
with a range from 30 to 84. Class Three also had 23 students take the tests. Their average on the
pre-test was 27.9 with test scores that ranged from 20 to 52. The post-test scores ranged from 28
to 78 with the mean of 47.9. The last group was Class Four with 26 students taking both pre and
post-tests. The mean for the pre-test was 29.9 with scores that ranged from 18 to 50. The post-
Effectiveness of Graphic Organizers
24
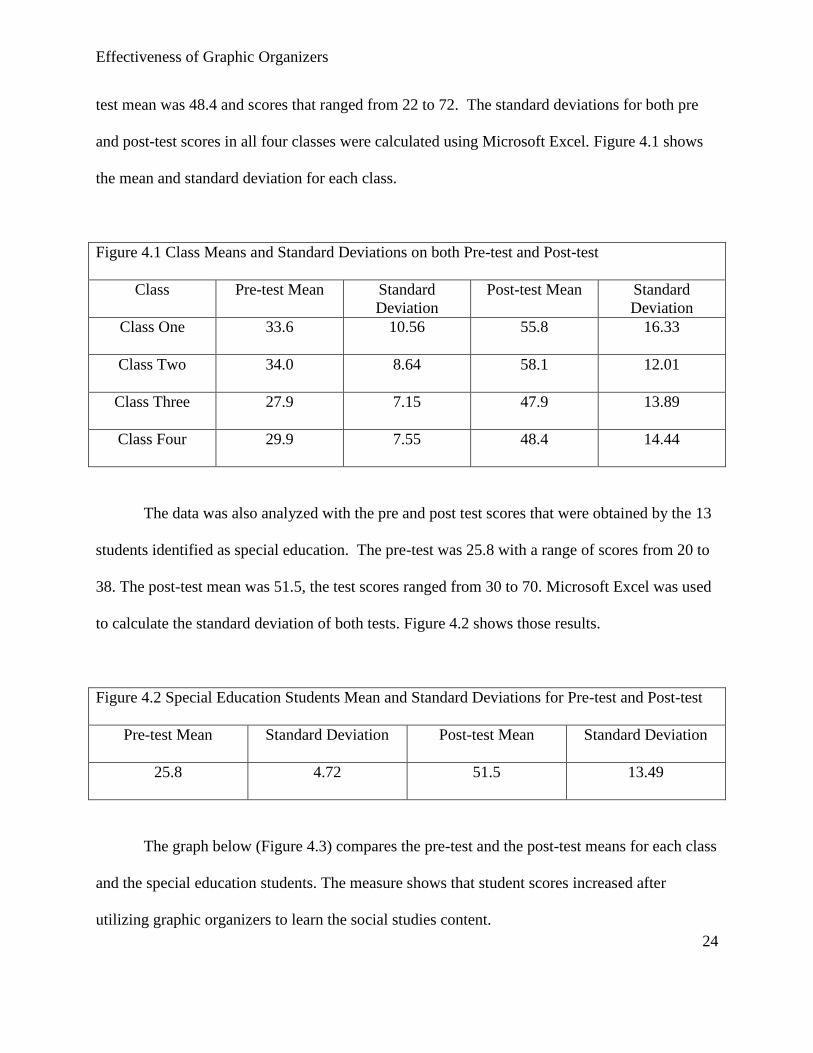
test mean was 48.4 and scores that ranged from 22 to 72. The standard deviations for both pre
and post-test scores in all four classes were calculated using Microsoft Excel. Figure 4.1 shows
the mean and standard deviation for each class.
Figure 4.1 Class Means and Standard Deviations on both Pre-test and Post-test
Class Pre-test Mean Standard
Deviation
Post-test Mean Standard
Deviation
Class One 33.6 10.56 55.8 16.33
Class Two 34.0 8.64 58.1 12.01
Class Three 27.9 7.15 47.9 13.89
Class Four 29.9 7.55 48.4 14.44
The data was also analyzed with the pre and post test scores that were obtained by the 13
students identified as special education. The pre-test was 25.8 with a range of scores from 20 to
38. The post-test mean was 51.5, the test scores ranged from 30 to 70. Microsoft Excel was used
to calculate the standard deviation of both tests. Figure 4.2 shows those results.
Figure 4.2 Special Education Students Mean and Standard Deviations for Pre-test and Post-test
Pre-test Mean Standard Deviation Post-test Mean Standard Deviation
25.8 4.72 51.5 13.49
The graph below (Figure 4.3) compares the pre-test and the post-test means for each class
and the special education students. The measure shows that student scores increased after
utilizing graphic organizers to learn the social studies content.

Effectiveness of Graphic Organizers
25
Figure 4.3 Class Means
Another way the data was analyzed was by a t-test. T-test is used to determine if the
difference between two means are statistically significant. In this study, t-test was used to
compare the means of the pre-tests that all four classes took before the study with the means of
the post-tests they took after the study. The special education group means of both tests were
also compared.
Results from the t-test are measured by a p value. The results showed that the two-tailed
P value equals 0.0004. By conventional criteria, this difference is considered to be extremely
statistically significant. The confidence interval was described as the mean of Group One minus
Group Two equals -21.200 with a 95% confidence interval of this difference from -25.113 to -
17.287. The intermediate values used in calculations were t = 17.2428, df = 3, standard error of
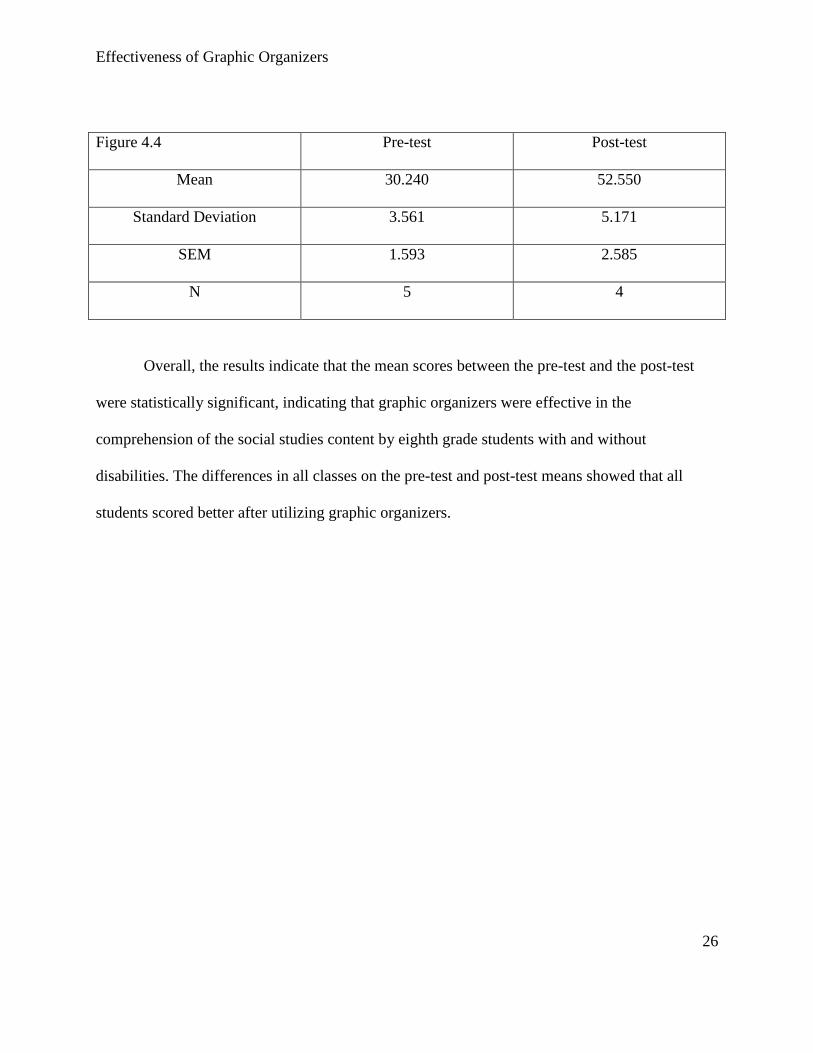
difference = 1.229. Figure 4.4 shows the results from the t-test software.
0
10
20
30
40
50
60
70
Class 1 Class 2 Class 3 Class 4 Special
Education
S
c
o
r
e
s
Class Means
Pre-Test
Mean
Post-test
Mean
Effectiveness of Graphic Organizers
26
Figure 4.4 Pre-test Post-test
Mean 30.240 52.550
Standard Deviation 3.561 5.171
SEM 1.593 2.585
N 5 4
Overall, the results indicate that the mean scores between the pre-test and the post-test
were statistically significant, indicating that graphic organizers were effective in the
comprehension of the social studies content by eighth grade students with and without
disabilities. The differences in all classes on the pre-test and post-test means showed that all
students scored better after utilizing graphic organizers.
Effectiveness of Graphic Organizers
27
Chapter 5: Discussion
The purpose of this study was to determine if graphic organizers were an effective tool to
help students with and without disabilities comprehend the social studies content curriculum.
The review of the literature indicated that graphic organizers are effective tools that have not
been utilized to aid students in comprehending complex material. During the study period,
students were given two types of graphic organizers, concept/event maps and sequence chains, to
aid in the organization and learning of the chapters covered.
Implications of the Study
The effectiveness of graphic organizers was determined by student performance on the
assessments given before and after the study. The data collected came from pre-test and post-test
means of four social studies classes of eighth grade students that ranged in age from 13 to 15
years. Data was also observed on the assessments of the 13 students identified as special
education. The students utilized the two types of graphic organizers during in class readings,
discussions, and homework assignments.
Overall, student scores from all four classes showed an increase on the post-test
assessment. The special education students also showed an increase on the post-test assessment.
The mean was calculated for each class on both the pre-test and post-test. A graph indicated that
the post-test mean was higher than the pre-test mean. The same was true for the special
education students’ mean scores. A t-test was performed to compare the mean data of both
assessments. The results indicated that there was a statistical significance between the pre and
post-test means.
Effectiveness of Graphic Organizers
28
Informal Observations
It is noted that over the course of the study that was planned for approximately six weeks,
there were 16 instructional days lost due to weather and the scheduled spring break. Despite this
factor, graphic organizers appeared to be an effective strategy for students in the comprehension
of the social studies content.
Student responses and attitudes towards graphic organizers were observed. In general, the
reaction towards utilizing graphic organizers had a positive effect. Students were engaged during
the in class readings and discussions. Students that never or rarely volunteered to answer
questions started participating by offering answers. It was observed that students were on task
and completed the graphic organizers. Some students indicated that they used the graphic
organizers as study guides to help prepare for the in- class quizzes and the post-test given at the
end of the study.
Limitations to the Study
Even though the results of the study indicate that graphic organizers are an effective tool
on the comprehension of the social studies content, there are limitations. The most notable
limitation would be that the study was completed in one small middle school in rural West
Virginia. Another limitation was the fact of the loss of instructional days, so students were not
exposed to the instructional strategy on a continuous basis. Also due to the loss of instructional
days, the students’ ability to utilize and retain the information gathered on the graphic organizers
could have been effected. A limitation to this research could be that the students were only given
two types of graphic organizers to use during the study, concept/event maps and sequence
chains. Finally, the last limitation could have been in the selection of the pre-test and post-test
Effectiveness of Graphic Organizers
29
questions, even though they were selected from the test bank, some may have been more difficult
than others.
Conclusions
Results from this study indicate that graphic organizers, specifically, concept/event maps
and sequence chains are a vital tool that aid in the comprehension of the complex material
presented in the social studies curriculum. They are in fact an important strategy that can be
utilized by students with and without disabilities to learn the social studies content.
Effectiveness of Graphic Organizers
30
References
Ausubel, D. P. (1963). The psychology of meaningful verbal learning. New York: Grune &
Stratton.
Atkins, W. (2009). Concept maps. Retrieved from http://www.education.com
Barbieri, K. E. (2011). Hear My Voice! Teaching Difficult Subjects with Graphic Organizers.
Social Education, 75(6-), 301-309.
Cleveland, M. (2005). Content area graphic organizers social studies. Portland, Maine: Walch
Publishing.
Dexter, D. D., & Hughes, C. A. (2011). Graphic organizers and students with learning
disabilities: a meta-analysis. Learning Disability Quarterly, 34(1), 51-72.
Farris, P. J. (2001). Elementary and middle school social studies: an interdisciplinary
Instructional approach. New York, NY: McGraw-Hill Higher Education.
Gallavan, N. P., & Kottler, E. (2007). Eight Types of Graphic Organizers for Empowering Social
Studies Students and Teachers. Social Studies, 98(3), 117-128.
Gay, L. R., Mills, G. E., & Airasian, P. (2012). Educational research competencis for analysis
and applications. Boston: Pearson Education, Inc.. (Original work published )
Hall, C., Kent, S. C., McCulley, L., Davis, A., & Wanzek, J. (2013). A New Look at Mnemonics
and Graphic Organizers in the Secondary Social Studies Classroom. Teaching
Exceptional Children, 46(1), 47-55.
Kaya, E. (2012). Teachers' Opinions on the Use of Social Studies Classrooms in Social Studies
Education. Educational Sciences: Theory and Practice, 12(2), 1015-1021.
Key, L. V., Bradley, J. A., & Bradley, K. S. (2010). Stimulating Instruction in Social Studies.
Social Studies, 101(3), 117-120. doi: 10.1080/00377990903283932
Effectiveness of Graphic Organizers
31
Kim, A. H., Vaughn, S., Wanzek, J., & Wei, S. (2004). Graphic Organizers and Their Effects on
the Reading Comprehension of Students with LD: A Synthesis of Research. Journal of
Learning Disabilities, 37(2), 105-118.
Marchand-Martella, N., Miller, T. L., & MacQueen, C. (1998). Graphic organizers. Teaching
Pre K-8, 28(4), 46.
Marzano, R. J. (2009). Setting the Record STRAIGHT on "High-Yield" Strategies. Phi Delta
Kappan, 91(1), 30-37.
Merkley, D. M., & Jefferies, D. (2000). Guidelines for implementing a graphic organizer.
Reading Teacher, 54(4), 350.
Mosco, M. (2005). Getting the Information Graphically. Arts & Activities, 138(1), 44-44.
Myers, M. P., & Savage, T. (2005). Enhancing Student Comprehension of Social Studies
Material. Social Studies, 96(1), 18.
Ozmen, R. G. (2011). Comparison of Two Different Presentations of Graphic Organizers in
Recalling Information in Expository Texts with Intellectually Disabled Students.
Educational Sciences: Theory and Practice, 11(2), 785-793.
Robinson, D. H., Katayama, A. D., Beth, A., Odom, S., Ya-Ping, H., & Vanderveen, A. (2006).
Increasing Text Comprehension and Graphic Note Taking Using a Partial Graphic
Organizer. Journal of Educational Research, 100(2), 103-111.
Robinson, D. H., & Kiewra, K. A. (1995). Visual argument: Graphic organizers are superior to
outlines in improving learning from text. Journal of Educational Psychology, 87(3), 455.
Scruggs, T. E., Mastropieri, M. A., & Okolo, C. M. (2008a). Science and Social Studies for
Students with Disabilities. Focus on Exceptional Children, 41(2), 1.
Effectiveness of Graphic Organizers
32
Scruggs, T. E., Mastropieri, M. A., & Okolo, G. M. (2008b). Focus on Exceptional children.
Focus on Exceptional Children, 41(2), 1-24.
SOCIAL STUDIES. (2013). District Administration, 49(3), 51-55.
Steele, M. M. (2008). Teaching Social Studies to Middle School Students with Learning
Problems. Clearing House, 81(5), 197-200.
Wakeman, S., Karvonen, M., & Ahumada, A. (2013). Changing Instruction to Increase
Achievement for Students With Moderate to Severe Intellectual Disabilities. Teaching
Exceptional Children, 46(2), 6-13.
Tileston, D.W. (2004). What every teacher should know about instructional planning.
Thousand Oaks, CA: Corwin Press, Inc.
U.S. Department of Education. (2007). No child left behind FAQs. Washington, DC:
Author. Retrieved November 27, 2007, from http://answers.ed.gov
Wood, V. (2013). West Virginia 150 years of statehood. (1st ed.). Atlanta, Georgia: Clairmont
Press, Inc.
Effectiveness of Graphic Organizers
33
Appendix A:
Concept/Event Map Graphic Organizer
Effectiveness of Graphic Organizers
34
Appendix B:
Sequence Chain Graphic Organizer
Effectiveness of Graphic Organizers
35
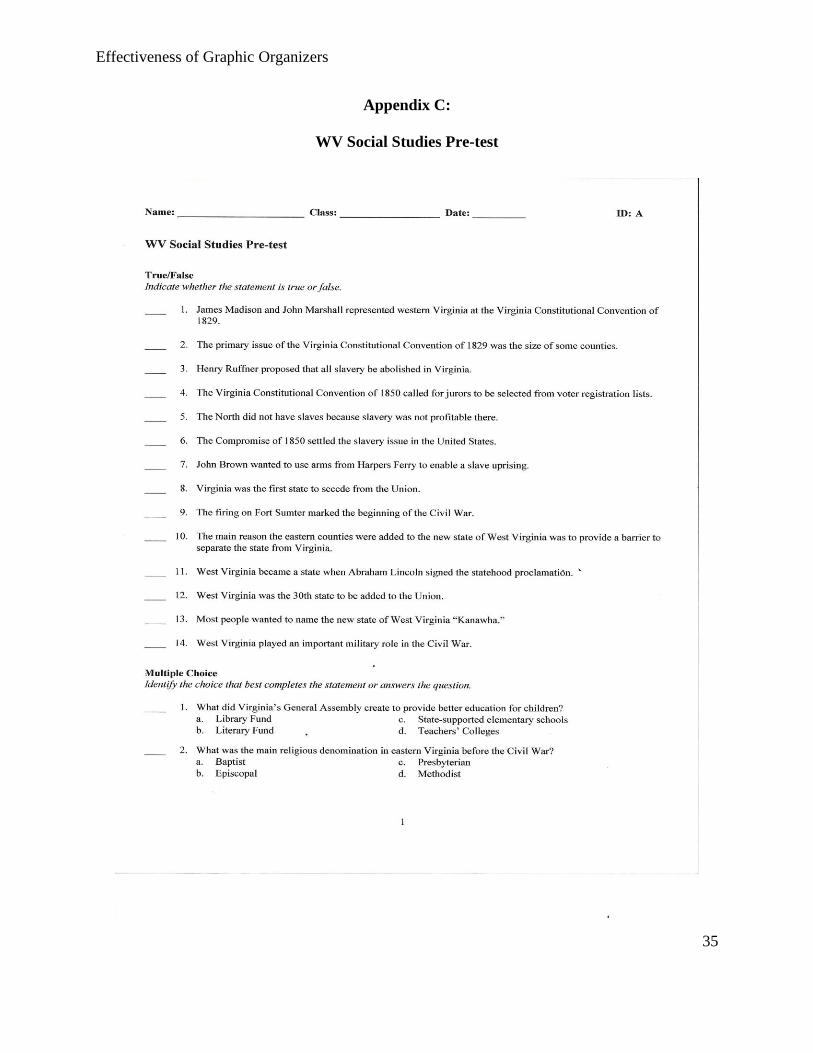
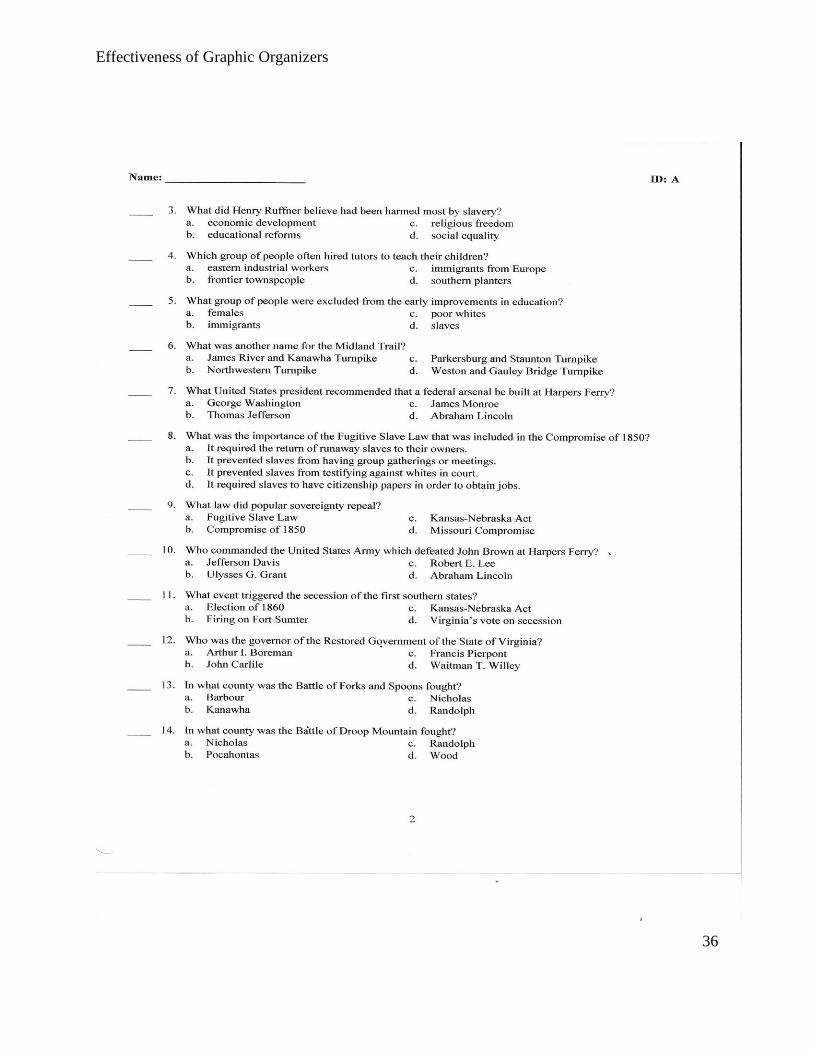
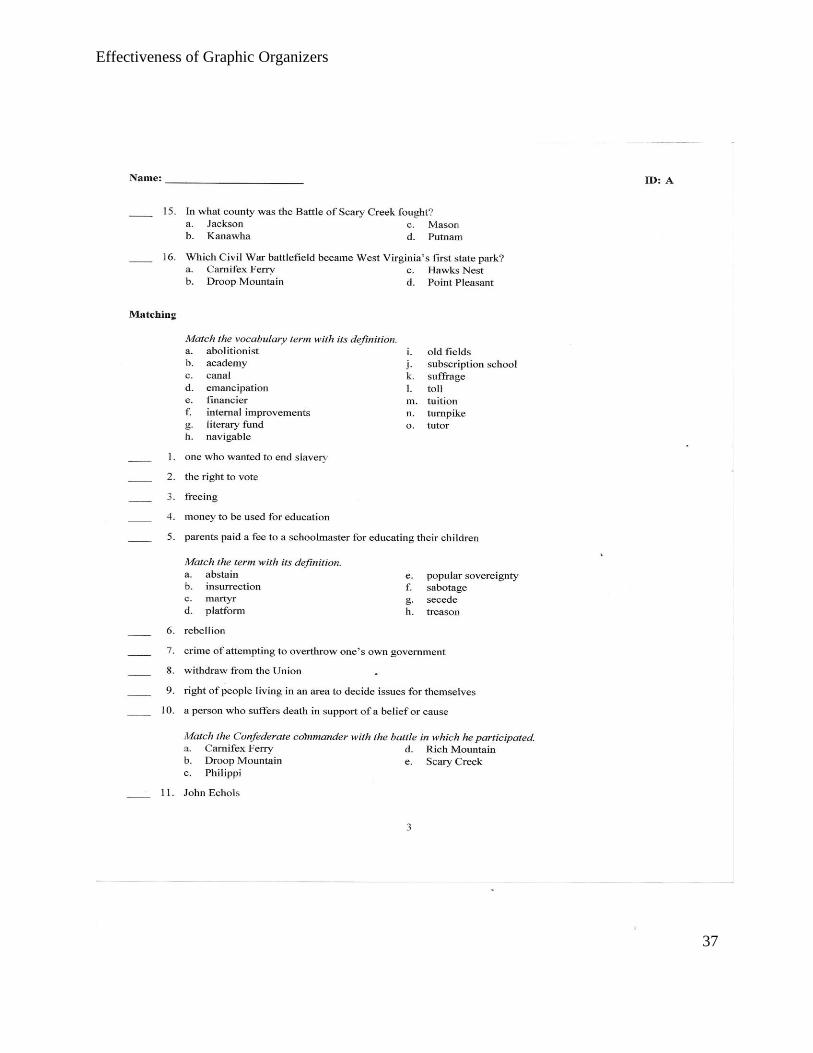
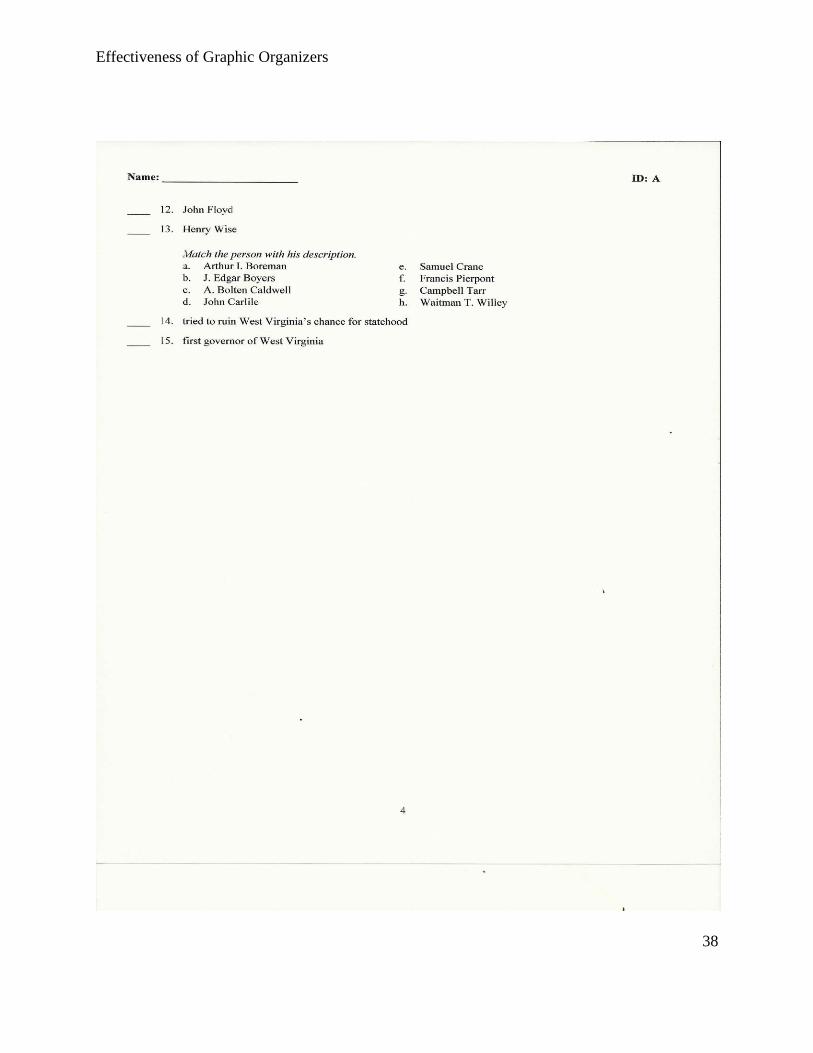
Appendix C:
WV Social Studies Pre-test
Effectiveness of Graphic Organizers
36
Effectiveness of Graphic Organizers
37
Effectiveness of Graphic Organizers
38
Effectiveness of Graphic Organizers
39
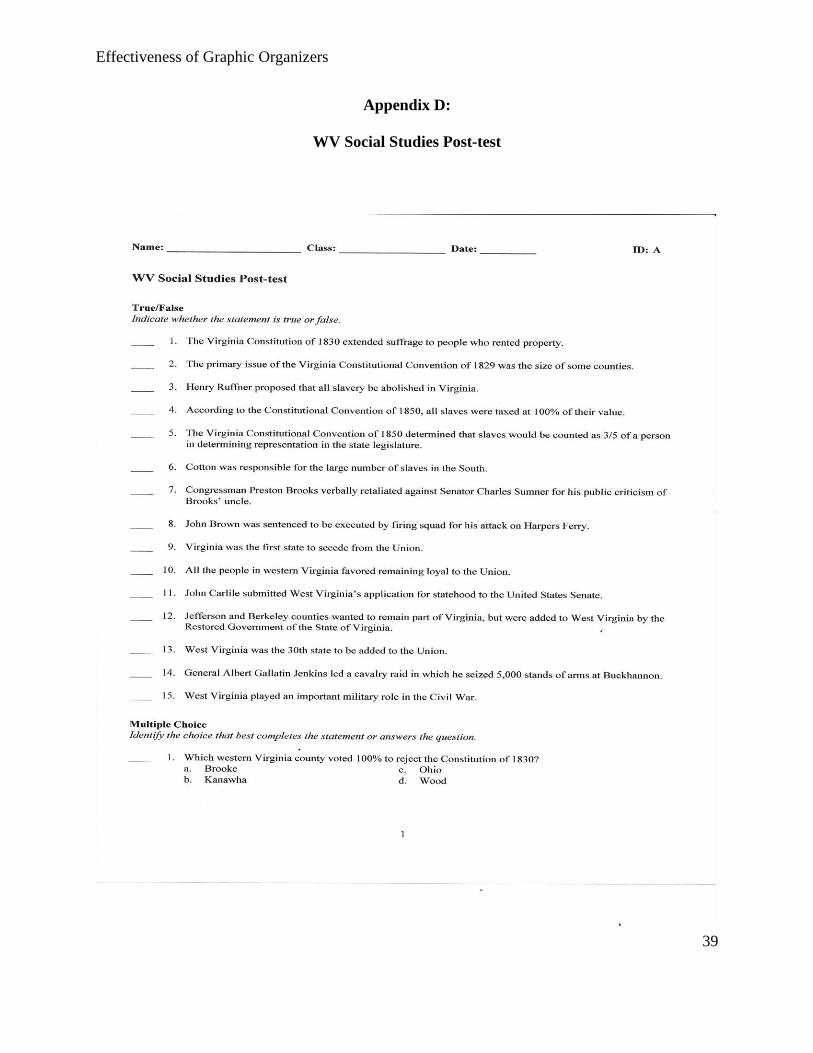
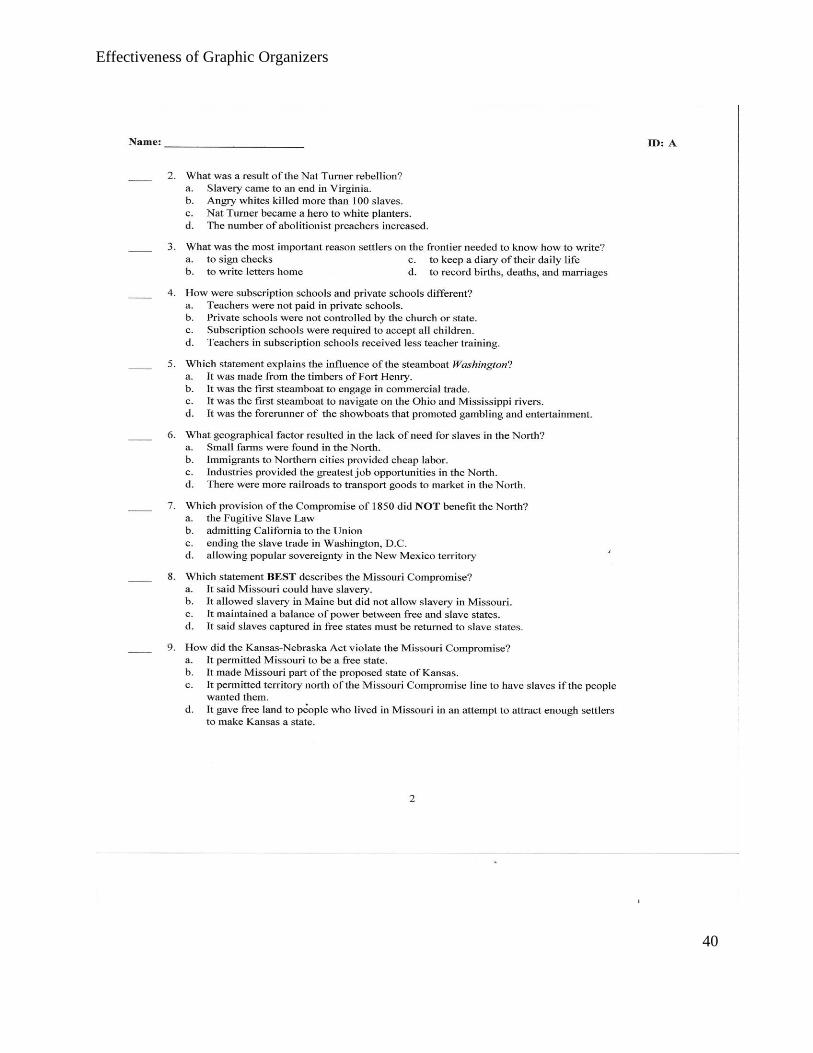
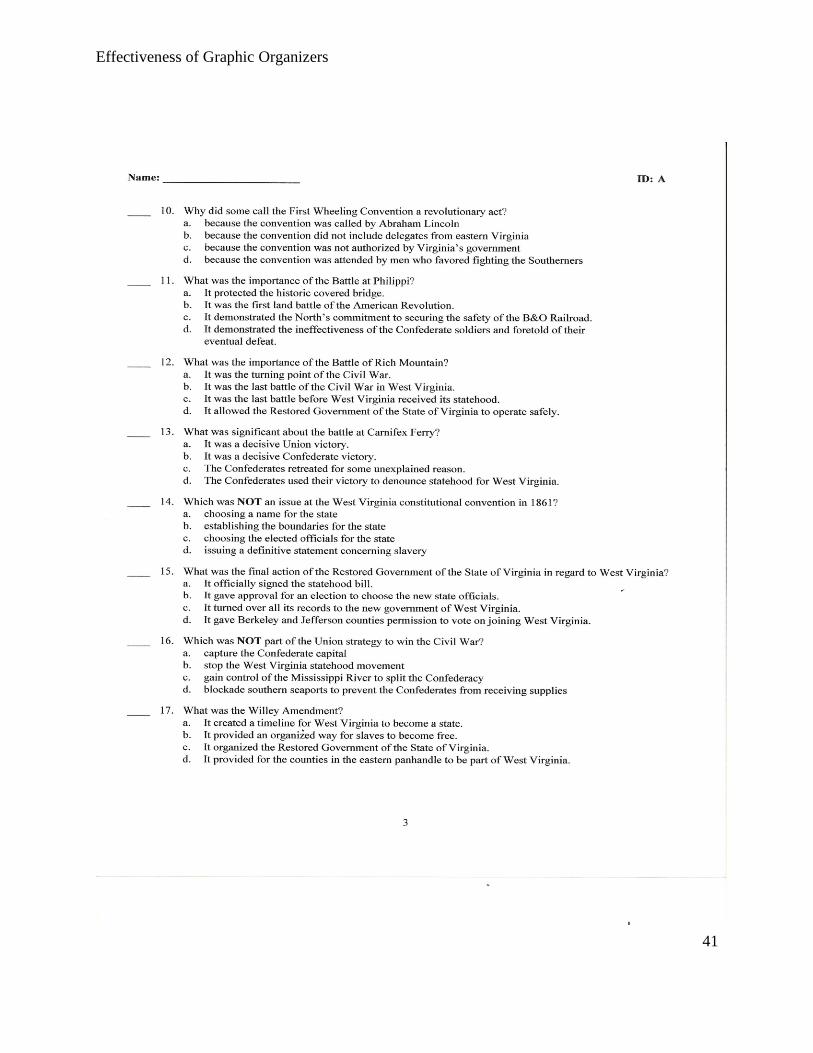
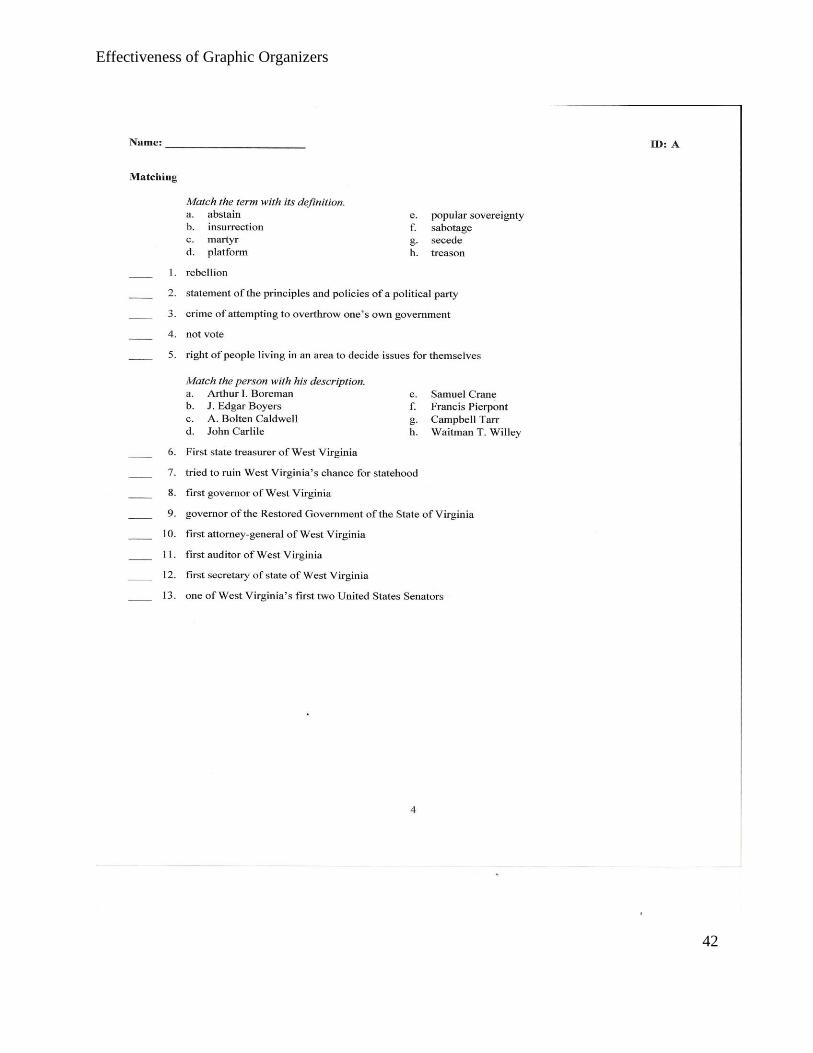
Appendix D:
WV Social Studies Post-test
Effectiveness of Graphic Organizers
40
Effectiveness of Graphic Organizers
41
Effectiveness of Graphic Organizers
42

Effectiveness of Graphic Organizers
43