Embed Size (px)
Citation preview
HAL Id: halshs-01306803https://halshs.archives-ouvertes.fr/halshs-01306803
Preprint submitted on 25 Apr 2016
HAL is a multi-disciplinary open accessarchive for the deposit and dissemination of sci-entific research documents, whether they are pub-lished or not. The documents may come fromteaching and research institutions in France orabroad, or from public or private research centers.
L’archive ouverte pluridisciplinaire HAL, estdestinée au dépôt et à la diffusion de documentsscientifiques de niveau recherche, publiés ou non,émanant des établissements d’enseignement et derecherche français ou étrangers, des laboratoirespublics ou privés.
The Effect of Labor Migration on the Diffusion ofDemocracy: Evidence from a Former Soviet RepublicToman Barsbai, Hillel Rapoport, Andreas Steinmayr, Christoph Trebesch
To cite this version:Toman Barsbai, Hillel Rapoport, Andreas Steinmayr, Christoph Trebesch. The Effect of Labor Migra-tion on the Diffusion of Democracy: Evidence from a Former Soviet Republic. 2014. �halshs-01306803�
The Effect of Labor Migration on the Diffusion of Democracy: Evidence from a Former Soviet Republic
Toman BARSBAI
Kiel Institute for the World Economy
Hillel RAPOPORT
Paris School of Economics, University
Paris 1, Migration Policy Center, EUI
Andreas STEINMAYR
University of Munich
Christoph TREBESCH
University of Munich and CESifo
April 2016
This work has been supported by the French National Research Agency,
through the program Investissements d'Avenir, ANR-10-LABX-93-01
G-MonD Working Paper n°44
For sustainable and inclusive world development
The Effect of Labor Migration on the Diffusion of Democracy: Evidence from a Former Soviet Republic*
Toman Barsbai†‡ Hillel Rapoport
Andreas Steinmayr Christoph Trebesch
Abstract
Migration contributes to the circulation of goods, knowledge, and ideas. Using community and individual-level data from Moldova, we show that the emigration wave that started in the late 1990s strongly affected electoral outcomes and political preferences in Moldova during the following decade, eventually contributing to the fall of the last Communist government in Europe. Our results are suggestive of information transmission and cultural diffusion channels. Identification relies on the quasi-experimental context and on the differential effects arising from the fact that emigration was directed both to more democratic Western Europe and to less democratic Russia.
Key words: Emigration, political institutions, elections, social networks, information transmission, cultural diffusion.
JEL: F22, D72, O1
* We thank Esther Ademmer, Alberto Alesina, Irina Baraliuc, Ruxanda Berlinschi, Romeo Bernardo, Simone Bertoli, Bruno Biais, Christine Binzel, George Borjas, Igor Botan, Michael Clemens, Randolf David, Eva Deuchert, Oliver Falk, Jeff Grogger, Edilberto de Jesus, Asim Khwaja, Michael Lechner, David McKenzie, Alice Mesnard, Arash Nekoei, Nathan Nunn, Ben Olken, Lant Pritchett, Elena Prohnitchi, Valeriu Prohnitchi, Imran Rasul, Stefan Rother, Matti Sarvimäki, Carl von Schweinitz, Jesse Shapiro, Uwe Sunde, Erwin Tiongson, Bogdan Voicu, David Yanagizawa-Drott, Ekaterina Zhuravskaya, Clara Zverina as well as seminar/conference participants in Berlin, Bern, Chicago, City University London, Columbia, Geneva, Harvard, Hebrew University, Heidelberg, IZA, Kiel, Malaga, Manila, Moscow, Munich, St. Gallen, UCL, Vienna, and NEUDC 2013 for helpful comments and discussions. We are also very grateful to Iaroslav Baclajanschi, Vasile Cantarji, Iurie Ciocan, Martin Raiser and Alexandr Socolov for their invaluable support in collecting the data for this project. All remaining errors are ours.
† Toman Barsbai: Kiel Institute for the World Economy, [email protected]. Hillel Rapoport: Paris School of Economics, University Paris 1 Panthéon-Sorbonne and Migration Policy Center, European University Institute, [email protected]. Andreas Steinmayr: University of Munich, [email protected]. Christoph Trebesch: University of Munich and CESifo, [email protected].
‡ Corresponding author.
1
1 Introduction
When people cross borders, they are exposed to new knowledge, new ideas and new institutions.
International migration can therefore impact an individual’s attitudes and beliefs, including her or his
political preferences. Indeed, sociologists and other social scientists have shown that living abroad
can be a transformative experience for the migrant.1 Little attention has been paid, however, on how
these experiences spill over to migrants’ home communities and affect the political behavior of those
who stay behind.2
This paper investigates the effect of labor migration on democratization and voting behavior of
those who stay behind in the country of origin. It builds on the idea that migrants absorb new
political norms, practices, and information while abroad, which they then transmit to their home
communities. These political spillovers have the potential to change political preferences and
strengthen the constituency for political change, especially in regions where information acquisition
is difficult or costly. In a globalized world with cheap communication and travel, emigration no
longer means that migrants lose their voice at home, as suggested in the seminal “exit, voice and
loyalty” framework by Albert Hirschman (1970).3 Instead, our hypothesis is that international labor
migration can be an important catalyst of democratization in migrant-sending countries, especially if
migration is directed towards advanced democracies.
To analyze the effects of emigration on political outcomes and attitudes at home, we make use of a
quasi-experimental setting that was generated by the collapse of the Soviet Union. We combine
census, election and survey data to test whether communities with emigration to democratic
countries experience an increase in political support for more democratic and liberal parties. We find
1 See Cain et al. (1991), Berry (1997), Levitt (1998), Careja and Emmenegger (2012), and Cameron et al. (2015). Relatedly, Clingingsmith et al. (2009) study the social consequences of the Muslim pilgrimage to Mecca. They find that this relatively short experience leads to a persistent change towards more religious tolerance in Pakistani pilgrims’ attitudes, beliefs, and practices at home. Value transfers as a result from international migration have also been documented with regard to fertility behavior (Fargues, 2007; Beine et al., 2013).
2 In economics, there is a large related literature showing that migration flows and diaspora networks promote the exchange of goods, capital, and ideas. Gould (1994), Rauch and Trindade (2002) and Parsons and Vezina (2014) show that migrant networks reduce information asymmetries and foster bilateral trade. Kerr (2008) illustrates how migrant networks facilitate the diffusion of innovation. Burchardi and Hassan (2013) show that social ties to East German households facilitated regional economic development in West Germany after Germany’s reunification. Hornung (2014) studies the human capital externalities from Huguenot immigration to Prussia, while Moser et al. (2014) study the externalities of the mass departure of Jewish scientists from Nazi Germany to the US.
3 Hirschman illustrated his theory using the example of East Germany. His conclusion was that the emigration waves of the 1950s and 1960s had weakened the reformist voices, eventually strengthening the repressive communist regime (see also Hirschman, 1993). Similar analyses have been proposed with regard to autocratic regimes such as Cuba, or for countries such as Mexico, where emigration served as safety valve, relaxing domestic pressure to reform and, thus, delaying social and political change. See Hansen (1988) on Mexico and Colomer (2000) on Cuba.
2
that migration can trigger significant changes in the voting behavior and political attitudes of
relatives, friends and other members of migrants’ home-based networks.
This paper adds a new perspective to the literature, which finds institutions to have profound effects
on people’s political preferences (Alesina and Fuchs-Schuendeln, 2007; Aghion et al., 2010; Fuchs-
Schündeln and Schündeln, 2015). Our contribution is to show that even indirect exposure to
institutions, social norms and information – through contacts with migrants – can importantly shape
political preferences. We hence also contribute to the literature on institutional development, which
has recently been extending its focus from institutional persistence to institutional change. For
instance, Acemoglu and Robinson (2012) have been stressing the importance of critical junctures for
institutional change. In addition, we contribute to the literature on institutions and culture (Spolaore
and Wacziarg, 2013; Alesina and Giuliano, forthcoming) by showing that institutional knowledge
transmitted by migrants from abroad can change the slow-moving relationship between institutions
and cultural traits such as values and beliefs.
Our analysis focuses on the case of Moldova, a former Soviet Republic that has seen a remarkable
transition towards democracy over the past 20 years. During communism and the years after
independence in 1991 the country was largely closed off from Western influence and ruled by parties
that were opposed to Western values and institutions. In 2001, the Communist Party returned to
power, drawing Moldova closer towards Russia. Yet, after one decade of large-scale emigration to the
West, a coalition of pro-democracy and pro-European parties took over in 2009. The “Alliance for
European Integration” changed the political path of Moldova, making the country a poster child in
terms of economic and political reforms in the region, with rapid improvements in civil liberties and
press freedom. This political development culminated in the ratification of an EU association
agreement in 2014.4 We posit that exposure to Western political values and practices through
emigration played a critical role in bringing about political and democratic change in Moldova.
Moldova shares many traits with other transition and developing countries, but provides a unique
laboratory to identify the political spillover effects of labor migration. First and foremost – and
unlike most migrant-sending countries – Moldova has two main migration corridors to destinations
with very different democratic traditions and political ideologies. About 40% of emigrants have left
for democratic countries in Western Europe, while 60% went to work in less democratic countries in
4 During a speech in the German Bundestag in November 2013, German Chancellor Angela Merkel said: “In spite of some domestic turmoil, the Republic of Moldova has perhaps demonstrated the greatest political will of all Eastern partners to adopt and implement reforms.”
3
the East, in particular Russia. This divergence allows us to identify destination-specific political
spillovers, as migrants to Western Europe arguably transmit different information and norms than
migrants to Russia. The scope of political spillovers of emigration may be as important in other
settings with just one main migration corridor (e.g., emigration from Mexico to the US). The bipolar
pattern of emigration from Moldova, however, allows us to isolate political spillovers from other
migration-related effects such as income effects of monetary remittances. We exploit the large
variation in political regimes across destination countries to test for destination-specific effects of
emigration on electoral outcomes.
Our identification strategy relies on the quasi-experimental setting under which the episode of
emigration we analyze took place. There was hardly any emigration out of Moldova before the
Russian financial crisis of 1998. Within just a few years after the crisis, more than 300,000 Moldovans
left the country. We can hence condition on pre-migration voting behavior to difference out time-
constant electoral preferences. We also document that Moldova is a relatively homogenous country
and that the direction of migration flows (West versus East) varies greatly across observationally
similar communities. No systematic spatial pattern exists once we control for pre-migration
community characteristics, in particular for factors driving the destination choice of the first migrants
who departed at the end of the 1990s. It thus seems that small differences in initial community
characteristics can bring about large differences in migration patterns. Networks formed by early
migrants were influential for the destination choice of subsequent migrants, which explains clustering
of migrants from the same community in certain destinations. This observation is consistent with the
idea that, conditional on pre-migration conditions, networks introduce a considerable quasi-
experimental component in the direction of migration flows that is unrelated to levels or trends in
electoral preferences.
Our main challenge is that migrants’ destination choices could have been driven by political
preferences, or by a confounder that drives both migration and voting patterns. Political self-
selection at the individual level (Hirschman’s “exit effect”) is unlikely to explain a negative
relationship between westward migration and the share of votes for the Communist Party (our main
dependent variable). If anything, the departure of liberal-minded voters to the West should increase,
not decrease, the share of votes for the Communist Party in a given community. Political self-
selection at the community level (i.e., communities that have characteristics that make them both
more likely to send migrants to Western Europe and to vote against the Communist Party) is more
serious an issue. To address this problem, we control for electoral preferences before migration
4
started and effectively analyze the change in Communist votes between 1998 and 2009. We can
therefore rule out any time-constant confounder including time-constant electoral preferences. In
this sense, our strategy is akin to a differences-in-differences approach, as we explain changes in
Communist votes by changes in the prevalence of migration to the West and East. We also show
that, conditional on community characteristics, pre-migration electoral preferences cannot explain
the direction of migration flows to the West or East.
To deal with time-varying confounders, we adopt a stepwise identification strategy. First, we control
for a wide range of pre-migration community characteristics. In particular, we control for the drivers
of early emigration to the East and West, since the first migrants played a crucial role for the
destination choice of subsequent migrants from the same communities.5 We also control for
community-specific economic shocks as measured by satellite data on night-time light intensity.
Second, to address spatially concentrated confounders, we only evaluate the relationship between
migration and voting patterns within districts and show that our point estimates are fully robust to
including fixed effects for increasingly smaller geographical areas. Hence we can rule out a wide
range of potentially important confounders such as economic and political shocks or social networks
including historical ties through trade or culture as long as they would affect neighboring
communities in a similar way. Third, we show that communities with westward and eastward
migration followed the same trends in electoral preferences around the time and a few years after
migration had started. This late divergence coincides with a steep increase in international
communication as a result of falling international calling rates. The timing is therefore consistent
with an interpretation of the results in terms of information transmission.
We find a strong and robust effect of migration patterns on electoral preferences and outcomes. The
magnitude of the effect is large. A one percentage point increase in the community prevalence of
westward migration (measured using data from the 2004 population census) reduces the Communist
vote share in the elections of 2009 by about 0.6 percentage points. This result is remarkable as it
suggests that the exit effect (the departure of liberal-minded voters) is more than offset by political
spillovers from abroad. Our counterfactual simulations suggest that westward migration significantly
contributed to put an end to the Communists’ rule in the elections of 2009.
5 The two main drivers were access to ethnic networks and proximity to the border with Romania. The presence of a Russian minority in a community facilitated early emigration to Russia while being closer to a Romanian border-crossing facilitated emigration to the West.
5
Importantly, we document heterogeneous effects across Western destinations. The effect of
westward migration is driven by emigration to Western countries with the highest democratic
standards, not emigration to Western countries with less than perfect democracies such as Italy or
Romania. This is in spite of the fact that across Western destinations Moldovan migrants are very
homogenous in terms of education, age, occupations, and the amount of monetary remittances sent.
Therefore, differences in the selectivity of migrants with regard to their socio-economic
characteristics, the incidence of migration or of monetary remittances cannot explain our differential
effects across Western destinations.
Hence, to challenge a causal interpretation, a remaining confounder must (i) be time-varying, (ii) be
much more strongly associated with migration patterns and electoral preferences than important
control variables, (iii) affect electoral preferences several years after migration took place, (iv) not
affect neighboring communities in a similar way, and (v) account for the opposing effects of
westward and eastward migration as well as for the differential effects for full and flawed Western
democracies. While we cannot rule out such a confounder, we consider its existence implausible.
In addition, we show that our results are robust to the inclusion of additional control variables such
as the demographic characteristics of migrants or foreign language skills of the population,
alternative econometric specifications such as estimation in first differences (community fixed
effects), and alternative definitions of the West.
We also provide suggestive evidence that the effect of emigration works through information
transmission and cultural diffusion channels. The effect of westward migration is stronger in
communities in which a larger share of the population grew up during the Soviet era or has relatively
low levels of education, that is, where information and norms from the West have a larger
informational value.
Finally, we complement our community-level analysis with an individual-level analysis using data
from two sources: the Moldova Political Barometer, a political opinion survey with direct
information on individual preferences on socio-political issues, and an exit poll survey conducted
during the elections of 2010, which included a migration module that we commissioned for this
study. The results show that the observed change in electoral outcomes is accompanied by a change
in political preferences and support our interpretation in terms of information transmission and
cultural diffusion channels.
6
The paper relates to a small body of work on the link between politics and migration. One strand of
the literatures uses cross-country comparisons and finds that emigration to more democratic
countries promotes democracy and improves institutional quality at home (Spilimbergo, 2009;
Docquier et al., 2014). These studies, however, cannot disentangle the role of various potential
channels through which emigration may affect home country institutions. Another strand of the
literature uses micro data, but struggles to properly address endogeneity. These studies focus on
countries with one single destination and/or on countries with long traditions of emigration (see
Pérez-Armendáriz and Crow, 2010, and Pfutze, 2012, on Mexico; Batista and Vincente, 2011, on
Cape Verde; Chauvet and Mercier, 2014, on Mali), which makes it impossible to control for pre-
migration political conditions and isolate the transfer of political information and norms from other
migration-related effects.
2 Moldova as an ideal case study
2.1 Political background
Moldova is a formal parliamentary democracy. The country gained independence from the Soviet
Union in 1991 and has been politically stable besides a four-month war on the breakaway region of
Transnistria in 1992.6 Between independence and 2013, the country saw seven parliamentary
elections: 1994, 1998, 2001, 2005, 2009 (April and July), and 2010.
Shortly after independence, the Communist Party was banned. Nevertheless, state-oriented parties, in
particular the Socialist Party and the Agrarian Party, firmly dominated politics in the mid-1990s. The
Communist Party was re-allowed to enter the political stage at the end of the 1990s. After the
economic hardship that followed the Russian financial crisis of 1998, the Communists won a
landslide victory in the snap elections of 2001 by promising a strong hand and Soviet-era living
standards. In the years that followed, Moldova’s Freedom House scores worsened, the judiciary lost
parts of its independence, and the freedom of the press gradually eroded (Quinlan, 2004).7 Despite
some reforms and the adoption of a new, more EU-friendly foreign policy agenda in the mid-2000s,
the Communist Party remained a largely nationalist and state-centered formation, nostalgic of Soviet
times. The elections of 2009 and 2010 marked a watershed in Moldova’s political history. In April
2009, the Communist Party failed to win the three-fifths parliamentary majority necessary to elect the
6 Transnistria is a small strip of land to the East of the Dniester river, which is now effectively a Russian protectorate. It is excluded from our empirical analysis.
7 Remarkably, parliamentary elections in this period continued without manipulations (OSCE, 1998, 2001, 2005, 2009).
7
country’s president. Following allegations of vote fraud, anti-government protestors took to the
streets, looted the parliament and raised flags of the European Union on several government
buildings. Without a presidential majority in parliament, new elections were held in July 2009 that
saw the victory of the “Alliance for European Integration”, a liberal four-party coalition. Because the
Alliance also lacked a presidential majority, another election was held in November 2010, resulting in
further losses for the Communist Party.
Since then, the Alliance has consolidated its power, elected a president, and started to implement
economic and political reforms. A recent progress report by the European Commission (2012)
highlights that Moldova has improved in many areas, including institutional quality, freedom of the
press, and investment climate.8 The country also topped the list of reformers in the World Bank’s
‘Doing Business’ Report 2012 and most recently, in June 2014, signed a far-reaching association
agreement with the European Union. In line with political scientists (Mungiu-Pippidi and Munteanu
2009; Marandici, 2010, Crowther, 2011), we therefore interpret voting against the Communist Party
(i.e., for a liberal opposition party) as voting for political and democratic change. That said, it should
be noted that by no means all members of the “Alliance for European Integration” are dedicated
reformers and genuinely embrace democratic values. Despite the recent improvements in
institutional quality, corruption remains widespread and Moldova still has a long way to go to
become a full democracy.
As we detail below, two factors make Moldova a particularly well-suited case study. First, unlike most
migrant-sending countries, Moldova has two main migration corridors to destinations of very
different democratic traditions and political ideologies. Migrants leave both for the West and East
and large-scale migration started only after 1998. We take advantage of this pattern to identify
destination-specific effects of emigration. Second, Moldovans had very limited access to information
from the West before emigration took place, and continued to have restricted access to Western
media until the late 2000s. This setting makes informational spillovers from abroad an important
potential channel for the observed changes in the preferences of the Moldovan electorate.
8 A 2011 Freedom House report stated that “Moldova’s civil liberties rating improved from 4 to 3 due to a more balanced and diverse media environment, a reduction in government hostility toward civil society groups, and a lack of interference with political gatherings.” (http://www.freedomhouse.org/report/freedom-world/2011/moldova). Moldova’s press freedom score as reported by Reporters Without Borders also increased – from 22 in 2008, ranked 98 worldwide, to 16 in 2011, ranked 53 worldwide. This gives Moldova the best position among all post-Soviet states outside the European Union (http://en.rsf.org/spip.php?page=classement&id_rubrique=1043).
8
2.2 A quasi-experimental setting
Moldova’s emigration took off only after 1998, when the country was severely and unexpectedly hit
by the Russian financial crisis.9 As a result of the crisis, Moldova’s currency depreciated sharply,
agricultural exports froze, and output fell by 32.5% year-on-year (Radziwill et al., 1999). All parts of
the population were adversely affected and Moldovans started to emigrate in large numbers. The
Russian financial crisis hit Moldova more severely than Russia. Russia, which started with a much
higher GDP per-capita, recovered quickly and saw strong economic growth in 1999 and the years
thereafter. Moldova’s economy, however, was still shrinking in 1999 and grew only modestly in 2000.
As a result, working abroad, including in Russia, became attractive for many Moldovans.
The shift from low (virtually zero) migration prevalence to high migration prevalence is apparent
from Figure 1, which is based on data from the Moldovan Labor Force Survey available from 1999
onwards. The same trend is observable using immigration figures of destination countries. The
figures confirm that Moldova had very little out-migration throughout the 1990s. As of 1998, for
example, only 15 Moldovan immigrants were registered in Italy, but this number increased to 40,000
by 2004. A similar explosive growth in Moldovan immigration occurred in other popular destination
countries such as Greece, Portugal and Spain.10 By 2009, more than 300,000 Moldovans had left the
country on a temporary or permanent basis, out of a population of 3.6 million (Luecke et al., 2009).11
Whether migrants from a given community leave for the West or the East largely depends on the
destination choice made by the first migrants from that community. This is because migrant
networks induce a high degree of path dependency in migration flows by providing information on
jobs abroad and lower the costs of migration for subsequent migrants. As a result, migrants from a
specific origin tend to cluster at specific destinations (Munshi, 2003; McKenzie and Rapoport, 2010).
This observation also holds for Moldova, where local migrant networks are a main driver of
individual migration decisions (Görlich and Trebesch, 2008).
9 It should be noted, however, that large parts of Moldova’s Jewish community emigrated to Israel, the United States, and Germany directly after the collapse of the Soviet Union. Jewish migrants left permanently with their families and did not maintain strong ties with Moldova. This small wave of emigration, therefore, differs substantially from the subsequent wave of labor migration that started in the late 1990s (Moşneaga et al., 2006).
10 As of 1998, the number of Moldovan residents in Portugal, Greece and Spain was virtually zero (given as 0, 944 and 96, respectively), but increased drastically afterwards. Data for Italy is from the Ministero Dell'Interno, for Portugal from the Instituto Nacional de Estatistica, for Greece from the Hellenic Statistical Authority and for Spain from the OECD. For Russia, no statistics on Moldovan immigration is available.
11 In comparison, internal migration is much less widespread. According to the 2004 population census, only six percent of the population changed their residence within Moldova in the five-year period prior to the census. The vast majority of them moved to Chisinau or Balti, the only two major cities in the country.
9
Two factors primarily influenced the destination choice of the first migrants. The first factor was
access to ethnic networks (Krause, 2000; Moşneaga, 2009). Russian and Gagauz minorities in a
community facilitated the departure to Russia and Turkey, while ethnic Moldovans could draw on
Romanian ancestry and successfully apply for a Romanian passport, which considerably eased
departure towards Western Europe. The second factor was the web of personal contacts that
resulted from trading across the Moldovan-Romanian border (Sandu et al., 2006).12 The Romanian
border had been closed during Soviet times and its opening in the early 1990s offered ample
arbitrage opportunities. The resulting “shuttle trade” flourished and gave Moldovan merchants
access to a growing network of Romanian migrants who were working in Western Europe
(Michalon, 2009; Arambaşa, 2009). Appendix 1 shows supporting evidence and analyzes the
determinants of migration patterns in detail.
For identification, we exploit the fact that migration patterns vary greatly across observationally
similar and neighboring communities. Figures 2 and 3 show the distribution of overall migration
prevalence and the share of westward migrants among all migrants. While there is some spatial
clustering of observed migration patterns (Figure 2), no systematic spatial pattern exists for the
residual variation that is left after controlling for observable pre-migration community characteristics
(which are described in Section 4.3), in particular the factors that drove the destination choice of the
first migrants (Figure 3). This finding is consistent with the idea that, conditional on observables,
migrant networks introduce a considerable quasi-experimental component in the direction of
migration flows. Migrant networks can cause small differences in pre-migration community
characteristics, unrelated to levels or trends in electoral preferences, to bring about large differences
in migration patterns.
2.3 Emigration and access to information from the West
Recent research has documented the importance of media access for electoral outcomes. DellaVigna
and Gentzkow (2010) conclude that access to a diverse set of news media can have a substantial
effect on election results. Enikolopov et al. (2011) find that access to an independent TV channel in
Russia reduced the vote share of Vladimir Putin’s ruling party by eight percentage points. In the
context of Moldova, we find that information transmitted through migrants can also have large
effects on electoral preferences and be an additional vector of democratization.
12 Cross-border trade was halted when Romania joined the European Union in 2007. The result was stronger border enforcement and stricter visa and customs regulations (Arambaşa, 2009).
10
During Soviet times, Moldova was virtually cut off from the rest of the world and had little exchange
through migration, travel, media, or books. Moldovans were exposed to decades of anti-capitalist,
anti-Western propaganda. Even after 1991, they had only limited access to free media, in particular
with regard to television, by far the most important source of information. Internet, radio, and print
media played only a subordinated role (Open Source Center, 2008).13 Moldovans received no
terrestrial signal of Western TV and the three main television channels were state-controlled
throughout the 2000s (Moldova 1, NIT and Prime TV). These channels did not provide independent
coverage and focused on countries of the former Soviet Union, while the few small opposition
channels were subject to continuous intimidation by the government (IJC, 2009). Until today,
“Vremya”, a direct successor of the main news show of the USSR, remains the most popular news
show in Moldova (Open Society Foundations, 2012). As a result, large parts of Moldova’s population
have not had access to unbiased information and have been systematically misinformed (IDIS
Viitorul, 2009). In 2005, only 15% of respondents agreed to the statement that “media are free […]
with no government censorship” according to the Moldovan Political Barometer.
At the same time, all available evidence suggests that information transmitted by migrants became
increasingly important during the period of this study. Based on a nationally representative sample of
4,000 households, Luecke et al. (2009) report that more than 90 percent of emigrants in 2008
communicated with their families at least once a month, more than two thirds of them even at least
once a week. Virtually all migrants (97%) used the phone, while email or internet telephony played
no important role until after 2010. The patterns of communication are very similar for migrants to
the West and migrants to the East. Figure 1 shows that the volume of calls from abroad to Moldova
steadily increased with the number of migrants until 2006 but skyrocketed afterwards. From 2006 to
2007 alone, the volume of international calls more than doubled. The steep increase is likely due to
the large reduction in international calling rates and the quick spread of mobile telephony. According
to World Bank data in the WDI and the ICT Handbook, the increase in the volume of international
calls between 2004 and 2008 coincides with a three-fold increase in mobile cellular subscriptions per
100 people (from 21 in 2004 to 67 in 2008) and a more than 50 percent drop in mobile telephony
costs as well as in international calling rates. The growth in cross-border telephony is particularly
large for main migrant destination countries such as Italy. According to the few bilateral data
13 71% of respondents in the 2005 Moldovan Political Barometer stated that television was their main source of political information, 50% also stated that television was the source they trusted most (Open Source Center, 2008). Internet usage has been negligible until very recently. In 2008, only three percent of the population had access to the internet, most of them living in the capital Chisinau (Open Society Foundations, 2012).
11
available from Telegeography, calls from Italy to Moldova increased from close to zero in 1998, i.e.
before emigration from Moldova took off, to 150 million minutes in 2009. This is equivalent to
almost 3,000 minutes per migrant in Italy per year, or around 60 minutes per week on average. In
addition, migrants frequently visit their families in Moldova, on average twice a year (Luecke et al.,
2009).
3 Descriptive evidence
3.1 Data and stylized facts
Our main outcome variable is the share of Communist votes in the parliamentary election of July
2009, which marked the fall of the Communist government. The main unit of analysis is the
community and we consider all Moldovan communities except those in the breakaway region of
Transnistria for which no data is available. Communities are typically small and rural, with an average
population size of 3,793 inhabitants (median of 2,126 inhabitants). Only 45 out of the 848
communities in our sample are classified as urban. Vote shares at the community level are based on
official election results as documented by the Central Election Commission.14 We only consider
votes cast by the resident population in Moldova and exclude the few out-of-country votes cast by
migrants in Moldovan embassies and consulates abroad.15 The electorate votes for political parties,
not individual candidates. Parties publish the list with the names of their 103 candidates in advance
(the parliament has 101 seats, 2 candidates are in reserve). The candidates are the same across
communities and a member of parliament does not represent a specific territorial constituency.
The main explanatory variables are the prevalence of emigration to the West and East, which are
measured as the share of westward and eastward migrants in the total population of each community
(as percent). Information on emigration comes from the 2004 population census, which is one of the
very few censuses worldwide with detailed information on individuals who are temporarily or
permanently absent and reside abroad. Absent persons include individuals who may have lived
abroad for several years as long as they had maintained family relations with the household of origin.
As it was highly unusual for entire families to emigrate in the early 2000s (Luecke et al., 2009),
14 There have been no reports of grave irregularities during Moldovan parliamentary elections, but we cannot fully dismiss the possibility of minor vote fraud. However, for vote fraud to explain our findings the Communists should have been less able to manipulate votes in communities with westward migration and more able to do so in communities with eastward migration. This assertion would, however, only strengthen the case that emigration affects political preferences.
15 In the parliamentary election of July 2009, only 17,544 migrants participated in out-of-country voting. As out-of-country votes are listed separately, we can exclude them for our analysis.
12
remaining household members could provide information on migrants abroad. The census should
therefore give an accurate picture of migration patterns up to 2004.
We classify destination countries as West or East based on their democracy levels. Countries with a
Polity IV score higher than Moldova’s are defined as Western countries. Countries with a score lower
or equal to Moldova’s are defined as Eastern countries (see Appendix 3 for different definitions of
the West and East). This classification closely reflects destination countries’ geographical position
relative to Moldova, hence the terms West and East. The most important destinations in the West
are Italy (mostly Northern Italy, see Luecke et al., 2007) and other Roman-language countries; the
most important destination in the East is by far Russia (see Table A1 in the appendix).
Figure 4 plots migration prevalence in 2004 against the share of Communist votes in the
parliamentary election of July 2009. There is no systematic relationship between overall migration
and Communist votes at the community level (upper panel). But the picture looks different once we
distinguish between emigration to the West and East. The share of Communist votes (i.e., the share
of votes for more democratic opposition parties) decreases with the level of westward migration
(middle panel) and increases with the level of eastward migration (lower panel).
Figure 1 shows the evolution of Communist votes for different types of communities over the
parliamentary elections of 1998, 2001, 2005 and July 2009. The black solid line shows the trend over
all communities. The blue and red dashed lines show the respective trend for communities with high
levels of emigration to the West and to the East. Conditional on observable pre-migration
community characteristics, there are hardly any initial differences in the share of Communist votes in
1998 between the different types of communities. Over the period 1998-2005, which marks the first
years of emigration from Moldova, the different types of communities follow virtually the same
trend. Following the Russian financial crisis, the Communist Party massively increased its vote share
from 1998 to 2001 and then modestly from 2001 to 2005. Trends only begin to diverge between
2005 and 2009. While there is an overall decrease in Communist votes, the decrease is particularly
large in communities with westward migration and only small in communities with eastward
migration. Strikingly, trends diverge at a time when the volume of calls from abroad to Moldova
experienced a more than three-fold increase between 2005 and 2009. This timing is consistent with
our argument that migrants transmit new information to their home communities.
13
3.2 Anecdotal evidence from qualitative interviews
To inform our understanding of the mechanisms at work, we conducted a series of non-structured
interviews with return migrants and political observers in Moldova as well as with Moldovan
migrants currently living in Western Europe. We asked what kind of information on politics and
institutions migrants shared with their family and friends in Moldova and whether such information
transfers mattered.
The general lesson from these interviews is that many migrants in the West perceived themselves as
“teaching” their family and friends on how Western Europe “works”. Many interviewees portrayed
those left behind as politically indifferent and uninformed, in particular in poor rural areas. Several
migrants stated that they had made outright electoral recommendations to those they talked to back
home. For example, one migrant in Italy told us that she had intentionally called up her family and
neighbors before the July 2009 elections telling them not to be deceived by electoral gifts from
Communist campaigners such as vodka or sacks of potatoes.
Corruption was one of the main political issues mentioned. Migrants told us that living in Western
Europe had made them less likely to tolerate corruption and that they had encouraged their peers in
Moldova not to pay bribes16 and to support parties with an anti-corruption agenda instead. Several
migrants reported that they had communicated a broad “vision of Europe” and of modern societies,
emphasizing positive characteristics such as economic prosperity, entrepreneurship and the free
movement of people (due to the Schengen area). We could not uncover evidence for strategic voting.
No interviewee alluded to the idea that visa access or temporary work permits had played a role for
their political preferences or vote recommendations. In sum, the qualitative interviews strongly
suggest that information transmitted by migrants in the West may have played an important role for
voting decisions in communities with an uninformed electorate.
4 Empirical strategy
4.1 Basic specification
Our basic empirical specification to estimate the relationship between migration patterns and
Communist votes is
ijjijijijijij XonVotesPremigratiEastWestCommunist εµλδγβα ++++++= ''200420042009
16 Similarly, Kubal (2015) documents that migrants who have returned from Western Europe to Ukraine partly adopt socio-legal practices from their destination countries and transmit them to their families.
14
where i indexes communities and j districts. The dependent variable is the share of votes for the
Communist Party in the parliamentary election of July 2009. Westij2004 and Eastij2004 denote the share of
a community’s population that has emigrated to the West and to the East as measured by the
population census in 2004. As there was barely any emigration from Moldova before the Russian
financial crisis of 1998, Westij2004 and Eastij2004 can also be interpreted as changes in the prevalence of
migration between 1998 and 2004. PremigrationVotesij is one of our most important control variables.
It captures the electoral preferences of each community before migration took off. For the
parliamentary elections of both 1994 and 1998, we control for the vote share of the four major
parties including the vote share of the Communist Party. In the sense that we explain changes in
Communist votes by changes in the prevalence of migration to the West and East, our estimation
strategy is akin to a differences-in-differences approach. Xij is a vector of other control variables at
the community level which we introduce in detail below. µ is a vector of district-level fixed effects.
Our main coefficients of interest are β and γ. In accordance with destination-specific transfers of
information and norms, we expect β, the coefficient of westward migration, to be negative and γ, the
coefficient of eastward migration, to be positive. However, we expect the relationship between
eastward migration and Communist votes to be weaker than for westward migration, as the socio-
political environment of Moldova is more similar to the East than to the West. We estimate the
model with ordinary least squares and cluster standard errors at the district level to take into account
that election results of communities in the same district are likely to be correlated.
To arrive at causal estimates, the ideal experiment would randomize who migrates and to which
destination. The coefficients of westward and eastward migration would then provide unbiased and
causal estimates of destination-specific political spillovers on those who stay behind. Such an
experiment is, however, practically not feasible.
To deal with the observational nature of our data, we need to address two main challenges for
identification: first, political self-selection of migrants, discussed in Section 4.2, and second,
confounding factors that drive both migration and voting patterns, discussed in Section 4.3. As
argued above, potential problems related to political self-selection and confounding factors should be
of particular importance for the destination choice of the first migrants who set the path for
subsequent migrants. However, they should be of less importance for the destination choice of the
bulk of the migrants who followed suit. Path dependency is also what makes us confident that
migration patterns in 2009 are very similar to those observed in 2004.
15
4.2 Political self-selection
Those who choose to migrate arguably differ in their electoral preferences from those who stay
behind. At the same time, migrants to the West may differ in their electoral preferences from
migrants to the East. To understand the implications of political self-selection, we distinguish
between selection at the level of individuals and communities.
At the level of individuals, political self-selection refers to the exit effect described by Hirschman. If
migrants are relatively less supportive of the Communist Party than the average voter in a
community, their departure will increase the Communist vote share in that community (as the local
electorate would lose opposition voters). The increase in Communist votes will be particularly strong
if liberal opinion leaders who affect electoral preferences of other community member leave the
country. The exit effect would hence drive the coefficients of westward and eastward migration
upwards because they will capture both political spillovers on those who stay behind and the exit of
opposition voters from the electorate. By contrast, if migrants are relatively more supportive of the
Communist Party than the average voter, their departure will decrease the Communist vote share and
drive the coefficients of westward and eastward migration downwards.
We cannot observe how migrants would have voted in the parliamentary election of July 2009 had
they not migrated. Depending on how migrants are politically self-selected, the coefficients therefore
provide a biased estimate of political spillovers.17
What do we know about the political self-selection of Moldovan migrants? First, emigration from
Moldova is typically motivated by economic, not political considerations (Luecke et al., 2007).
Second, migrants share the demographic profile of the typical opposition voter. The average migrant
is 35 years old, much younger than the average Communist voter (48 years) and close to the average
age of opposition voters (40 years). Moreover, more than 60 percent of migrants have completed
more than secondary education, compared to 65 percent among opposition voters and only 48
percent among Communist Party voters.18 Migrants to the West, who are younger and more
educated than the average migrant (Luecke et al., 2007), have a socioeconomic profile that makes
them particularly unlikely to support the Communists. Third, the share of Communist votes cast by
migrants at Moldova’s embassies abroad was only 12 percent in 2005, much lower than the overall
17 Gugushvili (2011) finds that individuals in the former Soviet republics of Armenia, Azerbaijan, and Georgia are more likely to move to Western Europe when they are dissatisfied with the democratic development of their home country.
18 Migrants’ demographic characteristics come from the 2008 Labor Force Survey. The demographic characteristics of Communist and opposition voters come from the official exit poll of the parliamentary election of July 2009.
16
Communist vote share of 46 percent.19 At least for westward migration, it is therefore reasonable to
conclude that the exit effect runs into the opposite direction of political spillovers from abroad. The
coefficient of westward migration should hence be considered a conservative estimate of political
spillovers.
At the community level, political self-selection of migrants is a more serious concern. It is possible
that individuals from more liberal-minded communities migrate to the West, while individuals from
more Communist-oriented communities migrate to the East. The migration coefficients would then
simply reflect reverse causality.
To address this problem, we exploit the fact that there was hardly any emigration before 1999. We
can control for the pre-migration electoral preferences of each community by using the results from
the parliamentary elections of 1994 and 1998, which were the first national elections after Moldova’s
independence in 1991. Both elections were widely regarded as free and fair (OSCE, 1998). The
parliamentary election of 1998 took place just a few months before the unexpected Russian financial
crisis hit Moldova and triggered the first wave of emigration. For each of the parliamentary elections
of 1994 and 1998, we control for the vote share of the four major parties.20 The share of Communist
votes in 1998 and 2009 is highly correlated (the correlation coefficient is 0.74). The large persistence
suggests that pre-migration electoral preferences are a meaningful measure of a community’s general
electoral preferences. We also include the voter turnout in 1998 as a proxy for the general interest in
politics (information on voter turnout in 1994 is not available at the community level). By
conditioning on pre-migration election results, we effectively analyze the change in Communist votes
between 1998 and 2009. Hence, we can rule out that time-constant electoral preferences explain the
relationship between migration and voting patterns.21
We find little evidence for political self-selection of migrants at the community level. In line with
Figure 1, Table A3 in the appendix shows that, conditional on observable community characteristics,
pre-migration electoral preferences are not systematically associated with the size and direction of
migrant flows at the community level. In particular, we do not find that communities with a higher
19 Similarly, in July 2009, the share of Communist votes among migrant votes was nine percent compared to an overall share of 45 percent. No data is available for the parliamentary election of 2001. Only few Moldovans residing abroad cast their vote. The results are therefore unlikely to be representative of the migrant population.
20 In both elections, more than 70 percent of the electorate cast their vote and the four major parties accounted for more than 75 percent of all votes. We should therefore capture the broad spectrum of pre-migration electoral preferences.
21 Note that in an econometric sense this is only true if we estimate our specification in first differences as we do in our robustness checks in Appendix 2. To capture more heterogeneity of initial political preferences, however, our main specification conditions not only on the share of Communist votes but also on the vote share of other parties.
17
pre-migration preference for democratic opposition parties have more migrants in the West and
those with a higher pre-migration preference for the Communist or Socialist Party more migrants in
the East.
One may also be concerned about political self-selection of migrants at the level of households, not
individuals or communities. However, the same arguments as above apply. First, if a member of a
liberal household leaves for the West and the remaining members continue voting for opposition
parties, the exit effect predicts an increase in the share of Communist votes in that community –
which would bias the coefficient of westward migration against political spillovers from abroad.
Second, by definition the election results of a community reflect the sum of electoral preferences of
households in that community. Controlling for pre-migration election results should therefore
capture all relevant pre-existing differences in electoral preferences within a community.
4.3 Confounding factors
The second main challenge for identification are confounding factors that drive both migration and
voting patterns. By looking at changes in Communist votes over time, we already eliminate any time-
constant confounders. Our discussion therefore focuses on the role of time-varying confounders.
We employ three strategies to deal with time-varying confounders. First, we use fixed effects for
Moldova’s 35 districts to eliminate any time-varying (and time-constant) heterogeneity at the district
level and exploit only variation within districts. Moldovan districts are very small. The average district
covers only 967 square kilometers (373 square miles) and is home to 26 communities. In addition,
Moldovan districts follow the same boundaries as the former regional administrative units of the
Moldavian Soviet Socialist Republic (raions). In Soviet times, raions were the basic territorial unit
around which economic life was organized. We expect many transformations that have occurred
after the collapse of the Soviet Union to affect communities within districts in a similar way. District-
level fixed effects should therefore capture potential confounding processes related to observed and
unobserved district characteristics. They should also account for geographical features such as
proximity of certain districts to the border with Romania and the Ukraine, which may be subject to
cross-border spillovers not related to migration.
Second, we control for a wide range of community characteristics. The idea behind this strategy is
that observationally similar communities are subject to similar shocks and respond to these shocks in
a similar way. In general, Moldovan communities are remarkably similar, particularly within the same
district. There is little variation in economic activity across communities and most areas focus on
18
agricultural production according to data from the Moldovan Ministry of Economy and Trade. The
main reason for this similarity is that Moldova is small (about the size of Maryland) and was planned
to be a rural economy with no industrial capacity during Soviet times. Moldova’s only industrial
activities are located in the breakaway region of Transnistria, which is not included in our sample.
That said, we try to control for as many dimensions of community heterogeneity as possible. We use
census data to control for population size, age structure, and the skill level and distribution of the
adult population.22 Most importantly, we also control for the main drivers of the destination choice
made by the first migrants after independence: access to ethnic networks and distance to the
Romanian border. Specifically, we use the population shares of the four most important ethnic
minorities (Ukrainians, Russians, Gagauz, and Bulgarians, with Moldovans being the reference
category) as well as the degree of ethnic fractionalization. As ethnic composition may have affected
the evolution of electoral preferences, too, we also include squared terms of the different ethnicities’
population shares.23 Distance to the Romanian border is measured by the distance to the nearest
Moldovan-Romanian border crossing that was open in 1998. We also include a dummy for district
capitals and a dummy for the capital Chisinau and the city of Balti. These two cities are the only
major cities and home to virtually all universities located in Moldova. As a proxy for remoteness, we
use community’s distance to the district capital, the economic and political center of a district.
Third, we control for community-specific economic shocks. Our concern is that differential intensity
of economic shocks could create spurious correlation between migration and voting patterns in a
context where migration is credit-constrained (McKenzie and Rapoport, 2007; Bryan et al., 2014).
For example, it could be that households in communities most hardly hit by the crisis could only
afford to send migrants to the East while at the same time asking for more redistribution through
voting for the Communist Party. In contrast, it is possible that households in communities with
lower-intensity shocks could afford to finance longer-range and in general more costly migration to
the West while at the same time opposing to more redistribution by voting against the communists.
In the absence of economic data at the community level for the 1990s and early 2000s, we rely on
satellite data on night-time light intensity. Light intensity as measured from outer space is a
22 All demographic data come from the population census in 2004. They are measured for the original overall population including migrants. Therefore, our demographic variables are representative and not affected by emigration. In theory, emigration may have affected enrolment of children in schools. In practice, however, emigration should not have had any meaningful effect on overall educational attainment in 2004 – just five years after migration took off in Moldova.
23 According to the census, language patterns closely follow ethnic patterns. By controlling for ethnicity, we therefore also control for knowledge of (foreign) languages. It should also be noted that most Moldovans can communicate in Russian.
19
meaningful proxy for local economic activity on the ground as almost all consumption and
production activities at night require lights (Henderson et al., 2012). Using high-resolution satellite
images from the Defense Meteorological Satellite Program’s Operational Linescan System, we
measure the average light intensity on the administrative territory of each community. We take this
measure for 1992, the first year for which satellite images are available, and 1999, the year following
the Russian financial crisis. The difference in light intensity between 1992 and 1999 proxies the
severity of a community’s economic shock caused by the economic transition after Moldova’s
independence in 1991 and the Russian financial crisis.
Figure A1 in the appendix shows the drastic changes in night-time light. In 1992, many parts of the
country were well-lit at night. By 1999, however, most Moldovan communities had become dark.
Over the same period, Moldova’s gross domestic product had fallen by 40 percent. Table A3 in the
appendix shows that the adverse economic shocks of the 1990s indeed pushed many Moldovans
abroad. Communities with a reduction in night-time light intensity between 1992 and 1999 had a
significantly higher prevalence of emigration in 2004. Importantly, however, economic shocks cannot
explain the direction of migration flows to the West or the East.24 Finally, Table A4 in the appendix
demonstrates that night-time light intensity is indeed a good proxy for economic activity at the
community level. Light intensity is a highly significant predictor of local per-capita tax revenues,
unemployment rates and the per-capita number of shops in 2009, a year for which economic
indicators at the community level are available.
5 Results
5.1 Migration patterns and electoral preferences
Table 1 summarizes the main results (for full regression results see Table A5 in the appendix). The
first three columns investigate the relationship between migration patterns and Communist votes in
the parliamentary election of July 2009. The columns gradually expand the set of control variables
and check the robustness of our results against potentially important confounders.
Column 1 controls for community heterogeneity in terms of size, location, as well as demographic
and ethnic composition. The results are suggestive of destination-specific political spillovers.
Communities with westward migration vote significantly less for the Communist Party. The
departure of one percent of the community population to the West is associated with a decrease in
24 We also find that communities that experienced a steeper economic decline during the 1990s were more likely to vote for the Communist Party in the parliamentary election of 2001 (results available upon request).
20
the share of Communist votes by about 0.7 percentage points. This result is remarkable as it implies
that the departure of a (presumably) largely non-Communist electorate to the West, which would
increase the share of Communist votes through the exit effect, is more than offset by political
spillovers from abroad. We find the opposite, but weaker association for emigration to the East. A
one-percentage point increase in the prevalence of eastward migration increases the share of
Communist votes by about 0.4 percentage points.25
Column 2 additionally controls for pre-migration election results. The results of the parliamentary
elections of the 1990s are an important predictor of election results in 2009. Yet, they barely affect
the size and significance of the coefficients of westward and eastward migration. This finding is
consistent with the previous finding that pre-migration election results cannot predict migration
patterns. Thus, political self-selection at the community level or a time-constant confounder in
general does not explain the association between migrants’ destinations and Communist votes.
Column 3 adds community-specific measures of economic shocks over the course of the 1990s as
measured by night-light intensity. This is our preferred specification and we continue to use it as the
baseline specification in the rest of the paper. If economic shocks during the 1990s shaped the
evolution of both migration and voting patterns, their inclusion in the model should affect the
migration coefficients. Both coefficients, however, remain stable reflecting the previous result that
light intensity is not associated with migrants’ destination choice. Hence, economic shocks are
unlikely to confound the effect of migration patterns on Communist votes.
As discussed above, the migration coefficients reflect the sum of the exit effect of migrants from the
electorate and political spillovers on those who stay behind. For westward migration, these two
effects likely go into opposite directions, making us underestimate the size of political spillovers from
the West. As we explain in detail in Appendix 2, we can bound the effect of political spillovers by
making assumptions on how migrants would have voted had they stayed in Moldova. If we assume
that all westward migrants would have been opposition voters, the emigration of one percent of a
community’s population to the West reduces the share of Communist votes among those who stay behind
by 1.11 percentage points. Even this estimate may still be biased downwards as we assume that
liberal-minded migrants would not have influenced the electoral preferences of other community
25 Our estimates of the relationship between migration patterns in 2004 and Communist votes in 2009 may be biased upwards as we attribute the effects to the migration prevalence in 2004, which was about 26 percent lower than in 2009. If we rescale the coefficients accordingly, the coefficient of westward migration is reduced to -0.52 and the coefficient of eastward migration to 0.33. However, the true bias is likely to be smaller because the magnitude of the marginal effect of emigration on Communist votes decreases with the level of emigration (see Section 6.2).
21
members before their departure. In the presence of such peer effects, however, the exit effect and
hence our underestimation of the size of political spillovers would be even larger. Our baseline
coefficient of westward migration should therefore be interpreted as a conservative estimate of the
political spillovers from westward migration. Appendix 2 presents detailed results on the potential
size of political spillovers for different assumptions on the voting behavior of westward and eastward
migrants.
If political spillovers operate through the transfer of information and norms, they should rise with
the level of democracy abroad even within the West. There is very little variation within the West in
the Polity IV score which we use to define Western and Eastern destinations. We therefore rely on
the Economist Intelligence Unit’s index of democracy that allows distinguishing between “full” and
“flawed” Western democracies (see Kekic, 2006, for details). Flawed Western democracies include
Italy, Romania, Israel, Cyprus, Bulgaria and Poland. As column 4 of Table 1 shows, the effect of
westward migration is driven by emigration to full, not flawed Western democracies. A one-
percentage point increase in emigration to full Western democracies reduces Communist votes by
about 1.3 percentage points. The equivalent marginal effect for emigration to flawed Western
democracies is -0.33 and not significant. Hence, even within the West, our evidence is consistent
with the transfer of democratic information and norms.
These results are important because they address potential concerns regarding the selection of
migrants. As Table A10 in the appendix shows, Moldovan migrants to the West tend to be more
educated, older and female and they remit higher amounts of money than migrants to the East.
However, there are hardly any differences in the characteristics between migrants to full and
migrants to flawed Western democracies. The distribution of skills, age and remittances is essentially
the same. In addition, the distribution of Moldovan migrants across sectors and occupations is very
similar within Western destinations (Biroul Naţional de Statistică, 2009). The only observable
difference is that relatively more women migrate to flawed democracies, which is due to the fact that
Italy is a particularly popular destination for women. Differences in migrant characteristics are
therefore unlikely to explain the heterogeneous effects within the West (as is also suggested by our
additional robustness check in Appendix 3 that controls for migrant characteristics).
The remaining columns of Table 1 show the relationship between migration patterns and vote shares
of the four opposition parties that jointly formed the ruling coalition after the elections. The Liberal
Democratic Party and the Liberal Party win votes in communities with westward migration. The
22
Liberal Party attracts considerably fewer votes in communities with eastward migration. Votes for
the other two parties are not significantly associated with migration patterns.
In Appendix 3, we perform a number of robustness checks. We show that our results are robust to
(i) the inclusion of additional control variables such as the demographic characteristics of migrants or
foreign language skills of the population, (ii) alternative econometric specifications such as estimation
in first differences (community fixed effects), and (iii) alternative definitions of the West. In Section
6.1, we also show that the results are mostly driven by emigration to the most advanced democracies.
5.2 Testing for time-varying unobserved confounders
A remaining challenge for causal interpretation is an unobserved time-varying confounder. Such a
confounder must work at the sub-district level as the district fixed effects already wipe out any
unobserved shock at the district level. In addition, the stability of the migration coefficients across
columns 1 to 3 of Table 1 implies that a confounder must be much more strongly associated with
migration and voting patterns in the 2000s than election results and economic shocks in the 1990s.
We assess this possibility in two tests.
Migration patterns and electoral preferences over time
The first test for time-varying unobserved heterogeneity investigates the relationship between
Communist votes and migration patterns over time. The first part of Table 2 examines the
relationship between migration patterns and Communist votes in all parliamentary elections since
2001. Of particular interest is the parliamentary election of 2001. It was the first parliamentary
election after the Russian financial crisis, which triggered the departure of the first migrants, and the
election that brought the Communist Party back to power. In 2001, the level of emigration was still
low (see Figure 1) and most of the migrants captured in the census in 2004 had not left yet. Hence, if
it is migration and not a confounder that drives our result, there should be no association between
Communist votes in 2001 and migration patterns in 2004.
Column 1 shows that migration patterns in 2004 are indeed not significantly associated with
Communist votes in 2001. In line with Figure 1, this finding strengthens the common trend
assumption of our identification strategy. It also suggests that the destination choice of the first
migrants, which laid the basis for the migration patterns in 2004, was not systematically related with
the evolution of electoral preferences in the aftermath of the Russian financial crisis.
Migration patterns are not significantly related to Communist votes in 2005 either (column 2),
although the level of emigration was already high. Two reasons may explain this result. First, the
23
intensity of communication between migrants and their families and friends in Moldova was still low
as suggested by the volume of international calls to Moldova (see Figure 1). Between 2005 and 2009,
however, the volume of international calls increased by more than three times. The fall in
communication costs during that period likely increased communication and information flows from
abroad. Second, the 2005 result does not necessarily indicate the absence of political spillovers. As
explained above, the migration coefficients reflect both the exit effect and destination-specific
political spillovers. For westward migration, these two effects arguably go into opposite directions.
Hence, political spillovers may well have been present in 2005 but not yet large enough to
overcompensate for the exit effect. Indeed, if one neutralizes the exit effect by assuming that all
westward migrants would have voted for the opposition parties (see Appendix 2 for details on the
methodology), the coefficient of westward migration becomes significantly negative and its
magnitude increases from -0.18 to -1.10.
Only in the more recent elections of 2009 and 2010 are migration patterns significantly associated
with voting behavior (columns 3-5). In line with our argument, this late divergence in trends
coincides with a steep increase in the volume of international calls between 2005 and 2009 (see
Figure 1). The coefficient (and marginal effect) of westward migration becomes larger over time,
rising from -0.40 in April 2009 to -0.85 in November 2010. This result is consistent with the
qualitative evidence presented above that migrants in the West increasingly raised their voice after
the disputed elections in April 2009, which marked the political deadlock between the Communist
Party and the opposition, and encouraged their families and friends in Moldova to vote for the more
democratic opposition parties. Similarly, the coefficient of eastward migration slightly increases from
0.27 in April 2009 to 0.39 in July 2009. However, it is no longer significantly different from zero in
November 2010. Thus, if there were political spillovers from eastward migration, they appear to be
weaker and instable.
The second part of Table 2 goes beyond parliamentary elections and looks at Communist votes in
local elections over the period 1999-2007. The municipal election of 1999 is particularly suitable to
test for the existence of a confounder as it took place in the immediate aftermath of the Russian
financial crisis, just when the first migrants left Moldova. The set of explanatory variables is the same
as in our baseline regression. However, as vote shares are not available, the dependent variable is a
dummy indicating whether a Communist mayor was elected. Results from a linear probability model
strongly suggest that there were no initial differences in electoral preferences between communities
with different subsequent migration patterns (column 6). The point estimates of both migration
24
coefficients are essentially zero. The same holds true for the municipal elections of 2003, supporting
our common trend assumption (column 7). It is only in the local elections of 2007, after the steep
increase in international communication, that communities with westward migration diverge and
become less likely to elect a Communist mayor (column 8). A one-percentage point increase in
emigration to the West decreases the probability of electing a Communist mayor by about two
percentage points. This result is important as we observe political spillovers of westward migration
already before the global financial crisis of 2008.
Overall, the findings reported in Table 2 further limit the range of potentially relevant confounders.
Any remaining confounder must have affected migration patterns well before 2004 and electoral
preferences only thereafter with a lag of several years.
Spatially concentrated time-varying confounders
The second test for time-varying unobserved heterogeneity builds on the idea that an unobserved
confounder would likely be spatially concentrated and affect neighboring communities in a similar
way. Indeed, spatial clustering has been observed for changes in political variables such as electoral
preferences (e.g., Kim et al., 2003) as well as for changes in economic variables such as
unemployment rates (e.g., Overman and Puga, 2002). Local fixed effects should at least partially
capture a spatially concentrated confounder and then reduce the size of the migration coefficients.
They should increasingly do so the smaller the geographical area they are based on. In the absence of
such a confounder, however, local fixed effects should not significantly affect the size of the
coefficients.
To test these implications, we introduce local fixed effects that are based on a geographical grid of
quadratic cells and much finer than the district-level fixed effects. We start with cells sized 30x30
kilometers (18.6x18.6 miles) and then reduce the cell size to 15x15 kilometers (9.3x9.3 miles). This
procedure increases the number of local fixed effects from 35 with district fixed effects to 52 using
30x30 kilometer cells and 162 using 15x15 kilometer cells. The average number of communities in
each cell is 16 using 30x30 kilometer cells and five using 15x15 kilometer cells. Figure A2 in the
appendix illustrates the different resolutions of the grid on a map of Moldovan districts. The finer
the grid, the more unobserved (time-varying and time-invariant) heterogeneity we expect to capture.
Compared to our baseline specification, the grid should make communities more comparable in
terms of (i) local labor markets and economic shocks, (ii) political movements and exposure to
political campaigns, (iii) access to and influence from social networks including early migrant
networks, (iv) exposure to weather fluctuations or natural disasters, and (v) local reception of
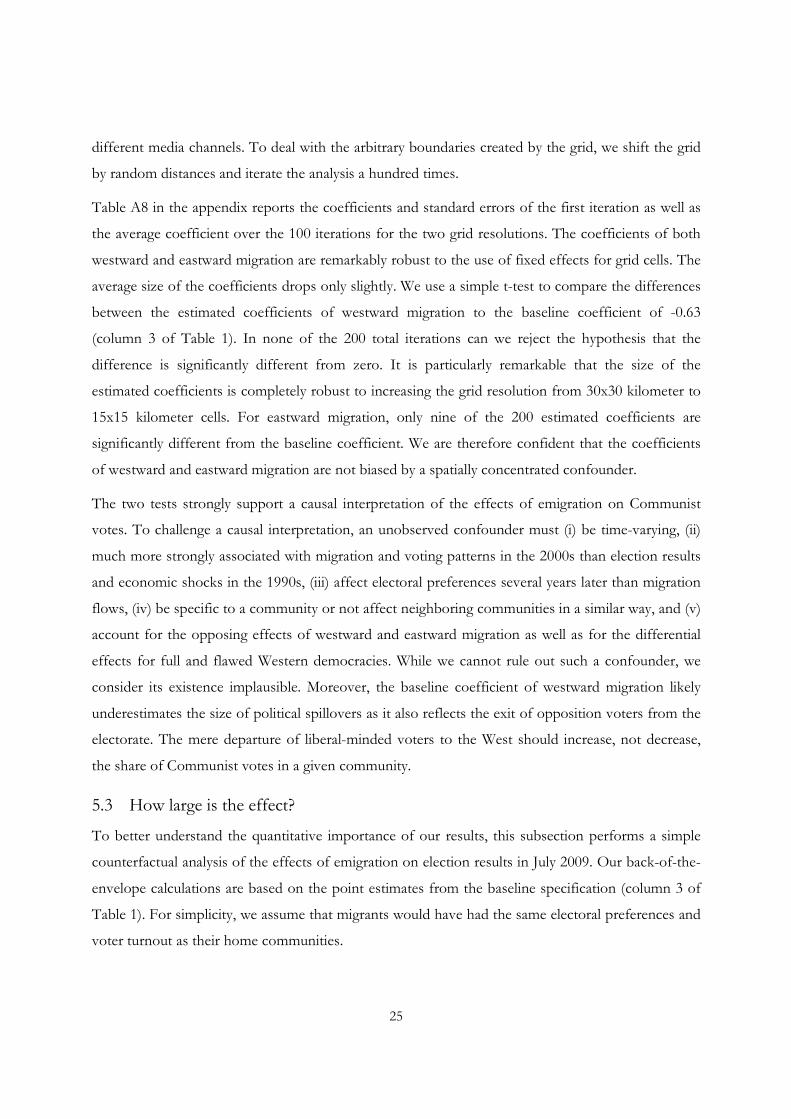
25
different media channels. To deal with the arbitrary boundaries created by the grid, we shift the grid
by random distances and iterate the analysis a hundred times.
Table A8 in the appendix reports the coefficients and standard errors of the first iteration as well as
the average coefficient over the 100 iterations for the two grid resolutions. The coefficients of both
westward and eastward migration are remarkably robust to the use of fixed effects for grid cells. The
average size of the coefficients drops only slightly. We use a simple t-test to compare the differences
between the estimated coefficients of westward migration to the baseline coefficient of -0.63
(column 3 of Table 1). In none of the 200 total iterations can we reject the hypothesis that the
difference is significantly different from zero. It is particularly remarkable that the size of the
estimated coefficients is completely robust to increasing the grid resolution from 30x30 kilometer to
15x15 kilometer cells. For eastward migration, only nine of the 200 estimated coefficients are
significantly different from the baseline coefficient. We are therefore confident that the coefficients
of westward and eastward migration are not biased by a spatially concentrated confounder.
The two tests strongly support a causal interpretation of the effects of emigration on Communist
votes. To challenge a causal interpretation, an unobserved confounder must (i) be time-varying, (ii)
much more strongly associated with migration and voting patterns in the 2000s than election results
and economic shocks in the 1990s, (iii) affect electoral preferences several years later than migration
flows, (iv) be specific to a community or not affect neighboring communities in a similar way, and (v)
account for the opposing effects of westward and eastward migration as well as for the differential
effects for full and flawed Western democracies. While we cannot rule out such a confounder, we
consider its existence implausible. Moreover, the baseline coefficient of westward migration likely
underestimates the size of political spillovers as it also reflects the exit of opposition voters from the
electorate. The mere departure of liberal-minded voters to the West should increase, not decrease,
the share of Communist votes in a given community.
5.3 How large is the effect?
To better understand the quantitative importance of our results, this subsection performs a simple
counterfactual analysis of the effects of emigration on election results in July 2009. Our back-of-the-
envelope calculations are based on the point estimates from the baseline specification (column 3 of
Table 1). For simplicity, we assume that migrants would have had the same electoral preferences and
voter turnout as their home communities.
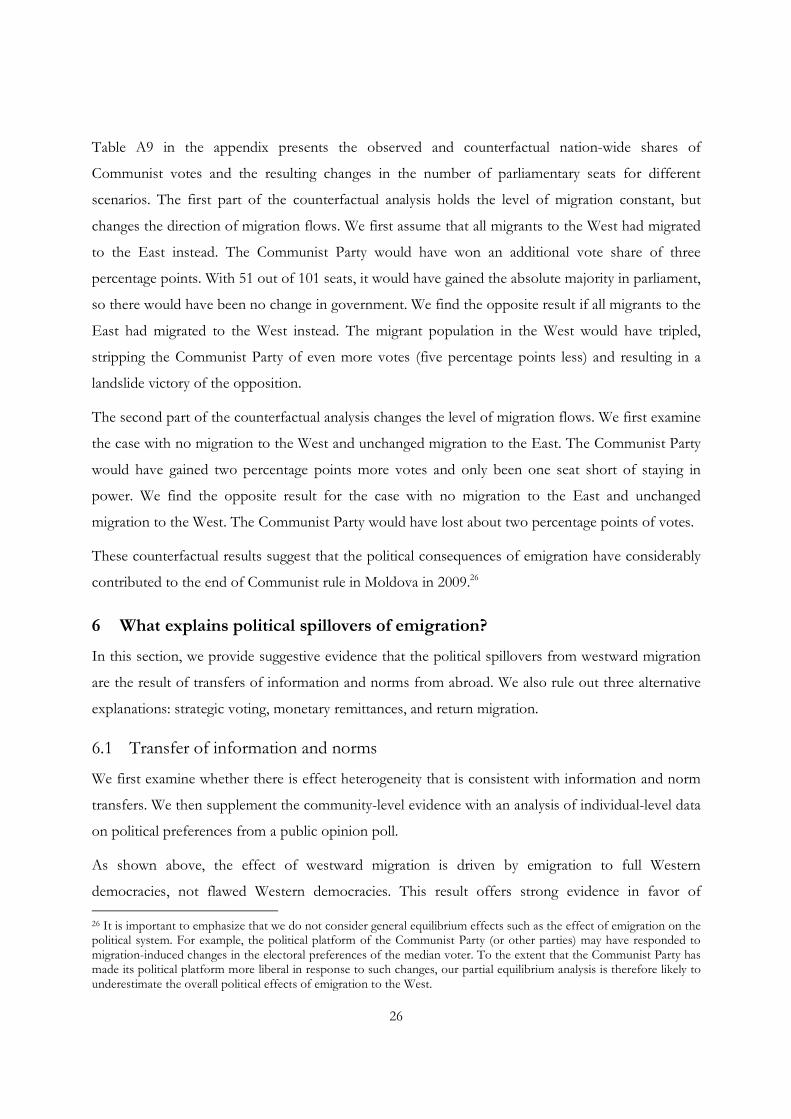
26
Table A9 in the appendix presents the observed and counterfactual nation-wide shares of
Communist votes and the resulting changes in the number of parliamentary seats for different
scenarios. The first part of the counterfactual analysis holds the level of migration constant, but
changes the direction of migration flows. We first assume that all migrants to the West had migrated
to the East instead. The Communist Party would have won an additional vote share of three
percentage points. With 51 out of 101 seats, it would have gained the absolute majority in parliament,
so there would have been no change in government. We find the opposite result if all migrants to the
East had migrated to the West instead. The migrant population in the West would have tripled,
stripping the Communist Party of even more votes (five percentage points less) and resulting in a
landslide victory of the opposition.
The second part of the counterfactual analysis changes the level of migration flows. We first examine
the case with no migration to the West and unchanged migration to the East. The Communist Party
would have gained two percentage points more votes and only been one seat short of staying in
power. We find the opposite result for the case with no migration to the East and unchanged
migration to the West. The Communist Party would have lost about two percentage points of votes.
These counterfactual results suggest that the political consequences of emigration have considerably
contributed to the end of Communist rule in Moldova in 2009.26
6 What explains political spillovers of emigration?
In this section, we provide suggestive evidence that the political spillovers from westward migration
are the result of transfers of information and norms from abroad. We also rule out three alternative
explanations: strategic voting, monetary remittances, and return migration.
6.1 Transfer of information and norms
We first examine whether there is effect heterogeneity that is consistent with information and norm
transfers. We then supplement the community-level evidence with an analysis of individual-level data
on political preferences from a public opinion poll.
As shown above, the effect of westward migration is driven by emigration to full Western
democracies, not flawed Western democracies. This result offers strong evidence in favor of 26 It is important to emphasize that we do not consider general equilibrium effects such as the effect of emigration on the political system. For example, the political platform of the Communist Party (or other parties) may have responded to migration-induced changes in the electoral preferences of the median voter. To the extent that the Communist Party has made its political platform more liberal in response to such changes, our partial equilibrium analysis is therefore likely to underestimate the overall political effects of emigration to the West.
27
information and norms transfers, as such transfers should increase with the level of democracy
abroad.
We also investigate other dimensions of effect heterogeneity. If political spillovers work through the
transfer of information and norms, they should be strongest in areas where information asymmetries
are large. We expect the spillover effects to be more pronounced in rural areas, which are typically
less exposed to external influences and media. Indeed, if we exclude the 45 urban localities from the
sample, the coefficient of westward migration increases to -0.73 (column 1 of Table 3). More
importantly, we expect information and norms from the West to be most relevant in communities in
which relatively more voters grew up in Soviet times and were exposed to Soviet propaganda.
Similarly, they should also be more relevant in communities with a lower average level of education.
We therefore split our sample at the median of the share of the population that was older than 21
years when the Soviet Union collapsed in 1991 and at the median of the share of the population with
higher education. The effect of westward migration on Communist votes is indeed larger in older
and less educated communities (columns 2-5 of Table 3).
As a more direct test for the transfer of information and norms, we analyze whether westward
migration also changes socio-political views, not only electoral preferences. We draw on data from
the Moldovan Political Barometer, a nationally representative public opinion poll that has been
conducted biannually since 2001. To exploit the time dimension, we pool all waves conducted before
the government changed in July 2009 that record the location of each interview. This leaves us with
eight waves, conducted between April 2002 and March 2009. These years span almost the entire
period during which the Communist Party was back in power. The sample includes 8,350 individuals
from 321 different communities. Our outcomes are based on five politics-related questions that have
been repeatedly asked over the years: whether an individual (i) is satisfied with life in general, (ii) has
trust in the government, (iii) has trust in local media, (iv) would like the state to play an increased role
to improve socio-economic conditions, and (v) would vote for the Communist Party should there be
elections next Sunday.
We estimate an individual’s views with a linear probability model controlling for sex, age, education,
and ethnicity as well as the same set of community-level variables including district-level fixed effects
as in the baseline specification. To capture the change in views over time and the steep increase in
the volume of calls from abroad after 2006, we introduce an interaction term between
westward/eastward migration and a dummy indicating whether an interview was conducted in the
period after 2006.
28
Table 4 shows that individuals from communities with different migration patterns change their
views in different ways after 2006. Relative to individuals from communities with eastward
migration, individuals from communities with westward migration become less satisfied with life, put
less trust in the government and local media, and are less in favor of state intervention. These effects
and the fact that they only become visible after the swell in international communication calls after
2006 are consistent with the argument that the transfer of information and norms changes the
reference point of those who stay behind and ultimately affects their political preferences. We also
reproduce our main result. Those who live in communities with westward migration are less likely to
vote Communist after 2006.
The results from the public opinion poll are important because they are based on a representative
sample of the adult population, not on a sample of active voters. This suggests that the relationship
between westward migration and voting patterns works through changes in electoral preferences and
not through changes in the incentives of individuals with given electoral preferences to cast their
vote. This conclusion can also be drawn from column 6 of Table 4 showing that individuals from
communities with westward migration do not change their propensity to vote over the years.27
6.2 Strategic voting
Political spillovers could also be the result of strategic voting. Irrespective of their political
convictions, voters may change their voting behavior to strategically support a party that is more
likely to protect their migrant relatives abroad and the flow of remittances. Communities with
migrants in the West may then vote for the Alliance of European Integration because these parties
are more likely to seek integration with Western Europe, possibly easing visa requirements and
lowering the costs of sending remittances. By contrast, communities with migrants in the East may
vote for the Communist Party to secure good relations between Moldova and Russia.
Our previous result on differential effects within the West provides strong evidence against strategic
voting. In case of strategic voting, communities with migrants in full Western democracies should
have the same electoral preferences as communities with migrants in flawed Western democracies.
This is especially so as there are hardly any differences in migrant characteristics within the West. In
27 We also investigate the relationship between voter turnout and migration patterns at the community level. Column 1 of Table A11 in the appendix regresses the voter turnout in the parliamentary elections of July 2009 on westward and eastward migration using our baseline specification. Both types of migration are associated with a significant reduction in voter turnout, reflecting the absence of migrants from the electorate. Migrants are typically not registered and therefore remain on voter lists. Column 2 shows that our main results are robust to controlling for voter turnout in the election of July 2009.
29
particular, the economic benefits derived from migration to the West do not differ as migrants to
flawed Western democracies send about the same amounts of remittances as migrants to full
Western democracies (see Table A10 in the appendix). Yet, and inconsistent with strategic voting,
only communities with migrants in full Western democracies vote significantly less for the
Communist Party. The previous results from the public opinion poll (Table 4) are not consistent
with strategic voting, either. They clearly indicate that westward migration is also associated with
changes in socio-political views, not only electoral preferences.
The curvature of the relationship between migration and voting patterns offers another way to test
for strategic voting. The desire to protect migrants should increase at least proportionally with the
level of migration and the resulting dependency on remittances flows. We test this prediction in
column 6 of Table 3 by adding squared terms of the prevalence of westward and eastward migration
to our baseline specification. However, the magnitude of the marginal effect of emigration on
Communist votes decreases with the level of emigration. Again, this result points to the transfer of
information and norms as relevant transmission channel: As more and more migrants leave for a
given destination, an additional migrant should be less likely to transfer new information and norms.
6.3 Monetary remittances
Monetary remittances represent another potential transmission channel. Remittances can affect
political preferences because they increase the disposable income of recipient households and also
change income inequality.
Our result on differential effects within the West is a strong argument against monetary remittances
as relevant transmission channel. Both the incidence of migration as measured by the socio-
economic characteristics of migrants and the level of remittances are very similar across Western
destinations (see Table A10 in the appendix). Monetary remittances from the West should thus have
no differential effects on income and income inequality, irrespective of whether they originate from
full or flawed Western democracies. Therefore monetary remittances cannot explain why political
spillovers are much stronger for emigration to full rather than flawed Western democracies.
Likewise, monetary remittances are unlikely to account for the differential effects of westward and
eastward migration. To explain our main result, remittances from the East should increase and
remittances from the West decrease support for the Communist Party. With respect to income, we
cannot think of a plausible reason why remittances should have a non-monotonic relationship with
Communist votes. Of course, there may be differences in consumption patterns and endowment
30
levels between households with a migrant in the East and households with a migrant in the West.
However, these differences cannot explain why remittance from the West would have the opposite
income effect than remittances from the East. With respect to income inequality, the Communists
should gain, not lose, votes in communities with westward migration. This is because Moldovan
migrants in Western Europe remit on average about 50 percent more money than migrants in Russia
(Luecke et al., 2007). Moreover, migrating to the West is costly, mainly due to visa restrictions, and
was therefore more widespread among initially richer households.28 As a result, remittances from the
West should have made relatively rich households richer, increasing income inequality and the
demand for redistribution by the majority of voters without a migrant abroad. The Communist Party,
which favors redistributive policies, should then have become more popular in communities with
westward migration – which is exactly the opposite of what political spillovers would predict.
6.4 Return migration
We finally consider return migration as potential transmission channel. To address this possibility, we
commissioned two questions in an exit poll of the parliamentary election of November 2010.
Individuals were asked whether they themselves had ever lived abroad for at least three months since
1991 and if so where, and whether family members had ever lived abroad and if so where. We are
thus able to distinguish between return migrants and non-migrants in the electorate.
The exit poll was conducted with 7,344 individuals in 71 communities.29 Due to time constraints the
exit poll only distinguished between destinations in the European Union, the Commonwealth of
Independent States (an association of former Soviet republics including Russia), and the rest of the
world. We classify the European Union as West and the two remaining regions as East.
We estimate an individual’s decision to vote for the Communist Party using a linear probability
model. Table 5 summarizes the results. Column 1 controls for an individual’s sex, age, education, and
ethnicity. Column 2 adds community fixed effects to capture unobserved heterogeneity between
communities.
Returnees from the West are seven percentage points less likely to vote for the Communist Party
than individuals who have not been abroad. Returnees from the East, however, do not vote
differently. The findings are almost identical for individuals with a family member abroad. 28 By contrast, eastward migration is cheap and accessible to poorer households as would-be migrants can relocate without a visa and only need to board a train to Russia (Luecke et al., 2007).
29 Respondents were asked to tick the party they had voted for in a private cabin and drop the questionnaire in a box. The results should therefore not be manipulated or biased because of revealed electoral preferences.
31
Individuals with a family member in the West are eight percentage points less likely to vote
Communist. The magnitude of this association is comparable to the association between higher
education and voting Communist. We find no significant association between having a family
member in the East and Communist votes.30
We also use the exit poll to look at the relationship between a community’s migration prevalence and
Communist votes for the sub-samples of (i) individuals with a family member in the West, (ii)
individuals with a family member in the East, and (iii) non-migrant individuals with no family
member abroad. If political spillovers from westward migration indeed operate through the transfer
of information and norms, community-level exposure to the West should be less informative for
individuals with family in the West (as they would receive this information directly from their
migrants) and more informative for individuals with family in the East or no family abroad. Indeed,
the community prevalence of westward migration is not significantly associated with Communist
votes for the former group (column 3), but negatively and significantly with the latter two groups
(columns 4 and 5).
These results provide suggestive evidence that the observed relationship between westward
migration and Communist votes is due to spillovers on those who stay behind and not the return of
migrants to the electorate.
7 Conclusion
The international circulation of knowledge and ideas is not restricted to the technological realm.
Rather, social norms and political preferences also diffuse internationally and such diffusion is
magnified by the cross-border movement of people. In a recent essay, Rodrik (2014) noted that
“perhaps the single most important source of ideas and policy innovation are practices that prevail
elsewhere” and used the concept of “emulation” to qualify the process of their international
diffusion. In Rodrik’s words, we would say that political remittances have a strong emulation
potential, especially in a globalized context with democratized access to communication and travel.
This paper, therefore, suggests that migrants can be an important vector of such emulation. Using
administrative and individual survey data from Moldova, a former Soviet Republic, we investigate the
effect of labor migration on political outcomes at home. For identification, we rely on destination-
specific effects and on the quasi-experimental context in which the episode of emigration we analyze
30 Likewise, our community-level analysis does not find a significant association between eastward migration and Communist votes in the parliamentary election of November 2010 (column 5 of Table 2).
32
took place. The main challenge for identification is that migrants’ destination choice, in particular the
choice made by the first migrants (who then form migrant networks generating chain migration)
could have been driven by political preferences or by a confounder that drives both migration and
voting patterns at the community level. Our results cannot be explained by individual self-selection
of migrants on political grounds (i.e., the fact that migrants with stronger preferences for democracy
opt for more democratic destinations). If anything, the exit effect should increase, not decrease, the
share of Communist votes in communities with significant emigration to the West. To address
political selection and a confounder at the community level, we control for pre-migration political
preferences and a large range of other community characteristics including the intensity of the
economic crisis that triggered emigration from Moldova (as measured by changes in levels of night-
time light intensity).
We document a significant and robust negative effect of emigration to the West on the share of
votes for the Communist Party in the Moldovan elections of 2009-10. Counterfactual simulations
suggest that emigration to the West significantly contributed to bringing down the last ruling
Communist government in Europe, twenty years after the fall of the Berlin wall. Finally, our results
are suggestive of a preferences transmission mechanism, as attested by the presence of democratic
spillovers to members of households without any migrant or by the fact that the effect of emigration
on electoral outcomes is stronger in older and less educated communities, where the potential for
new information to make a difference is presumably greater. Adding credence to this interpretation,
the results appear to be driven by emigration to the sub-set of European countries with the highest
democratic standards.
Obviously, there have been instances in recent history where emigration to Western democracies did
not bring a democratic dividend to the home countries, at least not yet. Decades of Cuban
immigration to the U.S. or of Iranian immigration to the West arguably did little to promote
democracy in Cuba or Iran. The factors that explain the democratic effects of emigration may have
to do with the extent to which migrants can retain close ties and freely communicate with their home
communities, as suggested in this paper, but also, possibly, with the cultural distance between home
and host countries, the degree of social integration of immigrants in the host societies, or with the
circumstances that led to emigration in the first place.
For all these reasons, the Moldovan experience described in this paper may not be representative of
the experiences of all developing countries witnessing emigration. However, Moldova is a typical
example of a newly founded state that is torn between two opposing political and economic systems,
33
Russia and the European Union, a choice also faced by other former Eastern Bloc countries such as
Belarus, Georgia, Serbia or Ukraine. History has seen many similar critical junctures that changed the
path of institutional development (e.g., Acemoglu and Robinson, 2012; Aidt and Franck, 2015). Our
results suggest that in a globalized world, migration may have become an increasingly important
factor affecting the economic and political trajectory of nations. In this sense – and to give Albert
Hirschman the last word – exit and voice could well be complementary in bringing political change
and jointly contribute to the global diffusion of democracy.
34
References
Acemoglu, D., J.A. Robinson (2012). Why Nations Fail: The Origins of Power, Prosperity, and Poverty, New York: Crown
Aghion, P., Y. Algan, P. Cahuc, A. Shleifer (2010). Regulation and Distrust, Quarterly Journal of Economics, 125(3), 1015-1049.
Aidt, T.S., R. Franck (2015): Democratization under the Threat of Revolution: Evidence from the Great Reform Act of 1832, Econometrica, 83(2), 505-547.
Alesina, A., P. Giuliano (forthcoming). Culture and Institutions, Journal of Economic Literature.
Alesina, A., N. Fuchs-Schuendeln (2007). Good-Bye Lenin (or Not?): The Effect of Communism on People's Preferences, American Economic Review, 97(4), 1507-1528.
Arambaşa, M.N. (2009). Bedeutung der grenzüberschreitenden Praktiken im moldauisch-rumänischen Grenzraum vor und nach dem EU-Beitritt Rumäniens. In: Heller, W., M.N. Arambaşa (eds.), Am östlichen Rand der Europäischen Union: Geopolitische, ethnische und nationale sowie ökonomische und soziale Probleme und ihre Folgen für die Grenzraumbevölkerung, Potsdam: Universitätsverlag Potsdam, 137-160.
Batista, A., P. Vicente (2011). Do Migrants Improve Governance at Home? Evidence from a Voting Experiment, World Bank Economic Review, 25(1), 77-104.
Beine, M., F. Docquier, M. Schiff (2013). International Migration, Transfer of Norms and Home Country Fertility, Canadian Journal of Economics, 46(4), 1406-1430.
Berry, J.W. (1997). Immigration, Acculturation, and Adaptation, International Journal of Applied Psychology, 46(1), 5-34.
Biroul Naţional de Statistică (2009). Migraţia Forţei de Muncă. Chisinau.
Burchardi, K.B., T.A. Hassan (2013). The Economic Impact of Social Ties: Evidence from German Reunification, Quarterly Journal of Economics, 128(3): 1219-1271.
Bryan, G., S. Chowdury, A.M. Mobarak (2014). Underinvestment in a Profitable Technology: The Case of Seasonal Migration in Bangladesh, Econometrica, 82(5): 1671-1748.
Cain, B., R. Kiewiet, C. Uhlaner (1991). The Acquisition of Partisanship by Latinos and Asian Americans, American Journal of Political Science, 35(2), 390-422.
Cameron, L., N. Erkal, L. Gangadharan, M. Zhang (2015). Cultural Integration: Experimental Evidence of Convergence in Immigrants’ Preferences, Journal of Economic Behavior and Organization, 111, 38-58.
Careja, R., P. Emmenegger (2012). Making Democratic Citizens: The Effects of Migration Experience on Political Attitudes in Central and Eastern Europe, Comparative Political Studies, 45(7), 875-902.
Chauvet, L., M. Mercier, (2014). Do Return Migrants Transfer Political Norms to their Origin Country? Evidence from Mali, Journal of Comparative Economics, 42(3), 630-651.
Clingingsmith, D., A.I. Khwaja, M. Kremer (2009). Estimating the Impact of the Hajj: Religion and Tolerance in Islam’s Global Gathering, Quarterly Journal of Economics, 124(3), 1133-1170.
Colomer, J.M. (2000). Exit, Voice, and Hostility in Cuba, International Migration Review, 34(2), 423-442.
35
Crowther, W.E. (2011). Second Decade, Second Chance? Parliament, Politics and Democratic Aspirations in Russia, Ukraine and Moldova, Journal of Legislative Studies, 17(2), 147-171.
DellaVigna, S., M. Gentzkow (2010). Persuasion: Empirical Evidence, Annual Review of Economics, 2(1), 643-669.
Docquier, F., E. Lodigiani, H. Rapoport, M. Schiff (2014). Emigration and Democracy, CEPREMAP Working Paper No. 1406.
Enikolopov, R., M. Petrova, E. Zhuravskaya (2011). Media and Political Persuasion: Evidence from Russia, American Economic Review, 107(2), 3253-3285.
European Comission (2012). Implementation of the European Neighbourhood Policy in the Republic of Moldova. Progress in 2011 and Recommendations for Action, http://ec.europa.eu/world/enp/docs/2012_enp_pack/progress_report_moldova_en.pdf.
Fargues, P. (2007). The Demographic Benefit of International Migration: a Hypothesis and its Application to Middle Eastern and North African Countries. In: Ozden, C., M. Schiff (eds.), International Migration, Economic Development and Policy, World Bank: Washington, DC.
Fuchs-Schündeln, N., M. Schündeln (2015). On the Endogeneity of Political Preferences: Evidence from Individual Experience with Democracy. Science, 347(6226), 1145-1148.
Görlich, D., C. Trebesch (2008). Seasonal Migration and Networks. Evidence on Moldova’s Labour Exodus, Review of World Economics (Weltwirtschaftliches Archiv), 144(1), 107-133.
Gould, D.M. (1994). Immigrant Links to the Home Country: Empirical Implications for U.S. Bilateral Trade Flows, Review of Economics and Statistics, 76(2), 302-316.
Gugushvili, A. (2011). Democratic Discontent and Emigration: Do Political Attitudes Explain Emigration Intentions? Mimeo, European University Institute.
Hansen, L.O. (1988). The Political and Socio-economic Context of Legal and Illegal Mexican Migration to the U.S. (1942-1984), International Migration, 26(1), 95-107.
Henderson, V., A. Storeygard, D. Weil (2012). Measuring Economic Growth from Outer Space, American Economic Review, 102(2), 994-1028.
Hirschman, A.O. (1970). Exit, Voice, and Loyalty: Responses to Decline in Firms, Organizations, and States. Cambridge, MA: Harvard University Press.
Hirschman, A.O. (1993). Exit, Voice, and the Fate of the German Democratic Republic: An Essay in Conceptual History, World Politics, 45(2), 173-202.
Hornung, E. (2014). Immigration and the Diffusion of Technology: The Huguenot Diaspora in Prussia, American Economic Review, 104(1), 84-122.
IDIS Viitorul (2009). Report on the Assessment of Public Perception regarding the Process of European Integration and Implementation of EUMAP – Republic of Moldova.
IJC (2009). An Assessment of the State of the Media in the Republic of Moldova. Independent Journalism Center. http://www.ijc.md/eng/index.php?option=com_content&task=view&id=245.
Kekic, L. (2006). The Economist Intelligence Unit’s Index of Democracy. The World in 2007. Economist Intelligence Unit.
Kerr, W.R. (2008). Ethnic Scientific Communities and International Technology Diffusion, Review of Economics and Statistics, 90(3), 518-537.
36
Kim, J., E. Elliott, D.M. Wange (2003). A Spatial Analysis of County-Level Outcomes in US Presidential Elections: 1988-2000, Electoral Studies, 22(4), 741-761.
Krause, A. (2000). Трудовая миграция населения Молдо-вы: состояние и перспективы, Moldoscopie, 13, 87-103.
Kubal, A. (2015). Legal Consciousness as a Form of Social Remittance? Studying Return Migrants’ Everyday Practices of Legality in Ukraine, Migration Studies, 3(1), 68-88.
Levitt, P. (1998). Social Remittances: Migration-driven Local-Level Forms of Cultural Diffusion, International Migration Review, 32(4), 926-948.
Luecke, M., T. Omar Mahmoud, P. Pinger (2007). Patterns and Trends of Migration and Remittances in Moldova – The CBSAXA Survey 2006, International Organization for Migration (IOM), Chisinau.
Luecke, M., T. Omar Mahmoud, A. Steinmayr (2009). Labour Migration and Remittances in Moldova: Is the Boom Over? – The IOM-CBSAXA Panel Household Survey 2006-2008, International Organization for Migration (IOM), Chisinau.
Marandici, I. (2010). The Factors Leading to the Electoral Success, Consolidation and Decline of the Moldovan Communists’ Party, paper presented at the Midwestern Political Science Association Meetings.
McKenzie, D., H. Rapoport (2010). Self-selection Patterns in Mexico-US Migration: The Role of Migration Networks, Review of Economics and Statistics, 92(4), 811-821.
Michalon, B. (2009). Mobilitätspraktiken und Strategien von Kleinhändlern im grenzüberschreitenden Verkehr an der rumänisch-moldawischen Grenze vor dem EU-Beitritt, In: Heller, W., M.N. Arambaşa, Am Östlichen Rand der Europäischen Union: Geopolitische, ethnische und nationale sowie ökonomische und soziale Probleme und ihre Folgen für die Grenzraumbevölkerung. Potsdam: Universitätsverlag Potsdam, 125-136.
Moser, P., A. Voena, F. Waldinger (2014). German Jewish Émigrés and U.S. Invention, American Economic Review, 104(10): 3222-55.
Moşneaga, V. (2009). Moldovan Population in the Context of Current Migration Processes, In: Madveev, D., Selari, G., Bobkova, E., B. Cseke, Moldova-Transdniestria: Working Together for a Prosperous Future, Cudrag Publishing House, 156-172.
Moşneaga, V., G. Mohammadifard, L. Corbu-Drumea, (2006). The Population of the Republic of Moldova in the Context of International Migration, Materials of the International Scientific Conference “Intercultural Dialogue” in Chisinau, 9-10 November 2005.
Mungiu-Pippidi, A., I. Munteanu (2009). Moldova’s “Twitter Revolution”, Journal of Democracy, 20(3), 136-142.
Munshi, K. (2003). Networks in the Modern Economy: Mexican Migrants in the U.S. Labor Market, Quarterly Journal of Economics, 118(2), 549-599
Open Society Foundations (2012). Mapping Digital Media: Moldova, http://
www.opensocietyfoundations.org/sites/default/files/mapping-digitalmedia-moldova-20120301.pdf.
Open Source Center (2008). Media Survey Report: Moldova, http://info.publicintelligence.net/OSC-MoldovaMedia.pdf.
OSCE (1998, 2001, 2005, 2009). Republic of Moldova: Parliamentary Elections, Final Report of the OSCE/ODIHR Election Observation Mission.
37
Overman, H., D. Puga (2002). Unemployment Clusters across European Regions and Countries, Economic Policy, 34(2), 115-147.
Parsons, C., P.L. Vezina (2014). Migrant Networks and Trade: The Vietnamese Boat People as a Natural Experiment, Department of Economics Discussion Paper No. 705, University of Oxford.
Pérez-Armendáriz, C., D. Crow (2010). Do Migrants Remit Democracy? International Migration, Political Beliefs, and Behavior in Mexico, Comparative Political Studies, 43(1), 119-148.
Pfutze, T. (2012). Does Migration Promote Democratization? Evidence from the Mexican Transition, Journal of Comparative Economics, 40(2), 159-175.
Quinlan, P.D. (2004). Back to the Future: An Overview of Moldova under Voronin, Demokratizatsiya: The Journal of Post-Soviet Democratization, 12(4), 485-504.
Radziwill, A., O. Scerbatchi, C. Zaman (1999). Financial Crisis in Moldova Causes and Consequences, CASE Network Studies and Analyses No. 192.
Rauch, J.E., V. Trindade (2002): Ethnic Chinese Networks in International Trade, Review of Economics and Statistics, 84(1): 116-30.
Rodrik, D. (2014). When Ideas Trump Interests: Preferences, World Views, and Policy Innovations, Journal of Economic Perspectives, 28(1), 189-208.
Sandu, D., et al. (2006). Living Abroad on a Temporary Basis. The Economic Migration of Romanians: 1990-2006, Bucharest: Open Society Foundations.
Spilimbergo, A. (2009). Democracy and Foreign Education, American Economic Review, 99(1), 528-543.
Spolaore, E., R. Wacziarg (2013). How Deep Are the Roots of Economic Development?, Journal of Economic Literature, 51(2), 1-45.
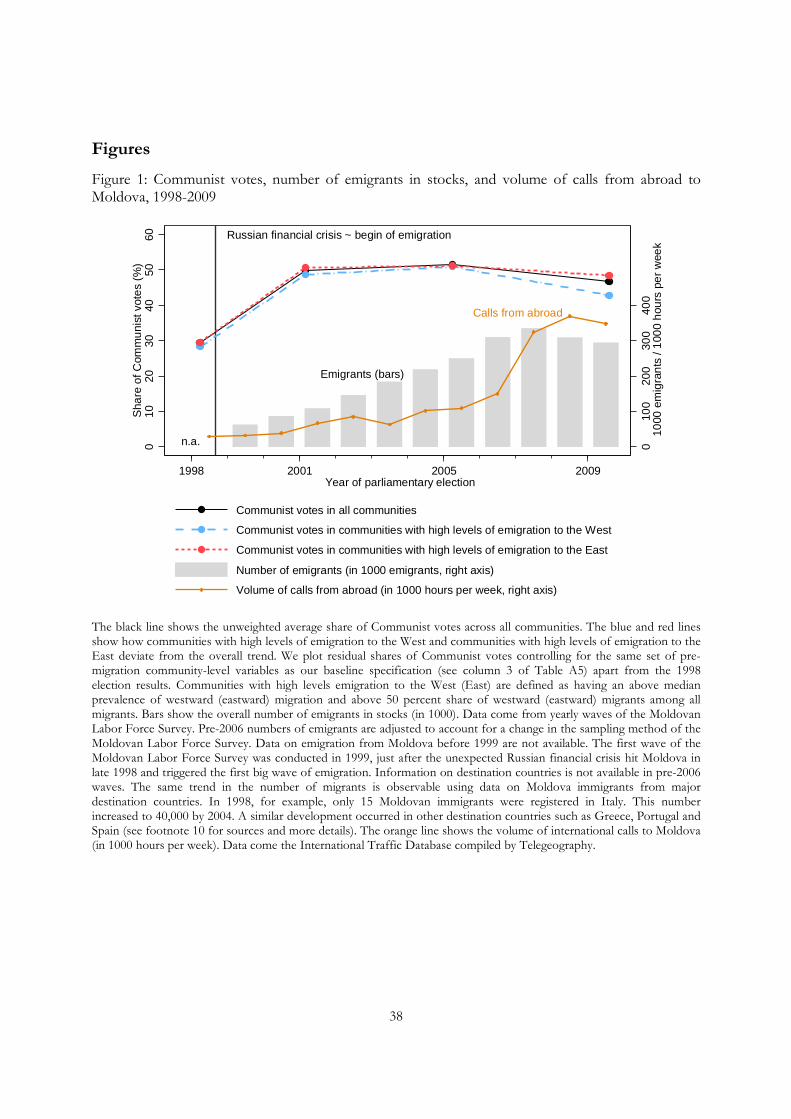
38
Figures
Figure 1: Communist votes, number of emigrants in stocks, and volume of calls from abroad to Moldova, 1998-2009
The black line shows the unweighted average share of Communist votes across all communities. The blue and red lines show how communities with high levels of emigration to the West and communities with high levels of emigration to the East deviate from the overall trend. We plot residual shares of Communist votes controlling for the same set of pre-migration community-level variables as our baseline specification (see column 3 of Table A5) apart from the 1998 election results. Communities with high levels emigration to the West (East) are defined as having an above median prevalence of westward (eastward) migration and above 50 percent share of westward (eastward) migrants among all migrants. Bars show the overall number of emigrants in stocks (in 1000). Data come from yearly waves of the Moldovan Labor Force Survey. Pre-2006 numbers of emigrants are adjusted to account for a change in the sampling method of the Moldovan Labor Force Survey. Data on emigration from Moldova before 1999 are not available. The first wave of the Moldovan Labor Force Survey was conducted in 1999, just after the unexpected Russian financial crisis hit Moldova in late 1998 and triggered the first big wave of emigration. Information on destination countries is not available in pre-2006 waves. The same trend in the number of migrants is observable using data on Moldova immigrants from major destination countries. In 1998, for example, only 15 Moldovan immigrants were registered in Italy. This number increased to 40,000 by 2004. A similar development occurred in other destination countries such as Greece, Portugal and Spain (see footnote 10 for sources and more details). The orange line shows the volume of international calls to Moldova (in 1000 hours per week). Data come the International Traffic Database compiled by Telegeography.
Russian financial crisis ~ begin of emigration
n.a.
Emigrants (bars)
Calls from abroad
010
020
030
040
010
00 e
mig
ran
ts /
100
0 h
ours
pe
r w
eek
010
2030
4050
60S
hare
of C
omm
uni
st v
ote
s (%
)
1998 2001 2005 2009Year of parliamentary election
Communist votes in all communities
Communist votes in communities with high levels of emigration to the West
Communist votes in communities with high levels of emigration to the East
Number of emigrants (in 1000 emigrants, right axis)
Volume of calls from abroad (in 1000 hours per week, right axis)
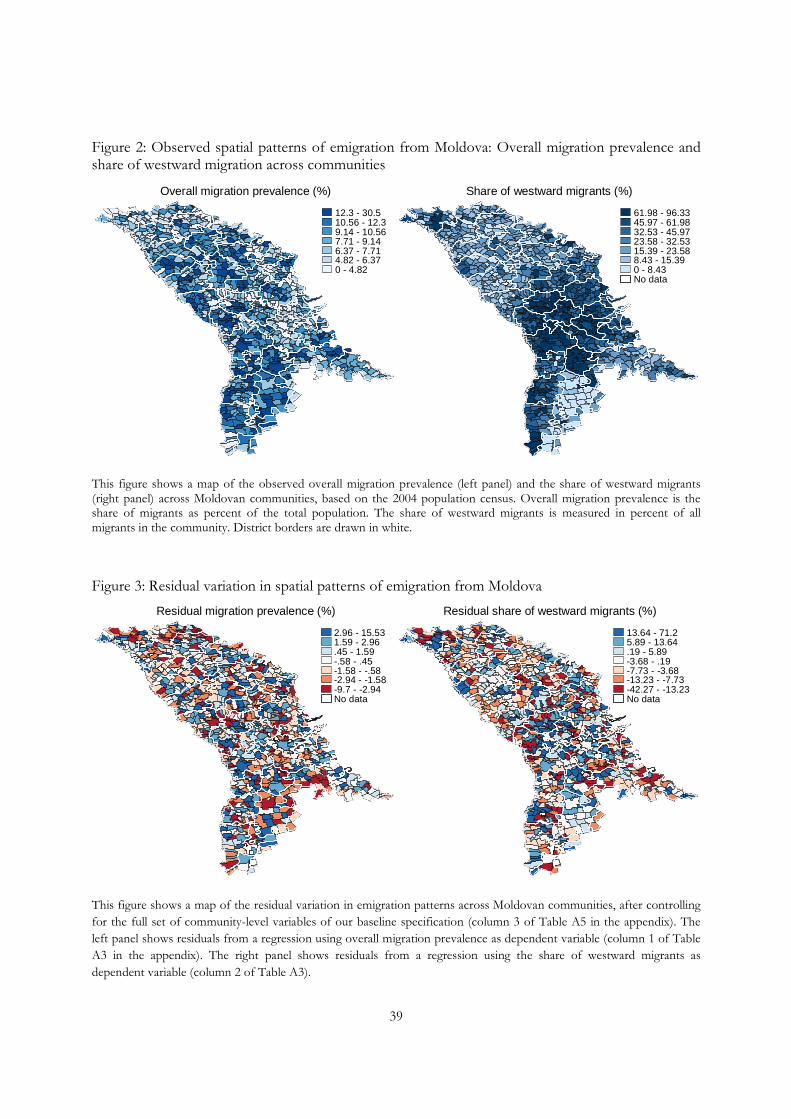
39
Figure 2: Observed spatial patterns of emigration from Moldova: Overall migration prevalence and share of westward migration across communities
This figure shows a map of the observed overall migration prevalence (left panel) and the share of westward migrants (right panel) across Moldovan communities, based on the 2004 population census. Overall migration prevalence is the share of migrants as percent of the total population. The share of westward migrants is measured in percent of all migrants in the community. District borders are drawn in white.
Figure 3: Residual variation in spatial patterns of emigration from Moldova
This figure shows a map of the residual variation in emigration patterns across Moldovan communities, after controlling for the full set of community-level variables of our baseline specification (column 3 of Table A5 in the appendix). The left panel shows residuals from a regression using overall migration prevalence as dependent variable (column 1 of Table A3 in the appendix). The right panel shows residuals from a regression using the share of westward migrants as dependent variable (column 2 of Table A3).
12.3 - 30.510.56 - 12.39.14 - 10.567.71 - 9.146.37 - 7.714.82 - 6.370 - 4.82
Overall migration prevalence (%)
61.98 - 96.3345.97 - 61.9832.53 - 45.9723.58 - 32.5315.39 - 23.588.43 - 15.390 - 8.43No data
Share of westward migrants (%)
2.96 - 15.531.59 - 2.96.45 - 1.59-.58 - .45-1.58 - -.58-2.94 - -1.58-9.7 - -2.94No data
Residual migration prevalence (%)
13.64 - 71.25.89 - 13.64.19 - 5.89-3.68 - .19-7.73 - -3.68-13.23 - -7.73-42.27 - -13.23No data
Residual share of westward migrants (%)
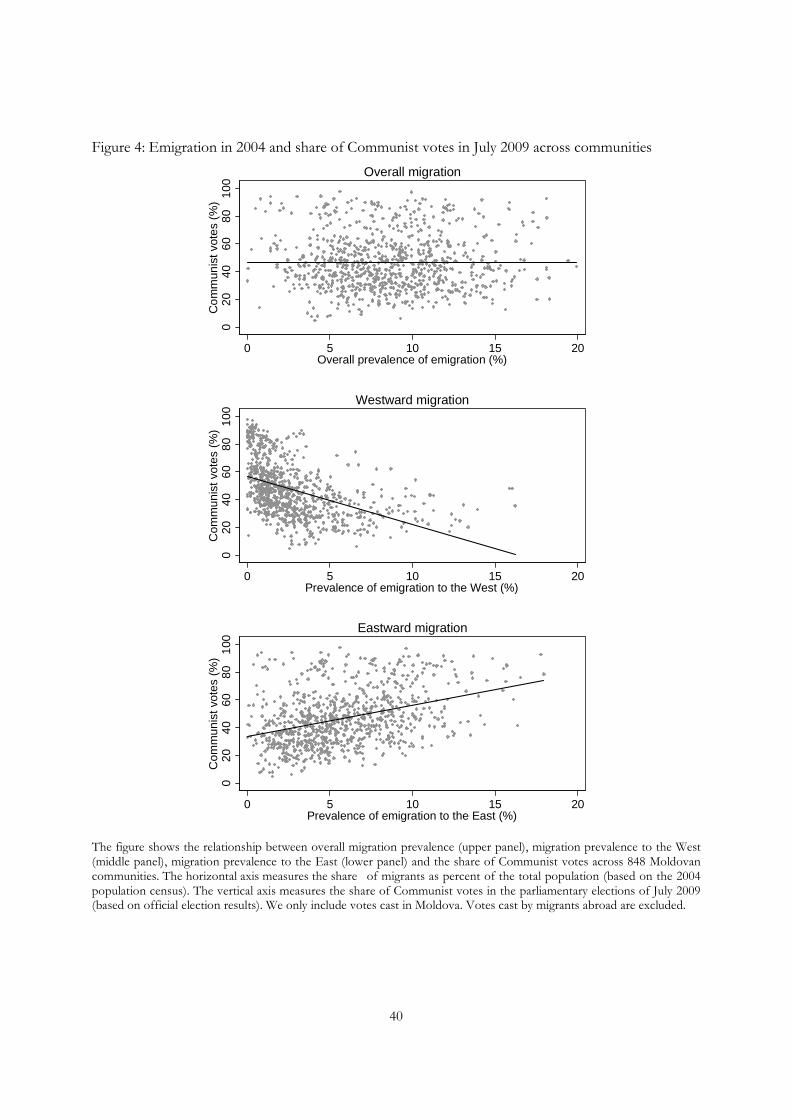
40
Figure 4: Emigration in 2004 and share of Communist votes in July 2009 across communities
The figure shows the relationship between overall migration prevalence (upper panel), migration prevalence to the West (middle panel), migration prevalence to the East (lower panel) and the share of Communist votes across 848 Moldovan communities. The horizontal axis measures the share of migrants as percent of the total population (based on the 2004 population census). The vertical axis measures the share of Communist votes in the parliamentary elections of July 2009 (based on official election results). We only include votes cast in Moldova. Votes cast by migrants abroad are excluded.
020
4060
8010
0C
omm
unis
t vot
es (
%)
0 5 10 15 20Overall prevalence of emigration (%)
Overall migration
020
4060
8010
0C
omm
unis
t vot
es (
%)
0 5 10 15 20Prevalence of emigration to the West (%)
Westward migration
020
4060
8010
0C
omm
unis
t vot
es (
%)
0 5 10 15 20Prevalence of emigration to the East (%)
Eastward migration
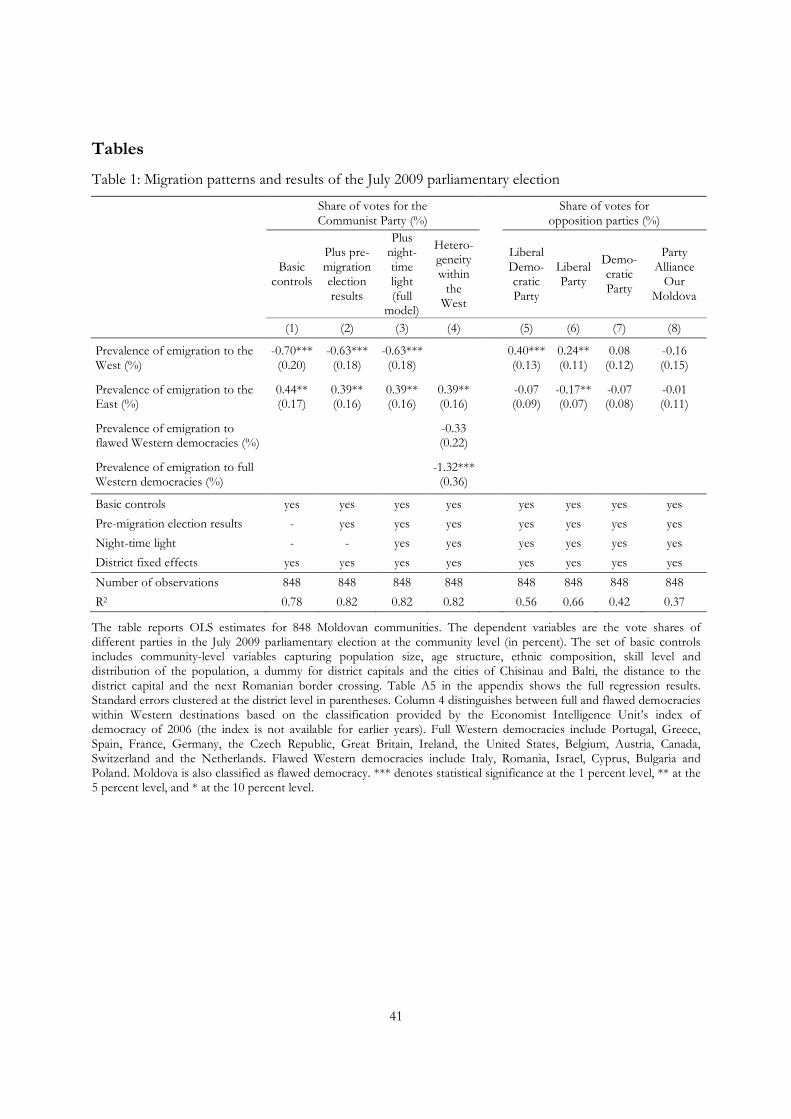
41
Tables
Table 1: Migration patterns and results of the July 2009 parliamentary election
Share of votes for the Communist Party (%)
Share of votes for
opposition parties (%)
Basic controls
Plus pre-migration election results
Plus night-time light (full
model)
Hetero-geneity within
the West
Liberal Demo-cratic Party
Liberal Party
Demo-cratic Party
Party Alliance
Our Moldova
(1) (2) (3) (4) (5) (6) (7) (8)
Prevalence of emigration to the West (%)
-0.70*** -0.63*** -0.63*** 0.40*** 0.24** 0.08 -0.16 (0.20) (0.18) (0.18) (0.13) (0.11) (0.12) (0.15)
Prevalence of emigration to the East (%)
0.44** 0.39** 0.39** 0.39** -0.07 -0.17** -0.07 -0.01 (0.17) (0.16) (0.16) (0.16) (0.09) (0.07) (0.08) (0.11)
Prevalence of emigration to flawed Western democracies (%)
-0.33 (0.22)
Prevalence of emigration to full Western democracies (%)
-1.32*** (0.36)
Basic controls yes yes yes yes yes yes yes yes
Pre-migration election results - yes yes yes yes yes yes yes
Night-time light - - yes yes yes yes yes yes
District fixed effects yes yes yes yes yes yes yes yes
Number of observations 848 848 848 848 848 848 848 848
R2 0.78 0.82 0.82 0.82 0.56 0.66 0.42 0.37
The table reports OLS estimates for 848 Moldovan communities. The dependent variables are the vote shares of different parties in the July 2009 parliamentary election at the community level (in percent). The set of basic controls includes community-level variables capturing population size, age structure, ethnic composition, skill level and distribution of the population, a dummy for district capitals and the cities of Chisinau and Balti, the distance to the district capital and the next Romanian border crossing. Table A5 in the appendix shows the full regression results. Standard errors clustered at the district level in parentheses. Column 4 distinguishes between full and flawed democracies within Western destinations based on the classification provided by the Economist Intelligence Unit’s index of democracy of 2006 (the index is not available for earlier years). Full Western democracies include Portugal, Greece, Spain, France, Germany, the Czech Republic, Great Britain, Ireland, the United States, Belgium, Austria, Canada, Switzerland and the Netherlands. Flawed Western democracies include Italy, Romania, Israel, Cyprus, Bulgaria and Poland. Moldova is also classified as flawed democracy. *** denotes statistical significance at the 1 percent level, ** at the 5 percent level, and * at the 10 percent level.
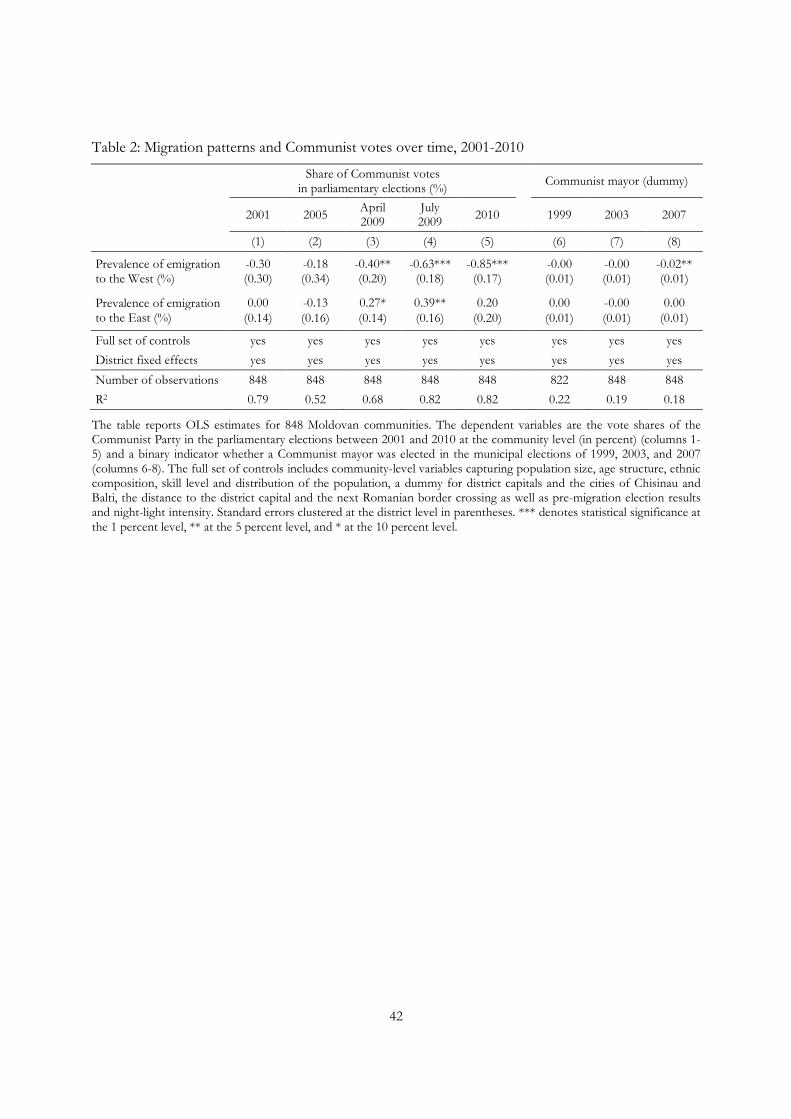
42
Table 2: Migration patterns and Communist votes over time, 2001-2010
Share of Communist votes in parliamentary elections (%)
Communist mayor (dummy)
2001 2005 April 2009
July 2009 2010
1999 2003 2007
(1) (2) (3) (4) (5) (6) (7) (8)
Prevalence of emigration to the West (%)
-0.30 -0.18 -0.40** -0.63*** -0.85*** -0.00 -0.00 -0.02** (0.30) (0.34) (0.20) (0.18) (0.17) (0.01) (0.01) (0.01)
Prevalence of emigration to the East (%)
0.00 -0.13 0.27* 0.39** 0.20 0.00 -0.00 0.00 (0.14) (0.16) (0.14) (0.16) (0.20) (0.01) (0.01) (0.01)
Full set of controls yes yes yes yes yes yes yes yes
District fixed effects yes yes yes yes yes yes yes yes
Number of observations 848 848 848 848 848 822 848 848
R2 0.79 0.52 0.68 0.82 0.82 0.22 0.19 0.18
The table reports OLS estimates for 848 Moldovan communities. The dependent variables are the vote shares of the Communist Party in the parliamentary elections between 2001 and 2010 at the community level (in percent) (columns 1-5) and a binary indicator whether a Communist mayor was elected in the municipal elections of 1999, 2003, and 2007 (columns 6-8). The full set of controls includes community-level variables capturing population size, age structure, ethnic composition, skill level and distribution of the population, a dummy for district capitals and the cities of Chisinau and Balti, the distance to the district capital and the next Romanian border crossing as well as pre-migration election results and night-light intensity. Standard errors clustered at the district level in parentheses. *** denotes statistical significance at the 1 percent level, ** at the 5 percent level, and * at the 10 percent level.
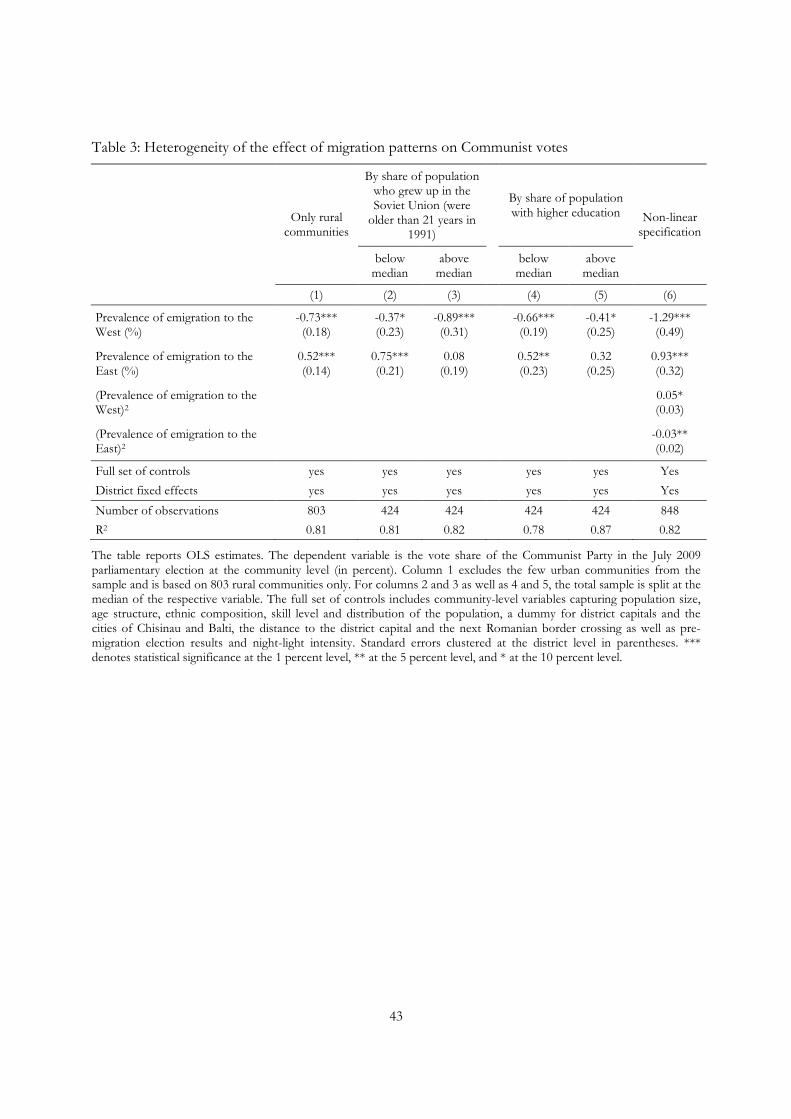
43
Table 3: Heterogeneity of the effect of migration patterns on Communist votes
Only rural
communities
By share of population who grew up in the Soviet Union (were
older than 21 years in 1991)
By share of population with higher education Non-linear
specification
below
median above
median
below median
above median
(1) (2) (3) (4) (5) (6)
Prevalence of emigration to the West (%)
-0.73*** -0.37* -0.89*** -0.66*** -0.41* -1.29*** (0.18) (0.23) (0.31) (0.19) (0.25) (0.49)
Prevalence of emigration to the East (%)
0.52*** 0.75*** 0.08 0.52** 0.32 0.93*** (0.14) (0.21) (0.19) (0.23) (0.25) (0.32)
(Prevalence of emigration to the West)2
0.05* (0.03)
(Prevalence of emigration to the East)2
-0.03** (0.02)
Full set of controls yes yes yes yes yes Yes
District fixed effects yes yes yes yes yes Yes
Number of observations 803 424 424 424 424 848
R2 0.81 0.81 0.82 0.78 0.87 0.82
The table reports OLS estimates. The dependent variable is the vote share of the Communist Party in the July 2009 parliamentary election at the community level (in percent). Column 1 excludes the few urban communities from the sample and is based on 803 rural communities only. For columns 2 and 3 as well as 4 and 5, the total sample is split at the median of the respective variable. The full set of controls includes community-level variables capturing population size, age structure, ethnic composition, skill level and distribution of the population, a dummy for district capitals and the cities of Chisinau and Balti, the distance to the district capital and the next Romanian border crossing as well as pre-migration election results and night-light intensity. Standard errors clustered at the district level in parentheses. *** denotes statistical significance at the 1 percent level, ** at the 5 percent level, and * at the 10 percent level.
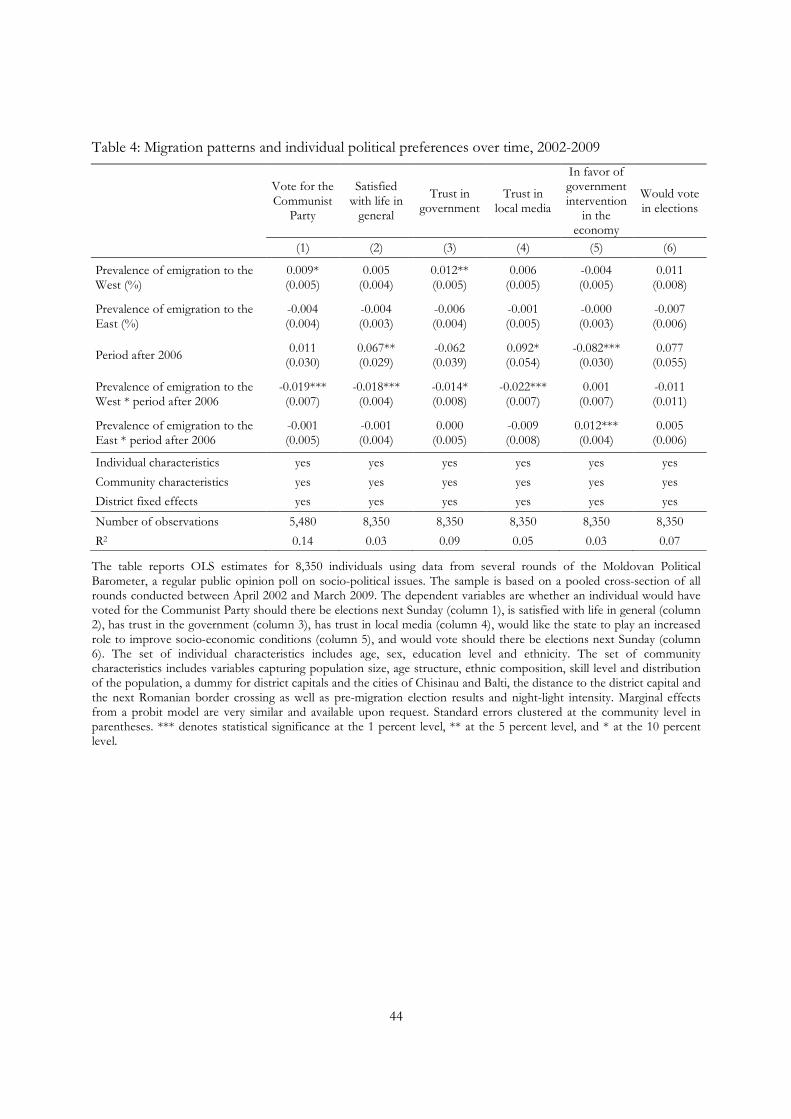
44
Table 4: Migration patterns and individual political preferences over time, 2002-2009
Vote for the Communist
Party
Satisfied with life in
general
Trust in government
Trust in local media
In favor of government intervention
in the economy
Would vote in elections
(1) (2) (3) (4) (5) (6)
Prevalence of emigration to the West (%)
0.009* 0.005 0.012** 0.006 -0.004 0.011 (0.005) (0.004) (0.005) (0.005) (0.005) (0.008)
Prevalence of emigration to the East (%)
-0.004 -0.004 -0.006 -0.001 -0.000 -0.007 (0.004) (0.003) (0.004) (0.005) (0.003) (0.006)
Period after 2006 0.011 0.067** -0.062 0.092* -0.082*** 0.077 (0.030) (0.029) (0.039) (0.054) (0.030) (0.055)
Prevalence of emigration to the West * period after 2006
-0.019*** -0.018*** -0.014* -0.022*** 0.001 -0.011 (0.007) (0.004) (0.008) (0.007) (0.007) (0.011)
Prevalence of emigration to the East * period after 2006
-0.001 -0.001 0.000 -0.009 0.012*** 0.005 (0.005) (0.004) (0.005) (0.008) (0.004) (0.006)
Individual characteristics yes yes yes yes yes yes
Community characteristics yes yes yes yes yes yes
District fixed effects yes yes yes yes yes yes
Number of observations 5,480 8,350 8,350 8,350 8,350 8,350
R2 0.14 0.03 0.09 0.05 0.03 0.07
The table reports OLS estimates for 8,350 individuals using data from several rounds of the Moldovan Political Barometer, a regular public opinion poll on socio-political issues. The sample is based on a pooled cross-section of all rounds conducted between April 2002 and March 2009. The dependent variables are whether an individual would have voted for the Communist Party should there be elections next Sunday (column 1), is satisfied with life in general (column 2), has trust in the government (column 3), has trust in local media (column 4), would like the state to play an increased role to improve socio-economic conditions (column 5), and would vote should there be elections next Sunday (column 6). The set of individual characteristics includes age, sex, education level and ethnicity. The set of community characteristics includes variables capturing population size, age structure, ethnic composition, skill level and distribution of the population, a dummy for district capitals and the cities of Chisinau and Balti, the distance to the district capital and the next Romanian border crossing as well as pre-migration election results and night-light intensity. Marginal effects from a probit model are very similar and available upon request. Standard errors clustered at the community level in parentheses. *** denotes statistical significance at the 1 percent level, ** at the 5 percent level, and * at the 10 percent level.
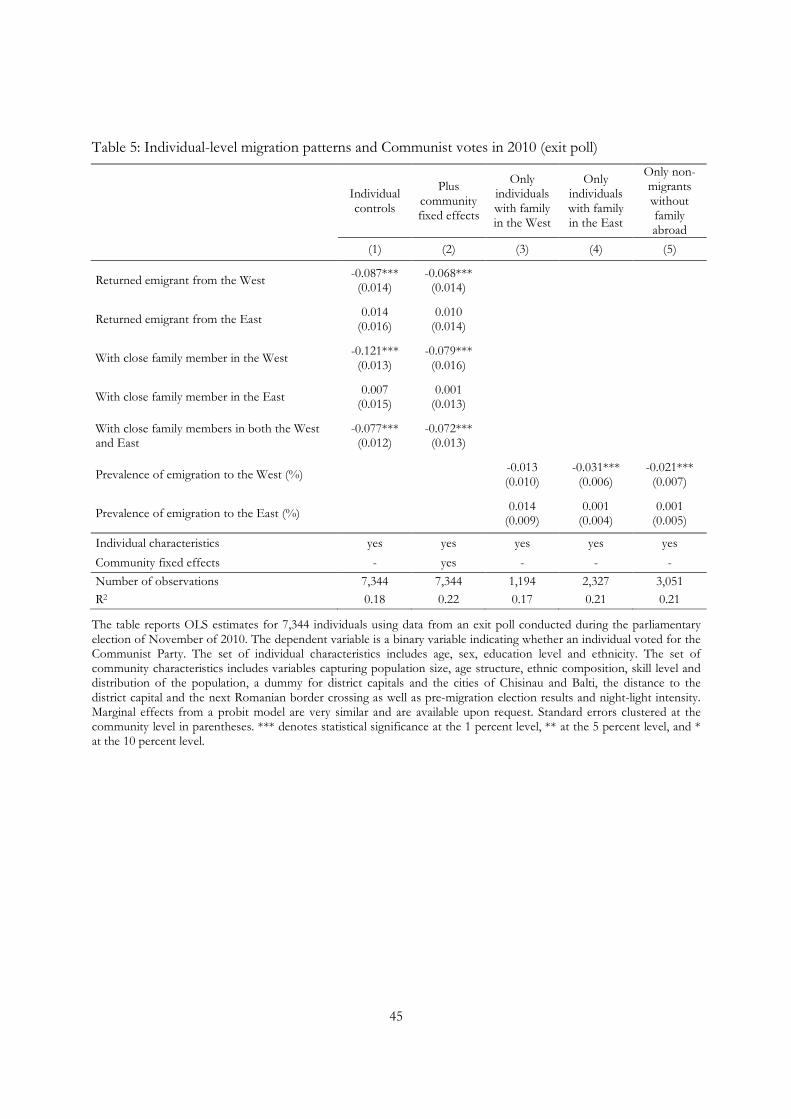
45
Table 5: Individual-level migration patterns and Communist votes in 2010 (exit poll)
Individual controls
Plus community fixed effects
Only individuals with family in the West
Only individuals with family in the East
Only non-migrants without family abroad
(1) (2) (3) (4) (5)
Returned emigrant from the West -0.087*** -0.068*** (0.014) (0.014)
Returned emigrant from the East 0.014 0.010 (0.016) (0.014)
With close family member in the West -0.121*** -0.079*** (0.013) (0.016)
With close family member in the East 0.007 0.001 (0.015) (0.013)
With close family members in both the West and East
-0.077*** -0.072*** (0.012) (0.013)
Prevalence of emigration to the West (%) -0.013 -0.031*** -0.021*** (0.010) (0.006) (0.007)
Prevalence of emigration to the East (%) 0.014 0.001 0.001 (0.009) (0.004) (0.005)
Individual characteristics yes yes yes yes yes
Community fixed effects - yes - - -
Number of observations 7,344 7,344 1,194 2,327 3,051 R2 0.18 0.22 0.17 0.21 0.21
The table reports OLS estimates for 7,344 individuals using data from an exit poll conducted during the parliamentary election of November of 2010. The dependent variable is a binary variable indicating whether an individual voted for the Communist Party. The set of individual characteristics includes age, sex, education level and ethnicity. The set of community characteristics includes variables capturing population size, age structure, ethnic composition, skill level and distribution of the population, a dummy for district capitals and the cities of Chisinau and Balti, the distance to the district capital and the next Romanian border crossing as well as pre-migration election results and night-light intensity. Marginal effects from a probit model are very similar and are available upon request. Standard errors clustered at the community level in parentheses. *** denotes statistical significance at the 1 percent level, ** at the 5 percent level, and * at the 10 percent level.
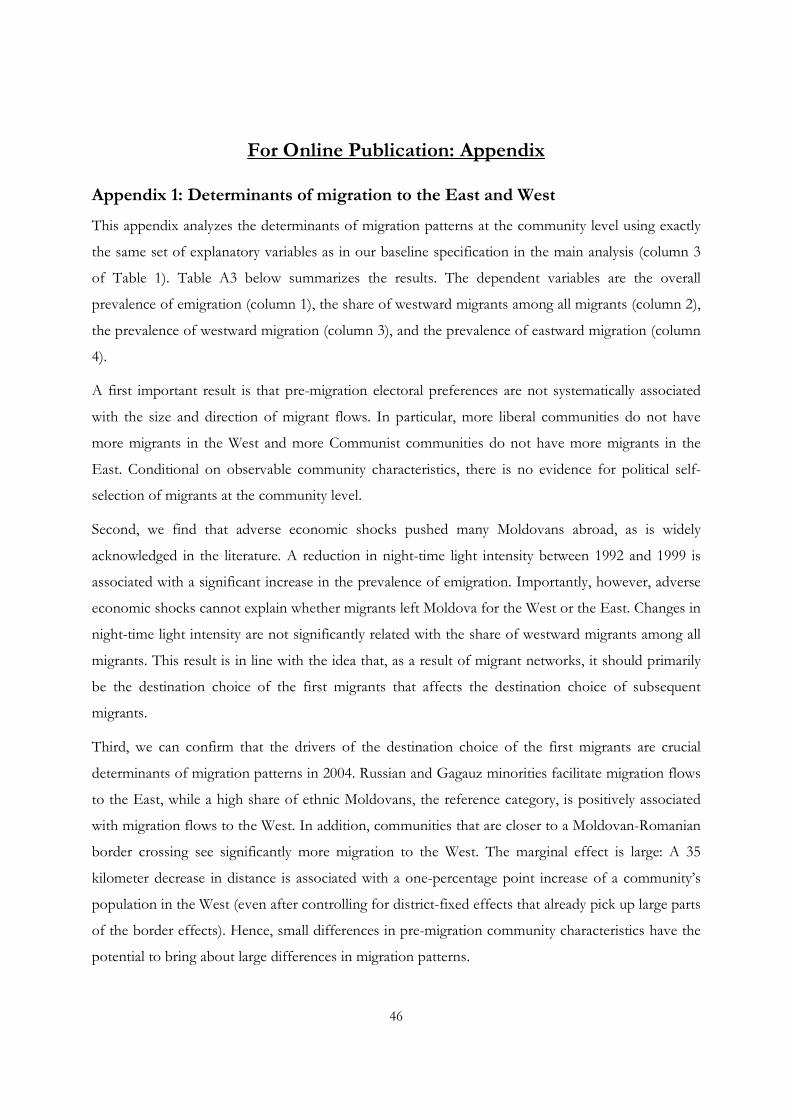
46
For Online Publication: Appendix
Appendix 1: Determinants of migration to the East and West
This appendix analyzes the determinants of migration patterns at the community level using exactly
the same set of explanatory variables as in our baseline specification in the main analysis (column 3
of Table 1). Table A3 below summarizes the results. The dependent variables are the overall
prevalence of emigration (column 1), the share of westward migrants among all migrants (column 2),
the prevalence of westward migration (column 3), and the prevalence of eastward migration (column
4).
A first important result is that pre-migration electoral preferences are not systematically associated
with the size and direction of migrant flows. In particular, more liberal communities do not have
more migrants in the West and more Communist communities do not have more migrants in the
East. Conditional on observable community characteristics, there is no evidence for political self-
selection of migrants at the community level.
Second, we find that adverse economic shocks pushed many Moldovans abroad, as is widely
acknowledged in the literature. A reduction in night-time light intensity between 1992 and 1999 is
associated with a significant increase in the prevalence of emigration. Importantly, however, adverse
economic shocks cannot explain whether migrants left Moldova for the West or the East. Changes in
night-time light intensity are not significantly related with the share of westward migrants among all
migrants. This result is in line with the idea that, as a result of migrant networks, it should primarily
be the destination choice of the first migrants that affects the destination choice of subsequent
migrants.
Third, we can confirm that the drivers of the destination choice of the first migrants are crucial
determinants of migration patterns in 2004. Russian and Gagauz minorities facilitate migration flows
to the East, while a high share of ethnic Moldovans, the reference category, is positively associated
with migration flows to the West. In addition, communities that are closer to a Moldovan-Romanian
border crossing see significantly more migration to the West. The marginal effect is large: A 35
kilometer decrease in distance is associated with a one-percentage point increase of a community’s
population in the West (even after controlling for district-fixed effects that already pick up large parts
of the border effects). Hence, small differences in pre-migration community characteristics have the
potential to bring about large differences in migration patterns.
47
We also find that westward migration is more prevalent in larger communities and in communities
with lower dependency ratios and a more educated population. These findings reflect that westward
migration is more costly to finance than eastward migration and therefore more accessible to better-
off individuals who live in such communities (Luecke et al., 2007).
Appendix 2: Disentangling political spillovers from the exit effect
As discussed in Section 4.2, the baseline coefficients of westward and eastward migration capture
both political spillovers on those who stay behind and the exit of migrants from the electorate. This
appendix attempts to assess to which degree the exit effect may bias the interpretation of the
migration coefficients as political spillovers. To do so, we run the following thought experiment: We
make extreme assumptions on how migrants would have voted had they stayed in Moldova. We then
send all migrants back to their home communities and add their hypothetical votes to the observed
votes of their communities assuming that migrants would have had the same voter turnout as the
non-migrant community population. Finally, we re-run our baseline specification (column 3 of Table
1) using the hypothetical vote share of the Communist Party as new dependent variable. By
definition, the exit effect is now neutralized as migrants remain part of the electorate. We consider
three different scenarios, which are summarized in Table A6 below.
In scenario 1, there is no political self-selection: All migrants are assumed to have voted like the
average stayer in their home communities in July 2009 (column 1). The coefficients of westward and
eastward migration are thus exactly the same as the coefficients of our baseline specification.
However, the assumption of no political self-selection is not realistic. Given their demographic
profile, migrants, particularly those to the West, are likely to have been less supportive of the
Communist Party than the average voter before migration. The coefficients should therefore provide
an underestimation of political spillovers from the West and an overestimation of political spillovers
from the East.
In scenario 2, all migrants would have voted for opposition parties (column 2). Under this extreme
assumption, the coefficient of westward migration provides an upper bound for political spillovers
from the West because, in contrast to the baseline coefficient, it can no longer be driven upwards by
the departure of opposition voters. Indeed, the coefficient of westward migration now drops to
-1.11. This is almost double the magnitude of the baseline coefficient of -0.63, which still includes
the exit effect (i.e., the fact that the Communist vote share increases due to the departure of
opposition voters). These two coefficients define the plausible range of the magnitude of political
48
spillovers of westward migration. The emigration of one percent of a community’s population to the
West reduces the share of Communist votes among those who stay behind by a minimum of 0.63 (if
migrants would have voted as the average stayer) and a maximum of 1.11 percentage points (if
migrants would have been opposition voters). Our baseline coefficient of westward migration should
therefore be interpreted as a conservative estimate of the political spillovers from abroad.
The opposite is true for the coefficient of eastward migration. Under the assumption that all
migrants would have voted for opposition parties, the coefficient of eastward migration provides a
lower bound for the political spillovers of eastward migration. Because it can no longer be driven
upwards by the departure of opposition voters, the coefficient of eastward migration becomes
negative and drops to -0.48, compared to the baseline coefficient of 0.39. Again, these two
coefficients mark the range in which the magnitude of political spillovers of eastward migration is
most likely to be located. As the range includes zero, we cannot conclude with certainty that there
exist political spillovers from eastward migration. What we can conclude, however, is that political
spillovers are likely to be much larger for westward than for eastward migration.
For completeness, we also show the unlikely scenario 3, in which all migrants would have voted for
the Communist Party (column 3). Only when we make this unrealistic assumption do we no longer
find that political spillovers of westward migration decrease the share of Communist votes.
Overall, this exercise provides strong evidence that political spillovers from emigration to the West
indeed reduce support for the Communist Party in migrants’ home communities and are no artifact
of the compositional change of the electorate. Under reasonable assumptions on the direction and
degree of political self-selection of migrants, the baseline coefficient of westward migration is a
conservative estimate of the true size of political spillovers from the West. The baseline coefficient
of eastward migration may, however, overestimate the size of political spillovers from the East.34
Appendix 3: Robustness checks
We perform a number of checks to assess the robustness of the baseline coefficients of westward
and eastward migration. Table A7 below summarizes the results. Column 1 adds 5th-order
polynomials of all control variables including pre-migration election results. In case the linear
approximation used in the baseline specification is not valid, important confounding variables may
still cause biased estimates of the coefficients of interest. 5th-order polynomials of the control
34 These results are also useful to assess the potential consequences of return migration. If anything, the coefficients are likely to underestimate the electoral consequences of emigration in case of return migration.
49
variables would account for potential non-linearities in the relationship between community
characteristics before migration took off and the evolution of migration and voting patterns
thereafter. However, including the polynomials does not significantly change our coefficients of
interest.
Column 2 shows that the coefficient of westward migration remains stable when we do not control
for emigration to the East. Column 3 includes the share of Communist votes in the parliamentary
election of 2001, the year in which the Communist Party returned to power, as an additional
regressor. Hence, we only analyze the change in electoral preferences for the period 2001-2009,
during which the Communist Party had a firm grip on power in Moldova. Again, the coefficients of
interest are not affected.
Column 4 controls for the demographic composition of migrant flows in terms of age, sex and
education. In principle, the absence of certain types of individuals alone may already affect electoral
preferences irrespective of the destination of migrants, e.g. through a change in gender roles in
communities with a high female migration prevalence. To attribute the political effects of emigration
to political spillovers from abroad, they should be unrelated to different pre-departure characteristics
of migrants to the West and East. This is a valid concern for the case of Moldova because westward
and eastward migrants differ somewhat in their demographic characteristics. Westward migrants are
relatively more educated and female than eastward migrants (compare Table A10). However, our
results are fully robust to the inclusion of the demographic characteristics of migrants. If anything,
the coefficient of westward migration becomes larger as the demographic characteristics partially
capture migrants’ electoral preferences and thus weaken the impact of the exit effect on the
coefficient.
The ability to speak a particular foreign language may potentially confound the relationship between
migration and voting patterns. In column 5, we therefore control for the foreign language skills of a
community’s population. Based on information from the population census of 2004, we control for
the shares of the non-migrant population that are able to speak English, German, Italian, French,
Spanish, Portuguese, Greek, Ukrainian, Russian, Gagauz or Bulgarian. Our results hold. The same is
true of we control for the foreign language skills of the entire population including those of migrants
(results available upon request).
Next, we define the West without Italy, the most important destination of Moldovan migrants in
Western Europe, and not necessarily an ideal-type democracy. In line with our finding that our
50
results are mostly driven by emigration to the most advanced democracies, the effect of westward
migration becomes even more pronounced (column 6). We also consider an alternative definition of
the West based on the rule-of-law index from the World Bank Governance Indicators 2004. The
ranking of destination countries relative to Moldova, however, is largely the same and our results do
not change (column 7).
Finally, we assess the robustness of our model to using different econometric specifications. So far,
we have relied on a specification with lagged outcomes as regressors rather than using first
differences (community fixed effects). We have done so for two reasons. First, the structure of our
dataset is not a classic panel. The dependent variable is measured at different points in time than the
explanatory variables. Taking differences would therefore require taking differences over different
periods. Additionally, some explanatory variables are not observed at different points in time, which
would not allow us to take differences. Second, first differencing would imply taking the differences
between Communist votes in 1998 and 2009. Controlling for different dimensions of pre-migration
electoral preferences in form of the vote shares of other parties would not be possible. At the same
time, however, first differencing avoids potential endogeneity problems that may arise from the use
of lagged outcomes as regressors in parametric models. In column 8, we therefore present the results
of a first-difference specification. The coefficient of westward migration remains unaffected, but the
coefficient of eastward migration ceases to be significant at usual significance levels.
In another specification we use the overall migration prevalence and the share of westward migrants
among all migrants instead of the prevalence of emigration to the West and East (column 9). The
coefficient of overall migration prevalence is close to zero and insignificant while the coefficient of
the share of westward migrants is negative and highly significant, which is in line with the previous
results.
Finally, we follow Spilimbergo (2009) and use a continuous measure of the level of democracy
abroad instead of splitting migrants’ destinations into Western and Eastern countries (column 10).
The level of democracy abroad is defined as the weighted average of democracy scores in destination
countries, where a country’s weight is given by the share of migrants in that country among all
migrants from the same community. An interaction term between overall migration prevalence and
the level of democracy abroad then measures the degree of exposure to democracy abroad. The
interaction term is negative and highly significant. Hence, the magnitude of the marginal effect of
emigration on Communist votes increases with the level of democracy abroad.
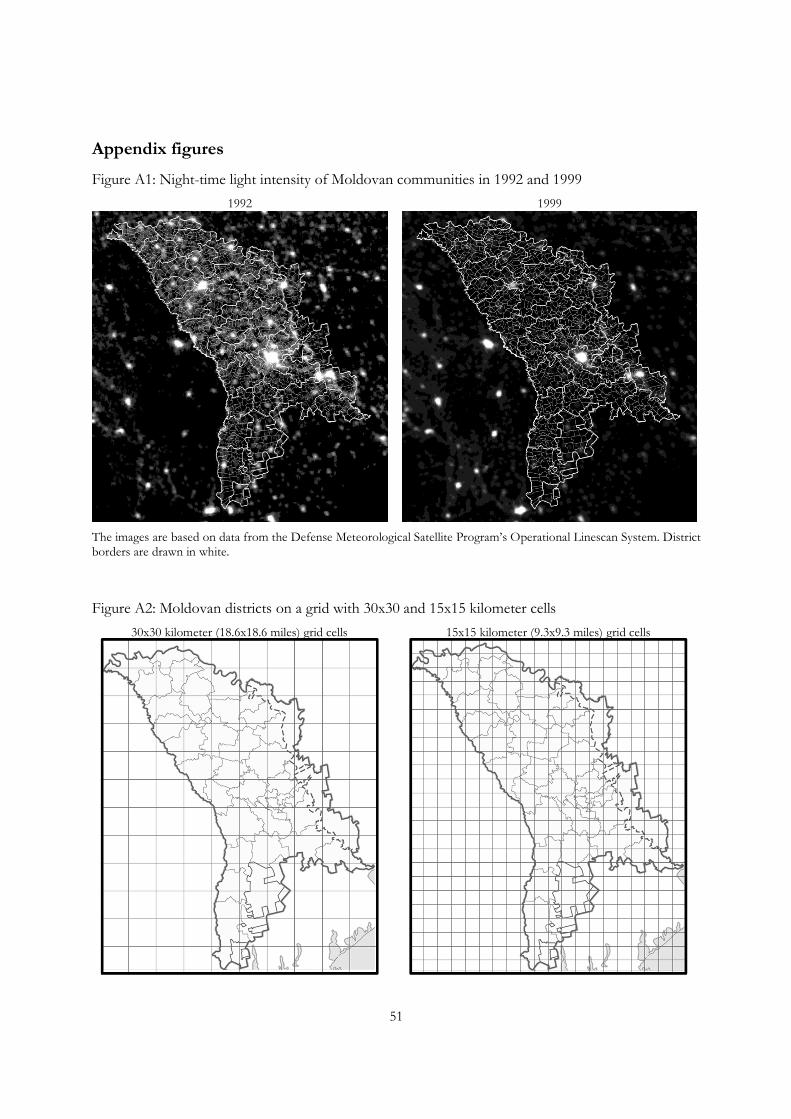
51
Appendix figures
Figure A1: Night-time light intensity of Moldovan communities in 1992 and 1999
1992
1999
The images are based on data from the Defense Meteorological Satellite Program’s Operational Linescan System. District borders are drawn in white.
Figure A2: Moldovan districts on a grid with 30x30 and 15x15 kilometer cells
30x30 kilometer (18.6x18.6 miles) grid cells
15x15 kilometer (9.3x9.3 miles) grid cells
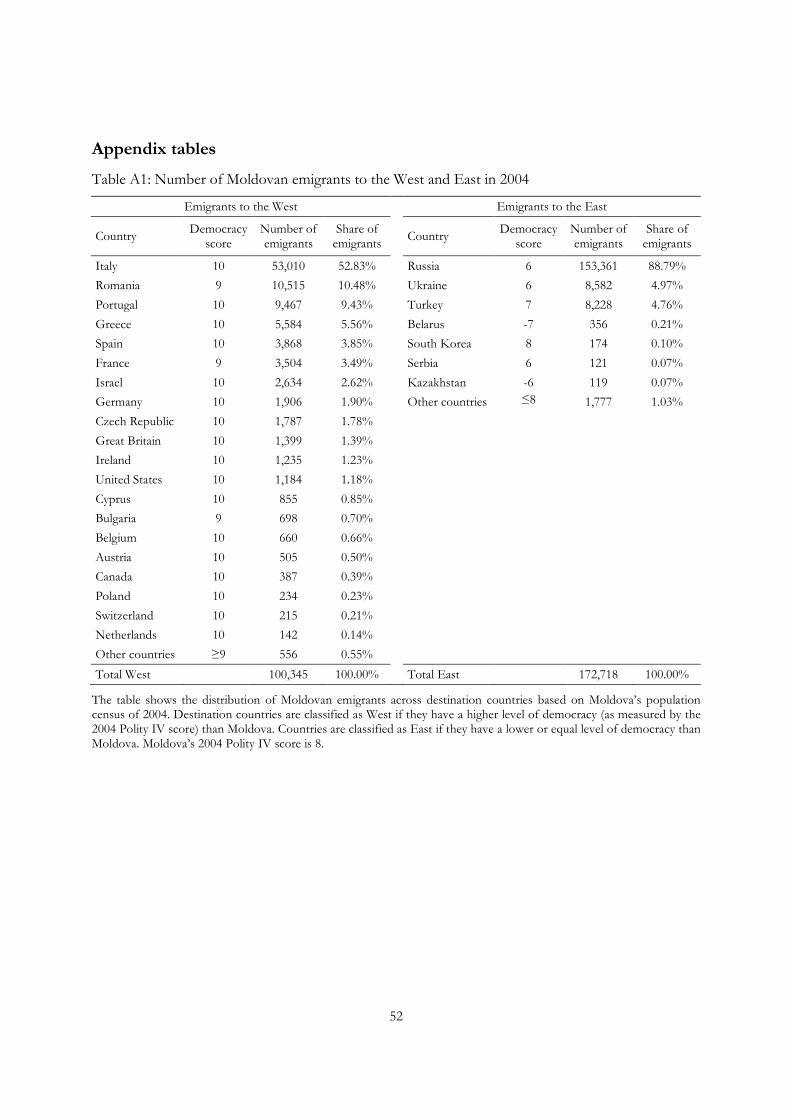
52
Appendix tables
Table A1: Number of Moldovan emigrants to the West and East in 2004
Emigrants to the West Emigrants to the East
Country Democracy
score Number of emigrants
Share of emigrants
Country Democracy
score Number of emigrants
Share of emigrants
Italy 10 53,010 52.83% Russia 6 153,361 88.79%
Romania 9 10,515 10.48% Ukraine 6 8,582 4.97%
Portugal 10 9,467 9.43% Turkey 7 8,228 4.76%
Greece 10 5,584 5.56% Belarus -7 356 0.21%
Spain 10 3,868 3.85% South Korea 8 174 0.10%
France 9 3,504 3.49% Serbia 6 121 0.07%
Israel 10 2,634 2.62% Kazakhstan -6 119 0.07%
Germany 10 1,906 1.90% Other countries ≤8 1,777 1.03%
Czech Republic 10 1,787 1.78%
Great Britain 10 1,399 1.39%
Ireland 10 1,235 1.23%
United States 10 1,184 1.18%
Cyprus 10 855 0.85%
Bulgaria 9 698 0.70%
Belgium 10 660 0.66%
Austria 10 505 0.50%
Canada 10 387 0.39%
Poland 10 234 0.23%
Switzerland 10 215 0.21%
Netherlands 10 142 0.14%
Other countries ≥9 556 0.55%
Total West 100,345 100.00% Total East 172,718 100.00%
The table shows the distribution of Moldovan emigrants across destination countries based on Moldova’s population census of 2004. Destination countries are classified as West if they have a higher level of democracy (as measured by the 2004 Polity IV score) than Moldova. Countries are classified as East if they have a lower or equal level of democracy than Moldova. Moldova’s 2004 Polity IV score is 8.
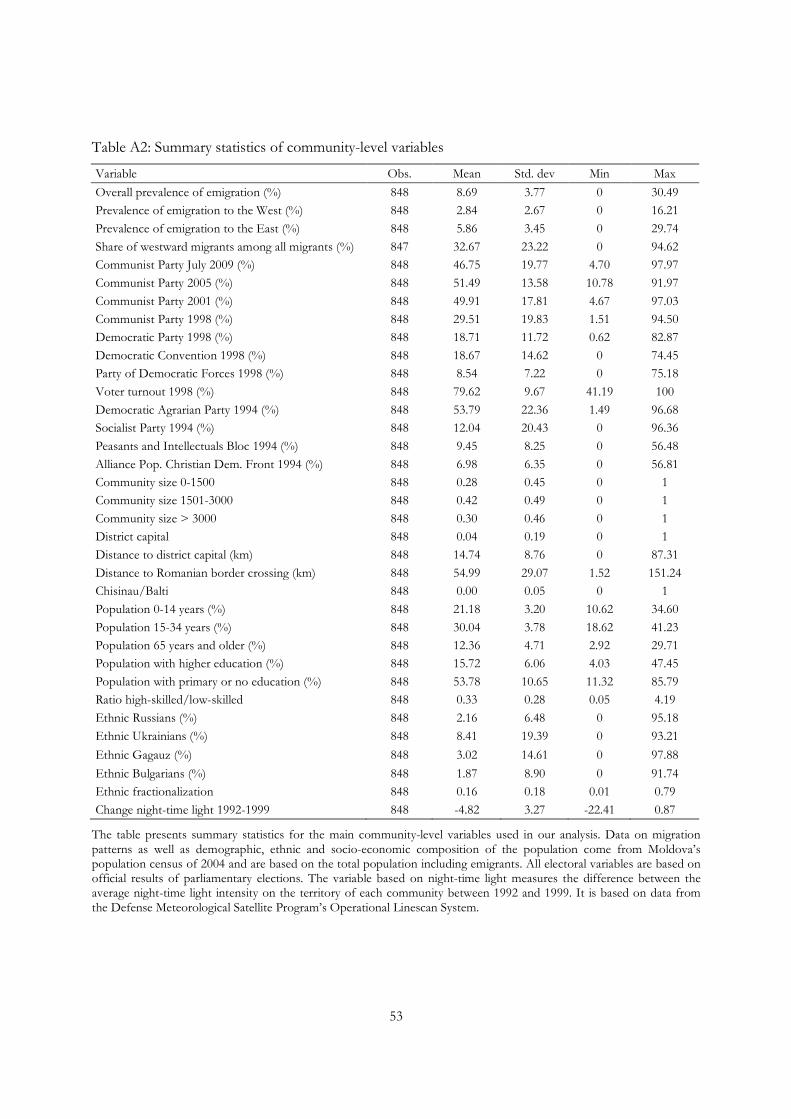
53
Table A2: Summary statistics of community-level variables
Variable Obs. Mean Std. dev Min Max
Overall prevalence of emigration (%) 848 8.69 3.77 0 30.49 Prevalence of emigration to the West (%) 848 2.84 2.67 0 16.21
Prevalence of emigration to the East (%) 848 5.86 3.45 0 29.74
Share of westward migrants among all migrants (%) 847 32.67 23.22 0 94.62 Communist Party July 2009 (%) 848 46.75 19.77 4.70 97.97
Communist Party 2005 (%) 848 51.49 13.58 10.78 91.97
Communist Party 2001 (%) 848 49.91 17.81 4.67 97.03 Communist Party 1998 (%) 848 29.51 19.83 1.51 94.50 Democratic Party 1998 (%) 848 18.71 11.72 0.62 82.87
Democratic Convention 1998 (%) 848 18.67 14.62 0 74.45
Party of Democratic Forces 1998 (%) 848 8.54 7.22 0 75.18
Voter turnout 1998 (%) 848 79.62 9.67 41.19 100
Democratic Agrarian Party 1994 (%) 848 53.79 22.36 1.49 96.68 Socialist Party 1994 (%) 848 12.04 20.43 0 96.36
Peasants and Intellectuals Bloc 1994 (%) 848 9.45 8.25 0 56.48
Alliance Pop. Christian Dem. Front 1994 (%) 848 6.98 6.35 0 56.81 Community size 0-1500 848 0.28 0.45 0 1 Community size 1501-3000 848 0.42 0.49 0 1
Community size > 3000 848 0.30 0.46 0 1
District capital 848 0.04 0.19 0 1
Distance to district capital (km) 848 14.74 8.76 0 87.31
Distance to Romanian border crossing (km) 848 54.99 29.07 1.52 151.24 Chisinau/Balti 848 0.00 0.05 0 1
Population 0-14 years (%) 848 21.18 3.20 10.62 34.60
Population 15-34 years (%) 848 30.04 3.78 18.62 41.23 Population 65 years and older (%) 848 12.36 4.71 2.92 29.71 Population with higher education (%) 848 15.72 6.06 4.03 47.45
Population with primary or no education (%) 848 53.78 10.65 11.32 85.79 Ratio high-skilled/low-skilled 848 0.33 0.28 0.05 4.19
Ethnic Russians (%) 848 2.16 6.48 0 95.18
Ethnic Ukrainians (%) 848 8.41 19.39 0 93.21
Ethnic Gagauz (%) 848 3.02 14.61 0 97.88
Ethnic Bulgarians (%) 848 1.87 8.90 0 91.74 Ethnic fractionalization 848 0.16 0.18 0.01 0.79
Change night-time light 1992-1999 848 -4.82 3.27 -22.41 0.87
The table presents summary statistics for the main community-level variables used in our analysis. Data on migration patterns as well as demographic, ethnic and socio-economic composition of the population come from Moldova’s population census of 2004 and are based on the total population including emigrants. All electoral variables are based on official results of parliamentary elections. The variable based on night-time light measures the difference between the average night-time light intensity on the territory of each community between 1992 and 1999. It is based on data from the Defense Meteorological Satellite Program’s Operational Linescan System.
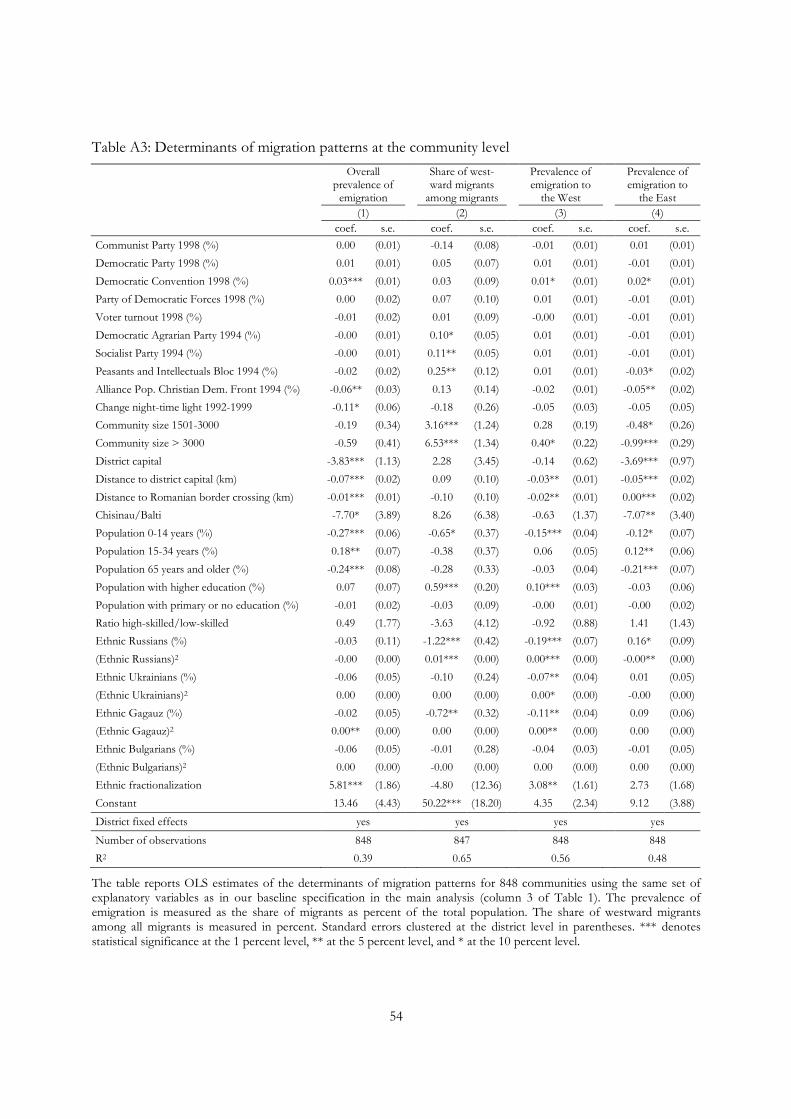
54
Table A3: Determinants of migration patterns at the community level
Overall
prevalence of emigration
Share of west-ward migrants
among migrants
Prevalence of emigration to
the West
Prevalence of emigration to
the East (1) (2) (3) (4) coef. s.e. coef. s.e. coef. s.e. coef. s.e.
Communist Party 1998 (%) 0.00 (0.01) -0.14 (0.08) -0.01 (0.01) 0.01 (0.01)
Democratic Party 1998 (%) 0.01 (0.01) 0.05 (0.07) 0.01 (0.01) -0.01 (0.01)
Democratic Convention 1998 (%) 0.03*** (0.01) 0.03 (0.09) 0.01* (0.01) 0.02* (0.01)
Party of Democratic Forces 1998 (%) 0.00 (0.02) 0.07 (0.10) 0.01 (0.01) -0.01 (0.01)
Voter turnout 1998 (%) -0.01 (0.02) 0.01 (0.09) -0.00 (0.01) -0.01 (0.01)
Democratic Agrarian Party 1994 (%) -0.00 (0.01) 0.10* (0.05) 0.01 (0.01) -0.01 (0.01)
Socialist Party 1994 (%) -0.00 (0.01) 0.11** (0.05) 0.01 (0.01) -0.01 (0.01)
Peasants and Intellectuals Bloc 1994 (%) -0.02 (0.02) 0.25** (0.12) 0.01 (0.01) -0.03* (0.02)
Alliance Pop. Christian Dem. Front 1994 (%) -0.06** (0.03) 0.13 (0.14) -0.02 (0.01) -0.05** (0.02)
Change night-time light 1992-1999 -0.11* (0.06) -0.18 (0.26) -0.05 (0.03) -0.05 (0.05)
Community size 1501-3000 -0.19 (0.34) 3.16*** (1.24) 0.28 (0.19) -0.48* (0.26)
Community size > 3000 -0.59 (0.41) 6.53*** (1.34) 0.40* (0.22) -0.99*** (0.29)
District capital -3.83*** (1.13) 2.28 (3.45) -0.14 (0.62) -3.69*** (0.97)
Distance to district capital (km) -0.07*** (0.02) 0.09 (0.10) -0.03** (0.01) -0.05*** (0.02)
Distance to Romanian border crossing (km) -0.01*** (0.01) -0.10 (0.10) -0.02** (0.01) 0.00*** (0.02)
Chisinau/Balti -7.70* (3.89) 8.26 (6.38) -0.63 (1.37) -7.07** (3.40)
Population 0-14 years (%) -0.27*** (0.06) -0.65* (0.37) -0.15*** (0.04) -0.12* (0.07)
Population 15-34 years (%) 0.18** (0.07) -0.38 (0.37) 0.06 (0.05) 0.12** (0.06)
Population 65 years and older (%) -0.24*** (0.08) -0.28 (0.33) -0.03 (0.04) -0.21*** (0.07)
Population with higher education (%) 0.07 (0.07) 0.59*** (0.20) 0.10*** (0.03) -0.03 (0.06)
Population with primary or no education (%) -0.01 (0.02) -0.03 (0.09) -0.00 (0.01) -0.00 (0.02)
Ratio high-skilled/low-skilled 0.49 (1.77) -3.63 (4.12) -0.92 (0.88) 1.41 (1.43)
Ethnic Russians (%) -0.03 (0.11) -1.22*** (0.42) -0.19*** (0.07) 0.16* (0.09)
(Ethnic Russians)2 -0.00 (0.00) 0.01*** (0.00) 0.00*** (0.00) -0.00** (0.00)
Ethnic Ukrainians (%) -0.06 (0.05) -0.10 (0.24) -0.07** (0.04) 0.01 (0.05)
(Ethnic Ukrainians)2 0.00 (0.00) 0.00 (0.00) 0.00* (0.00) -0.00 (0.00)
Ethnic Gagauz (%) -0.02 (0.05) -0.72** (0.32) -0.11** (0.04) 0.09 (0.06)
(Ethnic Gagauz)2 0.00** (0.00) 0.00 (0.00) 0.00** (0.00) 0.00 (0.00)
Ethnic Bulgarians (%) -0.06 (0.05) -0.01 (0.28) -0.04 (0.03) -0.01 (0.05)
(Ethnic Bulgarians)2 0.00 (0.00) -0.00 (0.00) 0.00 (0.00) 0.00 (0.00)
Ethnic fractionalization 5.81*** (1.86) -4.80 (12.36) 3.08** (1.61) 2.73 (1.68)
Constant 13.46 (4.43) 50.22*** (18.20) 4.35 (2.34) 9.12 (3.88)
District fixed effects yes yes yes yes
Number of observations 848 847 848 848
R2 0.39 0.65 0.56 0.48
The table reports OLS estimates of the determinants of migration patterns for 848 communities using the same set of explanatory variables as in our baseline specification in the main analysis (column 3 of Table 1). The prevalence of emigration is measured as the share of migrants as percent of the total population. The share of westward migrants among all migrants is measured in percent. Standard errors clustered at the district level in parentheses. *** denotes statistical significance at the 1 percent level, ** at the 5 percent level, and * at the 10 percent level.
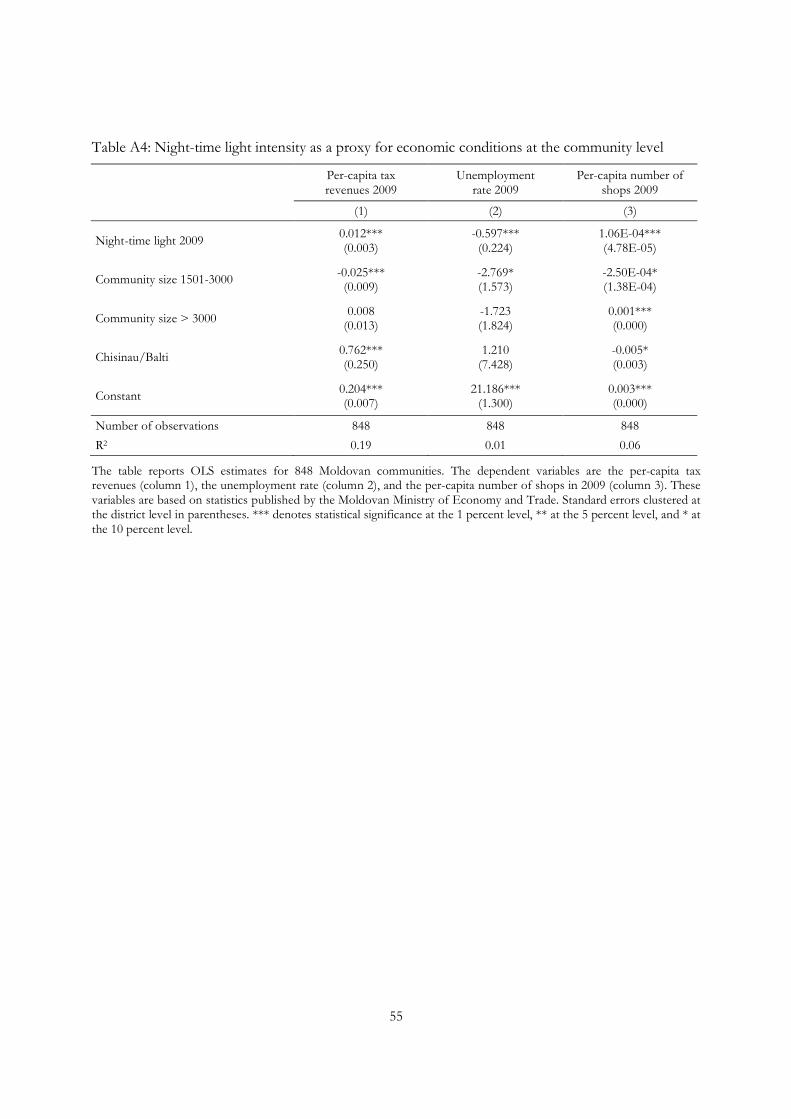
55
Table A4: Night-time light intensity as a proxy for economic conditions at the community level
Per-capita tax revenues 2009
Unemployment rate 2009
Per-capita number of shops 2009
(1) (2) (3)
Night-time light 2009 0.012*** -0.597*** 1.06E-04*** (0.003) (0.224) (4.78E-05)
Community size 1501-3000 -0.025*** -2.769* -2.50E-04* (0.009) (1.573) (1.38E-04)
Community size > 3000 0.008 -1.723 0.001*** (0.013) (1.824) (0.000)
Chisinau/Balti 0.762*** 1.210 -0.005* (0.250) (7.428) (0.003)
Constant 0.204*** 21.186*** 0.003*** (0.007) (1.300) (0.000)
Number of observations 848 848 848
R2 0.19 0.01 0.06
The table reports OLS estimates for 848 Moldovan communities. The dependent variables are the per-capita tax revenues (column 1), the unemployment rate (column 2), and the per-capita number of shops in 2009 (column 3). These variables are based on statistics published by the Moldovan Ministry of Economy and Trade. Standard errors clustered at the district level in parentheses. *** denotes statistical significance at the 1 percent level, ** at the 5 percent level, and * at the 10 percent level.
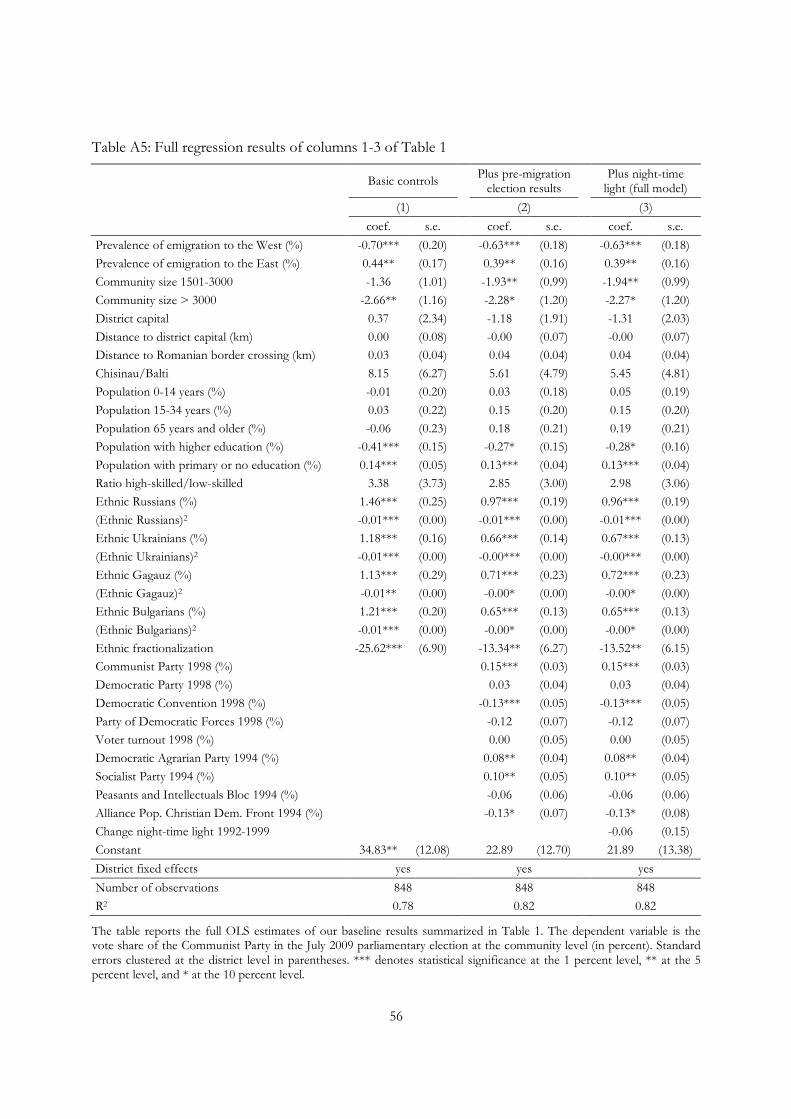
56
Table A5: Full regression results of columns 1-3 of Table 1
Basic controls Plus pre-migration election results
Plus night-time light (full model)
(1) (2) (3)
coef. s.e. coef. s.e. coef. s.e.
Prevalence of emigration to the West (%) -0.70*** (0.20) -0.63*** (0.18) -0.63*** (0.18)
Prevalence of emigration to the East (%) 0.44** (0.17) 0.39** (0.16) 0.39** (0.16)
Community size 1501-3000 -1.36 (1.01) -1.93** (0.99) -1.94** (0.99)
Community size > 3000 -2.66** (1.16) -2.28* (1.20) -2.27* (1.20)
District capital 0.37 (2.34) -1.18 (1.91) -1.31 (2.03)
Distance to district capital (km) 0.00 (0.08) -0.00 (0.07) -0.00 (0.07)
Distance to Romanian border crossing (km) 0.03 (0.04) 0.04 (0.04) 0.04 (0.04)
Chisinau/Balti 8.15 (6.27) 5.61 (4.79) 5.45 (4.81)
Population 0-14 years (%) -0.01 (0.20) 0.03 (0.18) 0.05 (0.19)
Population 15-34 years (%) 0.03 (0.22) 0.15 (0.20) 0.15 (0.20)
Population 65 years and older (%) -0.06 (0.23) 0.18 (0.21) 0.19 (0.21)
Population with higher education (%) -0.41*** (0.15) -0.27* (0.15) -0.28* (0.16)
Population with primary or no education (%) 0.14*** (0.05) 0.13*** (0.04) 0.13*** (0.04)
Ratio high-skilled/low-skilled 3.38 (3.73) 2.85 (3.00) 2.98 (3.06)
Ethnic Russians (%) 1.46*** (0.25) 0.97*** (0.19) 0.96*** (0.19)
(Ethnic Russians)2 -0.01*** (0.00) -0.01*** (0.00) -0.01*** (0.00)
Ethnic Ukrainians (%) 1.18*** (0.16) 0.66*** (0.14) 0.67*** (0.13)
(Ethnic Ukrainians)2 -0.01*** (0.00) -0.00*** (0.00) -0.00*** (0.00)
Ethnic Gagauz (%) 1.13*** (0.29) 0.71*** (0.23) 0.72*** (0.23)
(Ethnic Gagauz)2 -0.01** (0.00) -0.00* (0.00) -0.00* (0.00)
Ethnic Bulgarians (%) 1.21*** (0.20) 0.65*** (0.13) 0.65*** (0.13)
(Ethnic Bulgarians)2 -0.01*** (0.00) -0.00* (0.00) -0.00* (0.00)
Ethnic fractionalization -25.62*** (6.90) -13.34** (6.27) -13.52** (6.15)
Communist Party 1998 (%) 0.15*** (0.03) 0.15*** (0.03)
Democratic Party 1998 (%) 0.03 (0.04) 0.03 (0.04)
Democratic Convention 1998 (%) -0.13*** (0.05) -0.13*** (0.05)
Party of Democratic Forces 1998 (%) -0.12 (0.07) -0.12 (0.07)
Voter turnout 1998 (%) 0.00 (0.05) 0.00 (0.05)
Democratic Agrarian Party 1994 (%) 0.08** (0.04) 0.08** (0.04)
Socialist Party 1994 (%) 0.10** (0.05) 0.10** (0.05)
Peasants and Intellectuals Bloc 1994 (%) -0.06 (0.06) -0.06 (0.06)
Alliance Pop. Christian Dem. Front 1994 (%) -0.13* (0.07) -0.13* (0.08)
Change night-time light 1992-1999 -0.06 (0.15)
Constant 34.83** (12.08) 22.89 (12.70) 21.89 (13.38)
District fixed effects yes yes yes
Number of observations 848 848 848
R2 0.78 0.82 0.82
The table reports the full OLS estimates of our baseline results summarized in Table 1. The dependent variable is the vote share of the Communist Party in the July 2009 parliamentary election at the community level (in percent). Standard errors clustered at the district level in parentheses. *** denotes statistical significance at the 1 percent level, ** at the 5 percent level, and * at the 10 percent level.
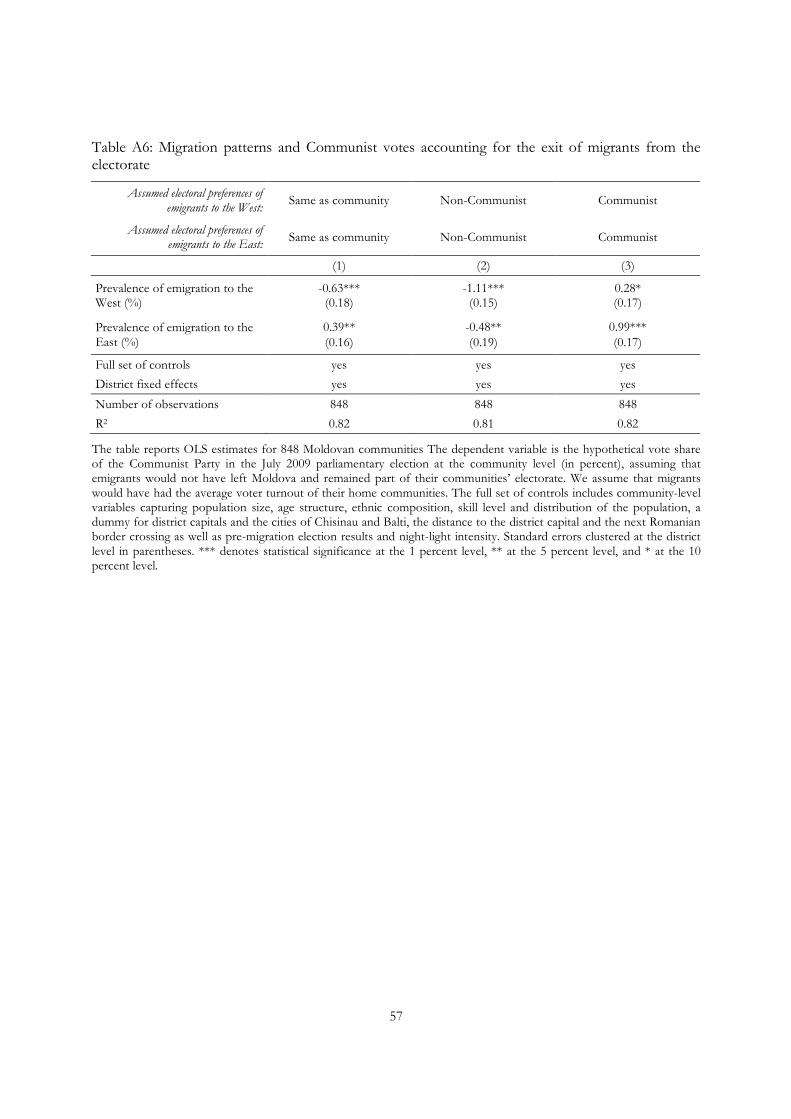
57
Table A6: Migration patterns and Communist votes accounting for the exit of migrants from the electorate
Assumed electoral preferences of emigrants to the West:
Same as community Non-Communist Communist
Assumed electoral preferences of emigrants to the East:
Same as community Non-Communist Communist
(1) (2) (3)
Prevalence of emigration to the West (%)
-0.63*** -1.11*** 0.28* (0.18) (0.15) (0.17)
Prevalence of emigration to the East (%)
0.39** -0.48** 0.99*** (0.16) (0.19) (0.17)
Full set of controls yes yes yes
District fixed effects yes yes yes
Number of observations 848 848 848
R2 0.82 0.81 0.82
The table reports OLS estimates for 848 Moldovan communities The dependent variable is the hypothetical vote share of the Communist Party in the July 2009 parliamentary election at the community level (in percent), assuming that emigrants would not have left Moldova and remained part of their communities’ electorate. We assume that migrants would have had the average voter turnout of their home communities. The full set of controls includes community-level variables capturing population size, age structure, ethnic composition, skill level and distribution of the population, a dummy for district capitals and the cities of Chisinau and Balti, the distance to the district capital and the next Romanian border crossing as well as pre-migration election results and night-light intensity. Standard errors clustered at the district level in parentheses. *** denotes statistical significance at the 1 percent level, ** at the 5 percent level, and * at the 10 percent level.
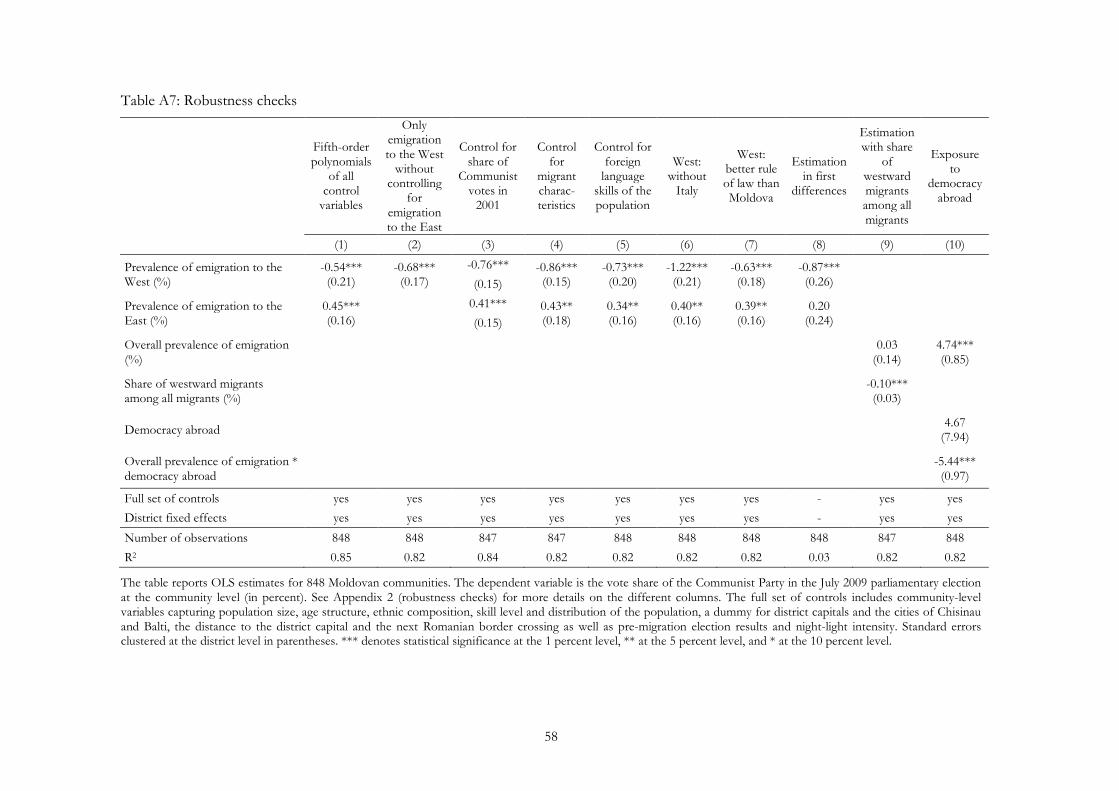
58
Table A7: Robustness checks
Fifth-order polynomials
of all control
variables
Only emigration to the West
without controlling
for emigration to the East
Control for share of
Communist votes in
2001
Control for
migrant charac-teristics
Control for foreign
language skills of the population
West: without
Italy
West: better rule of law than Moldova
Estimation in first
differences
Estimation with share
of westward migrants among all migrants
Exposure to
democracy abroad
(1) (2) (3) (4) (5) (6) (7) (8) (9) (10)
Prevalence of emigration to the West (%)
-0.54*** -0.68*** -0.76*** -0.86*** -0.73*** -1.22*** -0.63*** -0.87*** (0.21) (0.17) (0.15) (0.15) (0.20) (0.21) (0.18) (0.26)
Prevalence of emigration to the East (%)
0.45*** 0.41*** 0.43** 0.34** 0.40** 0.39** 0.20 (0.16) (0.15) (0.18) (0.16) (0.16) (0.16) (0.24)
Overall prevalence of emigration (%)
0.03 4.74*** (0.14) (0.85)
Share of westward migrants among all migrants (%)
-0.10*** (0.03)
Democracy abroad 4.67 (7.94)
Overall prevalence of emigration * democracy abroad
-5.44*** (0.97)
Full set of controls yes yes yes yes yes yes yes - yes yes
District fixed effects yes yes yes yes yes yes yes - yes yes
Number of observations 848 848 847 847 848 848 848 848 847 848
R2 0.85 0.82 0.84 0.82 0.82 0.82 0.82 0.03 0.82 0.82
The table reports OLS estimates for 848 Moldovan communities. The dependent variable is the vote share of the Communist Party in the July 2009 parliamentary election at the community level (in percent). See Appendix 2 (robustness checks) for more details on the different columns. The full set of controls includes community-level variables capturing population size, age structure, ethnic composition, skill level and distribution of the population, a dummy for district capitals and the cities of Chisinau and Balti, the distance to the district capital and the next Romanian border crossing as well as pre-migration election results and night-light intensity. Standard errors clustered at the district level in parentheses. *** denotes statistical significance at the 1 percent level, ** at the 5 percent level, and * at the 10 percent level.
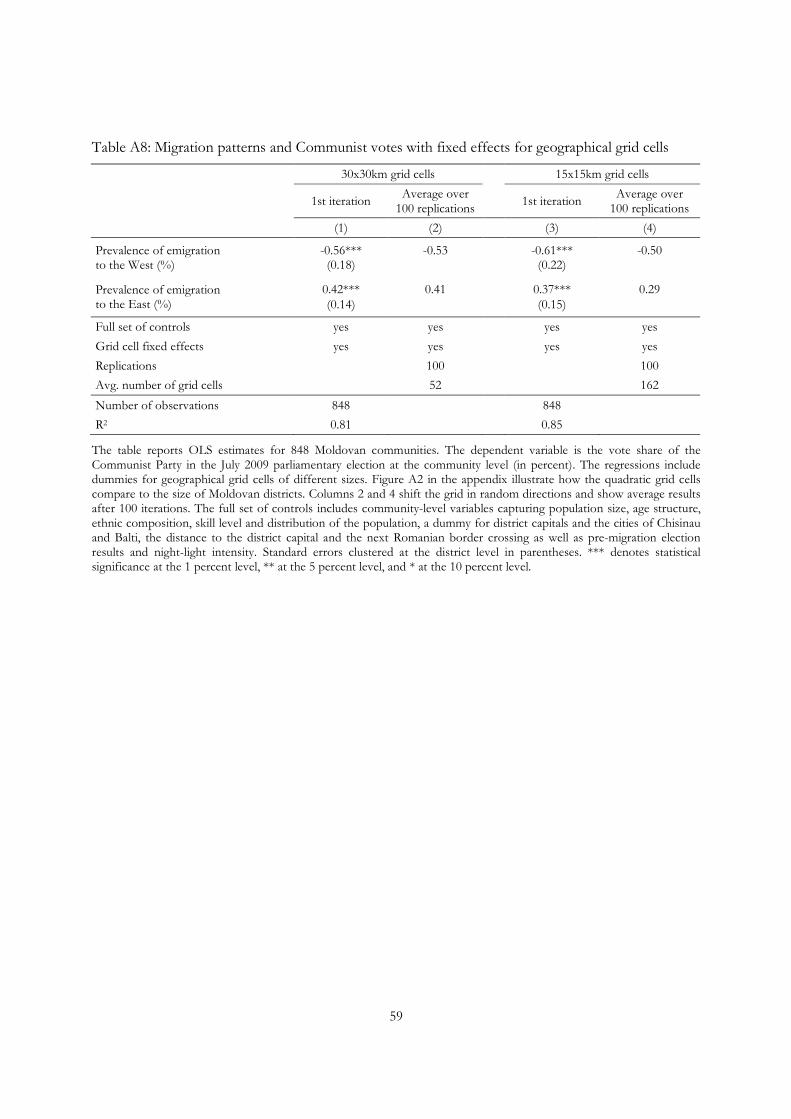
59
Table A8: Migration patterns and Communist votes with fixed effects for geographical grid cells
30x30km grid cells 15x15km grid cells
1st iteration Average over
100 replications 1st iteration
Average over 100 replications
(1) (2) (3) (4)
Prevalence of emigration to the West (%)
-0.56*** -0.53 -0.61*** -0.50 (0.18) (0.22)
Prevalence of emigration to the East (%)
0.42*** 0.41 0.37*** 0.29 (0.14) (0.15)
Full set of controls yes yes yes yes
Grid cell fixed effects yes yes yes yes
Replications 100 100
Avg. number of grid cells 52 162
Number of observations 848 848
R2 0.81 0.85
The table reports OLS estimates for 848 Moldovan communities. The dependent variable is the vote share of the Communist Party in the July 2009 parliamentary election at the community level (in percent). The regressions include dummies for geographical grid cells of different sizes. Figure A2 in the appendix illustrate how the quadratic grid cells compare to the size of Moldovan districts. Columns 2 and 4 shift the grid in random directions and show average results after 100 iterations. The full set of controls includes community-level variables capturing population size, age structure, ethnic composition, skill level and distribution of the population, a dummy for district capitals and the cities of Chisinau and Balti, the distance to the district capital and the next Romanian border crossing as well as pre-migration election results and night-light intensity. Standard errors clustered at the district level in parentheses. *** denotes statistical significance at the 1 percent level, ** at the 5 percent level, and * at the 10 percent level.
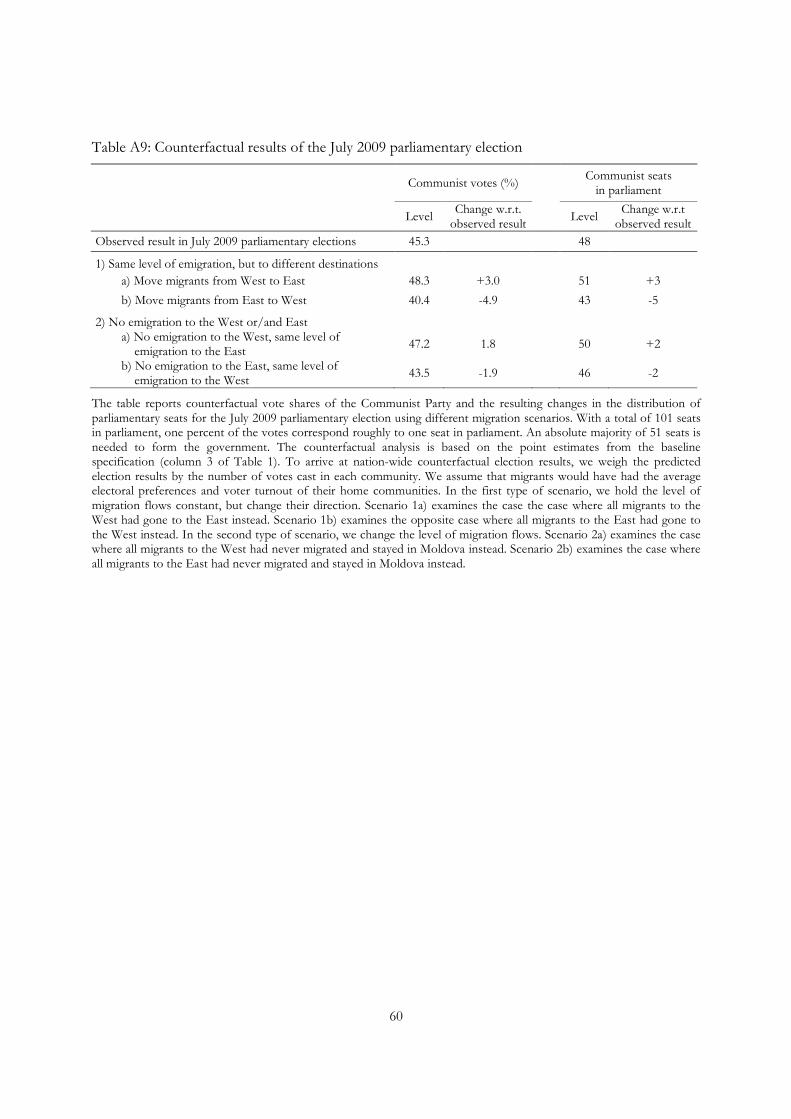
60
Table A9: Counterfactual results of the July 2009 parliamentary election
Communist votes (%)
Communist seats in parliament
Level
Change w.r.t. observed result
Level Change w.r.t
observed result Observed result in July 2009 parliamentary elections 45.3
48
1) Same level of emigration, but to different destinations
a) Move migrants from West to East 48.3 +3.0
51 +3
b) Move migrants from East to West 40.4 -4.9
43 -5
2) No emigration to the West or/and East a) No emigration to the West, same level of
emigration to the East 47.2 1.8
50 +2
b) No emigration to the East, same level of emigration to the West
43.5 -1.9
46 -2
The table reports counterfactual vote shares of the Communist Party and the resulting changes in the distribution of parliamentary seats for the July 2009 parliamentary election using different migration scenarios. With a total of 101 seats in parliament, one percent of the votes correspond roughly to one seat in parliament. An absolute majority of 51 seats is needed to form the government. The counterfactual analysis is based on the point estimates from the baseline specification (column 3 of Table 1). To arrive at nation-wide counterfactual election results, we weigh the predicted election results by the number of votes cast in each community. We assume that migrants would have had the average electoral preferences and voter turnout of their home communities. In the first type of scenario, we hold the level of migration flows constant, but change their direction. Scenario 1a) examines the case the case where all migrants to the West had gone to the East instead. Scenario 1b) examines the opposite case where all migrants to the East had gone to the West instead. In the second type of scenario, we change the level of migration flows. Scenario 2a) examines the case where all migrants to the West had never migrated and stayed in Moldova instead. Scenario 2b) examines the case where all migrants to the East had never migrated and stayed in Moldova instead.
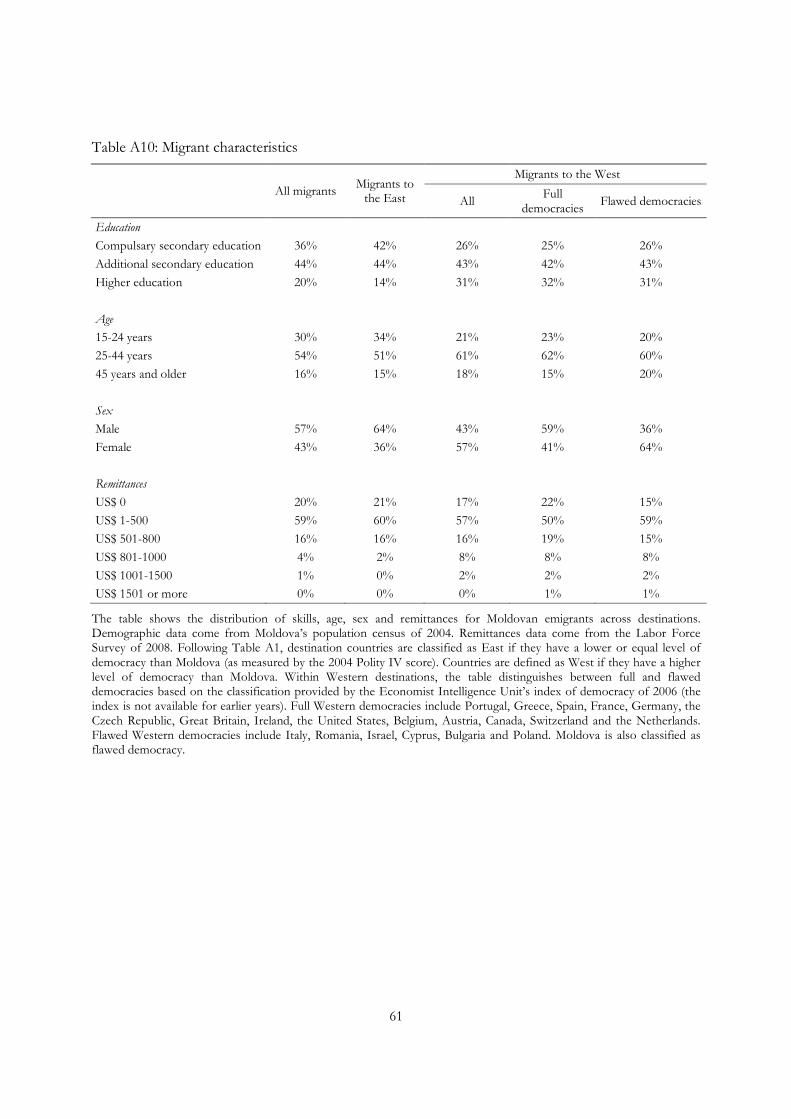
61
Table A10: Migrant characteristics
All migrants Migrants to
the East
Migrants to the West
All Full
democracies Flawed democracies
Education
Compulsary secondary education 36% 42% 26% 25% 26%
Additional secondary education 44% 44% 43% 42% 43%
Higher education 20% 14% 31% 32% 31%
Age
15-24 years 30% 34% 21% 23% 20%
25-44 years 54% 51% 61% 62% 60%
45 years and older 16% 15% 18% 15% 20%
Sex
Male 57% 64% 43% 59% 36%
Female 43% 36% 57% 41% 64%
Remittances
US$ 0 20% 21% 17% 22% 15%
US$ 1-500 59% 60% 57% 50% 59%
US$ 501-800 16% 16% 16% 19% 15%
US$ 801-1000 4% 2% 8% 8% 8%
US$ 1001-1500 1% 0% 2% 2% 2%
US$ 1501 or more 0% 0% 0% 1% 1%
The table shows the distribution of skills, age, sex and remittances for Moldovan emigrants across destinations. Demographic data come from Moldova’s population census of 2004. Remittances data come from the Labor Force Survey of 2008. Following Table A1, destination countries are classified as East if they have a lower or equal level of democracy than Moldova (as measured by the 2004 Polity IV score). Countries are defined as West if they have a higher level of democracy than Moldova. Within Western destinations, the table distinguishes between full and flawed democracies based on the classification provided by the Economist Intelligence Unit’s index of democracy of 2006 (the index is not available for earlier years). Full Western democracies include Portugal, Greece, Spain, France, Germany, the Czech Republic, Great Britain, Ireland, the United States, Belgium, Austria, Canada, Switzerland and the Netherlands. Flawed Western democracies include Italy, Romania, Israel, Cyprus, Bulgaria and Poland. Moldova is also classified as flawed democracy.
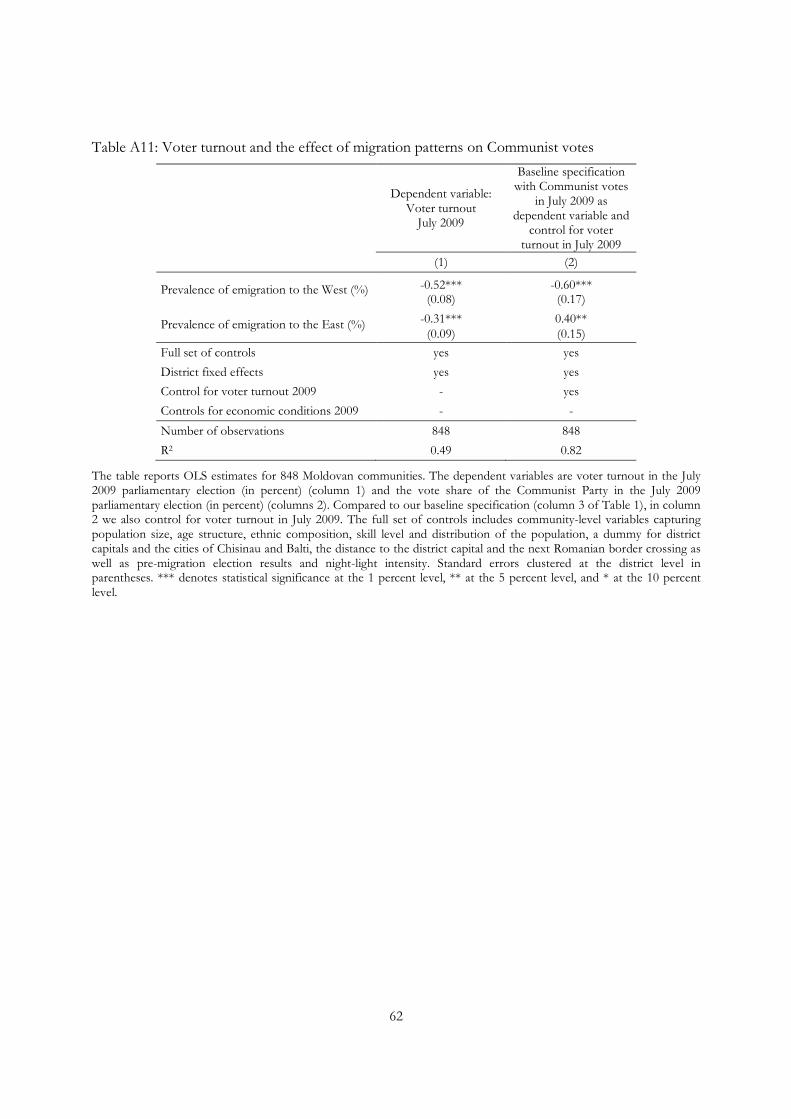
62
Table A11: Voter turnout and the effect of migration patterns on Communist votes
Dependent variable: Voter turnout
July 2009
Baseline specification with Communist votes
in July 2009 as dependent variable and
control for voter turnout in July 2009
(1) (2)
Prevalence of emigration to the West (%) -0.52*** -0.60*** (0.08) (0.17)
Prevalence of emigration to the East (%) -0.31*** 0.40** (0.09) (0.15)
Full set of controls yes yes
District fixed effects yes yes
Control for voter turnout 2009 - yes
Controls for economic conditions 2009 - -
Number of observations 848 848
R2 0.49 0.82
The table reports OLS estimates for 848 Moldovan communities. The dependent variables are voter turnout in the July 2009 parliamentary election (in percent) (column 1) and the vote share of the Communist Party in the July 2009 parliamentary election (in percent) (columns 2). Compared to our baseline specification (column 3 of Table 1), in column 2 we also control for voter turnout in July 2009. The full set of controls includes community-level variables capturing population size, age structure, ethnic composition, skill level and distribution of the population, a dummy for district capitals and the cities of Chisinau and Balti, the distance to the district capital and the next Romanian border crossing as well as pre-migration election results and night-light intensity. Standard errors clustered at the district level in parentheses. *** denotes statistical significance at the 1 percent level, ** at the 5 percent level, and * at the 10 percent level.