Embed Size (px)
Citation preview
DEPARTMENT OF ECONOMICS Uppsala University Master Thesis (D-uppsats) Author: Lisa Andersson Supervisor: Henry Ohlsson Spring 2008
Labour Migration and Network Effects in
Moldova
Abstract
This study investigates the impact of migration networks on the decision to migrate in Moldova.
Using a recent cross-sectional household survey with extensive migration information I am able
to disaggregate the migration networks according to kinship and further investigate the impact of
different kinds of networks. The results show that migration networks have a significant positive
impact on the decision to migrate, whereas the results do not reveal any conclusive evidence that
certain kinships have stronger or different influence on the decision to migrate than others. The
most influential determinants of migration when it comes to networks are ex-household members
who migrated abroad and no longer make part of the household, and other individuals outside the
household (i.e. friends, neighbours etc.) who migrated.
Keywords: Labour migration, networks, migration decision, Moldova
ABBREVIATIONS CIS – Commonwealth of Independent States GDP – Gross Domestic Product IMF – International Monetary Fond IOM – International Organization for Migration
2
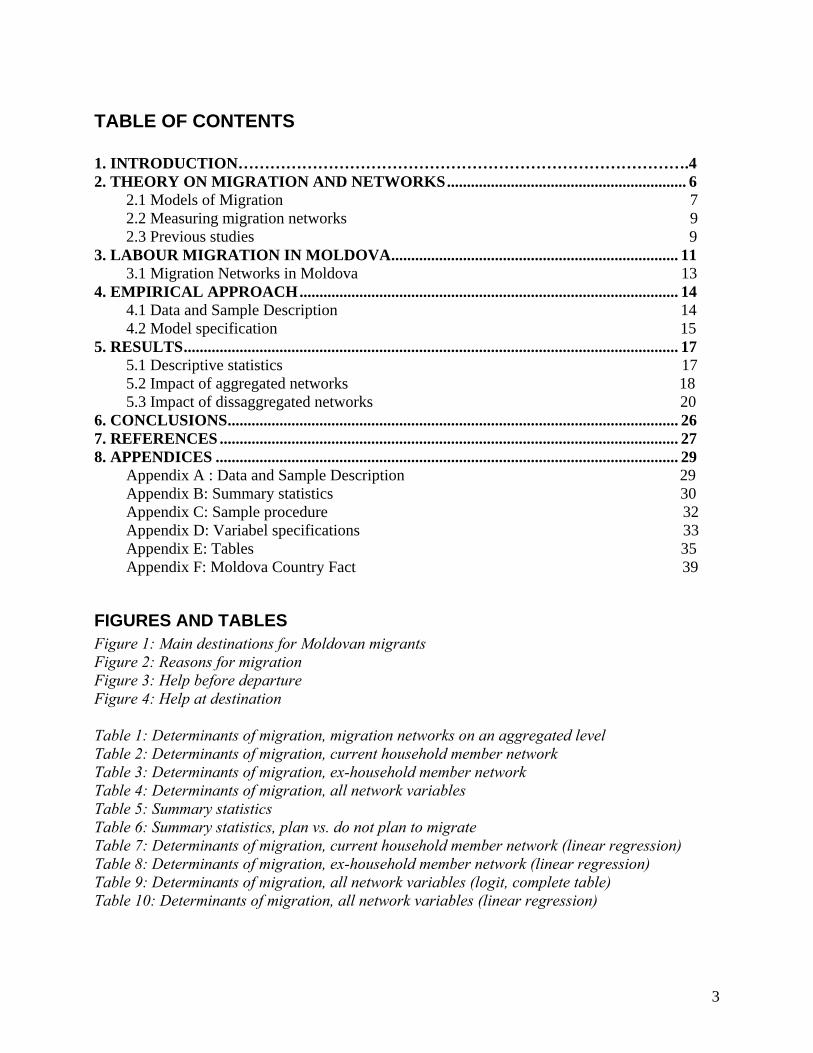
TABLE OF CONTENTS 1. INTRODUCTION………………………………………………………………………….4 2. THEORY ON MIGRATION AND NETWORKS............................................................ 6
2.1 Models of Migration 7 2.2 Measuring migration networks 9 2.3 Previous studies 9
3. LABOUR MIGRATION IN MOLDOVA........................................................................ 11 3.1 Migration Networks in Moldova 13
4. EMPIRICAL APPROACH............................................................................................... 14 4.1 Data and Sample Description 14 4.2 Model specification 15
5. RESULTS............................................................................................................................ 17 5.1 Descriptive statistics 17 5.2 Impact of aggregated networks 18 5.3 Impact of dissaggregated networks 20
6. CONCLUSIONS................................................................................................................. 26 7. REFERENCES ................................................................................................................... 27 8. APPENDICES .................................................................................................................... 29
Appendix A : Data and Sample Description 29 Appendix B: Summary statistics 30 Appendix C: Sample procedure 32 Appendix D: Variabel specifications 33 Appendix E: Tables 35 Appendix F: Moldova Country Fact 39
FIGURES AND TABLES Figure 1: Main destinations for Moldovan migrants Figure 2: Reasons for migration Figure 3: Help before departure Figure 4: Help at destination Table 1: Determinants of migration, migration networks on an aggregated level Table 2: Determinants of migration, current household member network Table 3: Determinants of migration, ex-household member network Table 4: Determinants of migration, all network variables Table 5: Summary statistics Table 6: Summary statistics, plan vs. do not plan to migrate Table 7: Determinants of migration, current household member network (linear regression) Table 8: Determinants of migration, ex-household member network (linear regression) Table 9: Determinants of migration, all network variables (logit, complete table) Table 10: Determinants of migration, all network variables (linear regression)
3
1. INTRODUCTION
Migration is an important factor for economic and social development in both sending and
receiving countries around the world. International migration is costly in terms of monetary,
search, information, and psychological costs. Migration networks act to lower these costs by
providing information on job opportunities, border crossing and assistance in job search,
transports and housing. Much of the recent research considering migration stresses the
importance of strong institutions and good policies to enhance the benefits and mitigate the risks
of migration. Although there are a number of previous studies which investigate the impact of
migration networks, few of these studies take into account the importance of different types and
compositions of migration networks. The structure and composition of migration networks might
affect the migration decisions, so taking networks into account when studying migration could
increase the knowledge of the driving forces behind migration, in order to provide more insight
and understanding of appropriate and successful policies and programmes for migration.
Moldova constitutes an interesting example when studying labour migration. The country is one
of the largest net emigration countries in the world, with a steadily increasing number of the
population migrating to find work in other countries. According to official numbers from the
Government more than 600 000 Moldovans live and work abroad, although the actual numbers
differ according to different sources. The International Organization of Migration (IOM)
estimates that the figure likely tops one million.1 Migrants stay abroad both longer and shorter
periods of time. Seasonal or temporary migration has become a dominant phenomenon among
Moldovan migrants. As more and more people migrate, network effects in Moldova are expected
to have an increased importance, especially when it comes to migration to EU countries where
migration costs are high. Other studies regarding migration in Moldova have, explicitly and
implicitly, suggested that migration networks play an important role in migration and remittances
decisions 2 . The CBS-AXA Household survey used in this study contains more extensive
questions on migration and networks, which creates new possibilities to examine the role of
1 IOM, http://www.iom.md/migration_information.html#mirc, 2008-05-26 2 See for example Görlich and Trebesch (2006) and Sirbu (2007)
4
different types of networks on the decision to migrate. By disaggregating the migration networks
by kinship I am able to investigate in more depth the influence of different types of networks.
The purpose of the study is hence to investigate if certain types of network ties are more
influential than others in the migration decision.
The results show that migration networks have a significantly positive effect on the decision to
migrate. Different types of kinship do not seem to have different impacts. However, when
disaggregating the network variables it seems like ex-household members who migrated abroad,
and no longer make part of the household, are more influential than current household migrants.
Knowing migrants outside the household, i.e. friends, neighbours and acquaintances, also have a
strong impact on the decision to migrate.
The remainder of the paper is structured as follows: Section 2 summarizes theories on labour
migration, with particular emphasis on the role of migration networks. Section 3 gives a short
background on labour migration and migration networks in Moldova. Section 4 presents the
empirical approach. The results of the regression analysis are presented in section 5, section 6
concludes.
5
2. THEORY ON MIGRATION AND NETWORKS
International migration is an important issue on the global development agenda today, presenting
significant risks and benefits for the migrants, their families, and the countries involved. The
reasons for and the consequences of migration attract attention from both researchers and policy
makers worldwide. The challenge faced by policy makers is how to maximize the positive effects
as well as mitigate the negative effects of migration for both citizens and states.
Labour migration affects both the migrant origin and destination countries. By offering semi- and
un-skilled labour to industrialising countries, as well as highly-skilled labour to advanced
countries, migrants can contribute to economic growth in both the sending and the receiving
countries. Income flows from remittances to the migration households can raise the per capita
income, reduce labour market pressure in countries with a high excess of labour, and might
reduce the share of poor people in the population. Migration has also been proved to have
positive effects on human development outcomes such as reducing school drop-out rates, increase
money spent on private tuition for children and higher health outcomes for children. Furthermore,
migration can lead to knowledge transfers and help to overcome borrowing constraints and
technical restrictions. Additional positive effects include maintained competiveness and
economic integration. Negative consequences associated with migration are smuggling and
trafficking of migrant workers, loss of highly skilled workers (brain drain), and imbalance in the
demographic structure.3
Recent empirical studies have noted the importance of migration networks, especially when it
comes to international migration.4 Social ties of kinship, friendship and community link migrants,
former migrants and potential migrants in the home and host country. Migrants already abroad
can provide potential migrants with information on job opportunities and labour market
conditions in the destination country, modes of migration and border crossing, and direct
assistance at the destination such as job search, housing and help relaxing credit constraints.5
Migration networks vary by how much migration experience the migrants in the network have, 3 The International Migration Agenda and the World Bank, (2006), pp. 14 4 See for example Davis Stecklov and Winters (2002); Bauer Epstein and Gang (2005); Sirbu (2007) 5 McKenzie and Rapoport (2007), p.4
6
and by the strengths of ties of the individuals in the network. However, migration networks are in
most studies viewed as homogenous. Data limitation and model abstractions often restrict
researchers to investigate further details of migration networks, thus most studies overlook how
different types and compositions of networks might affect migration in different ways.
2.1 Models of Migration The most obvious reasons for people to leave their country to work abroad are the prospect of
better job opportunities, higher wages, and better living standards. Migration can also be the
result of humanitarian crises, military conflicts, political persecution etc. However, this study
focuses on labour migration of workers, and will therefore only discuss models and reasons
behind this type of migration. The determinants of labour migration are often described in terms
of “push” and “pull” factors. “Push”- factors include economic conditions, demographic pressure
and unemployment in the origin country, whereas “pull”- factors include higher wages, demand
for labour, and family reunification in the destination country6.
The literature roughly presents three main models to explain the migration decision; the neo-
classical model, the new economics of migration model, and the network theory of migration.
Neo-classical models view the decision to migrate as a cost-benefit calculation. The potential
migrant compare expected net income at the destination with expected net income in the home
country. Costs such as government regulations and, for illegal migration, the probability of
apprehension and deportation, should also be considered. Given individual characteristics, the
neo-classical model predicts migrants to choose the location with the greatest expected net
present value of income over time.7
The model of new economics of migration considers migration as a household strategy rather
than an individual decision. The individual migration decision is a result of a joint household’s
decision where household members share the costs and returns to migration. Migration is then
6 Migration and Remittances Eastern Europe and the Former Soviet Union (2006) the World Bank, p.9 7 Davis, Stecklov, Winters (2002) p.2
7
used to diversify risk and gain access to capital in the presence of market imperfections or
failures.8
In network theory of migration, or social capital theory, current and past migrants that constitute
the migration network are viewed as a form of social capital. The cost of relocation decreases
with the number of immigrants currently in, or with previous experience of, the destination
country. Previous and current migrants can provide information on for example job opportunities,
modes of migration and border crossing, as well as direct assistance at the destination such as
housing, food and transports. The networks take form with increasing migration, and migrants
use their network connections to obtain information that alters the returns to migration and lowers
the uncertainty associated with migration.9
Previous studies, in particularly from Mexico-US migration, have uncovered empirical
regularities in the migration patterns over time. Studies found that the first migrants from a
community usually are male of working age, married, and not so poor that they can’t afford to
migrate, but without enough recourses to make migration unattractive. Over time, when the
proportion of people with migration experience increases within the community, the migration
flow starts to include younger unmarried men, and eventually also women and children. In
communities with a well-developed migratory tradition, non-migrants have access to valuable
social capital that facilitates and encourage additional migration. 10 Networks thus serve as
catalysts for migration. As migration gradually increases over time, migration capital within the
network forms and deepens.
In line with the discussion by Davis et al. 11 my intention is not to test the validity of these
models, or assume that one model exclude another, but rather consider them as complementary.
Each model contributes with some insight in trying to explain the driving forces behind migration.
The network theory of migration can be seen as enhancing the neoclassical model and the model
of new economics of migration. The neoclassical model implies that individual characteristics as
well as social conditions and technologies may have an impact on the decision to migrate. 8 Davis, Stecklov and Winters (2002); Davis and Winters (2000) p.4 9 Davis, Stecklov, Winters (2002) p.2 10 Massey et. al. (1994) p. 1492 11 Davis, Stecklov, Winters (2002)
8
Education, experience, gender and age might influence income and employment opportunities at
each location. Individual characteristics and social conditions may also have an impact on the
cost of migration. From the new economics of migration model we learn that migration might be
part of a household strategy and it is thus relevant to control for household characteristics that
reflect the household’s vulnerability and ability to respond to risk. The network theory of
migration adds the importance of networks in providing information and assistance to potential
migrants. Both weak and strong networks might play a role in the migration decision.12
2.2 Measuring migration networks Although the role of networks has got some attention in recent studies, data limitations and model
abstractions have bound detailed investigations about network compositions. Migrant networks
have generally been considered as homogenous, without making any distinction between the
different types of relations that connect individuals within the network. A common way to
capture network effects in empirical studies is to look at the number of people from the migrant’s
home country currently in the host region, alternatively the number of people speaking the
migrant’s native language.13 Another measure commonly used as a network variable is whether
the migrant knows any other migrants at the destination14 . These measures fail to take into
account that different compositions and structures of the networks might influence the migration
decision differently. One could expect that networks with stronger ties, such as individuals within
the same family, and weaker ties, like acquaintances and individuals from the same community,
vary when it comes to the value of the information and assistance that the network provides.
2.3 Previous studies
Previous empirical studies indicate that networks play an important role in international
migration. A study of Mexico-US migration that examines the role of networks in determining
self-selection patterns proved that the probability of migration is increasing with education in
communities with low migrant networks, whereas it is decreasing with education in high migrant
12 Davis, Stecklov and Winters (2002); Davis and Winters (2001) 13 Bauer, Epstein, Gang (2005), p.4 14 see for example Görlich and Trebesch (2006)
9
network communities.15 In another study of Mexico- US migration, including 7000 households in
52 Mexican communities, two origin-village-specific effects (the origin-village’s total experience
in the host region and the total number of origin-village members currently in the region) were
included to represent network variables. The results found that as the size of the network
increases, the probability of choosing the particular location increases. The village-specific
effects turned out to be important in the migrant’s location decision. However, the relationship
was found to be inversely U-shaped, a large number of immigrants decrease the probability of
choosing a particular location.16
A study of labour migration in China proved that network effects extended beyond families
create spill over effects. Experienced migrants (i.e. migrants that spent in total 48 months or more
abroad) were proved to have significant impact on migration decisions, whereas returnees (those
who had previous experience of migration but were not migrants by the time of the survey) had a
positive but insignificant effect on migration decisions.17 One of the few studies that consider
how network composition influences migration highlights the complexity of network effects on
migration decisions. The impact of migration networks in Mexico-US migration proved not to be
homogenous, instead it was found that the closer the bond, the greater the impact on the
migration decision.18
According to both theory and empirical studies migration networks thus have important policy
implication. With migration networks, migration can become a self-sustaining and self enforcing
process. As networks grow the remaining workers possess more extensive information on
migration that facilitates migration.19
15 McKenzie and Rapoport (2007) 16 Bauer, Epstein and Gang (2000) 17 Zhao (2003) 18 Davis, Stecklov and Winter (2007) 19 Zhao (2003), p.510
10
3. LABOUR MIGRATION IN MOLDOVA
The prevalence of labour migration in Moldova is high, and has steadily increased during recent
years. When the Russian economy declined in the early 1990s Moldova experienced a severe
economic decline and became the poorest country in Europe. The collapse in the Moldovan
economy was greater than in many other Soviet Republics, and many workers didn’t see any
other solution than to seek job opportunities abroad. The recovery and growth of the economy
after 1999 was primarily driven by the inflow of remittances. Remittances from abroad prevented
an even more severe collapse of the economy, and reduced the government’s dependence on
conditionality-based borrowing. The IMF country report from 2005 states that at least one fourth
of the economically active population in Moldova has emigrated, and the emigration flow has
continued to grow steadily.20 In line with the increasing labour migration from Moldova, the
amount and importance of remittances also increases. According to the World Bank, Moldova is
the third largest net receiver of remittances in the World, and the Moldovan economy relies
heavily on money sent home by workers abroad. Migrants’ remittances represent over 20% of
Moldova’s GDP, and bring in half as much foreign exchange as exports does.21
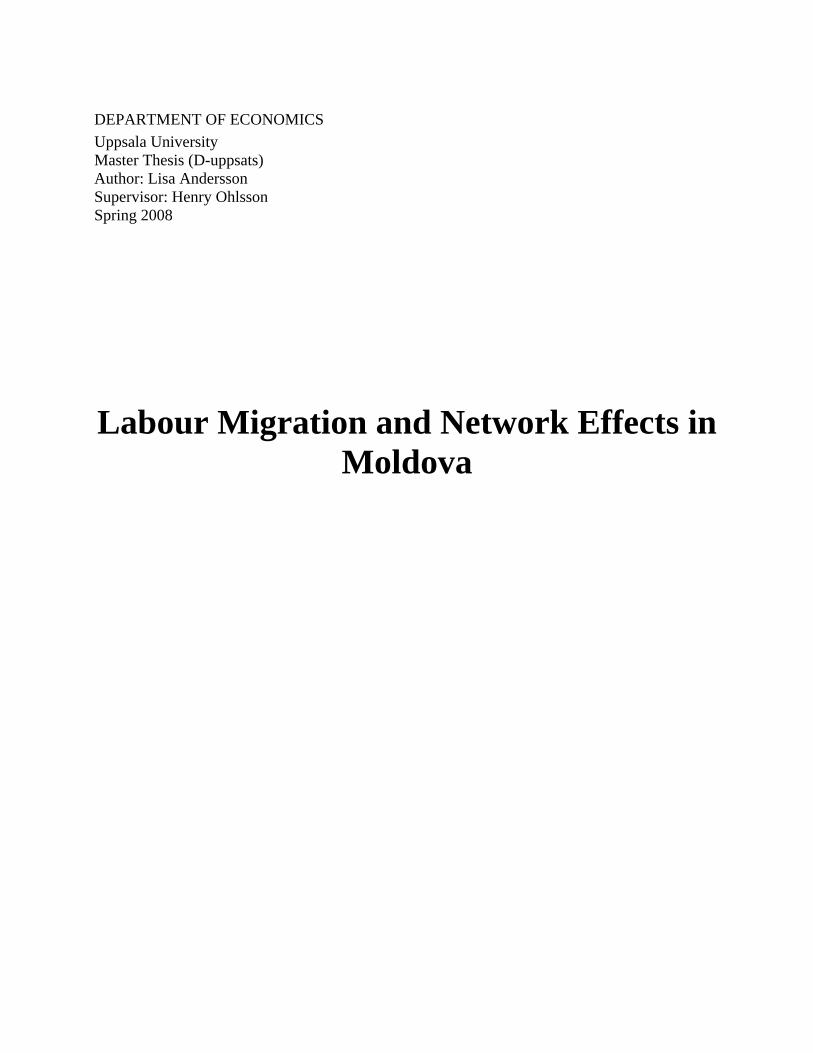
The majority of the Moldovan migrants are young, married men. Migration flows to CIS
countries, primarily to Russia, have previously dominated. However, migration to West and
Southwest countries has increased lately, and Mediterranean countries with large informal sectors
are becoming more and more attractive to Moldovan migrants. 22 The Moldovan migration
population can generally be divided into two broad groups. The first group contains rural, often
male and relatively poor migrants with large families. This group tends to migrate to Russia or
other CIS countries that offer job opportunities in the construction sector, and where migration
costs are low. The second group is dominated by migrants from wealthier and better-educated
urban households. A majority of these migrants are women, and tend to go to EU countries,
mostly Italy and Portugal. Moldovan migrants go abroad in search of work for both longer and
shorter periods of time. In line with other post-communist countries in Central and Eastern
20 Republic of Moldova: Selected Issues, IMF, 2005 21 Pinger (2007) 22 Migration perspectives; Eastern Europe and Central Asia, IOM (2006) p.56
11
Europe, seasonal and temporary migration has become a common phenomenon in Moldova.23
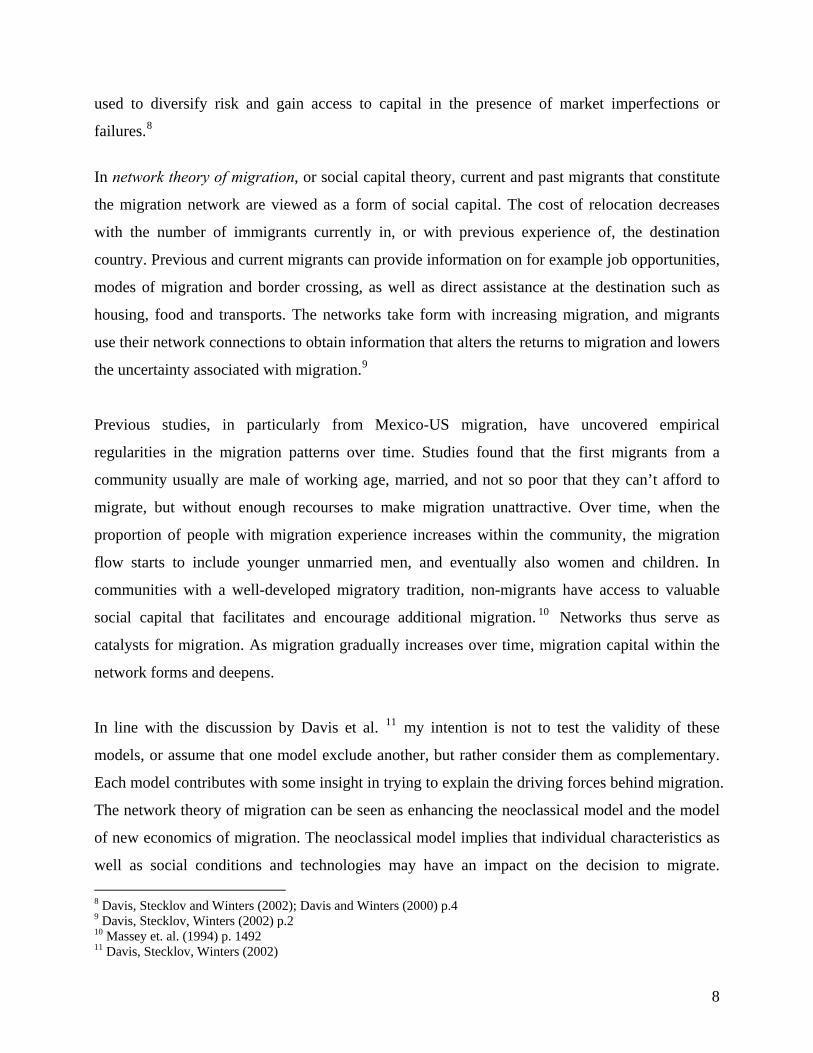
The time that the migrant spend abroad varies depending on the destination country and costs
involved in the migration. One study reports that the general average duration of migration
obtained within the sample was 20 months. For migration to CIS countries the average was 17
months, and migrants to Western countries (Italy, Portugal, and Spain) stayed abroad for about 25
months.24 There are seasonal peaks, when most of the migrants are abroad and other times, when
a large share returns for vacation, medical treatment etc.25
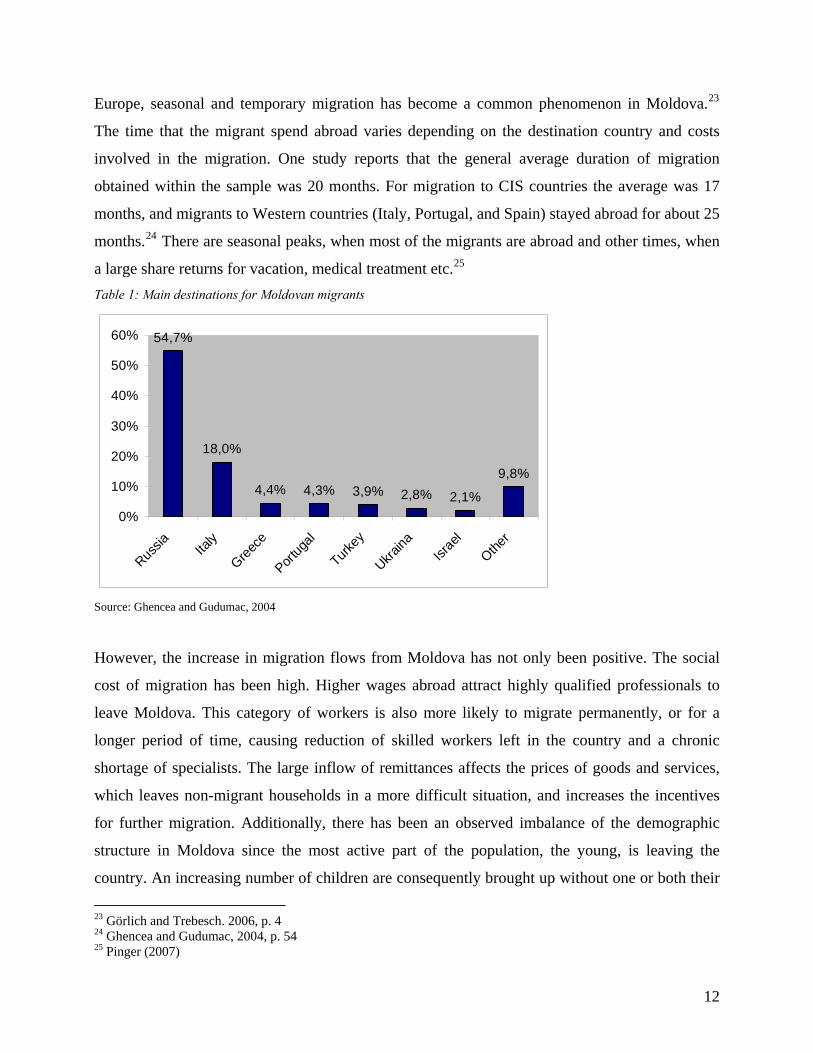
Table 1: Main destinations for Moldovan migrants
54,7%
18,0%
4,4% 4,3% 3,9% 2,8% 2,1%
9,8%
0%
10%
20%
30%
40%
50%
60%
Russia Ita
ly
Greece
Portug
al
Turkey
Ukraina
Israe
lOthe
r
Source: Ghencea and Gudumac, 2004
However, the increase in migration flows from Moldova has not only been positive. The social
cost of migration has been high. Higher wages abroad attract highly qualified professionals to
leave Moldova. This category of workers is also more likely to migrate permanently, or for a
longer period of time, causing reduction of skilled workers left in the country and a chronic
shortage of specialists. The large inflow of remittances affects the prices of goods and services,
which leaves non-migrant households in a more difficult situation, and increases the incentives
for further migration. Additionally, there has been an observed imbalance of the demographic
structure in Moldova since the most active part of the population, the young, is leaving the
country. An increasing number of children are consequently brought up without one or both their
23 Görlich and Trebesch. 2006, p. 4 24 Ghencea and Gudumac, 2004, p. 54 25 Pinger (2007)
12
parents. Moldova has also experienced severe problems with human trafficking related to
migration.26
3.1 Migration Networks in Moldova
A few studies have, at least implicitly, investigated the effects of migration networks in Moldova.
A study of the determinants of seasonal migration in Moldova based on the CBS-AXA
Household Survey 2005 shows that migration networks have a strong impact on migration
probability in urban settings. Community networks, defined as the prevalence of migrants in the
community, did not seem to have any effect on the decision to migrate seasonally versus
permanently. However, seasonal community networks had a significantly positive impact on
seasonal migration. Family migration experience also proved to be positively related to seasonal
migration.27 Another study of migration in Moldova found that knowing other migrants increases
the probability of other individuals to migrate by 4, 5 %. 28
26 IOM (2006) 27 Görlich and Trebesch (2006) 28 Sirbu (2007)
13
4. EMPIRICAL APPROACH The purpose of this study is to take a closer look at whether, and in that case how, different types
of networks influence the decision to migrate. Incorporating greater details of network structures
could clarify whether there are functional similarities for certain types of kinship and community
relations. The network variables are usually restricted to be measured by one or two simple
community or family network variables. The dataset used in this study offers more specific and
detailed information on migration networks, which enables further differentiation of the network
variables. An assumption is that individuals with valuable information on migration are those
with previous or current experience of migration. Current migrants can also provide direct
assistance to potential migrants. Furthermore, the level of information and assistance provided is
assumed to be dependent on the strength of the ties to the potential migrant. Family members are
assumed to have the strongest ties to the potential migrant, followed by extended family, and
further people outside the family.
4.1 Data and Sample Description
The data used in this study derives from a recent cross-sectional household survey conducted
between June and August 2006. The survey was commissioned by the International Organization
for Migration in Moldova, and administered by the CBS-AXA survey agency in Moldova. It
builds upon and updates a similar survey conducted in 2004, and is likely the most recent and
complete survey on Moldovan migration to date. The data set contains observations of 14 102
individuals in 3 940 households, quasi-random sample29. Out of the 3 940 households included in
the survey, 1 495 reported that they had at least one current or ex-household member working
abroad. Some households had more than one member abroad, so the dataset includes migration
details of 2 081 migrants.
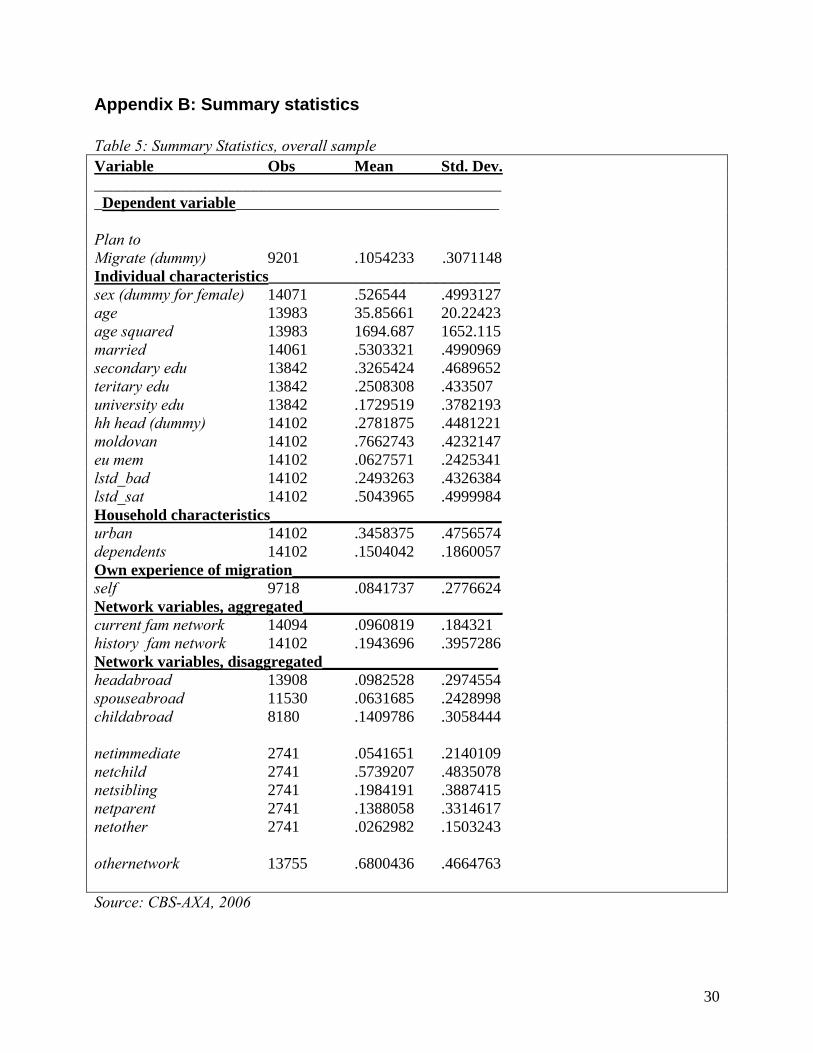
A quick look at the summary statistics30 reveals that men in the survey are slightly more likely to
plan to migrate than the women. Individuals who plan to migrate are in general younger than
those who do not plan to migrate; the mean age is 34 years compared to 45 years for individuals
29 More information on the sampling procedure can be found in Appendix C. 30 found in table 5 and 6 in Appendix B
14
who don’t plan to migrate. Those who plan to migrate also have slightly higher education level.
A distinct difference between individuals who plan and those who don’t plan to migrate in the
survey is the previous experience of migration. 39, 5 percent of the individuals who plan to
migrate have previous experience of migration, whereas the figure for the overall sample is 8
percent, and for individuals who don’t plan to migrate 5 percent. Individuals who plan to migrate
are also more likely to know a migrant outside the household who already migrated. When it
comes to other network variables, it is slightly more common that individuals who plan to
migrate come from households with current or ex-household members abroad.
4.2 Model specification
According to to the models presented in section 2 the decision to migrate can be seen either as an
individual decision or a decision at the household level. Evidence from previous empirical studies
indicates that individual characteristics play a role in the decision to migrate and should not be
excluded. The decision to migrate will, therefore, in this study be consider as an individual
decision.
To be able to investigate how network compositions affect the migration decision, I disaggregate
the network variable by the potential migrant’s relationship to the migrants in the network. A set
of network variables are created, containg both current household members who work abroad,
and ex-household members who previously migrated and no longer are seen as household
members. As the dependent variable I use a dummy for whether the individual plans to migrate
abroad. All individuals above 16 years in the survey were asked whether they plan to migrate in
the near future or not. However, in my regressions I have omitted all individuals below 18 years
old since they are under legal protection of their parents and unable to cross the border without
permission from the parents. Logit regressions are then carried out, complemented by linear
regressions as a robustness check. The regressions have the following functional form:
P(y=1|X)=G(Xβ).
15
Y reflects whether the individual plans to migrate or not, X is a vector of the control variables
including household-, individual-, and community variables, along with a set of network
variables.
More specifically, the regressions follow the pattern;
Plan to migrate (dummy)= β1X (individual characteristics) + β2X (household characteristics)
+β3X (own experience of migration)+ β4X (network variables) + ε
The explanatory variables in the regressions can be divided into four broad categories; individual
characteristics, household characteristics, the potential migrant´s previous experience of
migration, and migration networks. According to the neo-classical model discussed in section 2,
individual and household characteristics such as age, gender, education and assets might
influence the migration decision. From the dataset a number of individual and household
characteristics has been constructed, which are used as control variables in the regressions. More
detailed variable descriptions of all control variables and network variables can be found in
Appendix D. Since most household have more than one member, values of individual and
household characteristics are not independently distributed, which in turn might affect the
regression’s standard errors. To avoid this, all standard errors in the regressions are clustered by
household. The cluster option is also in commands with the robust option.
Ideally, I would like to include more variables on household/community level that might affect
the decision to migrate, for example land assets and wage levels that are expected to influence the
decision to migrate. Unfortunately the dataset does not contain this kind of information.
As for the network variables, a set of different variables to represent an individual’s migration
network is specified. The hypothesis is that the decision to migrate is influenced by both current
and past members of the household with migration experience, as well as the strength of ties to
the potential migrant. The network variables are therefore composed along two dimensions;
current and ex-members of household who migrated, and the migrant’s strength of ties to the
household members based on kinship. Current household members means household members
who at the time of the study were abroad to work but still make part of the household.
16
5. RESULTS In order to investigate how migration networks influence the decision to migrate, I first use some
general descriptive statistics on migration incentives and networks to serve as a starting point for
the discussion. This is followed by the results of the regression analysis. I start with a general
model specification of determinants of migration, where aggregated measures of migration
networks are used. Finally, in order to investigate what possible impact different kinds of
network ties have on the decision to migrate, regressions with disaggregated migration networks
are carried out.
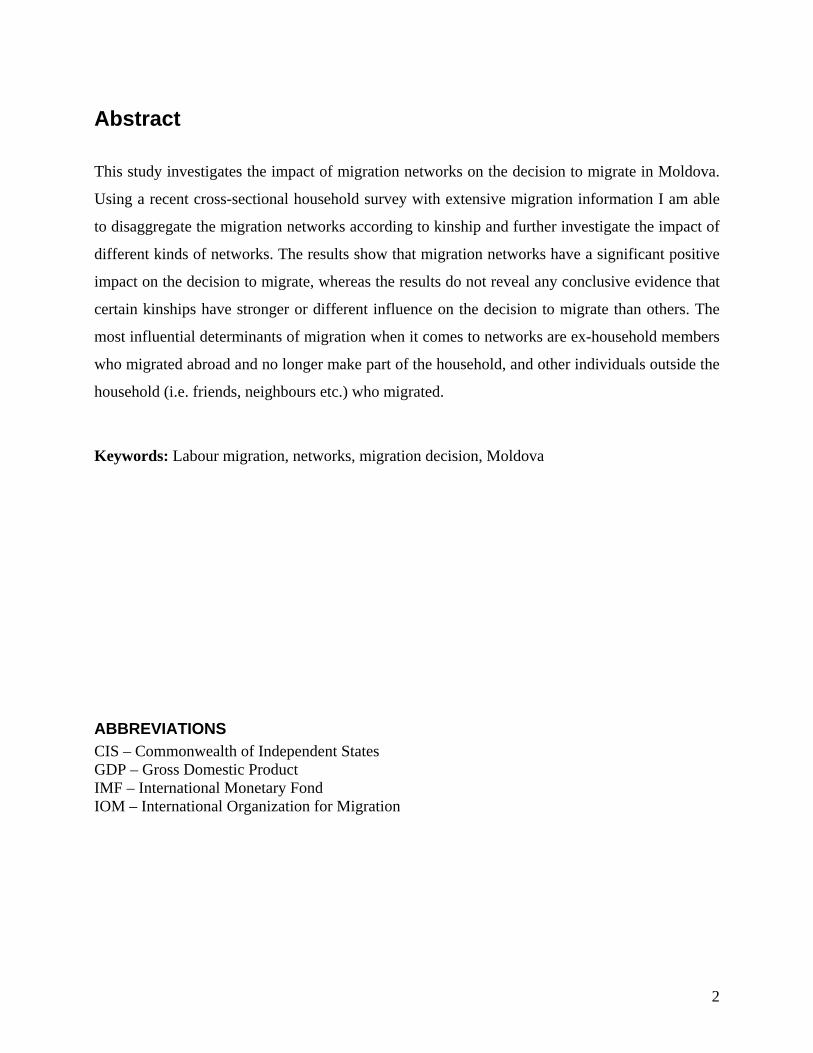
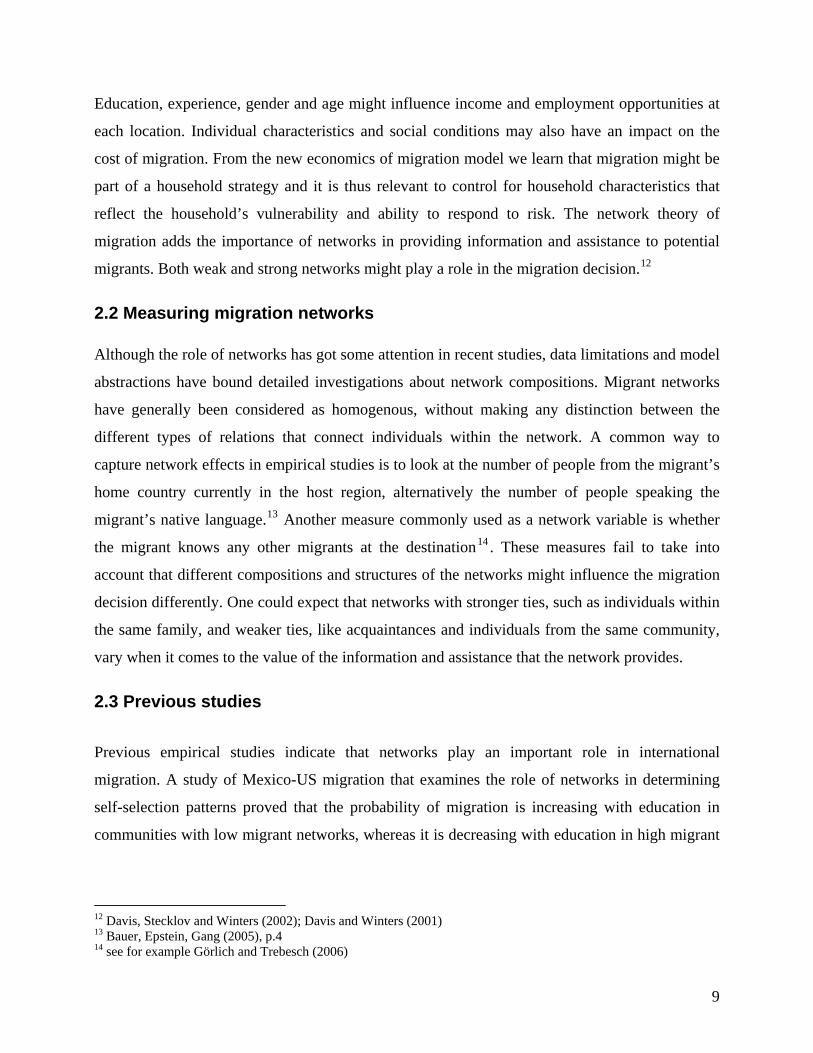
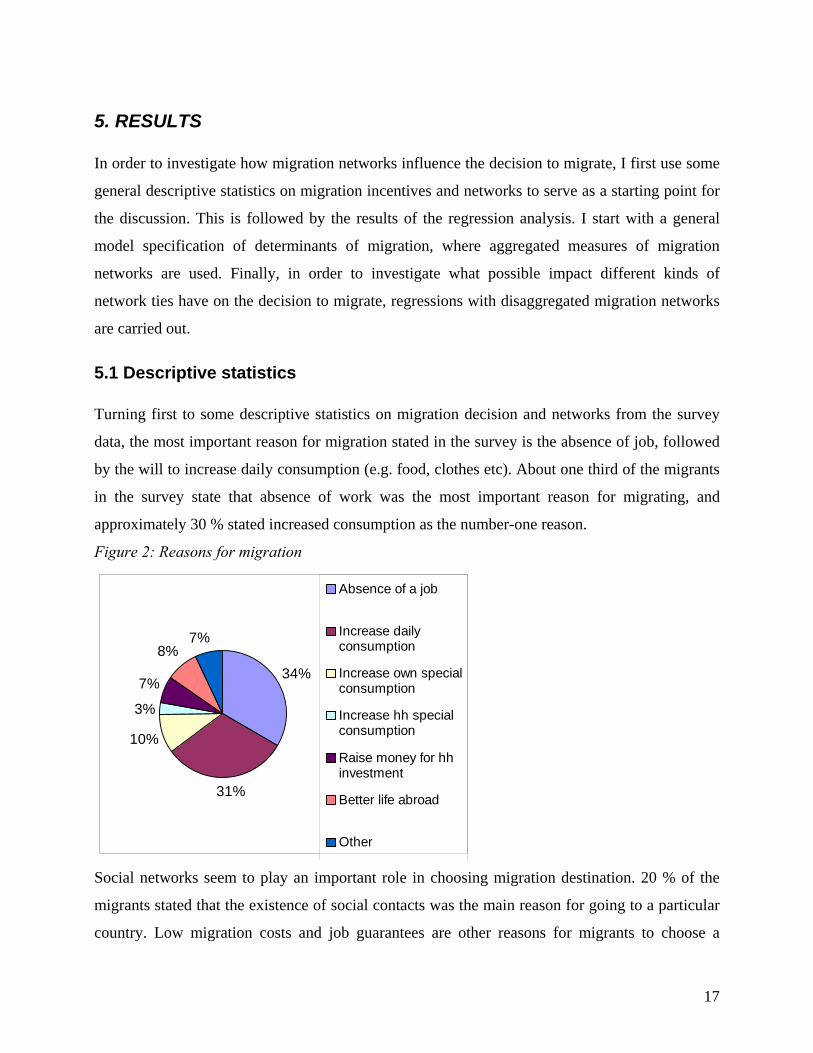
5.1 Descriptive statistics Turning first to some descriptive statistics on migration decision and networks from the survey
data, the most important reason for migration stated in the survey is the absence of job, followed
by the will to increase daily consumption (e.g. food, clothes etc). About one third of the migrants
in the survey state that absence of work was the most important reason for migrating, and
approximately 30 % stated increased consumption as the number-one reason.
Figure 2: Reasons for migration
34%
31%
10%
3%
7%
8%7%
Absence of a job
Increase dailyconsumption
Increase own specialconsumption
Increase hh specialconsumption
Raise money for hhinvestment
Better life abroad
Other
Social networks seem to play an important role in choosing migration destination. 20 % of the
migrants stated that the existence of social contacts was the main reason for going to a particular
country. Low migration costs and job guarantees are other reasons for migrants to choose a
17
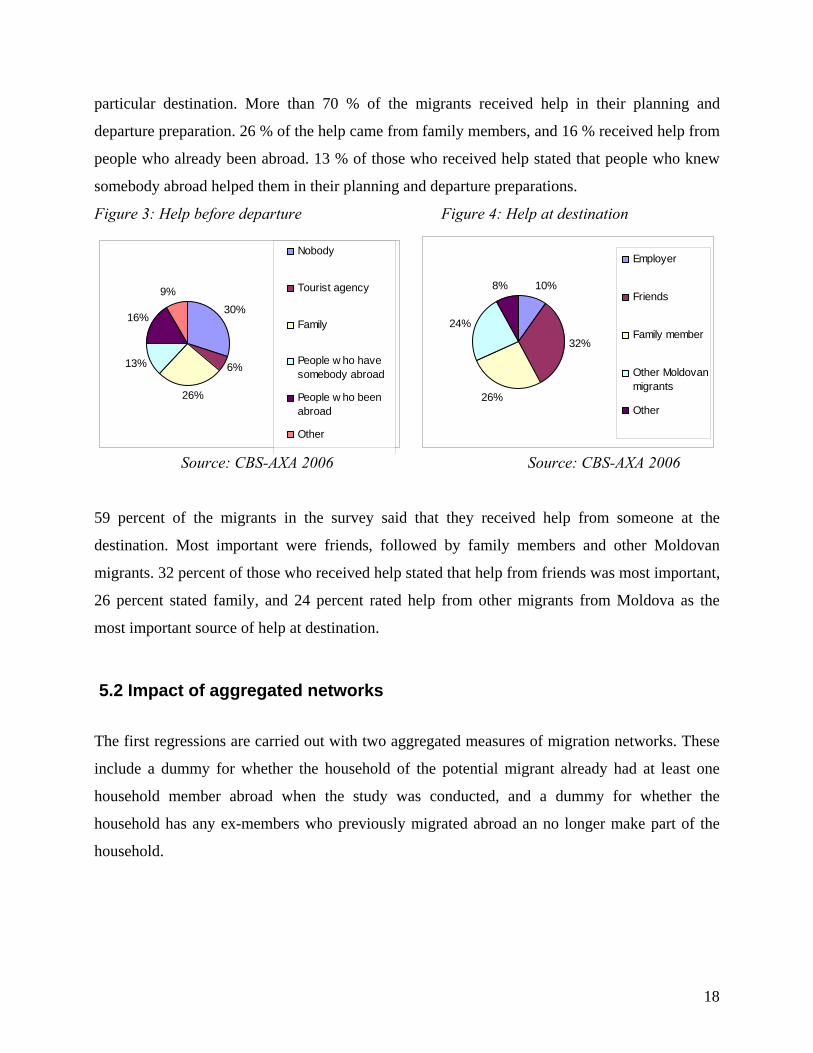
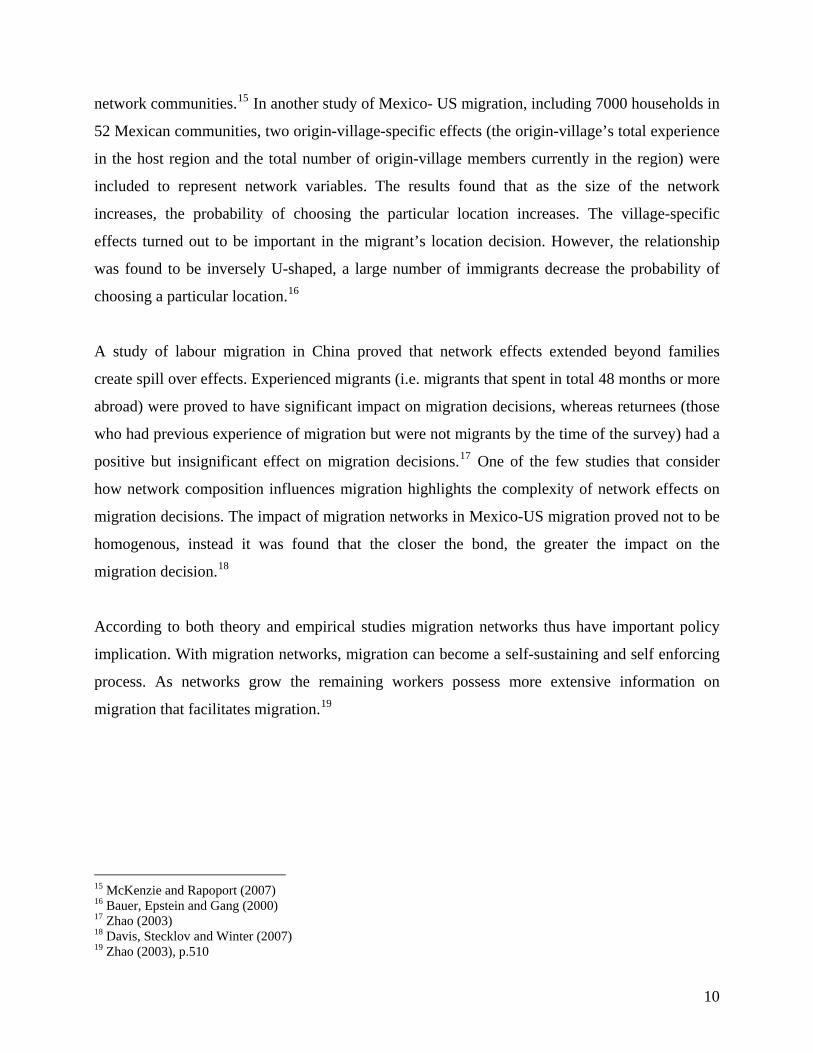
particular destination. More than 70 % of the migrants received help in their planning and
departure preparation. 26 % of the help came from family members, and 16 % received help from
people who already been abroad. 13 % of those who received help stated that people who knew
somebody abroad helped them in their planning and departure preparations.
Figure 3: Help before departure Figure 4: Help at destination
30%
6%
26%
13%
16%
9%
Nobody
Tourist agency
Family
People w ho havesomebody abroad
People w ho beenabroad
Other
10%
32%
26%
24%
8%
Employer
Friends
Family member
Other Moldovanmigrants
Other
Source: CBS-AXA 2006 Source: CBS-AXA 2006
59 percent of the migrants in the survey said that they received help from someone at the
destination. Most important were friends, followed by family members and other Moldovan
migrants. 32 percent of those who received help stated that help from friends was most important,
26 percent stated family, and 24 percent rated help from other migrants from Moldova as the
most important source of help at destination.
5.2 Impact of aggregated networks
The first regressions are carried out with two aggregated measures of migration networks. These
include a dummy for whether the household of the potential migrant already had at least one
household member abroad when the study was conducted, and a dummy for whether the
household has any ex-members who previously migrated abroad an no longer make part of the
household.
18
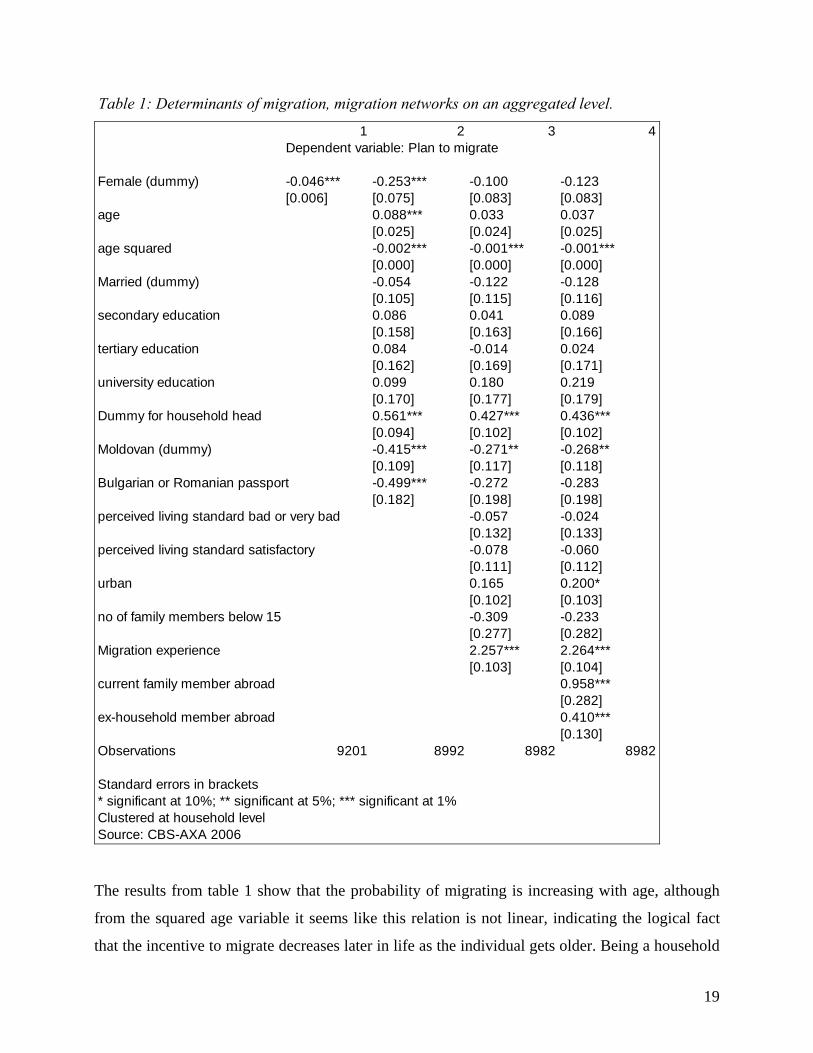
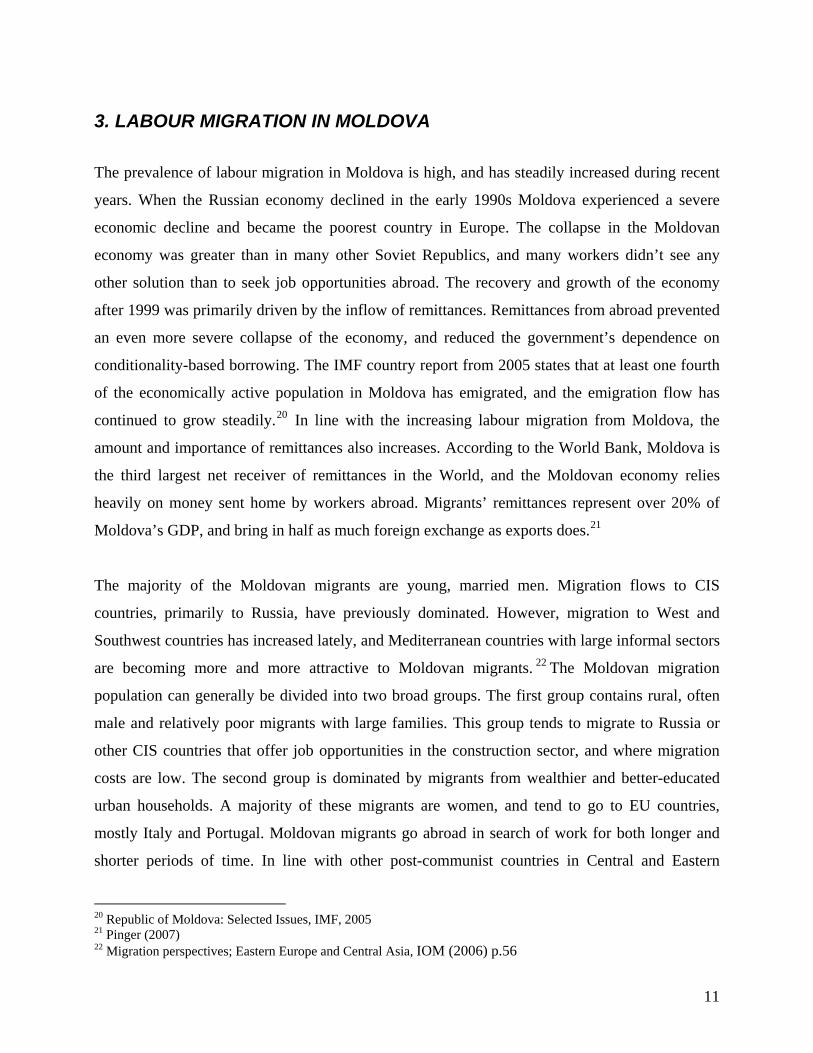
Table 1: Determinants of migration, migration networks on an aggregated level.
1 2 3Dependent variable: Plan to migrate
Female (dummy) -0.046*** -0.253*** -0.100 -0.123[0.006] [0.075] [0.083] [0.083]
age 0.088*** 0.033 0.037[0.025] [0.024] [0.025]
age squared -0.002*** -0.001*** -0.001***[0.000] [0.000] [0.000]
Married (dummy) -0.054 -0.122 -0.128[0.105] [0.115] [0.116]
secondary education 0.086 0.041 0.089[0.158] [0.163] [0.166]
tertiary education 0.084 -0.014 0.024[0.162] [0.169] [0.171]
university education 0.099 0.180 0.219[0.170] [0.177] [0.179]
Dummy for household head 0.561*** 0.427*** 0.436***[0.094] [0.102] [0.102]
Moldovan (dummy) -0.415*** -0.271** -0.268**[0.109] [0.117] [0.118]
Bulgarian or Romanian passport -0.499*** -0.272 -0.283[0.182] [0.198] [0.198]
perceived living standard bad or very bad -0.057 -0.024[0.132] [0.133]
perceived living standard satisfactory -0.078 -0.060[0.111] [0.112]
urban 0.165 0.200*[0.102] [0.103]
no of family members below 15 -0.309 -0.233[0.277] [0.282]
Migration experience 2.257*** 2.264***[0.103] [0.104]
current family member abroad 0.958***[0.282]
ex-household member abroad 0.410***[0.130]
Observations 9201 8992 8982 8982
Standard errors in brackets* significant at 10%; ** significant at 5%; *** significant at 1%Clustered at household levelSource: CBS-AXA 2006
4
The results from table 1 show that the probability of migrating is increasing with age, although
from the squared age variable it seems like this relation is not linear, indicating the logical fact
that the incentive to migrate decreases later in life as the individual gets older. Being a household
19
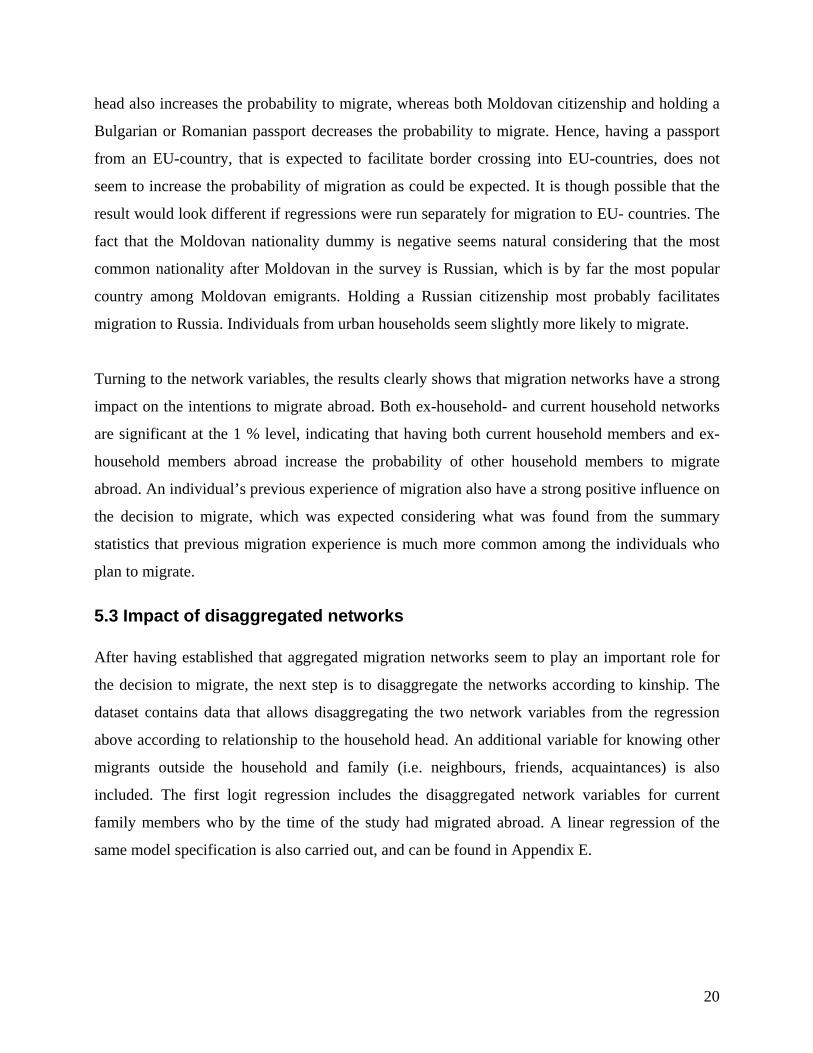
head also increases the probability to migrate, whereas both Moldovan citizenship and holding a
Bulgarian or Romanian passport decreases the probability to migrate. Hence, having a passport
from an EU-country, that is expected to facilitate border crossing into EU-countries, does not
seem to increase the probability of migration as could be expected. It is though possible that the
result would look different if regressions were run separately for migration to EU- countries. The
fact that the Moldovan nationality dummy is negative seems natural considering that the most
common nationality after Moldovan in the survey is Russian, which is by far the most popular
country among Moldovan emigrants. Holding a Russian citizenship most probably facilitates
migration to Russia. Individuals from urban households seem slightly more likely to migrate.
Turning to the network variables, the results clearly shows that migration networks have a strong
impact on the intentions to migrate abroad. Both ex-household- and current household networks
are significant at the 1 % level, indicating that having both current household members and ex-
household members abroad increase the probability of other household members to migrate
abroad. An individual’s previous experience of migration also have a strong positive influence on
the decision to migrate, which was expected considering what was found from the summary
statistics that previous migration experience is much more common among the individuals who
plan to migrate.
5.3 Impact of disaggregated networks After having established that aggregated migration networks seem to play an important role for
the decision to migrate, the next step is to disaggregate the networks according to kinship. The
dataset contains data that allows disaggregating the two network variables from the regression
above according to relationship to the household head. An additional variable for knowing other
migrants outside the household and family (i.e. neighbours, friends, acquaintances) is also
included. The first logit regression includes the disaggregated network variables for current
family members who by the time of the study had migrated abroad. A linear regression of the
same model specification is also carried out, and can be found in Appendix E.
20
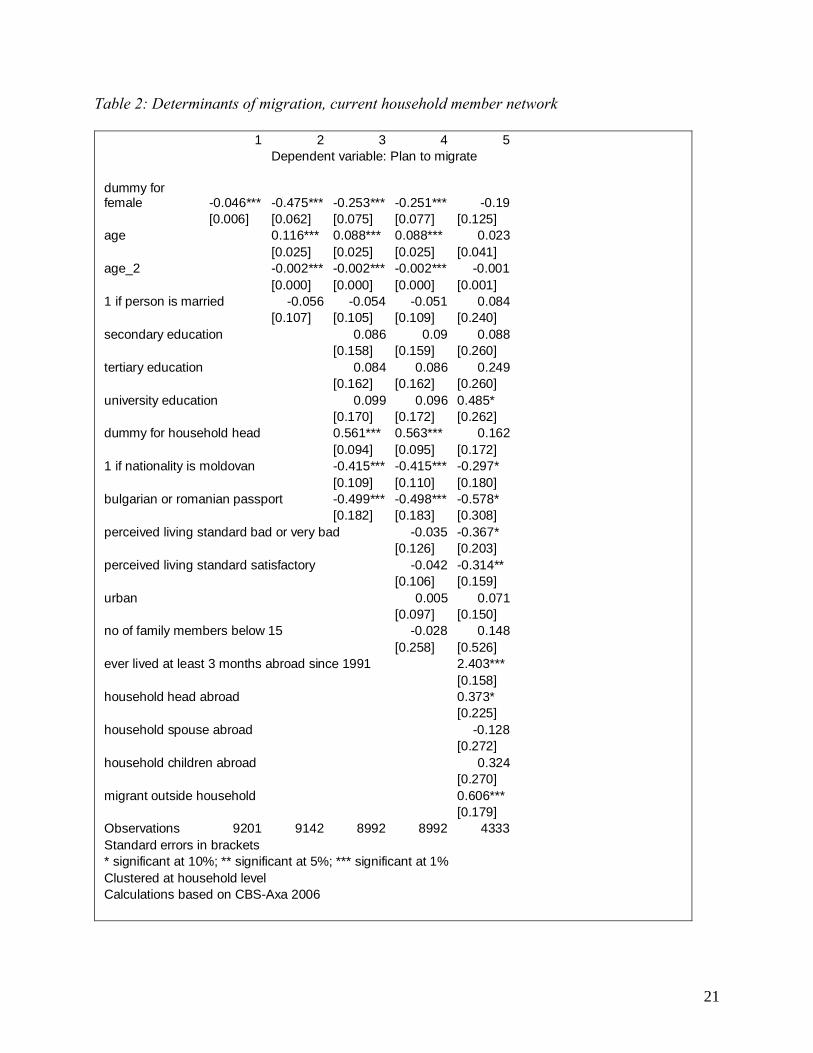
Table 2: Determinants of migration, current household member network
1 2 3 4 5 Dependent variable: Plan to migrate dummy for female -0.046*** -0.475*** -0.253*** -0.251*** -0.19 [0.006] [0.062] [0.075] [0.077] [0.125] age 0.116*** 0.088*** 0.088*** 0.023 [0.025] [0.025] [0.025] [0.041] age_2 -0.002*** -0.002*** -0.002*** -0.001 [0.000] [0.000] [0.000] [0.001] 1 if person is married -0.056 -0.054 -0.051 0.084 [0.107] [0.105] [0.109] [0.240] secondary education 0.086 0.09 0.088 [0.158] [0.159] [0.260] tertiary education 0.084 0.086 0.249 [0.162] [0.162] [0.260] university education 0.099 0.096 0.485* [0.170] [0.172] [0.262] dummy for household head 0.561*** 0.563*** 0.162 [0.094] [0.095] [0.172] 1 if nationality is moldovan -0.415*** -0.415*** -0.297* [0.109] [0.110] [0.180] bulgarian or romanian passport -0.499*** -0.498*** -0.578* [0.182] [0.183] [0.308] perceived living standard bad or very bad -0.035 -0.367* [0.126] [0.203] perceived living standard satisfactory -0.042 -0.314** [0.106] [0.159] urban 0.005 0.071 [0.097] [0.150] no of family members below 15 -0.028 0.148 [0.258] [0.526] ever lived at least 3 months abroad since 1991 2.403*** [0.158] household head abroad 0.373* [0.225] household spouse abroad -0.128 [0.272] household children abroad 0.324 [0.270] migrant outside household 0.606*** [0.179] Observations 9201 9142 8992 8992 4333Standard errors in brackets * significant at 10%; ** significant at 5%; *** significant at 1% Clustered at household level Calculations based on CBS-Axa 2006
21
Again both Moldovan citizenship and holding a Bulgarian or Romanian passport is decreasing
the probability to migrate. A little bit surprising is the fact that an individual who perceives
his/her living standard as bad or satisfactory is less likely to plan to migrate. Being poor is
expected to be one of the strongest driving forces of migration. However, migration is costly and
the poorest individuals might not afford to go abroad. Females seem to be less motivated to
migrate, even though the variable is not significant in the last specification, which confirms
previous findings that migration is still more common among men. The age variables are both
significant up to the last specification. Previous experience of migration has a significant positive
impact on the decision to migrate.
Out of the household network variables, only the variable for household head is significant (at the
10 % level), indicating that if the household head have migrated it increases the probability that
another individual of the household is planning to migrate. The variable for children migrants in
the household is positive but not significant. The fact that the variable for spouse is negative is
interesting. It implies that if the spouse of the household has migrated it is less likely for other
individuals in the household to migrate, although the variable is not significant. The most
significant variable of the network variables is knowing another individual outside the household
who migrated abroad. In contrast to what has previously been suggested it thus seems like
knowing migrants outside the family has a stronger impact for an individual’s decision to migrate
than do networks that consists of migrants with a close bond to the potential migrant. These
findings could in part be explained by the fact that it is a lot more common among the individuals
in the survey to know another migrant outside the family than to have migrants within the own
household.
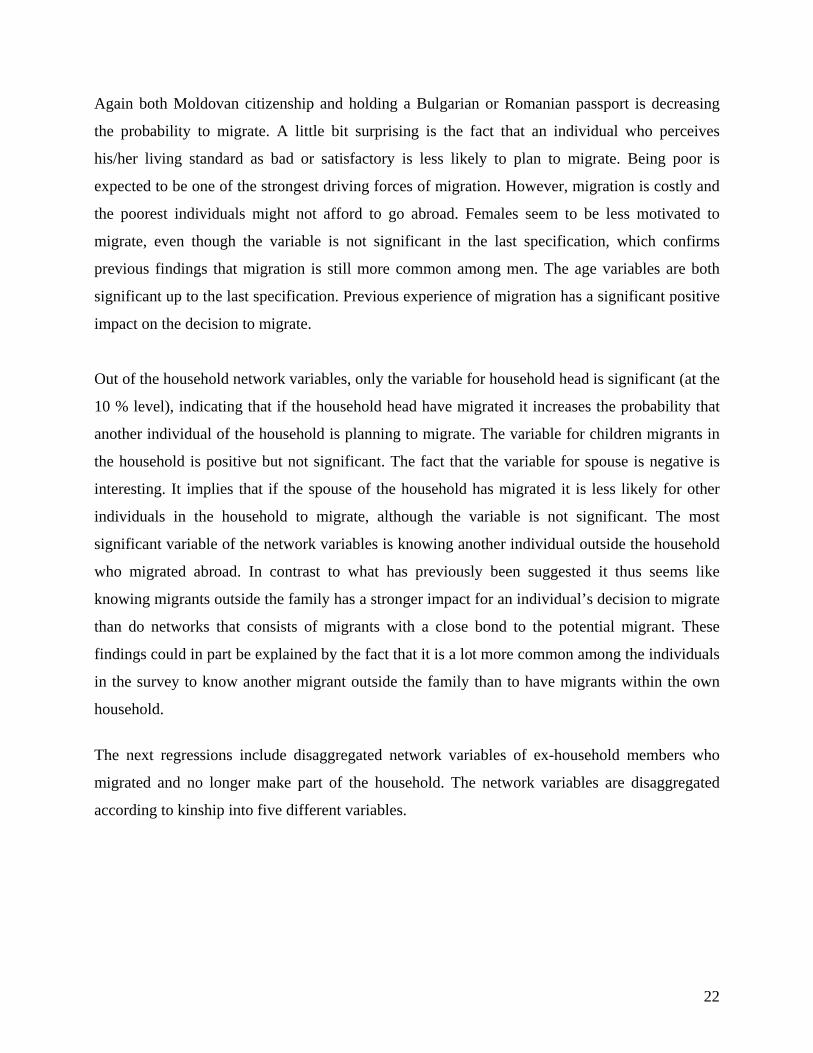
The next regressions include disaggregated network variables of ex-household members who
migrated and no longer make part of the household. The network variables are disaggregated
according to kinship into five different variables.
22
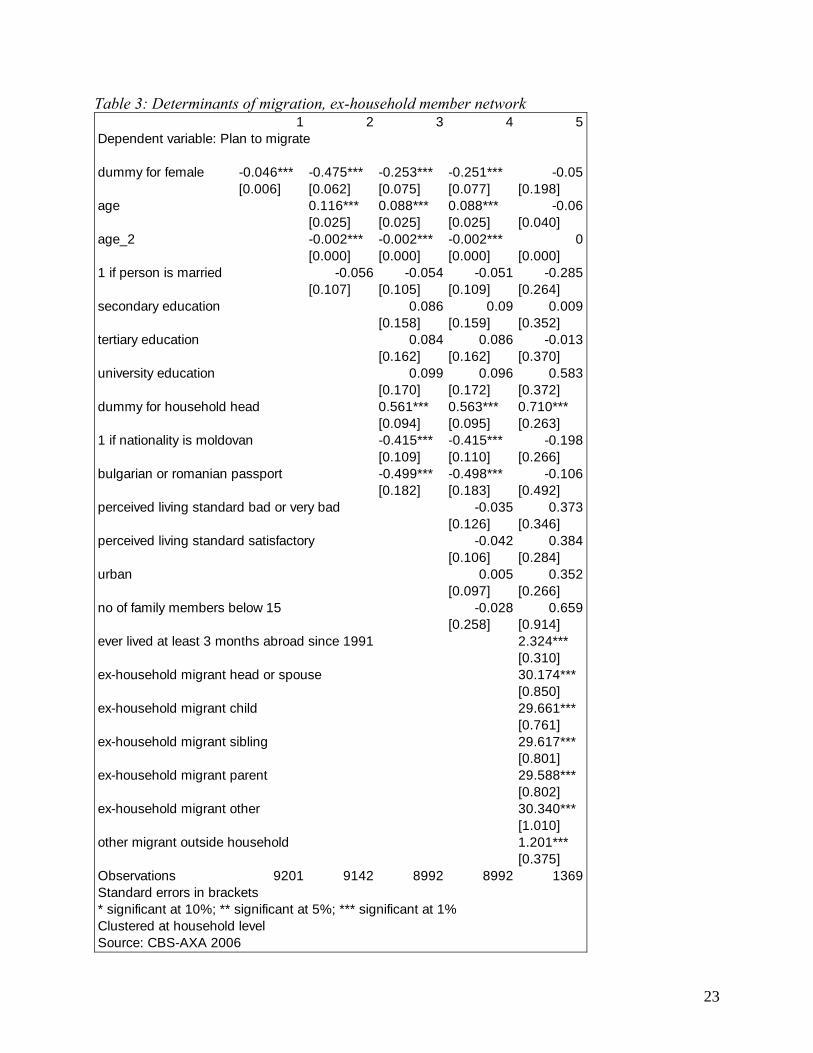
Table 3: Determinants of migration, ex-household member network 1 2 3 4 5
Dependent variable: Plan to migrate
dummy for female -0.046*** -0.475*** -0.253*** -0.251*** -0.05[0.006] [0.062] [0.075] [0.077] [0.198]
age 0.116*** 0.088*** 0.088*** -0.06[0.025] [0.025] [0.025] [0.040]
age_2 -0.002*** -0.002*** -0.002*** 0[0.000] [0.000] [0.000] [0.000]
1 if person is married -0.056 -0.054 -0.051 -0.285[0.107] [0.105] [0.109] [0.264]
secondary education 0.086 0.09 0.009[0.158] [0.159] [0.352]
tertiary education 0.084 0.086 -0.013[0.162] [0.162] [0.370]
university education 0.099 0.096 0.583[0.170] [0.172] [0.372]
dummy for household head 0.561*** 0.563*** 0.710***[0.094] [0.095] [0.263]
1 if nationality is moldovan -0.415*** -0.415*** -0.198[0.109] [0.110] [0.266]
bulgarian or romanian passport -0.499*** -0.498*** -0.106[0.182] [0.183] [0.492]
perceived living standard bad or very bad -0.035 0.373[0.126] [0.346]
perceived living standard satisfactory -0.042 0.384[0.106] [0.284]
urban 0.005 0.352[0.097] [0.266]
no of family members below 15 -0.028 0.659[0.258] [0.914]
ever lived at least 3 months abroad since 1991 2.324***[0.310]
ex-household migrant head or spouse 30.174***[0.850]
ex-household migrant child 29.661***[0.761]
ex-household migrant sibling 29.617***[0.801]
ex-household migrant parent 29.588***[0.802]
ex-household migrant other 30.340***[1.010]
other migrant outside household 1.201***[0.375]
Observations 9201 9142 8992 8992 1369Standard errors in brackets* significant at 10%; ** significant at 5%; *** significant at 1%Clustered at household levelSource: CBS-AXA 2006
23
In the regressions in table 3 all network variables are positive and significant at the 1 % level.
Migration networks outside the household and own experience of migration are also positive and
significant at the 1 % level. When looking at the linear regression specification in table 8 (in the
appendix) we see that again almost all network variables are significant and positively correlated
with the dependent variable, although only significant on a 5% or 10% level. The variable for
other household members, with weaker ties to the household head, is not significant, which gives
some support to the assumption that networks with stronger kinship ties are more influential than
those with weaker ties, although this result is not confirmed in any other regression.
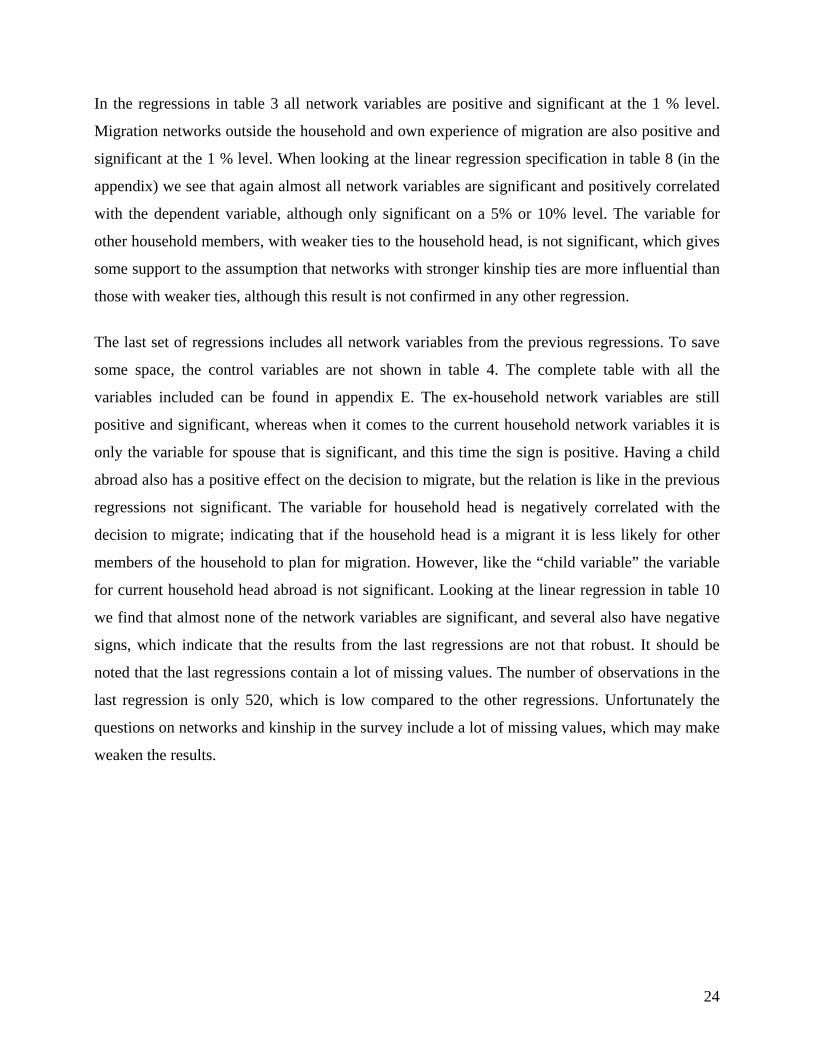
The last set of regressions includes all network variables from the previous regressions. To save
some space, the control variables are not shown in table 4. The complete table with all the
variables included can be found in appendix E. The ex-household network variables are still
positive and significant, whereas when it comes to the current household network variables it is
only the variable for spouse that is significant, and this time the sign is positive. Having a child
abroad also has a positive effect on the decision to migrate, but the relation is like in the previous
regressions not significant. The variable for household head is negatively correlated with the
decision to migrate; indicating that if the household head is a migrant it is less likely for other
members of the household to plan for migration. However, like the “child variable” the variable
for current household head abroad is not significant. Looking at the linear regression in table 10
we find that almost none of the network variables are significant, and several also have negative
signs, which indicate that the results from the last regressions are not that robust. It should be
noted that the last regressions contain a lot of missing values. The number of observations in the
last regression is only 520, which is low compared to the other regressions. Unfortunately the
questions on networks and kinship in the survey include a lot of missing values, which may make
weaken the results.
24
Table 4: Determinants of migration, all network variables
1 2 3 4
Dependent variable: Plan to migrate
ever lived at least 3 months abroad since 1991 4.273***[0.807]
household head abroad -0.058[0.751]
household spouse abroad 1.733**[0.790]
household children abroad 0.513[0.921]
Ex- household head or -spouse migrant 30.265***[1.620]
Ex-household children migrant 31.714***[1.507]
Ex- household sibling migrant 31.655***[1.551]
Ex- household parent migrant 29.369***[1.767]
Ex- household other member migrant 33.710***[2.004]
migrant outside household 1.953***[0.729]
Controled for individual variables: yesControled for household variables: yes
Observations 9201 9142 8992 8992 520Standard errors in brackets* significant at 10%; ** significant at 5%; *** significant at 1%Clustered at household levelSource: CBS-Axa 2006
5
From the findings it thus seems like networks with migrants that migrated some time ago and
who are no longer considered to be household members are more influential than migrants who
currently make part of the household. A possible explanation could be that those individuals who
been abroad for a longer period of time have more experience and knowledge of the migration
destination, and are in a better position to help new migrants. It could also be that if the
household already has one current member abroad other household members are needed at home
and do not feel the same need to migrate abroad to work.
25
6. CONCLUSIONS Help from family and friends is considered important both before departure and at the destination
for Moldovan migrants. Migration networks seem to play an important role for the decision to
migrate in Moldova. The result found in this study confirms previous findings from other
countries that aggregated migration networks play an important role for the decision to migrate.
Both current and ex-household members who migrated abroad have a significant positive effect
on other household members’ willingness to migrate when looking at aggregated migration
networks. Having previous experience of migration also significantly increases the probability
that the individual is planning to migrate in the near future.
The results for the disaggregated networks also indicate that migration networks have a positive
effect on the decision to migrate. However, I do not find evidence that certain kinships are more
important or affect the decision to migrate in different ways. Instead, other migrants outside the
family seem to play a more important role for the decision to migrate than do migrants within the
household. When comparing the different household network variables it seems like ex-
household members who migrated abroad have a greater impact on migration decisions of
household members than current household members who migrated. A possible explanation to
this could be that individuals who migrated some time ago and stayed abroad are more settled
down at the destination, have more knowledge and experience of the destination and therefore
have more valuable migration information to share with the potential migrant. Another
explanation could be that the need of another person from the household to migrate decreases if
the household already have a current member abroad.
These results confirm the need to include migration networks when studying determinants of
migration. Further research topics that could be interesting to look more into include gender
differences when it comes to the use of different migration networks, as well as differences in the
importance of migration networks depending on destination choice. It is possible that the use of
networks is changing in line with the changes of migration patterns, i.e. more women who
migrate and more emigration to EU-countries, which could have interesting policy implications.
26
7. REFERENCES
Bauer T., Epstein G., Gang I. (2000) “What are migration networks?” The Institute for the Study of Labour (IZA), Discussion paper No. 200. Davis B. and Winters P. (2000) “Gender, Networks and Mexico-US migration” Working Paper Series in Agricultural and Resource Economics, No 2000-7. Davis B., Stecklov G., Winters P (2002) “Domestic and international migration from rural Mexico: Disaggregating the effects of network structure and composition” Population Studies Vol. 56, 291-309. Ghencea B. and Gudumac I. (2005) “Labour Migration and Remittances in the Republic of Moldova.” Report, Moldova Microfinance Alliance. Görlich D. and Trebesch C. (2006) “Mass migration and seasonality: Evidence on Moldova’s Labour exodus”, The Kiel Institute of World Economy. IMF “Republic of Moldova: Selected Issues” (2005) IMF Country Report No. 05/54. IOM (2006) “Migration Perspectives: Eastern Europe and Central Asia” International Organisation for Migration (IOM). McKenzie D. and Rapoport H (2007) “Self selection patterns in Mexico-U.S. migration: The role of migration networks” CReAM Discussion Paper No. 01/07, Centre for Research and Analysis of Migration. Massey S., Goldring L. and Durand J. (1994) “Continuities in Transnational Migration: Analysis of 19 Mexican communities” The American Journal of Sociology Vol. 99, No. 6 pp.1492-1533. Pinger P. (2007) “Come back or Stay? Spend Here or There? Temporary versus Permanent Migration and Remittance Patterns in the Republic of Moldova” Kiel Institute of World Economics. Sirbu A. (2007) “Migrate to Find a Job or to get Married? Destination selection by Moldovan Emigrants” Senior Thesis, Department of Economics, Harvard University. The World Bank (2005) “The International migration agenda and the World Bank: Managing Risks Enhancing Benefits”, Overview, The World Bank http://siteresources.worldbank.org/INTMIGDEV/Resources/26304revisedtext.pdf The World Bank (2006) “Migration and Remittances: Eastern Europe and the Former Soviet Union” The International Bank for Reconstruction and Development/ the World Bank.
27

Zhao Y. (2003) “The role of migrant networks in labour migration: the case of China”, Contemporary Economic Policy Vol. 21 No. 4.
28

8. APPENDICES
Appendix A: Data and Sample Description
The data used in this study derives from a recent cross-sectional household survey conducted
between June and August 2006. The survey was commissioned by the International Organization
for Migration in Moldova, and administered by the CBS-AXA survey agency in Moldova. It
builds upon and updates a similar survey conducted in 2004, and is likely the most recent and
complete survey on Moldovan migration to date. The dataset contains observations of 14102
individuals in 3940 households31, quasi-random sample. The sample includes both households
with and without migrants, and offers rich and detailed information on various migrant and
household characteristics. In addition, the data contains information on migrants that are former
household members who have migrated abroad for a longer period of time.
The survey questionnaire is divided into two parts. The first part contains sections with basic
demographic characteristics such as age, gender, education and occupation of all household
members. Questions on remittances, living standards, expenditures and assets are also included.
The second part is directed to households who in 2005 or in the beginning of 2006 had at least
one member working abroad. This part contains more detailed information on for example
reasons for migration, destination choice, departure ways, characteristics of jobs abroad, and the
use of networks.
31 A household is formally defined as all individuals living on the household budget or contributing to it, and who lived in the household for at least six months.
29
Appendix B: Summary statistics Table 5: Summary Statistics, overall sample Variable Obs Mean Std. Dev. ___________________________________________________ _Dependent variable_________________________________ Plan to Migrate (dummy) 9201 .1054233 .3071148 Individual characteristics_____________________________ sex (dummy for female) 14071 .526544 .4993127 age 13983 35.85661 20.22423 age squared 13983 1694.687 1652.115 married 14061 .5303321 .4990969 secondary edu 13842 .3265424 .4689652 teritary edu 13842 .2508308 .433507 university edu 13842 .1729519 .3782193 hh head (dummy) 14102 .2781875 .4481221 moldovan 14102 .7662743 .4232147 eu mem 14102 .0627571 .2425341 lstd_bad 14102 .2493263 .4326384 lstd_sat 14102 .5043965 .4999984 Household characteristics_____________________________ urban 14102 .3458375 .4756574 dependents 14102 .1504042 .1860057 Own experience of migration__________________________ self 9718 .0841737 .2776624 Network variables, aggregated_________________________ current fam network 14094 .0960819 .184321 history fam network 14102 .1943696 .3957286 Network variables, disaggregated______________________ headabroad 13908 .0982528 .2974554 spouseabroad 11530 .0631685 .2428998 childabroad 8180 .1409786 .3058444 netimmediate 2741 .0541651 .2140109 netchild 2741 .5739207 .4835078 netsibling 2741 .1984191 .3887415 netparent 2741 .1388058 .3314617 netother 2741 .0262982 .1503243 othernetwork 13755 .6800436 .4664763 Source: CBS-AXA, 2006
30

Table 6: Summary statistics, plan vs. do not plan to migrate Don’t plan to migrate Plan to migrate Variable Obs Mean Obs Mean Individual characteristics sex (female) 8231 .5625076 970 .442268 age 8183 45.27264 965 34.43627 age_2 8183 2372.823 965 1332.764 married 8225 .659696 970 .6268041 sec 8088 .3391444 955 .3539267 ter 8088 .2940158 955 .3277487 uni 8088 .205366 955 .2450262 head 8231 .3861013 970 .3979381 moldovan 8231 .7612684 970 .743299 eu_mem 8231 .0634188 970 .0556701 lstd_bad 8231 .2582918 970 .2268041 lstd_sat 8231 .5044345 970 .4948454 Household characteristics________________________________ urban 8231 .3694569 970 .4082474 dependents 8231 .1067458 970 .1453944 Own experience of migration_____________________________ self 8224 .0515564 967 .3950362 Network variables, aggregated current 8231 .0567386 970 .0747693 history 8231 .149678 970 .1618557 . Network variables, disaggregated_________________________ head 8141 .0506695 960 .0828125 spouse 6683 .0341414 794 .0474391 child 5029 .0993102 610 .0872131 netimmediate 1232 .0425866 157 .0923567 netchild 1232 .6164367 157 .4235669 netsibling 1232 .176921 157 .2800425 netparent 1232 .1301677 157 .1721868 netother 1232 .0241477 157 .0318471 othernetwork 8033 .6495705 940 .7904255 Source: CBS-AXA 2006
31
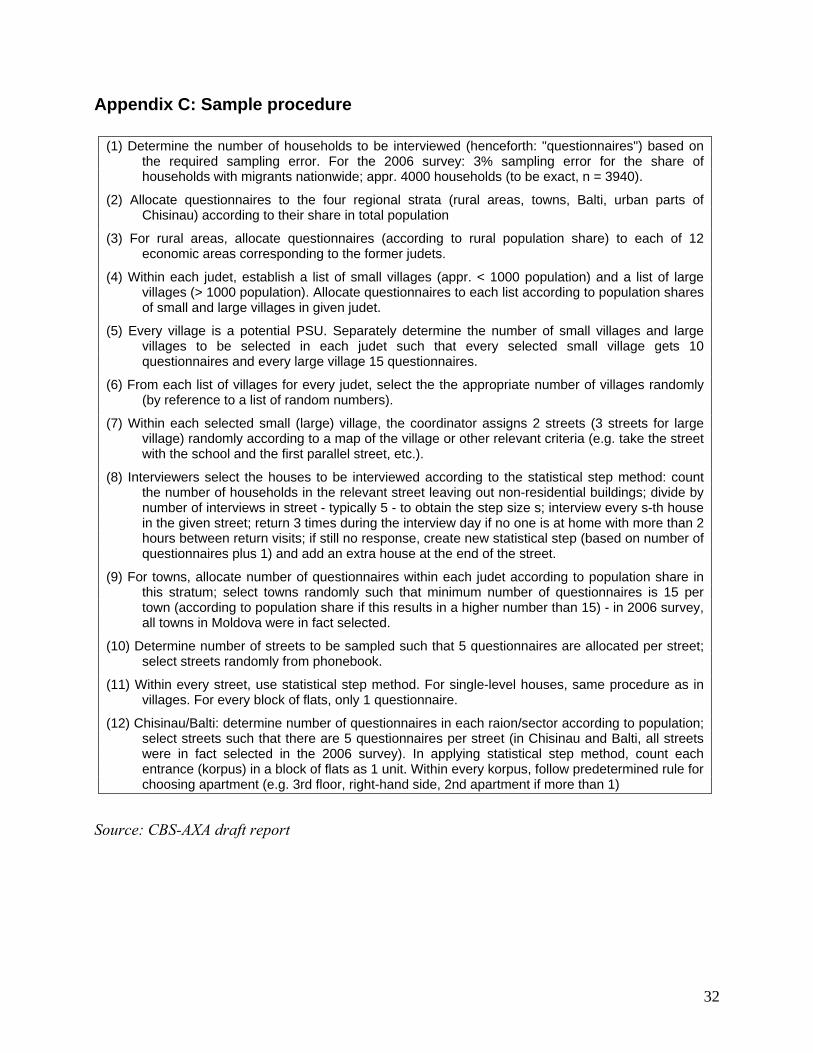
Appendix C: Sample procedure
(1) Determine the number of households to be interviewed (henceforth: "questionnaires") based on the required sampling error. For the 2006 survey: 3% sampling error for the share of households with migrants nationwide; appr. 4000 households (to be exact, n = 3940).
(2) Allocate questionnaires to the four regional strata (rural areas, towns, Balti, urban parts of Chisinau) according to their share in total population
(3) For rural areas, allocate questionnaires (according to rural population share) to each of 12 economic areas corresponding to the former judets.
(4) Within each judet, establish a list of small villages (appr. < 1000 population) and a list of large villages (> 1000 population). Allocate questionnaires to each list according to population shares of small and large villages in given judet.
(5) Every village is a potential PSU. Separately determine the number of small villages and large villages to be selected in each judet such that every selected small village gets 10 questionnaires and every large village 15 questionnaires.
(6) From each list of villages for every judet, select the the appropriate number of villages randomly (by reference to a list of random numbers).
(7) Within each selected small (large) village, the coordinator assigns 2 streets (3 streets for large village) randomly according to a map of the village or other relevant criteria (e.g. take the street with the school and the first parallel street, etc.).
(8) Interviewers select the houses to be interviewed according to the statistical step method: count the number of households in the relevant street leaving out non-residential buildings; divide by number of interviews in street - typically 5 - to obtain the step size s; interview every s-th house in the given street; return 3 times during the interview day if no one is at home with more than 2 hours between return visits; if still no response, create new statistical step (based on number of questionnaires plus 1) and add an extra house at the end of the street.
(9) For towns, allocate number of questionnaires within each judet according to population share in this stratum; select towns randomly such that minimum number of questionnaires is 15 per town (according to population share if this results in a higher number than 15) - in 2006 survey, all towns in Moldova were in fact selected.
(10) Determine number of streets to be sampled such that 5 questionnaires are allocated per street; select streets randomly from phonebook.
(11) Within every street, use statistical step method. For single-level houses, same procedure as in villages. For every block of flats, only 1 questionnaire.
(12) Chisinau/Balti: determine number of questionnaires in each raion/sector according to population; select streets such that there are 5 questionnaires per street (in Chisinau and Balti, all streets were in fact selected in the 2006 survey). In applying statistical step method, count each entrance (korpus) in a block of flats as 1 unit. Within every korpus, follow predetermined rule for choosing apartment (e.g. 3rd floor, right-hand side, 2nd apartment if more than 1)
Source: CBS-AXA draft report
32
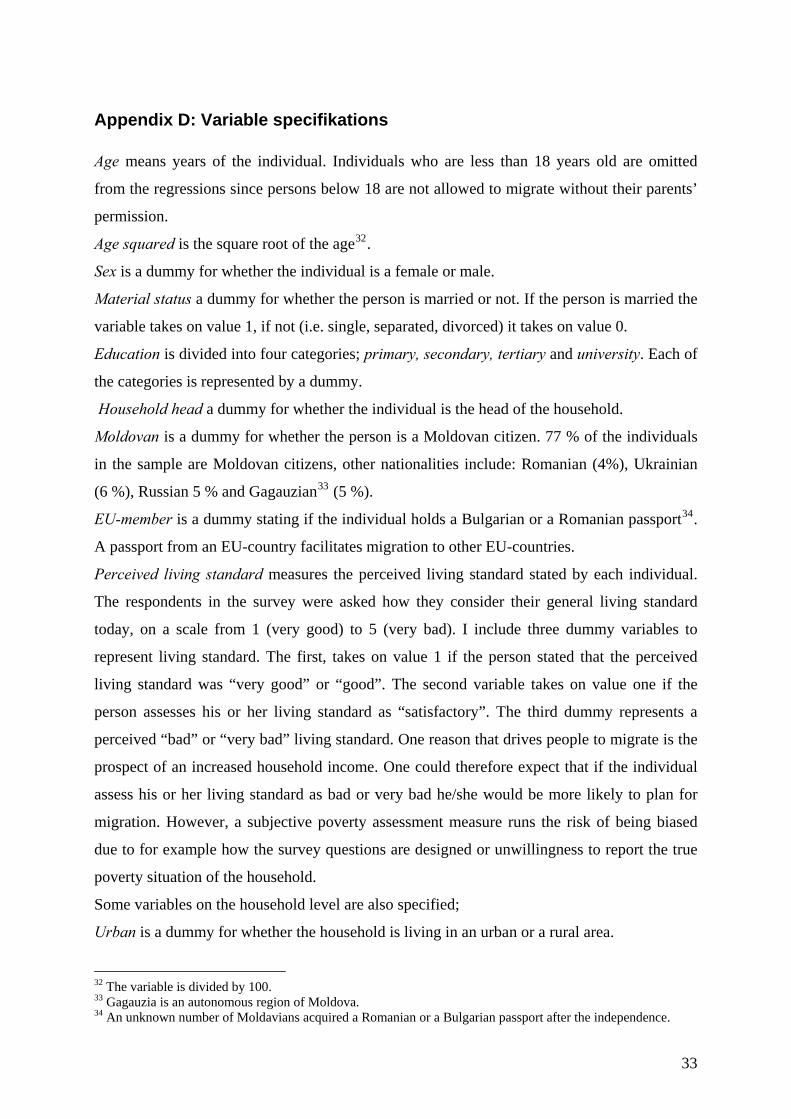
Appendix D: Variable specifikations Age means years of the individual. Individuals who are less than 18 years old are omitted
from the regressions since persons below 18 are not allowed to migrate without their parents’
permission.
Age squared is the square root of the age32.
Sex is a dummy for whether the individual is a female or male.
Material status a dummy for whether the person is married or not. If the person is married the
variable takes on value 1, if not (i.e. single, separated, divorced) it takes on value 0.
Education is divided into four categories; primary, secondary, tertiary and university. Each of
the categories is represented by a dummy.
Household head a dummy for whether the individual is the head of the household.
Moldovan is a dummy for whether the person is a Moldovan citizen. 77 % of the individuals
in the sample are Moldovan citizens, other nationalities include: Romanian (4%), Ukrainian
(6 %), Russian 5 % and Gagauzian33 (5 %).
EU-member is a dummy stating if the individual holds a Bulgarian or a Romanian passport34.
A passport from an EU-country facilitates migration to other EU-countries.
Perceived living standard measures the perceived living standard stated by each individual.
The respondents in the survey were asked how they consider their general living standard
today, on a scale from 1 (very good) to 5 (very bad). I include three dummy variables to
represent living standard. The first, takes on value 1 if the person stated that the perceived
living standard was “very good” or “good”. The second variable takes on value one if the
person assesses his or her living standard as “satisfactory”. The third dummy represents a
perceived “bad” or “very bad” living standard. One reason that drives people to migrate is the
prospect of an increased household income. One could therefore expect that if the individual
assess his or her living standard as bad or very bad he/she would be more likely to plan for
migration. However, a subjective poverty assessment measure runs the risk of being biased
due to for example how the survey questions are designed or unwillingness to report the true
poverty situation of the household.
Some variables on the household level are also specified;
Urban is a dummy for whether the household is living in an urban or a rural area.
32 The variable is divided by 100. 33 Gagauzia is an autonomous region of Moldova. 34 An unknown number of Moldavians acquired a Romanian or a Bulgarian passport after the independence.
33
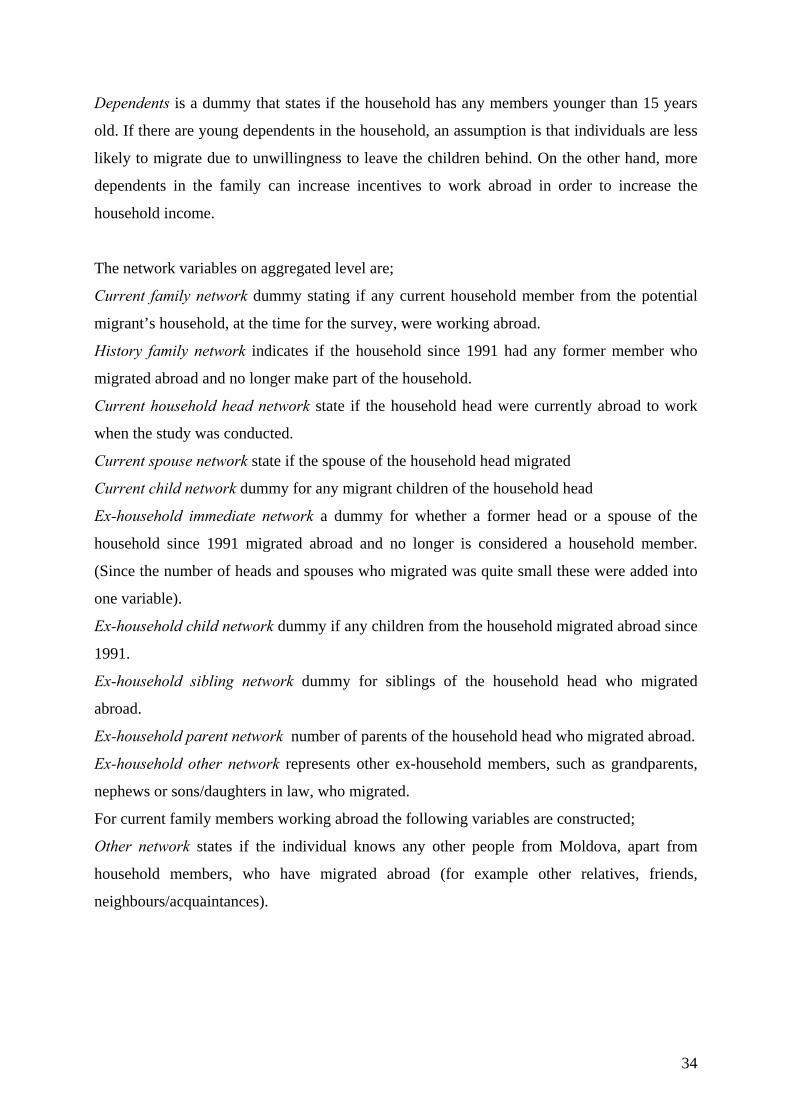
Dependents is a dummy that states if the household has any members younger than 15 years
old. If there are young dependents in the household, an assumption is that individuals are less
likely to migrate due to unwillingness to leave the children behind. On the other hand, more
dependents in the family can increase incentives to work abroad in order to increase the
household income.
The network variables on aggregated level are;
Current family network dummy stating if any current household member from the potential
migrant’s household, at the time for the survey, were working abroad.
History family network indicates if the household since 1991 had any former member who
migrated abroad and no longer make part of the household.
Current household head network state if the household head were currently abroad to work
when the study was conducted.
Current spouse network state if the spouse of the household head migrated
Current child network dummy for any migrant children of the household head
Ex-household immediate network a dummy for whether a former head or a spouse of the
household since 1991 migrated abroad and no longer is considered a household member.
(Since the number of heads and spouses who migrated was quite small these were added into
one variable).
Ex-household child network dummy if any children from the household migrated abroad since
1991.
Ex-household sibling network dummy for siblings of the household head who migrated
abroad.
Ex-household parent network number of parents of the household head who migrated abroad.
Ex-household other network represents other ex-household members, such as grandparents,
nephews or sons/daughters in law, who migrated.
For current family members working abroad the following variables are constructed;
Other network states if the individual knows any other people from Moldova, apart from
household members, who have migrated abroad (for example other relatives, friends,
neighbours/acquaintances).
34
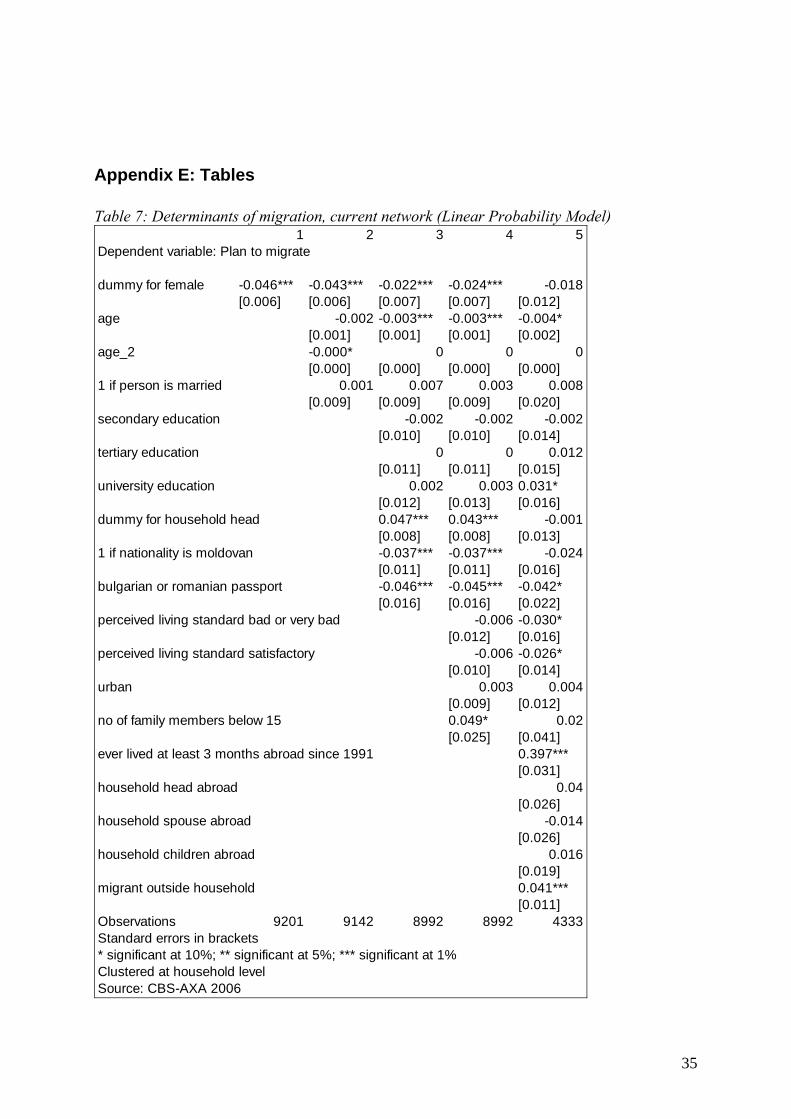
Appendix E: Tables Table 7: Determinants of migration, current network (Linear Probability Model)
1 2 3 4 5Dependent variable: Plan to migrate
dummy for female -0.046*** -0.043*** -0.022*** -0.024*** -0.018[0.006] [0.006] [0.007] [0.007] [0.012]
age -0.002 -0.003*** -0.003*** -0.004*[0.001] [0.001] [0.001] [0.002]
age_2 -0.000* 0 0 0[0.000] [0.000] [0.000] [0.000]
1 if person is married 0.001 0.007 0.003 0.008[0.009] [0.009] [0.009] [0.020]
secondary education -0.002 -0.002 -0.002[0.010] [0.010] [0.014]
tertiary education 0 0 0.012[0.011] [0.011] [0.015]
university education 0.002 0.003 0.031*[0.012] [0.013] [0.016]
dummy for household head 0.047*** 0.043*** -0.001[0.008] [0.008] [0.013]
1 if nationality is moldovan -0.037*** -0.037*** -0.024[0.011] [0.011] [0.016]
bulgarian or romanian passport -0.046*** -0.045*** -0.042*[0.016] [0.016] [0.022]
perceived living standard bad or very bad -0.006 -0.030*[0.012] [0.016]
perceived living standard satisfactory -0.006 -0.026*[0.010] [0.014]
urban 0.003 0.004[0.009] [0.012]
no of family members below 15 0.049* 0.02[0.025] [0.041]
ever lived at least 3 months abroad since 1991 0.397***[0.031]
household head abroad 0.04[0.026]
household spouse abroad -0.014[0.026]
household children abroad 0.016[0.019]
migrant outside household 0.041***[0.011]
Observations 9201 9142 8992 8992 4333Standard errors in brackets* significant at 10%; ** significant at 5%; *** significant at 1%Clustered at household levelSource: CBS-AXA 2006
35
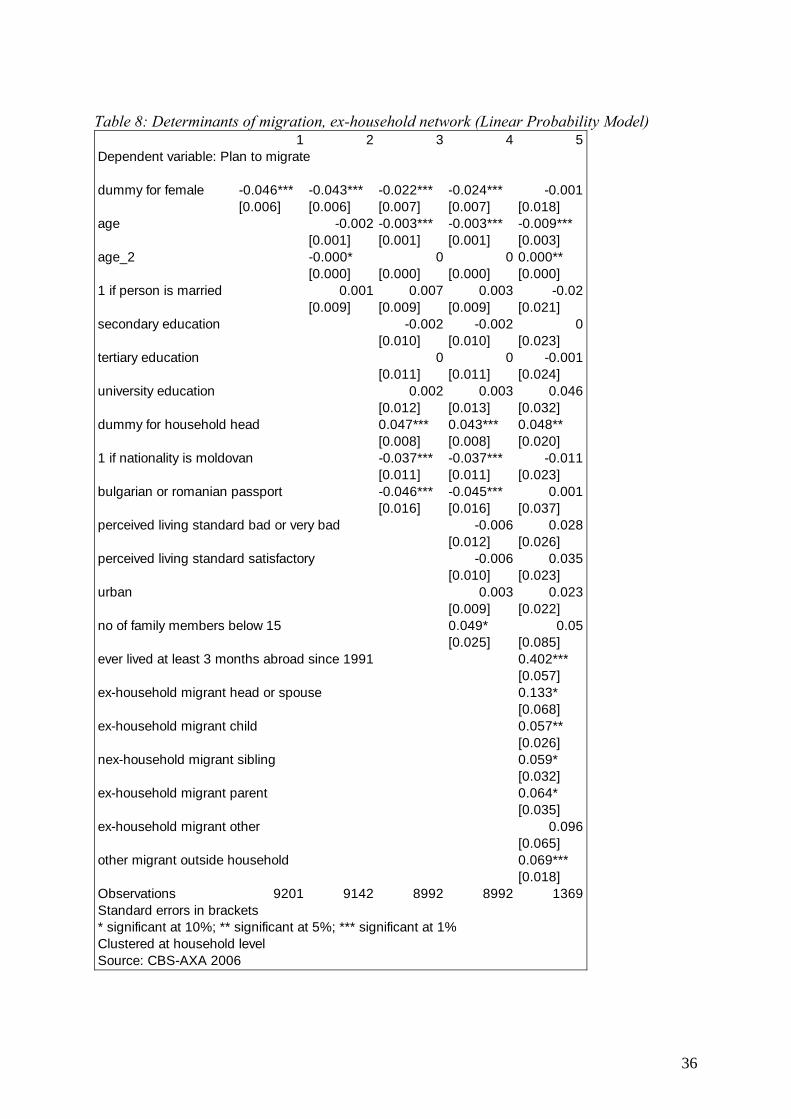
Table 8: Determinants of migration, ex-household network (Linear Probability Model)
1 2 3 4 5Dependent variable: Plan to migrate
dummy for female -0.046*** -0.043*** -0.022*** -0.024*** -0.001[0.006] [0.006] [0.007] [0.007] [0.018]
age -0.002 -0.003*** -0.003*** -0.009***[0.001] [0.001] [0.001] [0.003]
age_2 -0.000* 0 0 0.000**[0.000] [0.000] [0.000] [0.000]
1 if person is married 0.001 0.007 0.003 -0.02[0.009] [0.009] [0.009] [0.021]
secondary education -0.002 -0.002 0[0.010] [0.010] [0.023]
tertiary education 0 0 -0.001[0.011] [0.011] [0.024]
university education 0.002 0.003 0.046[0.012] [0.013] [0.032]
dummy for household head 0.047*** 0.043*** 0.048**[0.008] [0.008] [0.020]
1 if nationality is moldovan -0.037*** -0.037*** -0.011[0.011] [0.011] [0.023]
bulgarian or romanian passport -0.046*** -0.045*** 0.001[0.016] [0.016] [0.037]
perceived living standard bad or very bad -0.006 0.028[0.012] [0.026]
perceived living standard satisfactory -0.006 0.035[0.010] [0.023]
urban 0.003 0.023[0.009] [0.022]
no of family members below 15 0.049* 0.05[0.025] [0.085]
ever lived at least 3 months abroad since 1991 0.402***[0.057]
ex-household migrant head or spouse 0.133*[0.068]
ex-household migrant child 0.057**[0.026]
nex-household migrant sibling 0.059*[0.032]
ex-household migrant parent 0.064*[0.035]
ex-household migrant other 0.096[0.065]
other migrant outside household 0.069***[0.018]
Observations 9201 9142 8992 8992 1369Standard errors in brackets* significant at 10%; ** significant at 5%; *** significant at 1%Clustered at household levelSource: CBS-AXA 2006
36
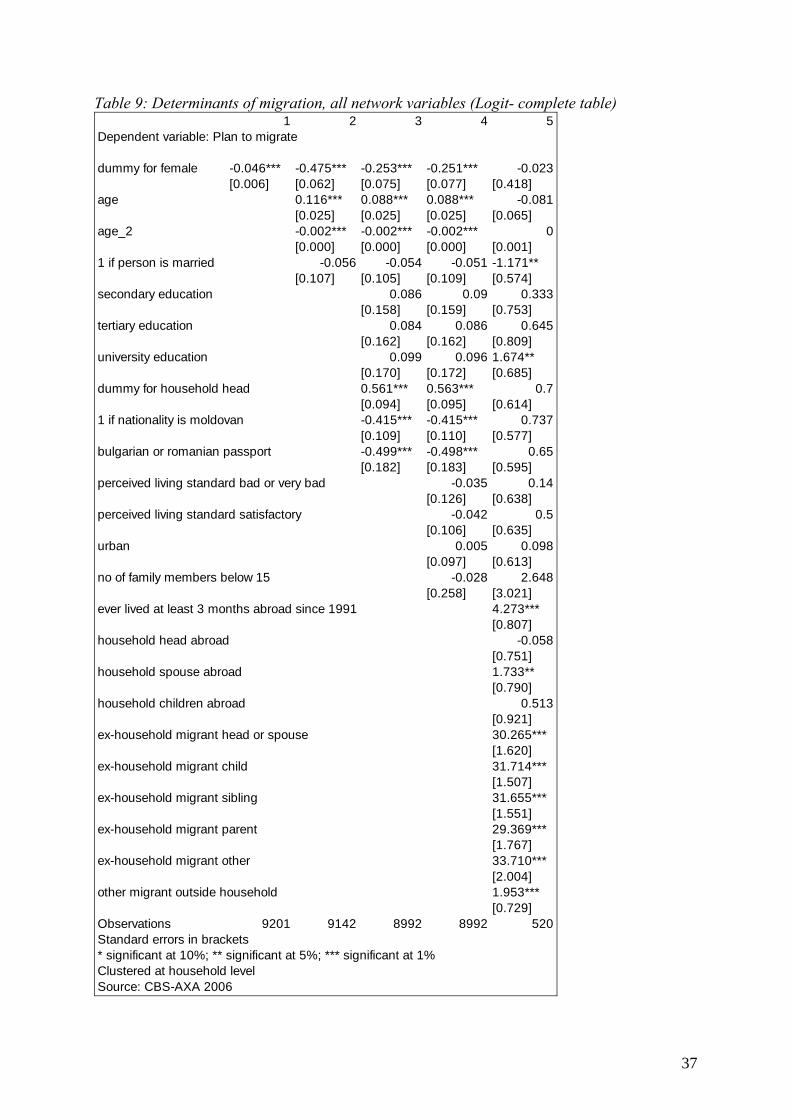
Table 9: Determinants of migration, all network variables (Logit- complete table) 1 2 3 4
Dependent variable: Plan to migrate
dummy for female -0.046*** -0.475*** -0.253*** -0.251*** -0.023[0.006] [0.062] [0.075] [0.077] [0.418]
age 0.116*** 0.088*** 0.088*** -0.081[0.025] [0.025] [0.025] [0.065]
age_2 -0.002*** -0.002*** -0.002*** 0[0.000] [0.000] [0.000] [0.001]
1 if person is married -0.056 -0.054 -0.051 -1.171**[0.107] [0.105] [0.109] [0.574]
secondary education 0.086 0.09 0.333[0.158] [0.159] [0.753]
tertiary education 0.084 0.086 0.645[0.162] [0.162] [0.809]
university education 0.099 0.096 1.674**[0.170] [0.172] [0.685]
dummy for household head 0.561*** 0.563*** 0.7[0.094] [0.095] [0.614]
1 if nationality is moldovan -0.415*** -0.415*** 0.737[0.109] [0.110] [0.577]
bulgarian or romanian passport -0.499*** -0.498*** 0.65[0.182] [0.183] [0.595]
perceived living standard bad or very bad -0.035 0.14[0.126] [0.638]
perceived living standard satisfactory -0.042 0.5[0.106] [0.635]
urban 0.005 0.098[0.097] [0.613]
no of family members below 15 -0.028 2.648[0.258] [3.021]
ever lived at least 3 months abroad since 1991 4.273***[0.807]
household head abroad -0.058[0.751]
household spouse abroad 1.733**[0.790]
household children abroad 0.513[0.921]
ex-household migrant head or spouse 30.265***[1.620]
ex-household migrant child 31.714***[1.507]
ex-household migrant sibling 31.655***[1.551]
ex-household migrant parent 29.369***[1.767]
ex-household migrant other 33.710***[2.004]
other migrant outside household 1.953***[0.729]
Observations 9201 9142 8992 8992 520Standard errors in brackets* significant at 10%; ** significant at 5%; *** significant at 1%Clustered at household levelSource: CBS-AXA 2006
5
37
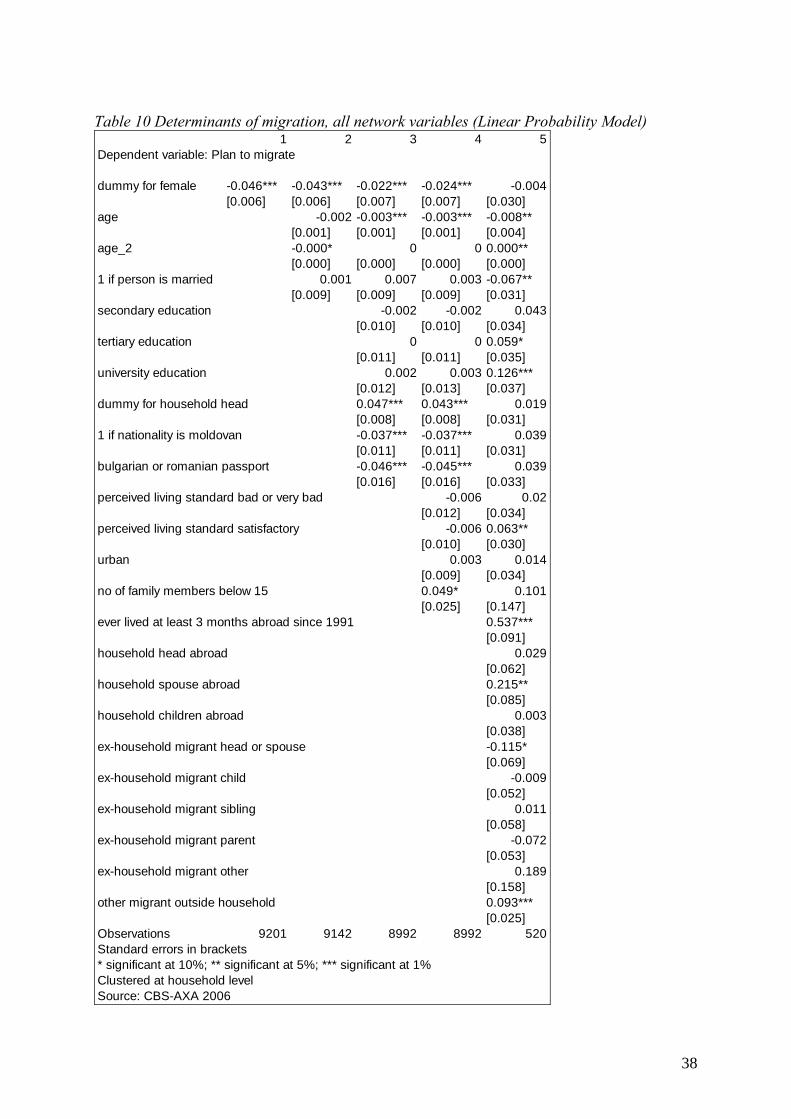
Table 10 Determinants of migration, all network variables (Linear Probability Model)
1 2 3 4 5Dependent variable: Plan to migrate
dummy for female -0.046*** -0.043*** -0.022*** -0.024*** -0.004[0.006] [0.006] [0.007] [0.007] [0.030]
age -0.002 -0.003*** -0.003*** -0.008**[0.001] [0.001] [0.001] [0.004]
age_2 -0.000* 0 0 0.000**[0.000] [0.000] [0.000] [0.000]
1 if person is married 0.001 0.007 0.003 -0.067**[0.009] [0.009] [0.009] [0.031]
secondary education -0.002 -0.002 0.043[0.010] [0.010] [0.034]
tertiary education 0 0 0.059*[0.011] [0.011] [0.035]
university education 0.002 0.003 0.126***[0.012] [0.013] [0.037]
dummy for household head 0.047*** 0.043*** 0.019[0.008] [0.008] [0.031]
1 if nationality is moldovan -0.037*** -0.037*** 0.039[0.011] [0.011] [0.031]
bulgarian or romanian passport -0.046*** -0.045*** 0.039[0.016] [0.016] [0.033]
perceived living standard bad or very bad -0.006 0.02[0.012] [0.034]
perceived living standard satisfactory -0.006 0.063**[0.010] [0.030]
urban 0.003 0.014[0.009] [0.034]
no of family members below 15 0.049* 0.101[0.025] [0.147]
ever lived at least 3 months abroad since 1991 0.537***[0.091]
household head abroad 0.029[0.062]
household spouse abroad 0.215**[0.085]
household children abroad 0.003[0.038]
ex-household migrant head or spouse -0.115*[0.069]
ex-household migrant child -0.009[0.052]
ex-household migrant sibling 0.011[0.058]
ex-household migrant parent -0.072[0.053]
ex-household migrant other 0.189[0.158]
other migrant outside household 0.093***[0.025]
Observations 9201 9142 8992 8992 520Standard errors in brackets* significant at 10%; ** significant at 5%; *** significant at 1%Clustered at household levelSource: CBS-AXA 2006
38
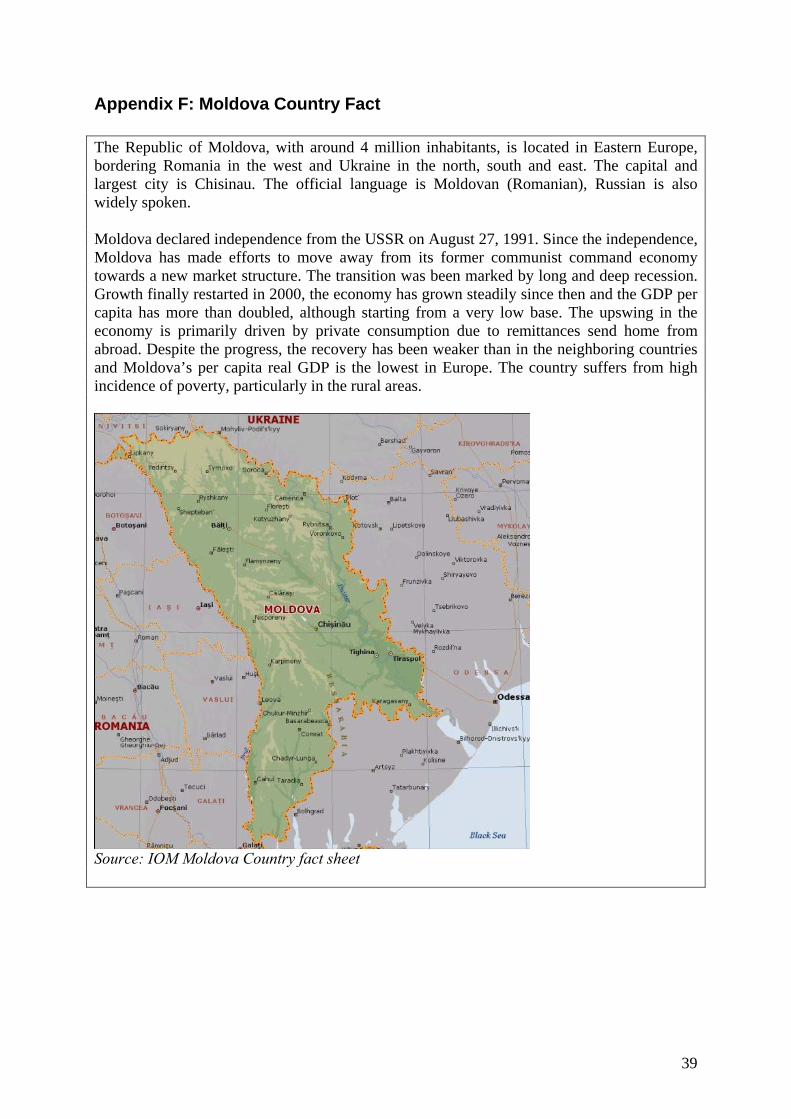
Appendix F: Moldova Country Fact The Republic of Moldova, with around 4 million inhabitants, is located in Eastern Europe, bordering Romania in the west and Ukraine in the north, south and east. The capital and largest city is Chisinau. The official language is Moldovan (Romanian), Russian is also widely spoken. Moldova declared independence from the USSR on August 27, 1991. Since the independence, Moldova has made efforts to move away from its former communist command economy towards a new market structure. The transition was been marked by long and deep recession. Growth finally restarted in 2000, the economy has grown steadily since then and the GDP per capita has more than doubled, although starting from a very low base. The upswing in the economy is primarily driven by private consumption due to remittances send home from abroad. Despite the progress, the recovery has been weaker than in the neighboring countries and Moldova’s per capita real GDP is the lowest in Europe. The country suffers from high incidence of poverty, particularly in the rural areas.
Source: IOM Moldova Country fact sheet
39