Embed Size (px)
Citation preview
Rowan University Rowan University
Rowan Digital Works Rowan Digital Works
Theses and Dissertations
6-30-2004
The effect of graphic organizers on the academic achievement of The effect of graphic organizers on the academic achievement of
fourth grade students fourth grade students
Stephanie Kirschbaum Rowan University
Follow this and additional works at: https://rdw.rowan.edu/etd
Part of the Elementary Education and Teaching Commons
Recommended Citation Recommended Citation Kirschbaum, Stephanie, "The effect of graphic organizers on the academic achievement of fourth grade students" (2004). Theses and Dissertations. 1177. https://rdw.rowan.edu/etd/1177
This Thesis is brought to you for free and open access by Rowan Digital Works. It has been accepted for inclusion in Theses and Dissertations by an authorized administrator of Rowan Digital Works. For more information, please contact [email protected].
THE EFFECT OF GRAPHIC ORGANIZERS ON THE ACADEMIC
ACHIEVEMENT OF FOURTH GRADE STUDENTS
byStephanie Kirschbaum
A Thesis
Submitted in partial fulfillment of the requirements of theMaster of Science in Teaching Degree
ofThe Graduate School
atRowan University
June 30, 2004
Approved
Date Approved )l / 2705
c I, (
© June 30, 2004 Stephanie Kirschbaum
ABSTRACT
Stephanie KirschbaumTHE EFFECT OF GRAPHIC ORGANIZERS ON THE ACADEMIC
ACHIEVEMENT OF FOURTH GRADE STUDENTS2003/04
Dr. Randall RobinsonMaster of Science in Teaching
The purpose of this study was to determine the effect that graphic organizers have on the
academic achievement of fourth grade students. The sample was a fourth grade
classroom in an elementary school in southern New Jersey. The researcher taught the
students two different social studies chapters. The researcher collected data by giving the
students two tests for each of the two chapters taught. There were a total of four tests
given. These tests were similar in that they were the exact same difficulty level.
However, in each chapter there was one test that was constructed using graphic
organizers, and a second test that was constructed using a question-answer format. The
researcher then compared the four data sets to determine if the students scored higher on
the tests that were constructed using graphic organizers. The researcher concluded that
graphic organizers do not have a significant effect on the academic achievement of fourth
grade students.
ACKNOWLEDGEMENTS
I would like to thank the students who participated in this study and the Michelle Greene,
my cooperating teacher, for providing her assistance. I would like to thank my advisor,
Dr. Robinson, for his insight and assistance during the thesis process. I would like to
thank my mother who has supported and encouraged me throughout my academic,
professional, and personal life. I would also like to thank Sagy Langer, for his patience
and understanding. Without him, the completion of this thesis would have seemed
unlikely.
iii
Table of Contents
Page
Acknowledgements ...........................................................................iii
List of Tables ................................................................................. vi
Chapter
1. Scope of the Study
Introduction...................................................................
Statement of the Problem ................................................... 2
H ypothesis .................................................................... 3
Limitations of the Study ................................................... 3
Definitions of Selected Terms of the Study ..............................4
2. Review of the Literature
Introduction ...................................... ...................... .6
The Need for Graphic Organizers .......................................... 6
Use of Graphic Organizers .................................................. 7
Graphic Organizer Implementation ........................................ 8
Methods of Effective Graphic Organizer Implementation ............ 11
3. Proposed Data Collection Methodology
Introduction . .................................................................. 13
Description of the Subjects .................................................. 13
Procedure ............................................................. .14
Description of the Instrument ........................................... 14
iv
4. Analysis of Findings
Introduction ......... ....... ......... ... ......... ........ 16
Analysis of D ata . ................................................... 16
5. Summary, Conclusions and Recommendations
Introduction...................................................................21
Summary of Problem ....... ................... 21
Summary of the Hypothesis ........................... ............... 22
Summary of Procedures ................................ ........... 22
Sum m ary of Findings ....................................................... 23
C onclusions .................................................................. 24
Recommendations and Implications ..................................... 24
B ibliography...................................................................................26
Appendices
Appendix A .... . ........ ...................... 27
Appendix B ..... . ..................................... ..................... 43
A ppendix C ........................................................................... 5
Appendix D ........................................................................... 48
A ppendix E ........................................................................... 50
v
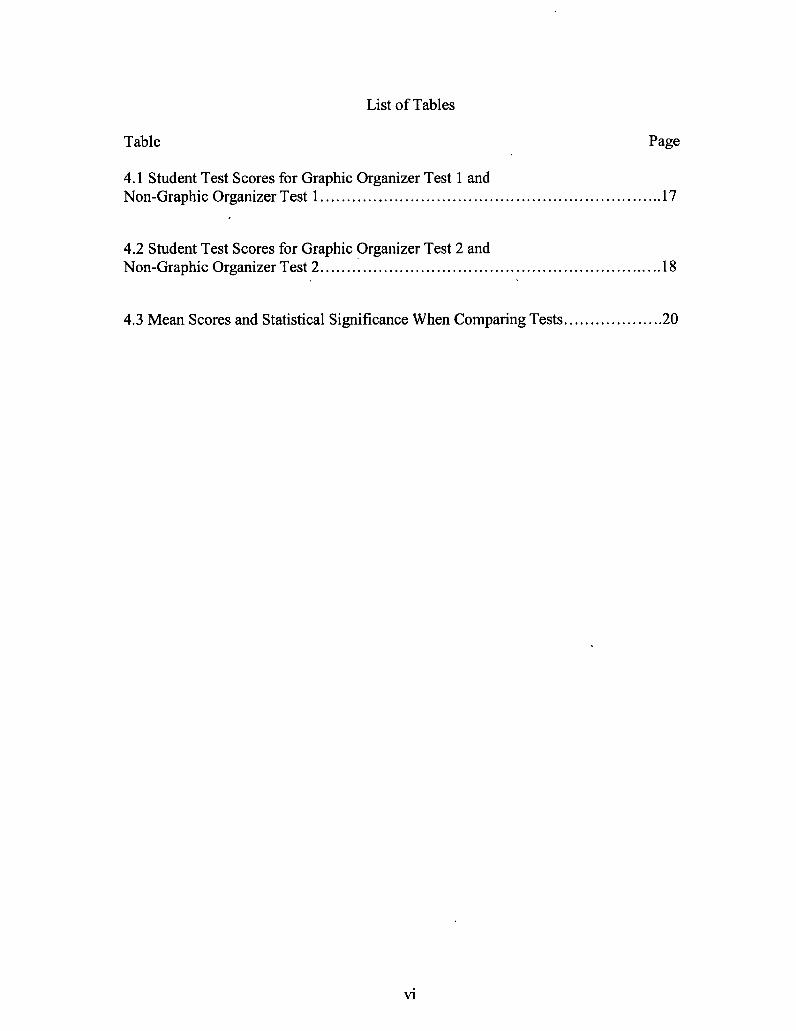
List of Tables
Table Page
4.1 Student Test Scores for Graphic Organizer Test 1 andNon-Graphic Organizer Test 1 .............. .......... ..........................17
4.2 Student Test Scores for Graphic Organizer Test 2 andNon-Graphic Organizer Test 2............................................................... 18
4.3 Mean Scores and Statistical Significance When Comparing Tests ................... 20
vi
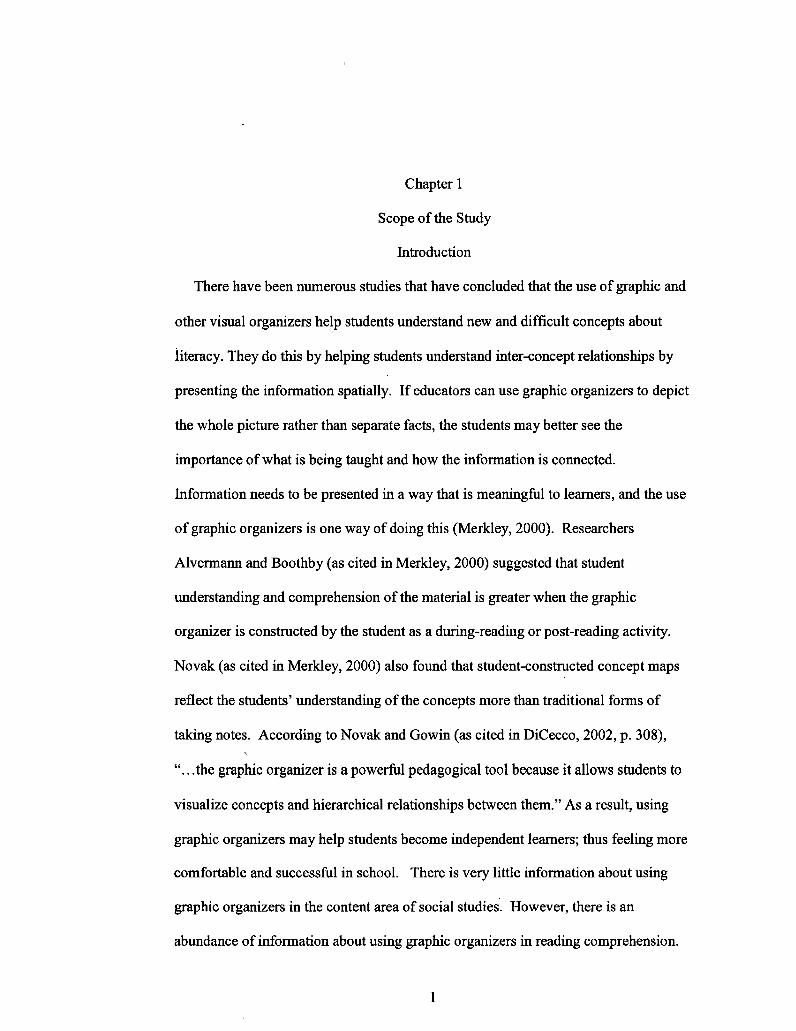
Chapter 1
Scope of the Study
Introduction
There have been numerous studies that have concluded that the use of graphic and
other visual organizers help students understand new and difficult concepts about
literacy. They do this by helping students understand inter-concept relationships by
presenting the information spatially. If educators can use graphic organizers to depict
the whole picture rather than separate facts, the students may better see the
importance of what is being taught and how the information is connected.
Information needs to be presented in a way that is meaningful to learners, and the use
of graphic organizers is one way of doing this (Merkley, 2000). Researchers
Alvermann and Boothby (as cited in Merkley, 2000) suggested that student
understanding and comprehension of the material is greater when the graphic
organizer is constructed by the student as a during-reading or post-reading activity.
Novak (as cited in Merkley, 2000) also found that student-constructed concept maps
reflect the students' understanding of the concepts more than traditional forms of
taking notes. According to Novak and Gowin (as cited in DiCecco, 2002, p. 308),
"...the graphic organizer is a powerful pedagogical tool because it allows students to
visualize concepts and hierarchical relationships between them." As a result, using
graphic organizers may help students become independent learners; thus feeling more
comfortable and successful in school. There is very little information about using
graphic organizers in the content area of social studies. However, there is an
abundance of information about using graphic organizers in reading comprehension.
1
This can relate to social studies because it is a subject that requires reading and
comprehending what is read (Robinson, 1998).
Comprehension is a major issue in education today (Robinson, 1998). According
to Merkley (2000), students can often comprehend material from narrative texts, but
many students have difficulty effectively comprehending and recalling expository
material. Expository material is different from narrative material in that its primary
intent is to present facts, ideas, and information.
In 1960, David Ausubel theorized that a primary process in learning is
subsumption in which new material is related to relevant ideas in the existing
cognitive structure on a substantive, non-verbatim basis. In Ausubel's subsumption
theory, he argued that "the most important single factor influencing learning is what
the learner already knows"(Merkley, 2000, p. 351). According to Ausubel, learning
will be enhanced if students associate new meanings with previously learned
information. Cognitive structures represent the residue of all learning experiences;
forgetting occurs because certain details get integrated and lose their individual
identity. As a result of his research, Ausubel developed the advanced organizer. He
hypothesized that the advanced organizer will strengthen the student's existing
cognitive structure.
Graphic organizers, as they are now called, are visual representations that
clarify information for learners by linking new concepts to existing related ideas. By
providing the learner with a visual representation, the graphic organizer makes
information more meaningful for learners because it allows them to visualize concepts
and the hierarchal relationships between them (Griffin, 1995).
Statement of the Problem
2
What can teachers do to improve students' comprehension? DiCicco and Gleason
(2002) believed that students must attend to learning, attach learning to previous
learning, actively engage in learning, construct meaning, and demonstrate their
learning. Educators want learners to be able to organize, store, and retrieve skills."
Many students often ask, "Why do we have to know about this? If students can attach
their prior life experiences to what they are learning they will be able to comprehend
the material much more easily. If educators can use graphic organizers to depict the
whole picture rather than separate facts, then the students may see the importance of
what is being taught and how information is being connected. What is the effect of
the implementation and the use of social studies graphic organizers on students'
information retention, and as a result have an effect on student grades?
Hypothesis
The following hypothesis was proposed for this study:
* Fourth grade students will score significantly higher on social studies tests that
are constructed completely of graphic organizers, than they will score on
social studies tests that are constructed without any graphic organizers.
Limitations of the Study
The following were limitations of this study regarding the efficacy of graphic
organizers:
One limitation was that some graphic organizers are confusing and may do more
harm than good. In existing research, there has been a "lack of consistency concerning
the format of graphic organizers. For instance, some studies use matrices while others
use tree diagrams" (Robinson, 1998, p. 90). There is inconsistency in the conclusions
of studies on graphic organizers. In addition, Alvarez, Dinnel and Glover, Graves and
3
Penn (as cited in Robinson, 1998, p. 87) found that some studies show evidence that
graphic organizers facilitate learning; while others do not (Barnes & Clawson, 1978,
Hartley & Davies, 1976; Mayer, 1979).
Another limitation was that the test scores did not reflect the style of the different
tests, but rather that the information in one chapter is greater in difficulty than another
chapter. Also, the variation in test scores may be due to the method of teaching. As a
result, the students' test scores may be inconclusive. Therefore, in this study the
researcher did everything possible to ensure the difficulty level, the time on task, the
time of day that the material is taught, the method of delivery, and the method of
reinforcement were exactly the same. Therefore, the only difference in the material
taught was the different tests.
Finally, test scores may not be the only indicator of the students' understanding of
the material. The students' knowledge was not necessarily reflected in the student's
test scores. This can be due to the fact that this student is a bad test taker, or possibly
that the student could have had a bad day. The researcher for the proposed study
allowed for these circumstances by focusing on the test scores as a whole, rather than
examining individual test scores. When considered together, these limitations
influenced either the internal validity of this study, the external validity, or both.
Definitions of Selected Terms of the Study
For the purposes of this study, the following definitions were provided to ensureunderstanding:
Graphic organizer: A visual communication tool that uses visual symbols to expressideas and concepts, and to convey meaning. It provides a visual of facts, ideas,relationships, and patterns.
Relational knowledge: Knowledge that the learner acquires that is connected to thematerial that is currently being presented;
4
Expository information: Information that is intended to convey facts, ideas, andinformation to explain what is difficult to understand;
Student achievement: A student's comprehension and mastery of the material beingpresented to them in the unit. This knowledge and understanding is reflected in thestudent's test scores.
5
Chapter 2
Review of the Literature
Introduction
Comprehension is a major issue in education today (Robinson, 1998). According to
Merkley (2000), students can often comprehend material from narrative texts, but many
students have difficulty effectively comprehending and recalling expository material.
Expository material is different from narrative material in that its primary intent is to
present facts, ideas, and information.
David Ausubel developed the graphic organizers, or visual representations that clarify
information for learners by linking new concepts to existing related ideas. By providing
the learner with a visual representation, the graphic organizer makes information more
meaningful for learners because it allows them to visualize concepts and the hierarchal
relationships between them (Griffin, 1995). This study hypothesized that fourth grade
students will score significantly higher on social studies tests that are constructed
completely of graphic organizers, than they will score on social studies tests that are
constructed without graphic organizers.
The Need for Graphic Organizers
In recent years, advances in computer software have made it possible for those
with limited knowledge of text material to construct graphic organizers that will
increase student understanding of textbook material. Robinson (1998) stated:
"Students' difficulties in comprehending content area textbooks is an
educational problem that has received much attention in recent years."
According to Robinson (1998),
6
"Text comprehension involves learning concepts, defining attributes,recognizing defining attributes when presented with a range ofexamples, learning hierarchal and coordinate relations amongconcepts, and finally transferring knowledge by correctly identifyingconcepts given in new examples." (p. 86)
Robinson (1998) also noted that students are sometimes hindered because of the
textbooks they are using. Many textbooks have poor organization or structure that
may inhibit learning important concept relationships. Educators need to improve a
student's comprehension. Banikowski (1999) believed "Educators must ensure that
students must attend to learning, attach new learning to previous learning, construct
meaning, and demonstrate their learning. Educators want learners to be able to
organize, store, and retrieve knowledge and skills" (p. 1).
Use of Graphic Organizers
According to DiCecco and Gleason (2002),
"Graphic organizers are one method that might achieve what textbooksfailed to do. Graphic organizers are visual portrayals or illustrationsthat use special arrangements, geometric shapes, lines, and arrows toportray the content structure and to depict relationships among keyconcepts taken from the learning task" (p. 307).
Once those relationships are understood by the learner, it will be easier for them to
grasp the concepts. Graphic organizers can be instrumental in addressing the problem
of content area text comprehension by making the information more explicit. They
will provide meaning to the information presented by showing the students how the
information connects. They allow students to visualize concepts and the hierarchical
relationships between them (DiCecco, 1999). In other words, if students can "see"
how the information is connected, then they will be able to understand it better.
Graphic organizers do this by taking what a student already knows and creating a
7
framework that provides a basis to attach new information to the existing schemata
(Dunston, 1992).
"Having prior knowledge or experience with current learning enhancesmemory. What we already know determines to a great extent what wewill pay attention to, perceive, learn, remember, and forget"(Bandikowski, 1999, p. 9).
A graphic organizer allows the student to remember what he already knows by
generating what is already known about the topic. After remembering what is already
known, learners generate what they want to know- which is an excellent way to
establish a purpose for learning. Then, the students formulate what they have learned,
which will compare prior unclear knowledge with new and accurate knowledge
(Bandikowski, 1999).
Graphic Organizer Implementation
Recently, there have been reviews of graphic organizers that have concluded that
they do aid in a student's comprehension of text material. Many researchers have
stressed the importance of using graphic organizers (Robinson, 1998). Researchers
have indicated that graphic organizers increase student achievement in reading
comprehension, application, retention and understanding of science or social studies
content, and greater organization within written compositions (Baxendell, 2003).
"Researchers should no longer question 'if organizers work, but how and when they
work" (Dunstan, 1992, p. 58).
An in-depth study conducted by Griffin and Malone in 1995 examines two
questions related to graphic organizer instruction in five classrooms of normal
achieving fifth grade students. This study explored the following questions; (a) Does
graphic organizer instruction facilitate comprehension, recall, and transfer of
information contained in an expository textbook? And (b) What degree of explicit
8
instruction is necessary for an independent generation and use of graphic organizers
by students? Each classroom was assigned one of the following treatment conditions:
(a) explicit graphic organizer instruction, (b) explicit instruction no graphic organizer,
(c) implicit graphic organizer instruction, (d) implicit instruction no graphic organizer,
and (e) traditional basal instruction which used the teacher's manual of the district
adopted handbook. The graphic organizers were designed to reflect the hierarchy of
information and the relationships of this information within the hierarchy. The
purpose of the graphic organizer was to highlight the important information in the
text. The results indicated that the students receiving the explicit graphic organizer
instruction (they received detailed instructions for identifying the important
information in the text and constructing graphic organizers) had the highest mean
scores on both the immediate post-test and the immediate recall measure. Griffin and
Malone also point out that those students had the added demands of not only learning
the content but also the procedures to construct a graphic organizer. Even with those
added demands, the explicit instruction and graphic organizer were vital in the
students' understanding of the text. The study concluded that graphic organizers do
facilitate comprehension, recall, and transfer of information in an expository textbook
as long as explicit instruction is provided.
A study done by DiCecco and Gleason (2002), examines the effects of using
graphic organizers to attain relational knowledge from expository text in students with
learning disabilities. They conducted this study because they believed teachers do not
aid students in the comprehension process, and they believed graphic organizers will
link concepts together to aid the students in comprehending the material from the
expository text. Students with mild disabilities were assigned to either graphic
organizer instruction or no graphic organizer instruction. The results indicated that
9
graphic organizers do teach relational knowledge to students with learning
disabilities. The results show that those students using graphic organizers provided
more relational knowledge statements and were able to recall more information than
those students not using the graphic organizer.
Teachers have used graphic organizers as a result of the research that indicates that
they increase student comprehension. Moore and Readence (as cited in DiCecco,
2002, p. 310) analyzed 23 studies qualitatively. They concluded that when teaching
content material, teachers feel more confident using graphic organizers. They
perceive themselves as "being better organized, more in control of the learning
activity, and more sensitive to the demands of the learning task." One example of
this is a teacher who designed a writing instruction model to make her students better
writers. Using graphic organizers, the teacher was able to provide explicit instruction
in the writer's workshop. The students were instructed to brainstorm ideas for their
chosen topic on an idea "light bulb". Next, the students used a color-coded organizer
to outline and organize their main ideas. After the nine weeks of instruction, the
students' post-tests were drastically improved from their pretest scores, which can be
attributed to the use of graphic organizers (James, 2001).
There has been a lot of research done on how graphic organizers should be
constructed in order for them to be effective by facilitating student learning.
According to Baxendell (1999), they must be used consistently, by incorporating them
in similar situations across all subject areas. They must be used coherently, by
limiting the ideas covered, making all relationships clear, and minimizing directions.
Lastly, they must be creative, by adding illustrations, including them in homework
and test review, and implementing the graphic organizer in pairs of students.
10
Methods of Effective Graphic Organizer Implementation
Merkeley and Jefferies (1999) provide five methods of effective graphic organizer
implementation. The teacher should verbalize relationships among the concepts
expressed by the visual, which will clarify to students that the graphic organizer
provides an overview of the material that is being presented. The teacher should
provide opportunity for student input to ensure the students' understanding of the
material being presented. The teacher should connect new learning to past learning
by reviewing the information the students learned in the previous weeks. The teacher
should make references to the upcoming text and reinforce with students that using
the graphic organizer should be used as a supplement to the text rather than instead of
the text. Finally, teachers should seize opportunities to reinforce decoding and
structural analysis, for example relevant phonics generalizations.
Egan (1999) also offers suggestions to teachers to use graphic organizers
effectively so students understand the material. She recommends that before teachers
use the organizer with their students, they should use it themselves. This preparation
allows teachers to activate schema, decide what works and what doesn't, and reflect
upon questions that may arise. She also suggests that teachers should encourage
students to work cooperatively using graphic organizers, so they can raise and test
each other's ideas. She also suggests that teachers use graphic organizers only when
it is appropriate to the objective of the lesson. Finally, she suggests to expand the use
of the graphic organizer other than the text, for example to use it with class
discussion, film, and video.
Student comprehension is a focal problem in education today. One method that
may aid student comprehension is the graphic organizer. "Using a graphic organizer,
students will better be able to see how information is connected, so it will be easier to
11
comprehend the material (Bandikowski, 1999, p.9)." This review of the literature has
shown a number of studies that have been conducted that indicate that graphic
organizers facilitate student learning.
12
Chapter 3
Design of the Study
Introduction
This was a quantitative study that determined if the variables, graphic organizer
constructed tests, increased student comprehension. Research has shown that graphic
organizers do make concepts clearer for students by allowing them to visualize concepts,
which makes information more meaningful (Griffin, 1995). The researcher believed that
graphic organizers help facilitate student leaning by being an excellent addition to the
textbook. Graphic organizers clarify information to students by linking concepts
together, which makes information more meaningful (Griffin, 1995). It was hypothesized
that fourth grade students will score significantly higher on social studies tests that are
constructed completely of graphic organizers, than they will score on social studies tests
that are constructed without any graphic organizers.
Description of the Subjects
The sample was a fourth grade classroom in an elementary school in southern New
Jersey. The sample was selected because it was the classroom in which the researcher
was assigned as a student teacher. The sample was selected there to fulfill the
researcher's need to teach student material, to use graphic organizer constructed tests, as
well as question-answer tests. The size of the sample was twenty-five 10 year-old
students, consisting of 14 boys and 11 girls. The sample consisted of students that varied
in their reading ability levels. The ability levels ranged from accelerated readers to
13
special needs students that have difficulty reading. The sample consisted of twenty-four
Caucasian students, and one Afro-American student.
Procedure
The researcher taught the students two different social studies chapters, the first
called The Geography of New Jersey, and the second called The Regions of New Jersey.
The students read the section of material in their New Jersey books, New Jersey
Yesterday and Today, for homework the night before. The following day, the class
discussed and took notes on the material the class read. The researcher taught the two
chapters every day for a half a hour in the morning (see appendix A for lesson plans).
The two chapters were taught using an overhead projector and a transparency of teacher-
made notes on the content of each section. The first day of each chapter a fun activity was
used to introduce the chapter to the students. This first day also helped them understand
why the information was important for them to learn. The second day of each chapter the
students were given a list of the vocabulary. They were asked to define the vocabulary
words on the list and to hand in the list to be graded. The following day the researcher
taught using the transparency of teacher-made notes on the first section of material. After
every two sections of material there was a brief review in order that the students could
prepare for the test. Four tests were then given throughout the two chapters.
Description of the Instrument
The researcher collected data by giving the students two tests for each of the two
chapters taught. There were a total of four tests given. These tests were similar in that
14
they were the exact same difficulty level. However, in each chapter there was one test
that was constructed using graphic organizers, and a second test that was constructed
using a question-answer format. The researcher then compared the four data sets to
determine if the students scored higher on the tests that were constructed using graphic
organizers (see appendix B-E for New Jersey Tests 1-4).
15
Chapter 4
Analysis of Findings
Introduction
Studies have concluded that the use of graphic organizers and other visual organizers
help students understand difficult concepts. They do this by making information
meaningful for learners allowing them to visualize concepts to see how the information is
being connected (Griffin, 1995). It was hypothesized that fourth grade students will
score significantly higher on social studies tests that are constructed completely of
graphic organizers, than they will score on social studies tests that are constructed
without any graphic organizers.
Analysis of Data
There were four sets of data that were collected. There were four tests given
throughout the course of this study. The first test given was a non-graphic organizer test,
and the second a graphic organizer test. The scores of each test were analyzed using a
Post Hoc Test to determine if the differences in their scores were statistically significant.
The range of scores for these two tests was 9-100. The mode score for the non-graphic
organizer test was an 83. The mode score for the graphic organizer test was an 82. The
mean score for the non-graphic organizer test was a 79. The mean score for the graphic
organizer test was a 73 (see table 1 for a complete list of test scores).
16
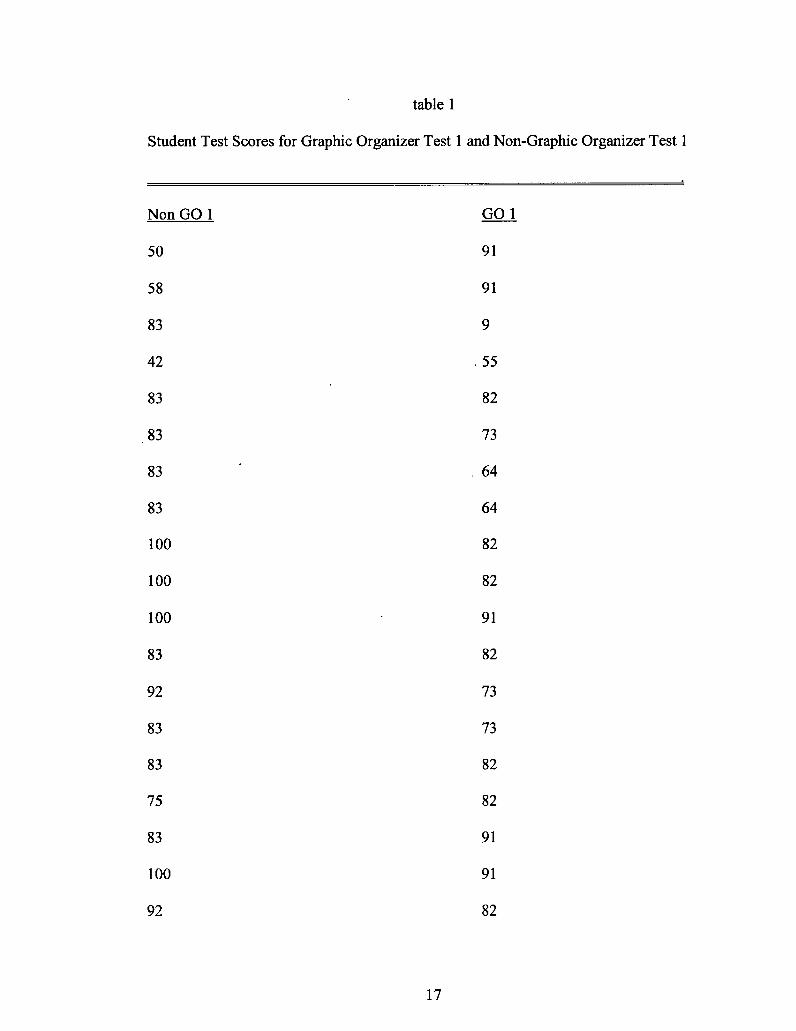
table 1
Student Test Scores for Graphic Organizer Test 1
Non GO 1
50
58
83
42
83
83
83
83
100
100
100
83
92
83
83
75
83
100
92
and Non-Graphic Organizer Test 1
GO 1
91
91
9
55
82
73
64
64
82
82
91
82
73
73
82
82
91
91
82
17
100 73
100 82
100 91
58 45
67 91
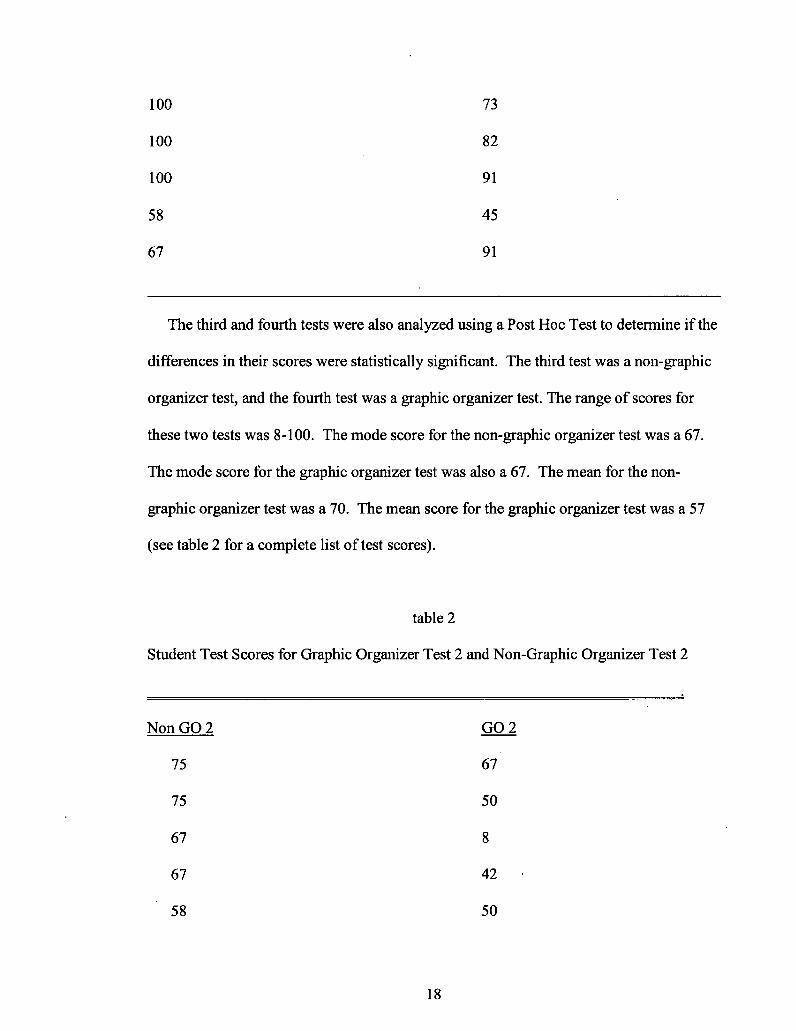
The third and fourth tests were also analyzed using a Post Hoc Test to determine if the
differences in their scores were statistically significant. The third test was a non-graphic
organizer test, and the fourth test was a graphic organizer test. The range of scores for
these two tests was 8-100. The mode score for the non-graphic organizer test was a 67.
The mode score for the graphic organizer test was also a 67. The mean for the non-
graphic organizer test was a 70. The mean score for the graphic organizer test was a 57
(see table 2 for a complete list of test scores).
table 2
Student Test Scores for Graphic Organizer Test 2 and Non-Graphic Organizer Test 2
Non GO 2 GO 2
75 67
75 50
67 8
67 42
58 50
18
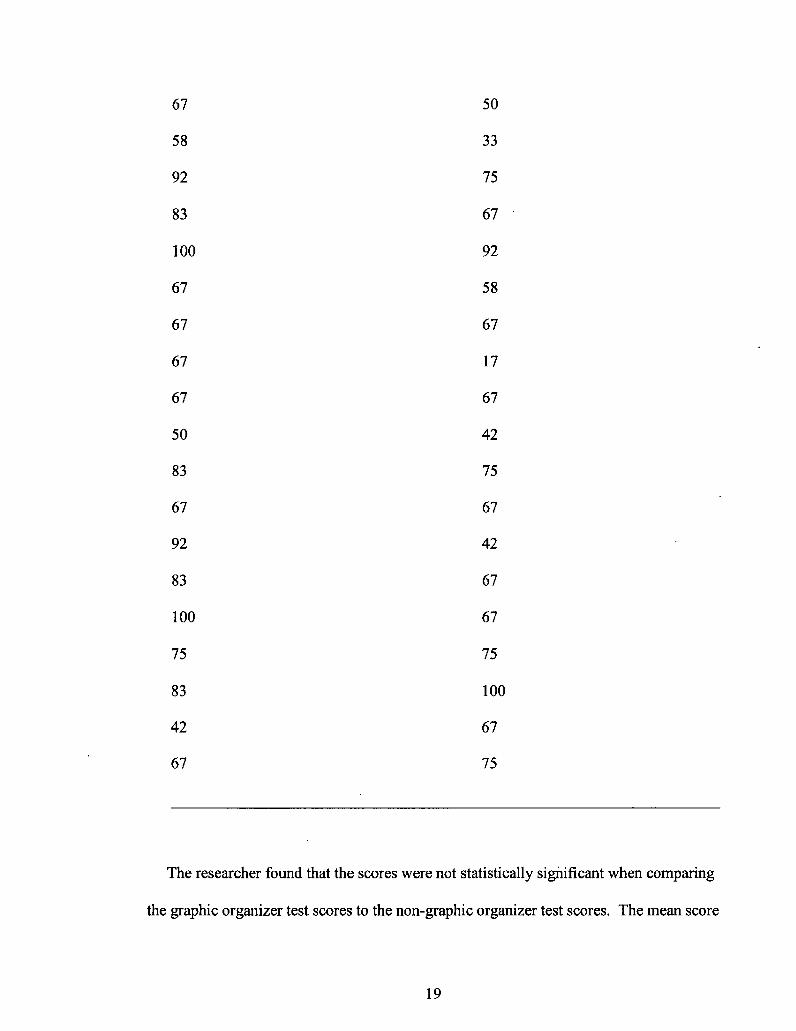
67 50
58 33
92 75
83 67
100 92
67 58
67 67
67 17
67 67
50 42
83 75
67 67
92 42
83 67
100 67
75 75
83 100
42 67
67 75
The researcher found that the scores were not statistically significant when comparing
the graphic organizer test scores to the non-graphic organizer test scores. The mean score
19
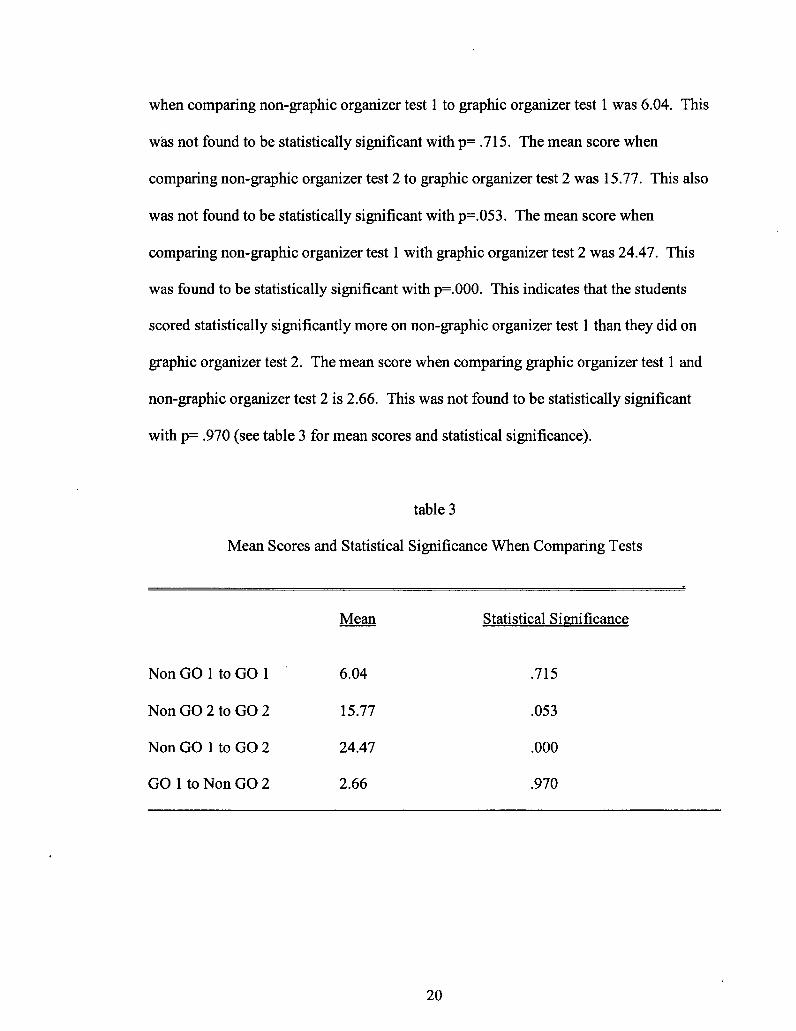
when comparing non-graphic organizer test 1 to graphic organizer test 1 was 6.04. This
was not found to be statistically significant with p= .715. The mean score when
comparing non-graphic organizer test 2 to graphic organizer test 2 was 15.77. This also
was not found to be statistically significant with p=.053. The mean score when
comparing non-graphic organizer test 1 with graphic organizer test 2 was 24.47. This
was found to be statistically significant with p=.000. This indicates that the students
scored statistically significantly more on non-graphic organizer test 1 than they did on
graphic organizer test 2. The mean score when comparing graphic organizer test 1 and
non-graphic organizer test 2 is 2.66. This was not found to be statistically significant
with p= .970 (see table 3 for mean scores and statistical significance).
table 3
Mean Scores and Statistical Significance When Comparing Tests
Mean Statistical Significance
Non GO 1 to GO 1 6.04 .715
Non GO 2 to GO 2 15.77 .053
Non GO 1 to GO 2 24.47 .000
GO 1 to Non GO 2 2.66 .970
20
Chapter 5
Summary, Conclusions and Recommendations
Introduction
Comprehension is a major issue in education today (Robinson, 1998). Graphic
organizers have been found to clarify information for learners by linking new concepts to
existing related ideas. By providing the learner with the visual representation, the
graphic organizer makes information more meaningful for learners because it allows
them to visualize concepts and the hierarchal relationships between them (Griffin, 1995).
Summary of Problem
Teachers need to find a way to improve students' comprehension. According to
Merkley (2000), students can often comprehend material from narrative texts, but many
students have difficulty effectively comprehending and recalling expository material.
Expository material is different from narrative material in that its primary intent is to
present facts, ideas, and information.
DiCicco and Gleason (2002) believed that "students must attend to learning, attach
learning to previous learning, actively engage in learning, construct meaning, and
demonstrate their learning. Educators want learners to be able to organize, store, and
retrieve skills." If students can attach their prior life experiences to what they are
learning they will be able to comprehend the material much more easily. If educators can
use graphic organizers to depict the whole picture rather than separate facts, then the
21
students may see the importance of what is being taught and how information is being
connected.
Summary of the Hypothesis
It was hypothesized that fourth grade students will score significantly higher on social
studies tests that are constructed completely of graphic organizers, than they will score on
social studies tests that are constructed without any graphic organizers.
Summary of Procedures
The researcher taught the students two different social studies chapters, the first
called The Geography of New Jersey, and the second called The Regions of New Jersey.
The students read the section of material in their New Jersey books, New Jersey
Yesterday and Today, for homework the night before. The following day, the class
discussed and took notes on the material the class read. The researcher taught the two
chapters every day for a half a hour in the morning (see appendix A for lesson plans).
The two chapters were taught using an overhead projector and a transparency of teacher-
made notes on the content of each section. The first day of each chapter a fun activity was
used to introduce the chapter to the students. This first day also helped them understand
why the information is important for them to learn. The second day of each chapter the
students were given a list of the vocabulary. They were asked to define the vocabulary
words on the list and to hand in the list to be graded. The following day the researcher
taught using the transparency of teacher-made notes on the first section of material. After
22
every two sections of material there was a brief review in order that the students could
prepare for the test. Four tests were then given throughout the two chapters.
Summary of Findings
There were four sets of data that were collected. There were four tests given
throughout the course of this study. The first test given was a non-graphic organizer test,
the second a graphic organizer test, the third a non-graphic organizer test, the fourth test a
graphic organizer test. The scores of each test were analyzed using a Post Hoc Test to
determine if the differences in their scores were statistically significant. The range of
scores was 0-100 on each test. The researcher found that the scores were not statistically
significant when comparing the graphic organizer test scores to the non-graphic organizer
test scores. The mean score when comparing non-graphic organizer test 1 to graphic
organizer test 1 was 6.04. This was not found to be statistically significant with p= .715.
The mean score when comparing non-graphic organizer test 2 to graphic organizer test 2
was 15.77. This also was not found to be statistically significant with p=.053. The mean
score when comparing non-graphic organizer test 1 with graphic organizer test 2 was
24.47. This was found to be statistically significant with p=.000. This indicated that the
students scored statistically significantly more on non-graphic organizer test 1 than they
did on graphic organizer test 2. The mean score when comparing graphic organizer test 1
and non-graphic organizer test 2 is 2.66. This was not found to be statistically significant
with p= .970 (see table 1 for a complete list of test scores).
23
Conclusions
The statistical analysis of the data collected was contrary to what the researcher
predicted. The analysis revealed that the use of graphic organizers did not improve
student achievement. The research actually revealed that students achieved better on the
first test in a chapter or a unit, and as the chapter progressed, student achievement
decreased. The students were motivated to achieve when taking the first test, and as a
result the scores for the first test were significantly higher than the remaining tests. As
the tests progressed, the scores got lower despite whether it was a graphic organizer test
or not. The students achieved the highest scores in the first non-graphic organizer test.
They achieved the next highest scores on the second test which used graphic organizers.
They achieved the third highest scores on the third test which did not use graphic
organizers. Finally, the lowest scores were on the last test which did use graphic
organizers. Therefore, it can be concluded that graphic organizers do not influence
student achievement positively or negatively.
Recommendations and Implications
As a result of this study, graphic organizers did not influence student achievement
positively or negatively. In addition, the results of this study indicated that graphic
organizers do not harm test scores. The researcher believes that some students may still
benefit from using them. Therefore, using them in conjunction with the other resources
available can only benefit the students. Therefore, the researcher recommends that
graphic organizers continued to be used during lessons.
24
It was concluded that student achievement was higher in the beginning of the unit
and decreased as the unit of material progressed. The researcher believes teachers should
find a way to keep the material interesting throughout the unit. One way to do this may
be to add incentives to the learning process other than grades. One example of this could
be more free time, if student achievement progresses as the unit progresses, because each
test is of equal value, teachers and parents also need to find a way to keep the students
motivated enough to study for more than simply the first test.
25
Bibliography
Baxendall, B. (2003). Consistent, coherent, creative: The 3 C's of graphicorganizers [Electronic version]. The Council for Exceptional Children. 35 (3),46- 49.
Brunn, M. (2002). Teaching ideas [Electronic version].Reading Teacher, 55 (6),522- 526.
DiCecco, V., & Gleason, M. (2002). Using graphic organizers to attain relationalknowledge from expository text [Electronic version].Journal of LearningDisabilities, 35 (4), 306-321.
http://www.dinah.com
Egan, M. (1999). Reflections of effective use of graphic organizers [Electronicversion]. Journal of Adolescent & Adult Literacy, 42 (8), 641-646.
Griffin, C, & Malone, D. (1995). Effects of graphic organizer instruction on fifth-grade students [Electronic version]. Journal of Educational Research, 89 (2), 98-108.
Hyerle, D. (1995/1996). Thinking maps: Seeing is understanding [Electronicversion].Educational Leadership, 53 (4), 85-89.
http://www.inspiration.com/productinfo/kidspiration/index.cfm
James, L., Abbott, M., & Greenwood, C. (2001). How Adam became a writer[Electronic version]. The Council for Exceptional Children, 33 (3), 30-37.
Keller, C. (2002). A new twist on spelling instruction for elementary schoolteachers [Electronic version].Intervention in School & Clinic, 42 (8), 3-8.
Merkley, D.M., & Jefferies, D. (2000). Guidelines for implementing a graphicorganizer [Electronic version].Reading Teacher, 54 (4), 350-358.
http://www.ncrel.org/sdrs/areas/issues/students/learning/lrl rorg.htm
Pettus, A., & Blosser, M. (2002). Fun and learning with recall [Electronic version].Science Activities. 38 (4), 10-16.
Orlando, F., & Levy, L. (2000). Technology for teachers (2nd ed.). Dubuque:Kendall/ Hunt Publishing Company.
http://www.smcps.kl2.md.us/mbms/writing/graphorg.html
26

Appendix A(Lesson Plans for Unit)
27
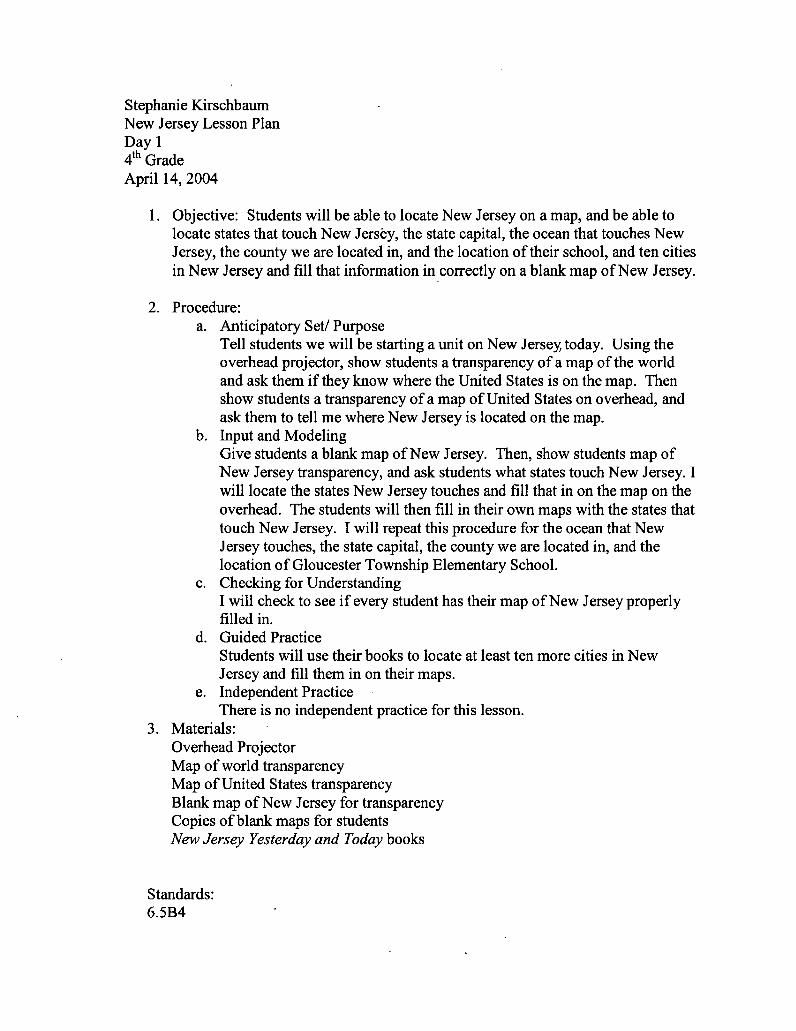
Stephanie KirschbaumNew Jersey Lesson PlanDay 14th GradeApril 14, 2004
1. Objective: Students will be able to locate New Jersey on a map, and be able tolocate states that touch New Jersey, the state capital, the ocean that touches NewJersey, the county we are located in, and the location of their school, and ten citiesin New Jersey and fill that information in correctly on a blank map of New Jersey.
2. Procedure:a. Anticipatory Set/ Purpose
Tell students we will be starting a unit on New Jersey today. Using theoverhead projector, show students a transparency of a map of the worldand ask them if they know where the United States is on the map. Thenshow students a transparency of a map of United States on overhead, andask them to tell me where New Jersey is located on the map.
b. Input and ModelingGive students a blank map of New Jersey. Then, show students map ofNew Jersey transparency, and ask students what states touch New Jersey. Iwill locate the states New Jersey touches and fill that in on the map on theoverhead. The students will then fill in their own maps with the states thattouch New Jersey. I will repeat this procedure for the ocean that NewJersey touches, the state capital, the county we are located in, and thelocation of Gloucester Township Elementary School.
c. Checking for UnderstandingI will check to see if every student has their map of New Jersey properlyfilled in.
d. Guided PracticeStudents will use their books to locate at least ten more cities in NewJersey and fill them in on their maps.
e. Independent PracticeThere is no independent practice for this lesson.
3. Materials:Overhead ProjectorMap of world transparencyMap of United States transparencyBlank map of New Jersey for transparencyCopies of blank maps for studentsNew Jersey Yesterday and Today books
Standards:6.5B4
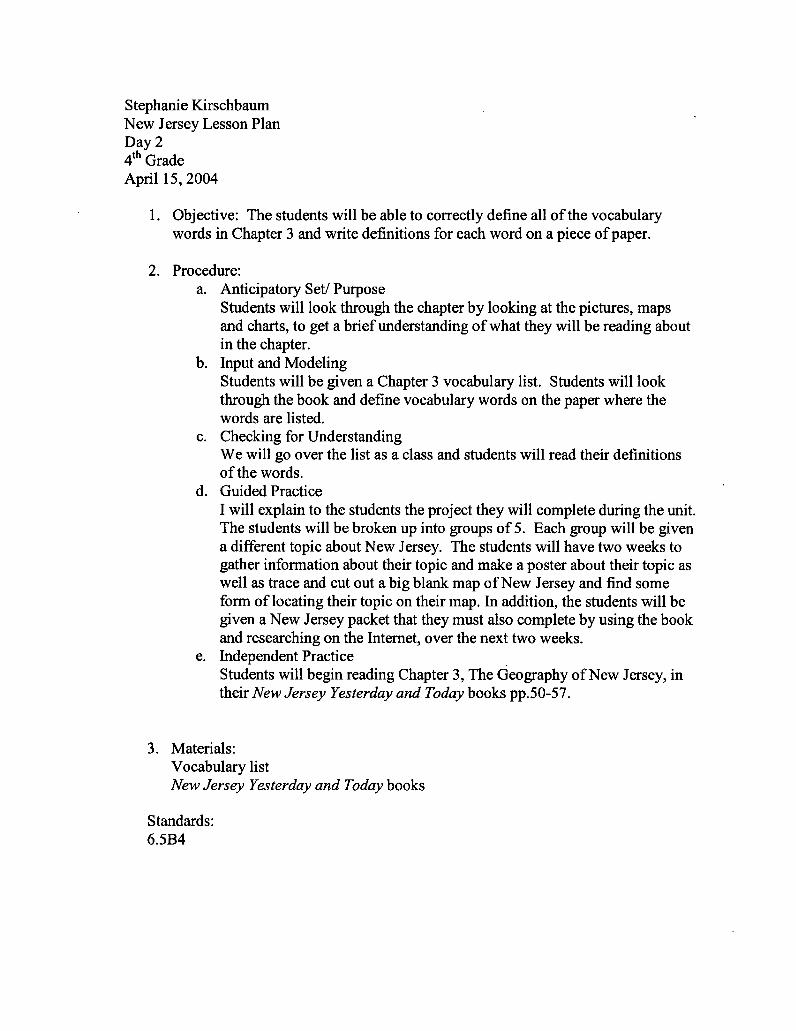
Stephanie KirschbaumNew Jersey Lesson PlanDay 24th GradeApril 15, 2004
1. Objective: The students will be able to correctly define all of the vocabularywords in Chapter 3 and write definitions for each word on a piece of paper.
2. Procedure:a. Anticipatory Set/ Purpose
Students will look through the chapter by looking at the pictures, mapsand charts, to get a brief understanding of what they will be reading aboutin the chapter.
b. Input and ModelingStudents will be given a Chapter 3 vocabulary list. Students will lookthrough the book and define vocabulary words on the paper where thewords are listed.
c. Checking for UnderstandingWe will go over the list as a class and students will read their definitionsof the words.
d. Guided PracticeI will explain to the students the project they will complete during the unit.The students will be broken up into groups of 5. Each group will be givena different topic about New Jersey. The students will have two weeks togather information about their topic and make a poster about their topic aswell as trace and cut out a big blank map of New Jersey and find someform of locating their topic on their map. In addition, the students will begiven a New Jersey packet that they must also complete by using the bookand researching on the Internet, over the next two weeks.
e. Independent PracticeStudents will begin reading Chapter 3, The Geography of New Jersey, intheir New Jersey Yesterday and Today books pp.50-57.
3. Materials:Vocabulary listNew Jersey Yesterday and Today books
Standards:6.5B4
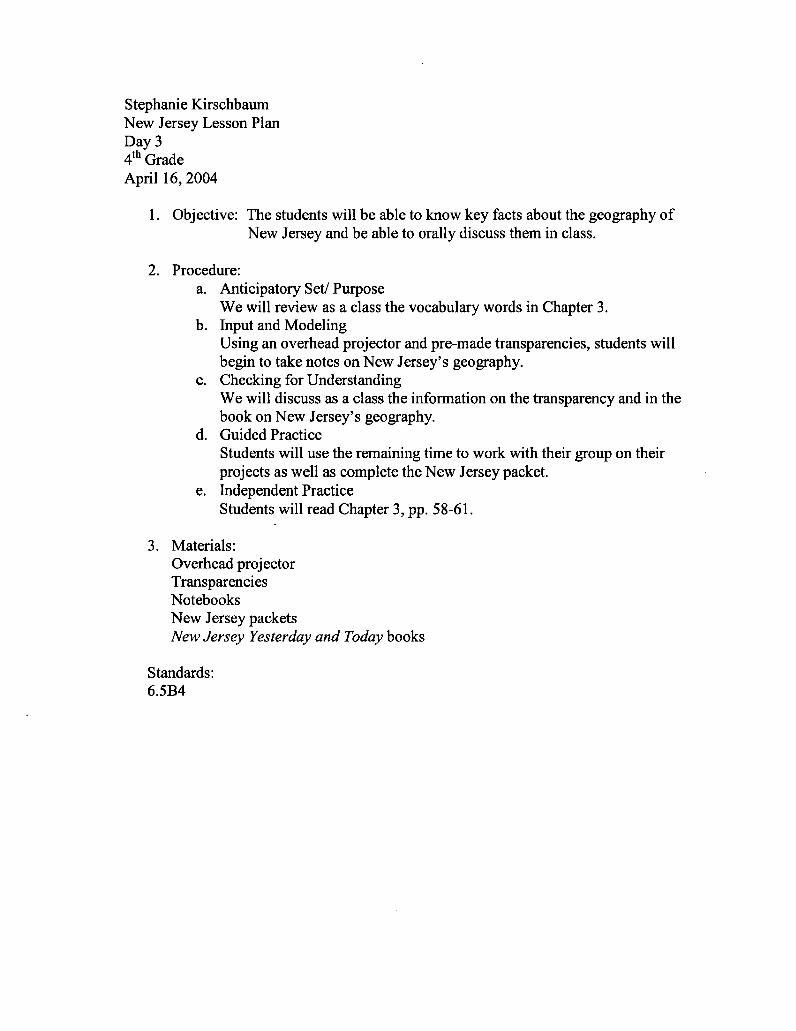
Stephanie KirschbaumNew Jersey Lesson PlanDay 34th GradeApril 16, 2004
1. Objective: The students will be able to know key facts about the geography ofNew Jersey and be able to orally discuss them in class.
2. Procedure:a. Anticipatory Set/ Purpose
We will review as a class the vocabulary words in Chapter 3.b. Input and Modeling
Using an overhead projector and pre-made transparencies, students willbegin to take notes on New Jersey's geography.
c. Checking for UnderstandingWe will discuss as a class the information on the transparency and in thebook on New Jersey's geography.
d. Guided PracticeStudents will use the remaining time to work with their group on theirprojects as well as complete the New Jersey packet.
e. Independent PracticeStudents will read Chapter 3, pp. 58-61.
3. Materials:Overhead projectorTransparenciesNotebooksNew Jersey packetsNew Jersey Yesterday and Today books
Standards:6.5B4
Stephanie KirschbaumNew Jersey Lesson PlanDay 44th GradeApril 19, 2004
1. Objective: The students will be able to identify the four natural resources ofNew Jersey and be able to orally discuss information about them inclass.
2. Procedure:a. Anticipatory Set/ Purpose
We will review as a class the geography of New Jersey.b. Input and Modeling
Using an overhead projector and pre-made transparencies, students willbegin to take notes on New Jersey's natural resources.
c. Checking for UnderstandingWe will discuss as a class the information on the transparency and in thebook about New Jersey's natural resources.
d. Guided PracticeStudents will use the remaining time to work with their group on theirprojects as well as complete the New Jersey packet.
e. Independent PracticeStudents will study for quiz.
3. Materials:Overhead projectorTransparenciesNotebooksNew Jersey packetsNew Jersey Yesterday and Today books
Standards:6.5B4
Stephanie KirschbaumNew Jersey Lesson PlanDay 5Question-Answer Quiz #14th GradeApril 20, 2004
1. Objective: Students will be able to complete a question answer quiz about thegeography of New Jersey and the four natural resources of New Jersey.
2. Procedure:a. Introduction
Students look over their notes and New Jersey Yesterday and Todaybooks as a review for the quiz.
b. Developmental ActivitiesStudents take question-answer quiz #1.
c. ConclusionWhen finished quiz, students take out a book to read, while waiting forthe remaining students to complete the quiz.
3. Materials:Teacher-made quizNew Jersey Yesterday and Today booksStudent notesBooks
Standards:6.5B16.5B4
Stephanie KirschbaumNew Jersey Lesson PlanDay 64th GradeApril 21, 2004
1. Objective: The students will be able to explain the difference between climateand weather and describe the climate of New Jersey, and discuss those topics as aclass.
2. Procedure:a. Anticipatory Set/ Purpose
We will discuss the weather outside that day. We will discuss how theweather outside compares to the weather everyday and how they relate.
b. Input and ModelingUsing an overhead projector and pre-made transparencies, students willbegin to take notes on New Jersey's climate.
c. Checking for UnderstandingWe will discuss as a class the information on the transparency and in thebook about New Jersey's climate.
d. Guided PracticeStudents will use the remaining time to work with their group on theirprojects as well as complete the New Jersey packet.
e. Independent PracticeStudents will read Chapter 4 pp. 68-69.
3. Materials:Overhead projectorTransparenciesNotebooksNew Jersey packetsNew Jersey Yesterday and Today books
Standards:6.5B4
Stephanie KirschbaumNew Jersey Lesson PlanDay 74th GradeApril 22, 2004
1. Objective: The students will be able to correctly define all of the vocabularywords in Chapter 4 and write definitions for each word on a piece of paper.
2. Procedure:a. Anticipatory Set/ Purpose
Students will look through the chapter by looking at the pictures, mapsand charts, to get a brief understanding of what they will be reading aboutin the chapter.
b. Input and ModelingStudents will be given a Chapter 4 vocabulary list. Students will lookthrough the book and define vocabulary words on the paper where thewords are listed.
c. Checking for UnderstandingWe will go over the list as a class and students will read their definitionsof the words.
d. Guided PracticeStudents will use the remaining time to work with their group on theirprojects as well as complete the New Jersey packet.
e. Independent PracticeStudents will begin reading Chapter 3, The Geography of New Jersey, intheir New Jersey Yesterday and Today books pp.50-57.
3. Materials:Vocabulary listNew Jersey Yesterday and Today books
Standards:6.5B1
Stephanie KirschbaumNew Jersey Lesson PlanDay 84th GradeApril 23, 2004
1. Objective: The students will be able to name New Jersey's four regions anddiscuss them in class.
2. Procedure:a. Anticipatory Set/ Purpose
We will review New Jersey's climate.b. Input and Modeling
Using an overhead projector and pre-made transparencies, students willbegin to take notes on the regions of New Jersey.
c. Checking for UnderstandingWe will discuss as a class the information on the transparency and in thebook about the regions of New Jersey
d. Guided PracticeStudents will use the remaining time to work with their group on theirprojects as well as complete the New Jersey packet.
e. Independent PracticeStudents will study for quiz.
3. Materials:Overhead projectorTransparenciesNotebooksNew Jersey packetsNew Jersey Yesterday and Today books
Standards:6.5B16.5B4
Stephanie KirschbaumNew Jersey Lesson PlanDay 9Graphic Organizer Quiz #14th GradeApril 26, 2004
1. Objective: Students will be able to complete a graphic organizer quiz aboutthe weather and climate of New Jersey and the four regions of New Jersey.
2. Procedure:a. Introduction
Students look over their notes and New Jersey Yesterday and Todaytextbooks as a review for the quiz.
b. Developmental ActivitiesStudents take graphic organizer quiz #1.
c. ConclusionWhen finished quiz, students take out a book to read, while waiting forthe remaining students to complete the quiz.
3. Materials:Teacher-made quizNew Jersey Yesterday and Today textbooksStudent notesBooks
4. Independent Practice:For homework, students will read pgs. 71-73 in textbook.
Standards:6.5B16.5B4
Stephanie KirschbaumNew Jersey Lesson PlanDay 104th GradeApril 27, 2004
1. Objective: The students will be able to name and locate two parts of NewJersey's Atlantic Coastal Plain and discuss them in class.
2. Procedure:a. Anticipatory Set/ Purpose
We will discuss what people do for a living and for fun on the AtlanticCoastal Plain.
b. Input and ModelingUsing an overhead projector and pre-made transparencies, students willbegin to take notes on the Atlantic Coastal Plain of New Jersey.
c. Checking for UnderstandingWe will discuss as a class the information on the transparency and in thebook about the Atlantic Coastal Plain of New Jersey
d. Guided PracticeStudents will use the remaining time to work with their group on theirprojects as well as complete the New Jersey packet.
e. Independent PracticeStudents will read Chapter 4, pp.74-76.
3. Materials:Overhead projectorTransparenciesNotebooksNew Jersey packetsNew Jersey Yesterday and Today books
Standards:6.5B1
Stephanie KirschbaumNew Jersey Lesson PlanDay 114th GradeApril 28, 2004
1. Objective: The students will be able to name and locate the Piedmont region anddiscuss it in class.
2. Procedure:a. Anticipatory Set/ Purpose
We will review the Atlantic Coastal Plain.b. Input and Modeling
Using an overhead projector and pre-made transparencies, students willbegin to take notes on the Piedmont region.
c. Checking for UnderstandingWe will discuss as a class the information on the transparency and in thebook about the Piedmont region.
d. Guided PracticeStudents will use the remaining time to work with their group on theirprojects as well as complete the New Jersey packet.
e. Independent PracticeStudents will study for quiz.
3. Materials:Overhead projectorTransparenciesNotebooksNew Jersey packetsNew Jersey Yesterday and Today books
Standards:6.5B1
Stephanie KirschbaumNew Jersey Lesson PlanDay 12Question-Answer Quiz #24th GradeApril 29, 2004
1. Objective: Students will be able to complete a question answer quiz about theNew Jersey's Atlantic Coastal Plain and Piedmont regions.
2. Procedure:a. Introduction
Students look over their notes and New Jersey Yesterday and Todaybooks as a review for the quiz.
b. Developmental ActivitiesStudents take question-answer quiz #2.
c. ConclusionWhen finished quiz, students take out a book to read, while waiting forthe remaining students to complete the quiz.
3. Materials:Teacher-made quizNew Jersey Yesterday and Today booksStudent notesBooks
4. Independent PracticeFor homework, students will read pgs. 77-78 in textbook.
Standards:6.5B1
Stephanie KirschbaumNew Jersey Lesson PlanDay 134th GradeApril 30, 2004
1. Objective: The students will be able to name and locate the Highlands region anddiscuss it in class.
2. Procedure:a. Anticipatory Set/ Purpose
We will discuss what brings people to the Highlands.b. Input and Modeling
Using an overhead projector and pre-made transparencies, students willbegin to take notes on the Highlands region.
c. Checking for UnderstandingWe will discuss as a class the information on the transparency and in thebook about the Highlands region.
d. Guided PracticeStudents will use the remaining time to work with their group on theirprojects as well as complete the New Jersey packet.
e. Independent PracticeStudents will read Chapter 4 pp. 79-80.
3. Materials:Overhead projectorTransparenciesNotebooksNew Jersey packetsNew Jersey Yesterday and Today books
Standards:6.5B1
Stephanie KirschbaumNew Jersey Lesson PlanDay 144th GradeMay 3, 2004
1. Objective: The students will be able to name and locate the Ridge and Valleyregion and discuss it in class.
2. Procedure:a. Anticipatory Set/ Purpose
We will review what brings people to the Highlands.b. Input and Modeling
Using an overhead projector and pre-made transparencies, students willbegin to take notes on the Ridge and Valley region.
c. Checking for UnderstandingWe will discuss as a class the information on the transparency and in thebook about the Ridge and Valley region.
d. Guided PracticeStudents will use the remaining time to work with their group on theirprojects as well as complete the New Jersey packet.
e. Independent PracticeStudents will study for quiz.
3. Materials:Overhead projectorTransparenciesNotebooksNew Jersey packetsNew Jersey Yesterday and Today books
Standards:6.5B1
Stephanie KirschbaumNew Jersey Lesson PlanDay 15Graphic Organizer Quiz #24th GradeMay 4, 2004
1. Objective: Students will be able to complete a graphic organizer quiz aboutthe Highlands and Ridge and Valley regions of New Jersey.
2. Procedure:a. Introduction
Students look over their notes and New Jersey Yesterday and Todaytextbooks as a review for the quiz.
b. Developmental ActivitiesStudents take graphic organizer quiz #2.
c. ConclusionWhen finished quiz, students take out a book to read, while waiting forthe remaining students to complete the quiz.
3. Materials:Teacher-made quizNew Jersey Yesterday and Today textbooksStudent notesBooks
Standards:6.5B1
Appendix B(New Jersey Quiz 1)
43
NameDate
New Jersey Quiz #1
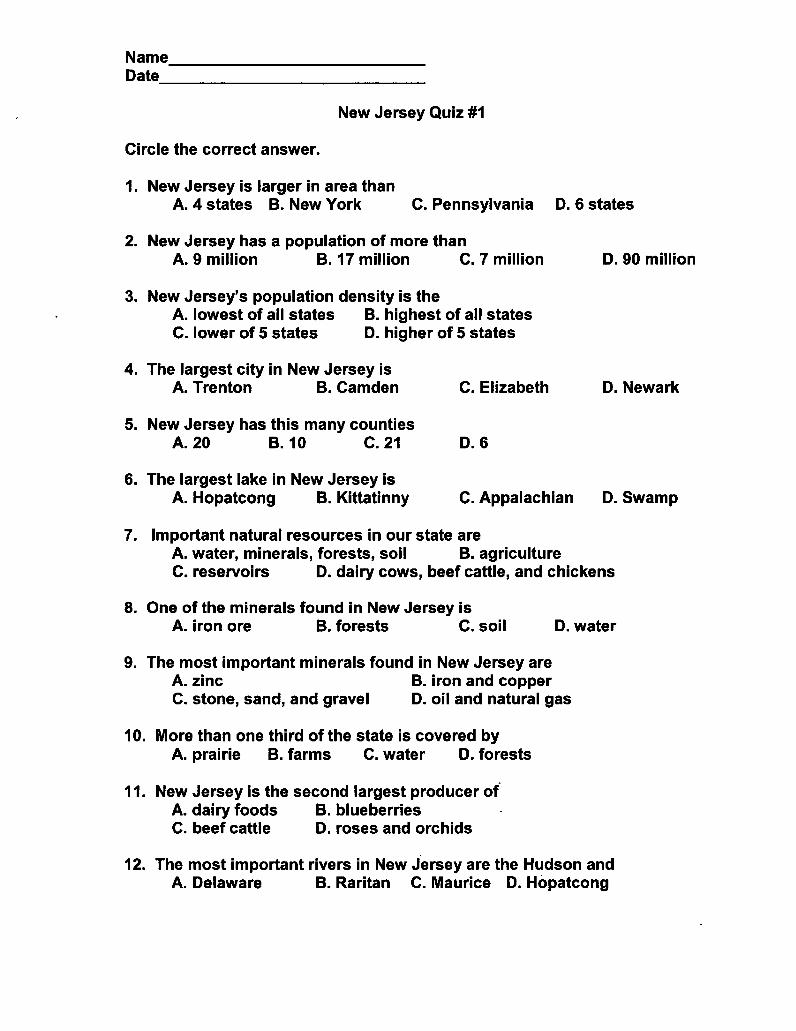
Circle the correct answer.
1. New Jersey is larger in area thanA. 4 states B. New York C. Pennsylvania D. 6 states
2. New Jersey has a population of more thanA. 9 million B. 17 million C. 7 million D. 90 million
3. New Jersey's population density is theA. lowest of all states B. highest of all statesC. lower of 5 states D. higher of 5 states
4. The largest city in New Jersey isA. Trenton B. Camden C. Elizabeth D. Newark
5. New Jersey has this many countiesA. 20 B. 10 C. 21
6. The largest lake in New Jersey isA. Hopatcong B. Kittatinny C. Appalachian D. Swamp
7. Important natural resources in our state areA. water, minerals, forests, soil B. agricultureC. reservoirs D. dairy cows, beef cattle, and chickens
8. One of the minerals found in New Jersey isA. iron ore B. forests C. soil D. water
9. The most important minerals found in New Jersey areA. zinc B. iron and copperC. stone, sand, and gravel D. oil and natural gas
10. More than one third of the state is covered byA. prairie B. farms C. water D. forests
11. New Jersey is theA. dairy foodsC. beef cattle
second largest producer ofB. blueberriesD. roses and orchids
12. The most important rivers in New Jersey are the Hudson andA. Delaware B. Raritan C. Maurice D. Hopatcong
D. 6

Appendix C(New Jersey Quiz'2)
45
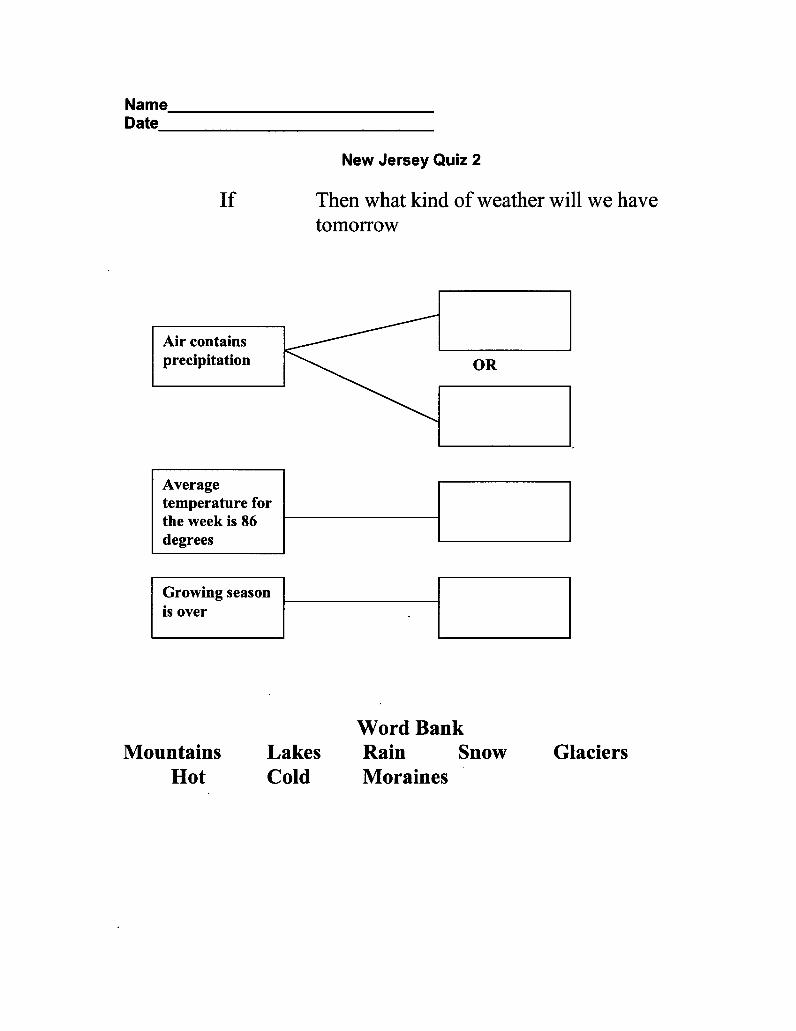
New Jersey Quiz 2
Then what kind of weather will we havetomorrow
Averagetemperature forthe week is 86degrees I I
Word BankMountains
HotLakesCold
RainMoraines
Snow Glaciers
NameDate
If
I
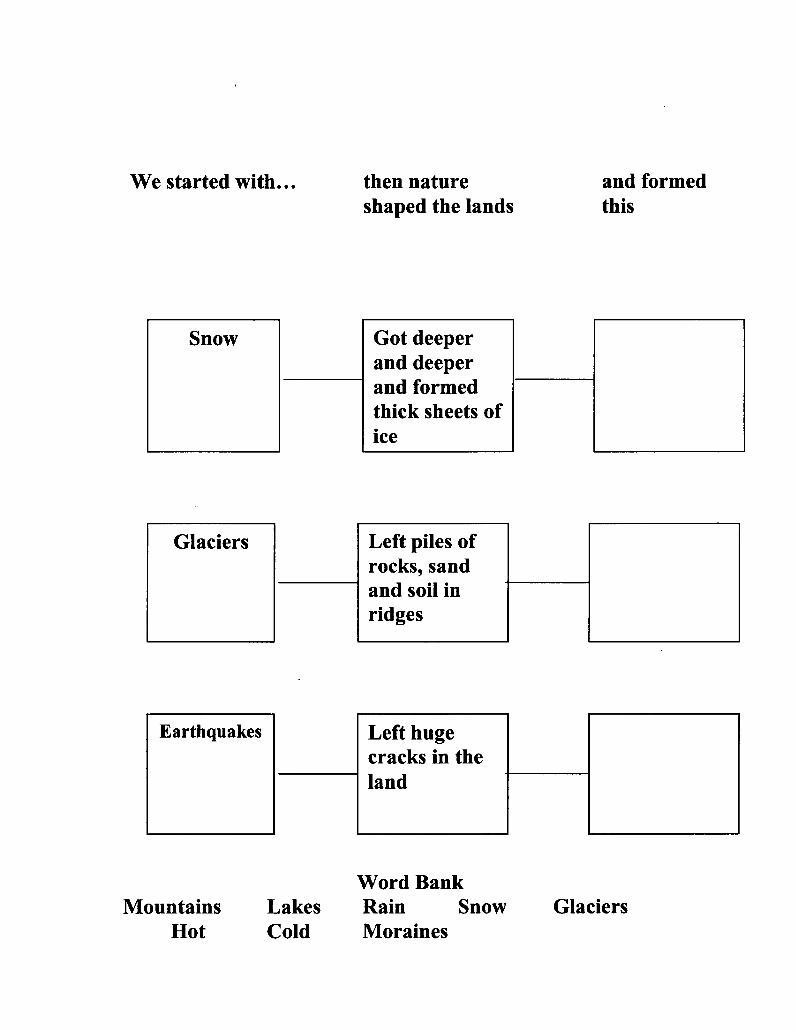
We started with... then natureshaped the lands
and formedthis
Snow
Glaciers
Earthquakes
Got deeperand deeperand formedthick sheets ofice
Left piles ofrocks, sandand soil inridges
Left hugecracks in theland
MountainsHot
LakesCold
Word BankRain SnowMoraines
Glaciers

Appendix D(New Jersey Quiz 3)
48
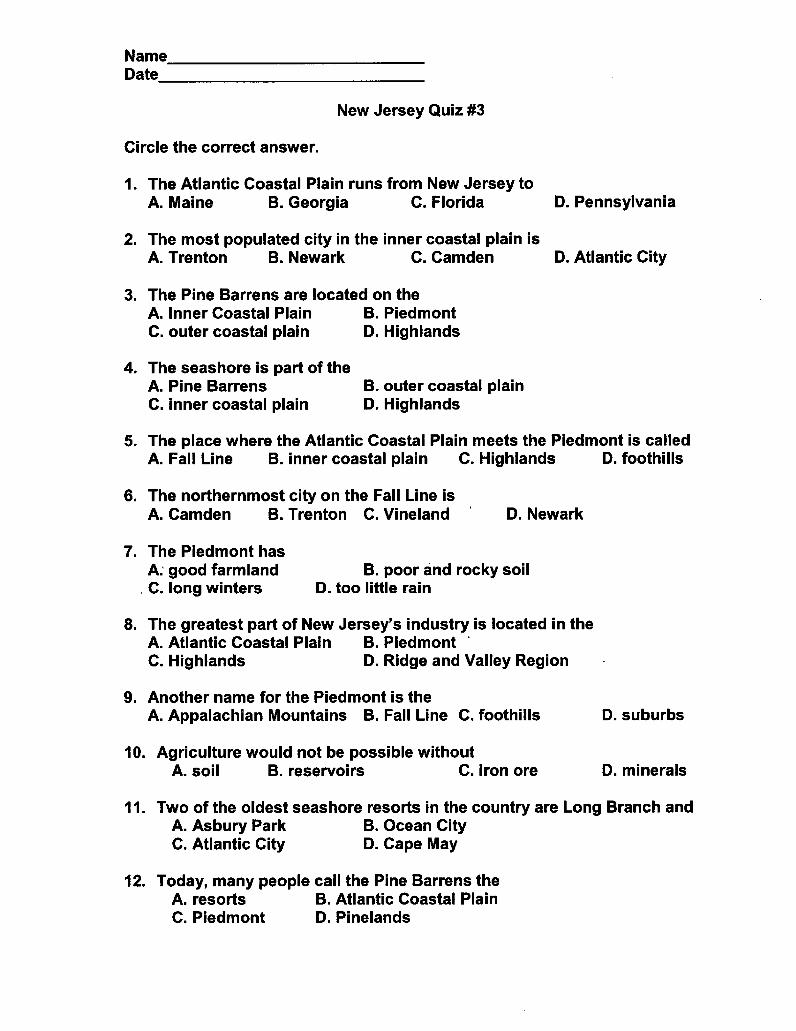
NameDate
New Jersey Quiz #3
Circle the correct answer.
1. The Atlantic Coastal Plain runs from New Jersey toA. Maine B. Georgia C. Florida
2. The most populated city in the inner coastal plain isA. Trenton B. Newark C. Camden
D. Pennsylvania
D. Atlantic City
3. The Pine Barrens are located on theA. Inner Coastal Plain B. PiedmontC. outer coastal plain D. Highlands
4. The seashore is part of theA. Pine BarrensC. inner coastal plain
B. outer coastal plainD. Highlands
5. The place where the Atlantic Coastal Plain meets the Piedmont is calledA. Fall Line B. inner coastal plain C. Highlands D. foothills
6. The northernmost city on the Fall Line isA. Camden B. Trenton C. Vineland
7. The Piedmont hasA: good farmlandC. long winters
D. Newark
B. poor and rocky soilD. too little rain
8. The greatest part of New Jersey's industry is located in theA. Atlantic Coastal Plain B. PiedmontC. Highlands D. Ridge and Valley Region
9. Another name for the Piedmont is theA. Appalachian Mountains B. Fall Line C. foothills
10. Agriculture would not be possible withoutA. soil B. reservoirs C. iron ore
D. suburbs
D. minerals
11. Two of the oldest seashore resorts in the country are Long Branch andA. Asbury Park B. Ocean CityC. Atlantic City D. Cape May
12. Today, many people call the Pine Barrens theA. resorts B. Atlantic Coastal PlainC. Piedmont D. Pinelands

Appendix E(New Jersey Quiz 4)
50
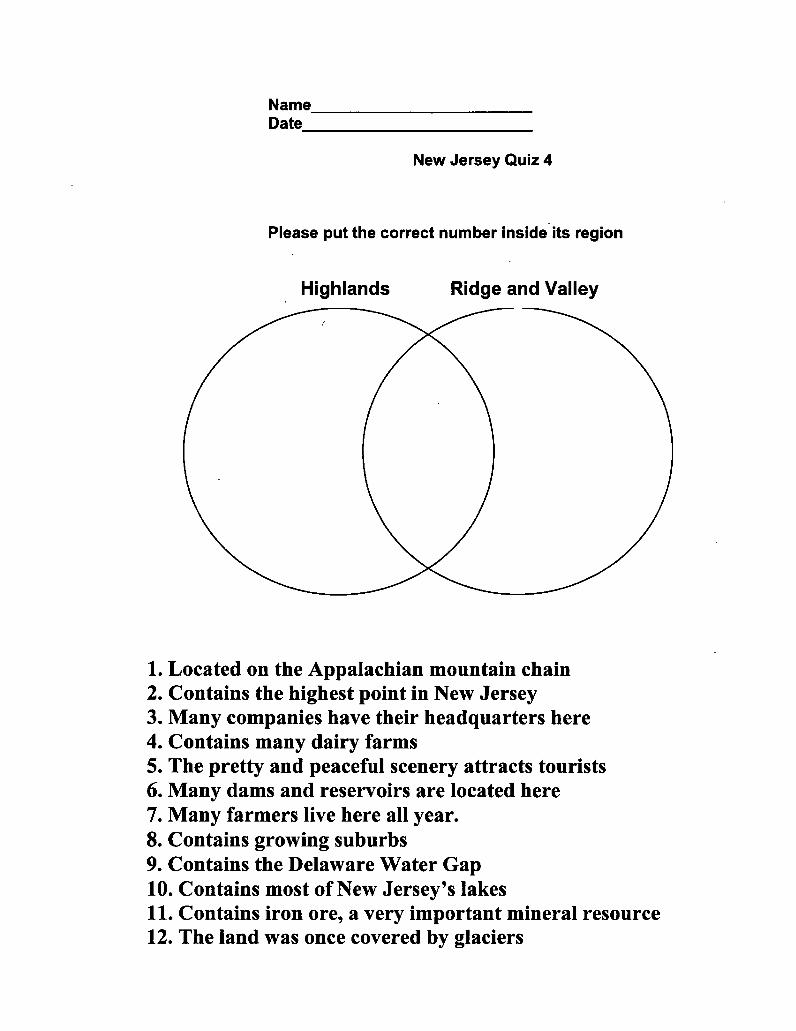
NameDate
New Jersey Quiz 4
Please put the correct number inside its region
Highlands Ridge and Valley
1. Located on the Appalachian mountain chain2. Contains the highest point in New Jersey3. Many companies have their headquarters here4. Contains many dairy farms5. The pretty and peaceful scenery attracts tourists6. Many dams and reservoirs are located here7. Many farmers live here all year.8. Contains growing suburbs9. Contains the Delaware Water Gap10. Contains most of New Jersey's lakes11. Contains iron ore, a very important mineral resource12. The land was once covered by glaciers