Embed Size (px)
Citation preview

BRUSSELS ECONOMIC REVIEW – CAHIERS ECONOMIQUES DE BRUXELLES VOL. 52 N°(2/3) SUMMER-AUTUMN 2009
THE EFFECT OF GDP GROWTH ON
PHARMACEUTICAL PATENT PROTECTION, 1945-2005
SUMNER LA CROIX (UNIVERSITY OF HAWAII-MANOA) AND MING LIU
* (UNIVERSITY OF HAWAII-MANOA)
ABSTRACT : We investigate whether there is a U-shaped relationship between GDP per capita and country patent protection for pharmaceuticals. Using the Pharmaceutical Intellectual Property Protection (PIPP) Index, we find no evidence of a U-shaped relationship for any of the 154 countries in our sample or for global aggregates. There is, however, evidence for a U-shaped relationship in some annual cross-section scatter plots and Tobit regressions. Using a random-effects Tobit estimator and cubic as well as quadratic GDP per capita variables, we find evidence both for and against a monotonically increasing relationship between GDP and the predicted PIPP Index.
KEYWORDS : patents; pharmaceuticals; PIPP Index; GDP. JEL CLASSIFICATION : L65, O14, O34.
* Professor, Department of Economics, University of Hawaii-Manoa, Honolulu, Hawaii, USA 96822; email:
[email protected]; tel: 1 (808) 956-7061; fax: 1 (808) 956-4347; and Doctoral Candidate, Dept. of Economics, University of Hawaii-Manoa, Honolulu, Hawaii 96822; email: [email protected]; fax: 1 (808) 956-4347. We thank Chung Lee, Sang-Hyop Lee, Ilan Noy, Sun Ki Chai, Theresa Greaney, and Tim Halliday for useful discussions. We are responsible for all errors of commission and omission.
1
THE EFFECT OF GDP GROWTH ON PHARMACEUTICAL PATENT PROTECTION, 1945-2005
INTRODUCTION
Why do countries adopt stronger patent rights? Many of the researchers [Maskus and Penubarti, 1995; Ginarte and Park, 1997; Maskus 2000; Chen and Puttitanun, 2005; Briggs 2007] who have investigated this question with theoretical models and econometric analyses of multi-country data sets have identified a U-shaped relationship between GDP and the Ginarte-Park Index of patent rights. We extend this literature by examining whether the U-shaped relationship can be identified for pharmaceutical patent protection within countries and in a panel of countries. The analysis uses a recently developed index [the Pharmaceutical Intellectual Property Protection (PIPP Index] that measures the scope and strength of patent rights protecting pharmaceutical innovations in 154 countries from 1960 to 2005 (Liu and La Croix, 2005). The pharmaceutical industry provides an excellent laboratory for studying the U-shaped relationship, as both industry insiders and researchers agree that the research, development and marketing of new drugs depend critically on patent protection for pharmaceutical innovations.
We find no evidence of a U-shaped relationship for any of the 154 countries in our sample or the global economy. There is, however, considerable visual and econometric evidence of the U-shaped relationship in cross-section scatter plots and Tobit regressions incorporating quadratic GDP per capita. Using a random-effects Tobit estimator and cubic as well as quadratic GDP per capita variables, we find evidence both for and against a monotonically increasing relationship between GDP and the predicted PIPP Index.
1. A BRIEF HISTORY OF PHARMACEUTICAL PATENT RIGHTS
In 1960, only two countries—the United States and Great Britain—issued patents covering new pharmaceutical products. Since the passage of the 1790 Patent Law, the U.S. government has continuously provided patents for new pharmaceutical processes and products.1 Great Britain issued pharmaceutical product patents between 1630 and 1919.2 From 1883 Britain took advantage of the (newly concluded) Paris Convention’s provisions allowing countries to issue compulsory licenses (known as “licenses of right”) for non-worked patents in pharmaceuticals and foodstuffs. After World War I, Britain passed the Patent Act of 1919, which abolished product patents for chemicals and pharmaceuticals and allowed any manufacturer to license any pharmaceutical and foodstuff process patent as a matter of right, regardless of whether the process patent was already being worked in Great Britain.3 Changes in 1949 to Britain’s patent law re-
1 Act of 10 April 1790 and Act of 21 February 1793. 2 See Corley (2003) for a brief history of the U.K. pharmaceutical industry. 3 The British Patent Act of 1919, Section 38 A (1): “In the case of inventions relating to substances prepared
or produced by chemical processes or intended for food or medicine, the specification shall not include claims for the substance itself, except when prepared or produced by special methods or processes of manufacture described and claimed or by their obvious chemical equivalents”. This provision was prompted by British firms’ use of German pharmaceutical processes during wartime without payment of
2

SUMNER LACROIX AND MING LIU
established chemical and pharmaceutical product patents, but did not alter its licenses of right in products and processes. Testimony against licenses of right by pharmaceutical companies before the Banks Committee in 1969 was a major factor behind Parliament’s decision to abolish them in 1977.
In France, the 1844 Patent Law specified that pharmaceutical inventions could not be patented. France introduced pharmaceutical process patents in 1883 and started the process of establishing property rights in new pharmaceutical products with an executive order on February 4, 1959. France amended its patent law in 1966 to provide some protection for pharmaceutical products, and further amendments in 1978 finally produced a pharmaceutical product patent (Boldrin and Levine, 2005; WIPO, 1988).
Other industrialized countries, including Australia (1990),4 Canada (1987),5 Finland (1995), Germany (1968), Norway (1992), Spain (1992), Sweden (1978), Switzerland (1977), Italy (1978), and Japan (1976)6 introduced pharmaceutical and chemical process patents in the nineteenth century but only began to issue pharmaceutical product patents from 1968 (Nogues, 1990).
A few developing countries—Brazil, India, and some African and Latin American countries—started to grant pharmaceutical process patents from the early 1950s.7 However, until 1963,8 not a single developing country issued or recognized pharmaceutical product patents. Some of the earliest developing country adopters were British and French colonies. Because Britain and France were relatively early adopters of pharmaceutical product patents, their legal heritage carried over to 15 former British colonies who are members of the African Regional Intellectual Property Organization (ARIPO) and to 16 former French colonies who are members of the Organisation Africaine de la Propriete Intellectuelle (OAPI). OAPI members have allowed pharmaceutical products to be patented since the Bangui Agreement of 1977, and
royalties. The post-war change in British patent law enabled British firms to continue to produce these drugs without resumption of royalty payments to German firms (Pitkethly 1999).
4 While the Australia Patents Act (1952) contained no prohibitions on patents for pharmaceutical products or processes, we follow WIPO’s classification that Australia established pharmaceutical process and product patents in 1990 (WIPO, 1988 and Nogues, 1990).
5 From 1919 to 1993, Canada followed the practices of the British Patent Act of 1919 by only allowing pharmaceutical processes to be patented. From 1919 to 1969, Canada also allowed for and issued compulsory licenses for manufacturing a drug using a patented process. From 1969 to 1987 Canada also issued compulsory licenses allowing a company to import a drug protected by process patents. In 1983, Canada established a pharmaceutical product patent, and in 1987 amended the Canada Patent Act to restrict compulsory licenses (Bill C-22, Patent Act Amendment 1987).
6 From the passage of its first patent law in 1885, Japan allowed process but not product patents for new drugs. As in Great Britain, change was driven by shifting interests among its domestic drug manufacturers. After a 1971 survey indicated that Japanese drug manufacturers favored the implementation of product patents, the Diet passed enabling amendments to the patent law in 1975, which took effect in 1976 (Kawaura and La Croix, 1995).
7 Smaller developing countries have frequently imported generic versions of drugs protected by product patents in the United States or Great Britain from larger developing countries, such as Brazil and India.
8 Rwanda (1963 Patent Act) and Burundi (1964 Patent Act) were the first two developing countries to recognize pharmaceutical product patents (Thorpe, 2003).
3

THE EFFECT OF GDP GROWTH ON PHARMACEUTICAL PATENT PROTECTION, 1945-2005
ARIPO members (except Ghana and Malawi) have gradually introduced product patents from 1984.
Beginning in the early 1980s the United States imposed strong pressure on developing countries with weak IPR laws and institutions through its Special 301 provision of the U.S. Trade Act of 1974. Special 301 directs the U.S. Trade Representative to investigate foreign protection of U.S. intellectual property holders, negotiate higher intellectual property standards, and retaliate with trade sanctions if these negotiations fail. Using a number of designated threat levels—for example countries could be placed on a watch list, a priority list, or designated for such lists but not placed on them, the United States initiated Special 301 investigations of numerous Asian and Latin American countries. In response to the U.S. investigations and E.U. diplomatic pressure, a number of Asian and South American countries strengthened their patent laws and institutions, agreeing, among other things, to establish patent protection for new pharmaceutical products.9 Malaysia (1986), Taiwan (1986) and South Korea (1987) were among the first developing countries in Asia to issue pharmaceutical product patents and were followed just a few years later by Thailand in 1992 and China in 1993 (La Croix and Kawaura, 1996).10 Some developing countries in Asia did not have patent laws when the United States and the European Union began to lobby other countries to strengthen pharmaceutical product patents. For example, Indonesia passed its first patent law in 1991 and amended it in 1997 to allow pharmaceutical product patents to be issued. In South America, Chile (1991), the Andean countries (1994),11 and Argentina (1996) introduced pharmaceutical product patents in response to U.S. pressure.
The adoption of the Trade-Related Aspects of Intellectual Property Rights (TRIPS) Agreement as part of the 1995 WTO Agreement was a watershed for the global protection of pharmaceutical innovations. TRIPS required that all member countries provide pharmaceutical product and process patents. By 2006, 101 developing countries had changed their laws to provide pharmaceutical product patents (Liu and La Croix, 2008).12 Sixteen countries in our sample have never provided pharmaceutical process patents and 23 countries have never provided pharmaceutical product patent.13 These countries are either least-developed countries or Middle Eastern countries. With the exceptions of Cuba, Pakistan, Haiti, Jordan and Tunisia, they are not WTO members.
9 See La Croix (1994) and Blakeney (1996) for a discussion of changes in IPRs in the ASEAN countries
between 1980 and 1993. 10 China’s patent law was enacted in 1992 and took effect in 1993 (Patent Law of the People’s Republic of
China, Amendment 1992). 11 The Andean countries are Colombia, Ecuador, Peru, Bolivia and Chile. 12 The TRIPS Agreement contains several provisions that specify transition periods for WTO members to
adapt their legislation and practices to fit their TRIPS obligations. Sixty-three developing countries provided pharmaceutical product patents prior to the TRIPS Agreement.
13 The 23 countries are Afghanistan, Algeria, Angola, Cambodia, Cuba, Eritrea, Haiti, Iran, Jordan, Kuwait, Laos, Lebanon, Myanmar, Mongolia, Namibia, Nepal, Oman, Pakistan, Saudi Arabia, Somalia, Tunisia, United Arab Emirates and Yemen and Syria. Among them, Algeria, Angola, Haiti, Iran, Pakistan, Tunisia and Syria provide process patents.
4

SUMNER LACROIX AND MING LIU
Some of these countries have been plagued by civil wars, e.g. Afghanistan and Nepal, and internal disturbances, e.g. Myanmar.
2. A SURVEY OF THE RELATIONSHIP BETWEEN GDP PER CAPITA AND PATENT STRENGTH
The U-shaped relationship between the log of per capita GDP and a country’s patent protection is of recent vintage, as the first indexes of patent protection only became available in 1990 (Rapp and Rozek) and 1997 (Ginarte and Park). Maskus and Penubarti (1995) identified a positive and statistically significant estimated coefficient for the log of GNP per capita on an instrument-corrected Rapp-Rozek Patent Index in a cross-section regression covering 48 countries in 1984. While they did not report results for specifications with higher orders of log GNP, they presciently observed that “[c]ountries with high or low income levels seem to have predicted patent indexes above the regression line, while those in the middle tend to have indexes below the line” (p. 237). Park and Ginarte (1997) identified a positive and statistically significant estimated coefficient for ln GDP per capita in a regression on the log of the Ginarte-Park Patent Index for a panel of 48 countries covering 1965, 1975, 1985, and 1995. They also did not report results for specifications with higher orders of ln GDP.
Maskus (2000) first explicitly identified the U-shaped relationship using estimated coefficients for log GNP per capita and [log GNP]2 on the instrument-corrected Rapp-Rozek Patent Index in a cross-section regression that covered the same sample of countries used in Maskus and Penubarti (1995). Maskus then estimated pooled OLS regressions for a panel of 72 countries in 1985 and 1990 with the log of the Park-Ginarte Patent Index as the dependent variable. His empirical results—a negative and statistically significant estimated coefficient on ln GDP per capita and a positive and statistically significant estimated coefficient on [ln GDP per capita]2—are consistent with a U-shaped relationship between GDP and patent strength. The U-shaped relationship is robust to the addition of other explanatory variables to the model, such as measures of openness to trade, lagged school enrollment, total GDP, the proportion of scientists and engineers in the labor force, and British and French colonial origins (pp. 102-109).
Chen and Puttitanun (2005) develop a theoretical model within which “there exist plausible situations where, starting from a low level of development, increases in the level of development lower IPRs initially but raise IPRs after a certain point” (p. 476). They postulate that as very poor countries grew, their ability to imitate inventions improves. Policymakers rationally respond by reducing the country’s level of patent protection, thereby enabling firms to imitate and produce products and processes patented in foreign countries. Regressions of ln GDP per capita and [ln GDP per capita]2 on the Ginarte-Park Patent Index provide a negative and statistically significant estimated coefficient for ln GDP per capita and a positive and statistically significant
5

THE EFFECT OF GDP GROWTH ON PHARMACEUTICAL PATENT PROTECTION, 1945-2005
estimated coefficient for [og GDP per capita]2, i.e., a U-shaped relationship between GDP and patent protection.14 Briggs (2007) argues that the U-shaped relationship between GDP and patent strength found in cross-section and panel regression estimates is a misleading guide to the longitudinal experiences of the vast majority of countries in the Ginarte-Park data set. She notes that only 13 countries weakened patent rights over time and that the U-shaped relationship revealed in cross-section and panel regressions disappears once countries with similar trends in their PIPP Indexes are grouped together in panel regressions. Briggs rejects the theoretical connections between GDP and patent protection developed by Chen and Puttitanun, arguing instead that the U-shaped relationship is driven by U.S. pressure on poor and middle-income countries to strengthen and enforce patent rights. Poor countries do not have the political and economic clout to resist U.S. pressure and thus respond by increasing their patent protection. Middle-income countries have more alternatives and are able to bargain with the U.S. government for smaller increases in patent protection. Coupled with the strong incentives for rich countries to establish strong patent rights, the expected result is a U-shaped relationship in the cross-section but not for the time series of particular countries.15
3. METHODOLOGY AND DATA
Our empirical search for a U-shaped relationship between GDP and pharmaceutical patent protection proceeds by investigating the relationship from four different perspectives. First, we examine whether the relationship emerges at the global level, between average global GDP and a measure of global pharmaceutical patent protection. Second, we examine graphs for each of the 154 countries in our sample for evidence of a U-shaped relationship between GDP and pharmaceutical patent protection. Second, we examine scatter plots and use OLS regression analysis to examine whether the U-shaped relationship emerges in a cross-country sample for a particular year. And, finally, we use a random-effects Tobit estimator to investigate whether the U-shaped relationship found in some cross-section regressions persists in panel regressions. We conclude that the U-shaped relationship found in cross-section samples is not found in the time series of any individual country. Regression analysis using panel data provides evidence both for and against the relationship.
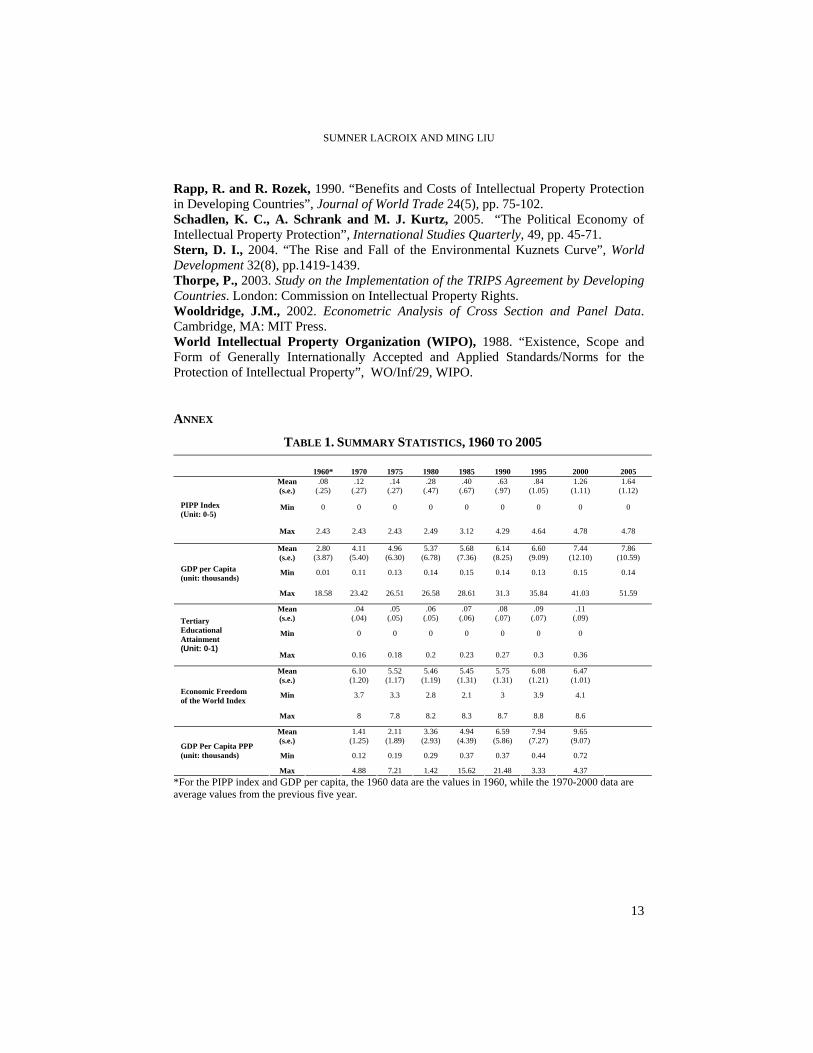
Summary statistics from our data set are displayed in Table 1. The PIPP Index is calculated annually from 1960 to 2005 for 154 countries (Liu and La Croix, 2008). It measures whether a country has established six types of intellectual property rights in pharmaceuticals, seven statutory measures of enforcement, and three measures of the extent to which foreigners can establish and enforce intellectual property rights in pharmaceuticals. We find that the PIPP Index varies systematically over time and
14 The relationship is found in models with and without time dummies and when semi-parametric estimators
are used. 15 See also Lai (2008).
6

SUMNER LACROIX AND MING LIU
across countries. Over the entire sample period, it trends upwards for both developed and developing countries. Most countries did not establish property rights in pharmaceutical innovations until they were pressured to do so or had become high-income countries. The 1995 TRIPS Agreement dramatically increased the extent of intellectual property protection for pharmaceutical products for countries at all levels of development. After 1995 the ratio of the average PIPP value for developed countries over the average PIPP value for developing countries fell due to strong increases in protection among developing countries. The PIPP Index ranges from 0 to 4.78 over the sample period, with the United States registering the highest values in all years. Five countries register “0” for the PIPP index over the entire sample period.16
We use two alternative measures of GDP per capita in our regression analysis. All reported regressions use constant exchange value ($US2000) GDP per capita data from the World Development Indicators (WDI, 2005) database. Other unreported regressions use purchasing power parity constant GDP per capita from the Penn World Tables (Heston et al 2006, table 6.2).17
Our econometric analysis uses two additional control variables: the Economic Freedom of the World Index and the tertiary school attainment rate. The Economic Freedom of the World Index (Gwartney and Lawson, 2007) was developed to measure a country’s openness to international trade, its property rights institutions, and the development of financial institutions. A composite of 42 distinct measures, it ranges from 0 to 10, with higher values indicating a higher level of economic freedom. The Index covers 53 countries in 1970 and 141 in 2006. It is available in five-year intervals from 1970 and annually from 2000.
Since the pharmaceutical industry requires highly skilled employees, we include a measure of human capital attainment as a control variable in some regression specifications. Lutz et al. (2007) provide a tertiary school attainment rate that measures the percent of the labor force that has completed the first level of tertiary education, usually a B.A. degree. Their data set covers five-year intervals for 120 countries from 1970 to 2000.
4. EMPIRICAL ANALYSIS
Our analysis begins by examining whether there is a U-shaped relationship between global GDP per capita and the global PIPP Index. Figure 1-a displays the global PIPP Index—the unweighted sum of each country’s PIPP Index—and average global GDP per capita, i.e., real global GDP divided by global population. Since the global PIPP Index is monotonically non-decreasing and global GDP per capita increases in 43 of 46
16 The five countries with zero values are Barbados, Nepal, Iran, Papua New Guinea, and Serbia and
Montenegro. 17 Regression results do not change substantially when purchasing power parity GDP per capita is used
instead of exchange rate-weighted GDP per capita.
7

THE EFFECT OF GDP GROWTH ON PHARMACEUTICAL PATENT PROTECTION, 1945-2005
years, a U-shaped relationship that encompasses the downward-sloping portion of the U-shaped relationship over the relevant range of data is implausible. Figure 1-b plots the global PIPP Index against global GDP per capita and displays no signs of a U-shaped relationship.
Second, we examine the relationship between GDP and the PIPP Index for individual countries from 1960 to 2005. In all 154 countries in our sample, the PIPP Index is monotonically non-decreasing. Figure 2 displays the PIPP Index for three developing countries, three emerging countries, and three developed countries. In each of these nine countries, the PIPP Index follows a staircase pattern, with long constant periods followed by jumps of varying levels to a new step.
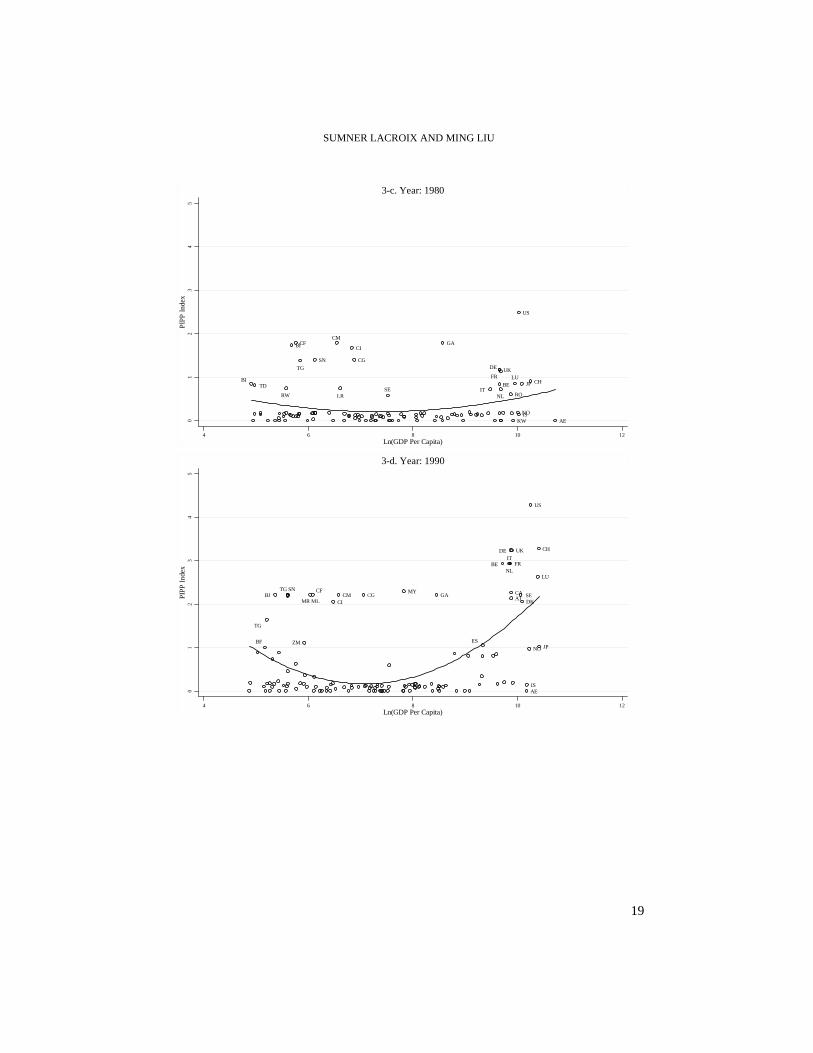
Next, we investigate whether a U-shape relationship between GDP and the PIPP Index exists within decadal cross sections from our sample. Figure 3 provides scatter plots for 1960, 1970, 1980, 1990, 2000, and 2005, which are overlaid with a regression line plotting the predicted PIPP Index from a Tobit regression of ln GDP per capita and [ln GDP per capita]2 on the PIPP Index. The scatter plot for 1960 (Panel 3-a) clearly shows that with the exception of two developed countries—the United States and the United Kingdom, all countries provided little or no protection for pharmaceutical innovations.18 The scatter plot for 1970 (Panel 3-b) has four outliers—the United States, the United Kingdom, Rwanda, and Burundi, but otherwise differs little from the 1960
19scatter pl t. o
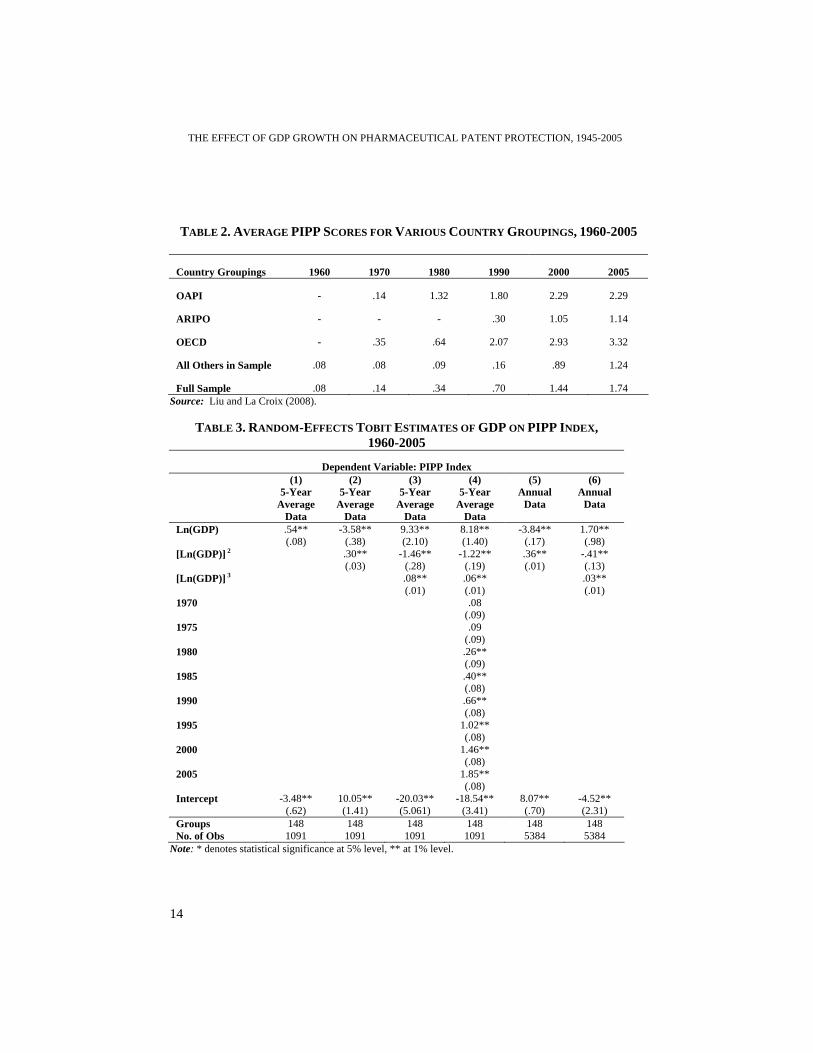
The first signs of a U-shaped relationship and of widespread increases in the PIPP Index begin to emerge in the 1980 cross-section Tobit regression, with a negative and statistically significant estimated coefficient on GDP per capita and a positive and statistically significant coefficient on [GDP per capita]2. Much of the U-shaped relationship is due to the adoption of strong patent rights in pharmaceutical innovations by African countries that are members of the Organisation Africaine de la Propriete Intellectuelle (OAPI). Between 1970 and 1980, the average PIPP Index of the very poor OAPI countries increased from .14 to 1.32, exceeding the average score of other developing countries, .09, and OECD countries, .64 (Table 2). The scatter plot and Tobit regression for 1990 (Panel 3-d) support a U-shaped relationship that is generated, in part, by a more than 300 percent increase in the PIPP Index for OECD countries and a 31 percent increase in the PIPP Index for OAPI members (Table 2).20 The U-shaped-
A Tobit regression on the 1960 cross-section with linear, quadratic and cubic GDP18 per capita variables
19 ents for both variables.
GDP per capita variable.
yields statistically significant estimated coefficients for all three variables. A Tobit regression on the 1970 cross-section with linear and quadratic GDP per capita variables yields statistically insignificant estimated coeffici
20 Estimated coefficients from Tobit regressions on the 1990 cross-section reveal some support for a specification with linear and quadratic ln GDP per capita variables and some support for a specification with a cubic ln
8
SUMNER LACROIX AND MING LIU
relations p persists in the scatter plots and Tobit regressions covering the 2000, and
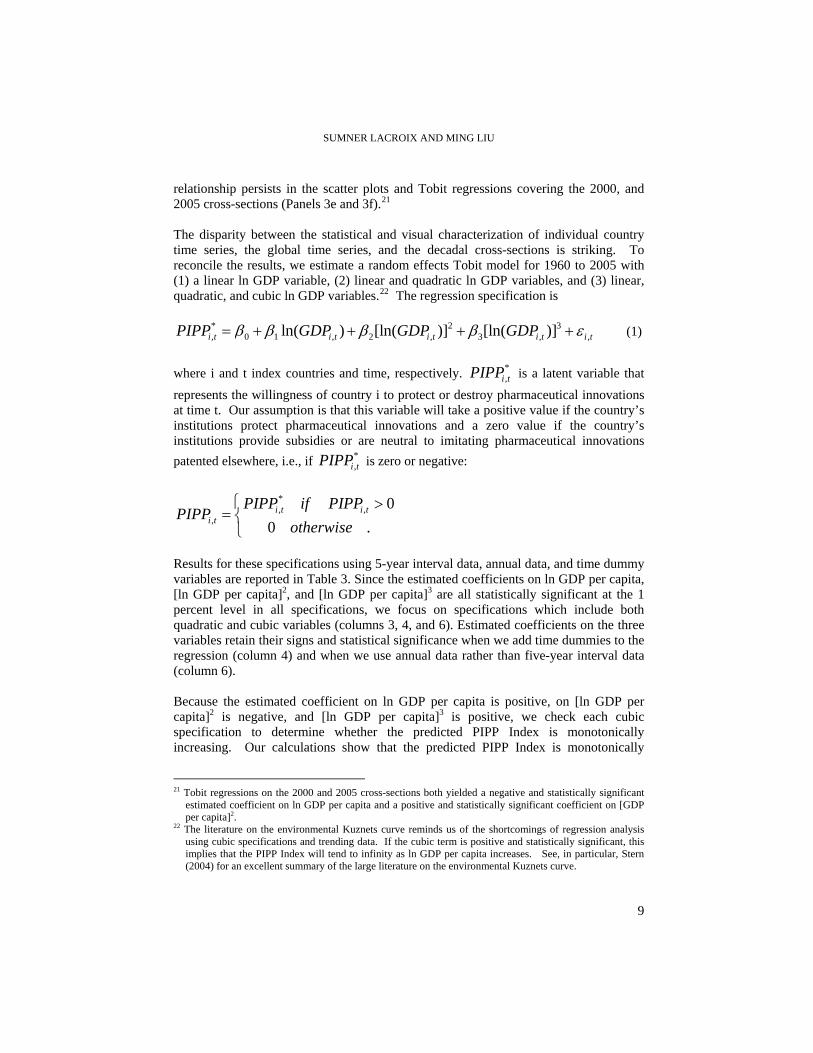
0 to 2005 with (1) a linear ln GDP variable, (2) linear and quadratic ln GDP variables, and (3) linear, quadratic, and cubic ln GDP variables.22 The regression specification is
3
hi2005 cross-sections (Panels 3e and 3f).21
The disparity between the statistical and visual characterization of individual country time series, the global time series, and the decadal cross-sections is striking. To reconcile the results, we estimate a random effects Tobit model for 196
* 2
3[ln( )]GDP, 0 1 , 2 , , ,ln( ) [ln( )]i t i t i t i t i tPIPP GDP GDP
aceutica value if the country’s s or are ne aceutical innovations
atented elsewhere, i.e., if is zero or negative:
in their signs and statistical significance when we add time dummies to the regressio (column 4) and when we use annual data rather than five-year interval data
(1)
where i and t index countries and time, respectively. *,i tPIPP is a latent variable that
represents the willingness of country i to protect or destroy pharmaceutical innovations at time t. Our assumption is that this variable will take a positive value if the country’s institutions protect pharm l innovations and
de subsidie utral to imitating pharma zero
institutions provi
p *,i tPIPP
*, ,
,
0i t i ti t
PIPP if PIPPPIPP
0 .otherwise
Results for these specifications using 5-year interval data, annual data, and time dummy variables are reported in Table 3. Since the estimated coefficients on ln GDP per capita, [ln GDP per capita]2, and [ln GDP per capita]3 are all statistically significant at the 1 percent level in all specifications, we focus on specifications which include both quadratic and cubic variables (columns 3, 4, and 6). Estimated coefficients on the three variables reta
n(column 6).
Because the estimated coefficient on ln GDP per capita is positive, on [ln GDP per capita]2 is negative, and [ln GDP per capita]3 is positive, we check each cubic specification to determine whether the predicted PIPP Index is monotonically increasing. Our calculations show that the predicted PIPP Index is monotonically
21 Tobit regressions on the 2000 and 2005 cross-sections both yielded a negative and statistically significant
estimated coefficient on ln GDP per capita and a positive and statistically significant coefficient on [GDP per capita]2.
22 The literature on the environmental Kuznets curve reminds us of the shortcomings of regression analysis using cubic specifications and trending data. If the cubic term is positive and statistically significant, this implies that the PIPP Index will tend to infinity as ln GDP per capita increases. See, in particular, Stern (2004) for an excellent summary of the large literature on the environmental Kuznets curve.
9

THE EFFECT OF GDP GROWTH ON PHARMACEUTICAL PATENT PROTECTION, 1945-2005
increasing in GDP in all three cubic specifications with annual data. Figure 4 provides a scatter plot of the panel data overlaid with the predicted values of the PIPP Index from the cubic specification with annual data (Table 3, column 3). These results change in cubic specifications run with five-year averaged data. Our calculations reveal small decreases (~.22) in the predicted PIPP Index after its reaches a local maximum (.99) at a per capit P of $350 and substantial increases after the predicted PIPP Index reaches
apita GDP and the P PP Index, the monotonic non-decreasing relationship is restored.
Table 4 adds two control variables, tertiary education attainment andfreedom of the world index, to the random effects Tobit regressions robustness tests for these specifications. The specification is given as follow:
,
a GDa local minimum (.77) at a per capita GDP of $2,300 (Table 3, column 3). The N-shaped curve of predicted PIPP values that results is plotted in Figure 5. If, however, we use five-year interval data rather than five-year averaged data for ln per c
I
the economic and provides
* 2 3, 0 1 , 2
,
( [ln( )] [ln( )]i t i t
i t
PIPP GD GDP GDP
Education EconFree D D D
, 3 ,
,
ln ) i t i t
i t Africa USA time i t
P
(2)
where and represent dummies for countries in Africa, the United
Once again s a latent variable that follows our
previous discussion:
ita is positive, on [ln GDP per capita] is negative, and [ln GDP pe capita] is positive; all three variables are statistically significant at the one percent level. Our results for the regression specifications with control variables mirror the results from the regressions without control variables: the monotonic non-decreasing relationship is found with annual data and five-year interval data but not with five-year averaged data.
AfricaD ,
States, and the
USAD
time periods.
timeD*,i tPIPP i,
*, ,
,
0
0 .i t i t
i t
PIPP if PIPPPIPP
otherwise
The estimated coefficients on both control variables are positive, as expected,
and statistically significant in specifications without time dummies (columns 1, 2, 4, and 5). Robustness tests include adding time dummies to some specifications (columns 3 and 6), deleting African countries from the sample (column 4), and deleting African countries and the United States from the sample. In all six specifications, the estimated coefficient on ln GDP per cap 2
3r
10

SUMNER LACROIX AND MING LIU
CONCLUSION We find no evidence of a U-shaped relationship between ln GDP per capita and the PIPP Index for any of the 154 countries in our sample. There is, however, considerable visual and econometric evidence of the U-shaped relationship in cross-section scatter plots and Tobit regressions incorporating quadratic GDP per capita. Using a random-effects Tobit estimator and cubic as well as quadratic GDP per capita variables to analyze a panel data set with annual data, we cannot reject the hypothesis that the relationship between ln GDP per capita and the PIPP Index is monotonically non-decreasing. Regression results using five-year interval data (not reported) cannot reject the hypothesis of non-decreasing monotonic relationship. However, regression results using five-year averaged data (which allow us to add control variables available only at five-year intervals) provide some support for a small drop in the predicted PIPP Index (~.22) for GDP per capita between $330 and $2,300. In sum, our cross-country investigation of patent protection for pharmaceutical innovations rejects a U-shaped relationship between ln GDP and the PIPP Index in most but not all regression specifications.
REFERENCES Arman, K. S., 1985. “Reconsidering Patents and Economic Development: A Case Study of the Turkish Pharmaceutical Industry”, World Development 13(2), pp. 219-236. Blakeney, M., 1996. Trade Related Aspects of Intellectual Property Rights: A Concise Guide to the TRIPS Agreement. London: Sweet & Maxwell. Briggs, K. N., “Intellectual Property Rights: A Longitudinal vs. Cross-Sectional Study.” Unpublished Manuscript, University of North Carolina at Chapel Hill. Chen, Y., and T. Puttitanun, 2005. “Intellectual Property Rights and Innovation in Developing Countries”, Journal of Development Economics 78(2), pp. 471-493. Corley, T.A.B., 2003. “The British Pharmaceutical Industry Since 1851.” Chapter 1 in Lesley Richmond, Julie Stevenson and Alison Turton, eds, Pharmaceutical Industry: A Guide to Historical Records, Aldershot: Ashgate Publishing. Correa, C. M., 2000. Integrating Public Health Concerns into Patent Legislation in Developing Countries. Geneva, Switzerland: The South Centre. Ginarte, J. C. and G.P. Walter, 1997. “Determinants of Patent Rights: A Cross-National Study”, Research Policy 26(3), pp. 283-301. Gwartney, J., and R. Lawson, with R. S. Sobel and P. T. Leeson, 2007. Economic Freedom of the World: 2007 Annual Report. Vancouver, BC: The Fraser Institute. Data retrieved from www.freetheworld.com (last access on 6 December 2008). Heston, A., R. Summers and B. Aten, 2006. Penn World Table Version 6.2, Center for International Comparisons of Production, Income and Prices at the University of Pennsylvania. Kawaura, A. and S. J. La Croix, 1995. “Japan’s Shift from Process to Product Patents in the Pharmaceutical Industry.” Economic Inquiry 33(1), pp. 88-103.
11

THE EFFECT OF GDP GROWTH ON PHARMACEUTICAL PATENT PROTECTION, 1945-2005
La Croix, S. J., 1994. “Intellectual Property Rights in ASEAN and the United States: Harmonization and Controversy,” PITO Papers, Reprinted as Chapter 4 in Pearl Imada Iboshi, Michael G. Plummer, and Seiji Finch Naya, eds., Building Blocks of U.S.-ASEAN Economic Cooperation: An Evolutionary Approach. Honolulu: East-West Center, 1995. La Croix, S. J. and D. E. Konan, 2007. “Is IP Protection Unfair to Developing Countries?” In Peter A. Petri and S. J. La Croix, eds, Challenges to the Global Trading System: Adjustment to Globalization in the Asia-Pacific Region. New York and London: Routledge. La Croix, S. J. and M. Liu, 2008. “Patents and Access to Essential Medicines”, In Keith Maskus, ed. Intellectual Property Rights and Technical Change. Vol. 1, Frontiers of Economics and Globalization. New York: Elsevier, pp. 423-464. Lai, E. L. C., 2007. “The Theory of International Policy Coordination in the Protection of IDEAS”, In Keith Maskus, ed. Intellectual Property Rights and Technical Change. Vol. 1, Frontiers of Economics and Globalization. New York: Elsevier, pp. 357-390. Lerner, J., 2002. “150 Years of Patent Protection.” American Economic Review 92(2), pp. 221-225. Levin, R. C., A. K. Klevorick, R. R. Nelson, S. G. Winter, R. Gilbert and Z. Griliches, 1987. “Appropriating the Returns from Industrial Research and Development”, Brookings Papers on Economic Activity 1987(3), pp. 783-831. Liu, M. and S. J. La Croix, 2008. “A Cross-Country Index of Intellectual Property Rights for Pharmaceutical Innovations” Unpublished Manuscript, Department of Economics, University of Hawaii-Manoa. Lutz, W.A., S. K. C. Goujon and W. Sanderson, 2007. Reconstruction of Population by Age, Sex and Level of Educational Attainment of 120 Countries for 1970-2000. Vienna Yearbook of Population Research 2007: 193-235. Vienna, Austria: Vienna Institute of Demography, Austrian Academy of Sciences. Mansfield, E, 1986. “Patents and Innovation: An Empirical Study”, Management Science 32 (2), pp. 173-181. Maskus, K. and M. Penubarti, 1995. “How Trade-Related are Intellectual Property Right?” Journal of International Economics 39, pp. 227-248. Maskus, K., 2000. Intellectual Property Rights in the Global Economy. Washington, D.C.: Institute of International Economics. Noland, M., 2003. “Chasing Phantoms: The Political Economy of USTR”, International Organization 51, pp. 365-387. Nogues, J., 1990. “Patents and Pharmaceutical Drugs: Understanding the Pressures on Developing Countries”, Journal of World Trade 24(6), pp. 81-104. Park, W. G., 2008. “Intellectual Property Rights and International Innovation”, In K. Maskus, ed., Intellectual Property Rights and Technical Change. Vol. 1, Frontiers of Economics and Globalization. New York: Elsevier, pp. 289-328. Pitkethly, R., 1999. “The European Patent System: Implementing Patent Law Harmonisation”, Oxford Electronic Journal of Intellectual Property Rights WP 10(99). Available online at http://www.oiprc.ox.ac.uk/EJWP1099.pdf (last access on March 1, 2008).
12
SUMNER LACROIX AND MING LIU
Rapp, R. and R. Rozek, 1990. “Benefits and Costs of Intellectual Property Protection in Developing Countries”, Journal of World Trade 24(5), pp. 75-102. Schadlen, K. C., A. Schrank and M. J. Kurtz, 2005. “The Political Economy of Intellectual Property Protection”, International Studies Quarterly, 49, pp. 45-71. Stern, D. I., 2004. “The Rise and Fall of the Environmental Kuznets Curve”, World Development 32(8), pp.1419-1439. Thorpe, P., 2003. Study on the Implementation of the TRIPS Agreement by Developing Countries. London: Commission on Intellectual Property Rights. Wooldridge, J.M., 2002. Econometric Analysis of Cross Section and Panel Data. Cambridge, MA: MIT Press. World Intellectual Property Organization (WIPO), 1988. “Existence, Scope and Form of Generally Internationally Accepted and Applied Standards/Norms for the Protection of Intellectual Property”, WO/Inf/29, WIPO.
ANNEX
TABLE 1. SUMMARY STATISTICS, 1960 TO 2005
1960* 1970 1975 1980 1985 1990 1995 2000 2005 Mean (s.e.)
.08 (.25)
.12 (.27)
.14 (.27)
.28 (.47)
.40 (.67)
.63 (.97)
.84 (1.05)
1.26 (1.11)
1.64 (1.12)
Min 0 0 0 0 0 0 0 0 0 PIPP Index (Unit: 0-5)
Max 2.43 2.43 2.43 2.49 3.12 4.29 4.64 4.78 4.78
Mean (s.e.)
2.80 (3.87)
4.11 (5.40)
4.96 (6.30)
5.37 (6.78)
5.68 (7.36)
6.14 (8.25)
6.60 (9.09)
7.44 (12.10)
7.86 (10.59)
Min 0.01 0.11 0.13 0.14 0.15 0.14 0.13 0.15 0.14 GDP per Capita (unit: thousands)
Max 18.58 23.42 26.51 26.58 28.61 31.3 35.84 41.03 51.59
Mean (s.e.)
.04
(.04) .05
(.05) .06
(.05) .07
(.06) .08
(.07) .09
(.07) .11
(.09)
Min 0 0 0 0 0 0 0
Tertiary Educational Attainment (Unit: 0-1)
Max 0.16 0.18 0.2 0.23 0.27 0.3 0.36
Mean (s.e.)
6.10
(1.20) 5.52
(1.17) 5.46
(1.19) 5.45
(1.31) 5.75
(1.31) 6.08
(1.21) 6.47
(1.01)
Min 3.7 3.3 2.8 2.1 3 3.9 4.1 Economic Freedom of the World Index
Max 8 7.8 8.2 8.3 8.7 8.8 8.6
Mean (s.e.)
1.41
(1.25) 2.11
(1.89) 3.36
(2.93) 4.94
(4.39) 6.59
(5.86) 7.94
(7.27) 9.65
(9.07)
Min 0.12 0.19 0.29 0.37 0.37 0.44 0.72 GDP Per Capita PPP (unit: thousands)
Max 4.88 7.21 1.42 15.62 21.48 3.33 4.37
*For the PIPP index and GDP per capita, the 1960 data are the values in 1960, while the 1970-2000 data are average values from the previous five year.
13
THE EFFECT OF GDP GROWTH ON PHARMACEUTICAL PATENT PROTECTION, 1945-2005
TABLE 2. AVERAGE PIPP SCORES FOR VARIOUS COUNTRY GROUPINGS, 1960-2005
Country Groupings 1960 1970 1980 1990 2000 2005
OAPI - .14 1.32 1.80 2.29 2.29
ARIPO - - - .30 1.05 1.14
OECD - .35 .64 2.07 2.93 3.32
All Others in Sample .08 .08 .09 .16 .89 1.24
Full Sample .08 .14 .34 .70 1.44 1.74 Source: Liu and La Croix (2008).
TABLE 3. RANDOM-EFFECTS TOBIT ESTIMATES OF GDP ON PIPP INDEX, 1960-2005
Dependent Variable: PIPP Index
(1) 5-Year
Average Data
(2) 5-Year
Average Data
(3) 5-Year
Average Data
(4) 5-Year
Average Data
(5) Annual
Data
(6) Annual
Data
Ln(GDP) .54** (.08)
-3.58** (.38)
9.33** (2.10)
8.18** (1.40)
-3.84** (.17)
1.70** (.98)
[Ln(GDP)] 2 .30** (.03)
-1.46** (.28)
-1.22** (.19)
.36** (.01)
-.41** (.13)
[Ln(GDP)] 3 .08** (.01)
.06** (.01)
.03** (.01)
1970 .08 (.09)
1975 .09 (.09)
1980 .26** (.09)
1985 .40** (.08)
1990 .66** (.08)
1995 1.02** (.08)
2000 1.46** (.08)
2005 1.85** (.08)
Intercept -3.48** (.62)
10.05** (1.41)
-20.03** (5.061)
-18.54** (3.41)
8.07** (.70)
-4.52** (2.31)
Groups 148 148 148 148 148 148 No. of Obs 1091 1091 1091 1091 5384 5384
Note: * denotes statistical significance at 5% level, ** at 1% level.
14

SUMNER LACROIX AND MING LIU
TABLE 4. RANDOM-EFFECTS TOBIT ESTIMATES OF GDP ON PIPP INDEX WITH
CONTROL VARIABLES USING FIVE-YEAR AVERAGE DATA, 1970-2000
DEPENDENT VARIABLES: FIVE-YEAR AVERAGE PIPP INDEX
(1) Full
Sample
(2) Full
Sample
(3) Full Sample
w/Time Dummies
(4) With
Africa Dummy
(5) With Africa
and US Dummies
(6) With Africa, US and Time
Dummies Ln(GDP) -3.55**
(.51) 12.71** (3.27)
12.93** (2.81)
12.39** (3.17)
12.38** (3.17)
12.59** (2.76)
[Ln(GDP)] 2 .23** (.03)
-1.93** (.43)
-1.95** (.37)
-1.82** (.42)
-1.81** (.42)
-1.85** (.36)
[Ln(GDP)] 3 .09** (.02)
.10** (.02)
.09** (.02)
.09** (.02)
.09** (.02)
Education .12** (.01)
.10** (.01)
.01 (.01)
.11** (.01)
.11** (.01)
.02 (.01)
Econ Freedom .23** (.04)
.24** (.04)
.01 (.04)
.23** (.04)
.23** (.04)
.01 (.04)
Africa 1.44** (.24)
1.44** (.24)
.80** (.20)
USA .14 (.87)
.98 (.68)
1975 -.05 (.11)
-.08 (.11)
1980 .05 (.11)
-.01 (.11)
1985 .19* (.11)
.12 (.11)
1990 .55** (.11)
.47** (.11)
1995 .87** (.12)
.78** (.12)
2000 1.26** (.13)
1.14** (.14)
Intercept 11.60** (1.91)
-28.13** (8.14)
-28.09** (6.99)
-23.39** (7.90)
-29.36** (7.90)
-28.52** (6.87)
Groups 93 93 93 93 93 93 No. of Obs 526 526 526 526 526 526 Note: * denotes statistical significance at 5% level, ** at 1% level.
15

THE EFFECT OF GDP GROWTH ON PHARMACEUTICAL PATENT PROTECTION, 1945-2005
FIGURE 1A. GLOBAL PIPP INDEX AND AVERAGE GDP PER CAPITA, 1960-2005
0
1000
2000
3000
4000
5000
6000
1960 1963 1966 1969 1972 1975 1978 1981 1984 1987 1990 1993 1996 1999 2002 2005
Year
GD
P P
er C
apita
0
0,5
1
1,5
2
PIP
P
Global GDP Per Capita Global PIPP Index
FIGURE 1B. GLOBAL PIPP INDEX VS. GLOBAL GDP PER CAPITA
19601970
1980
1990
2000
0
0,5
1
1,5
2
1500 2000 2500 3000 3500 4000 4500 5000 5500 6000
GDP Per Capita
PIP
P I
ndex
16

SUMNER LACROIX AND MING LIU
FIGURE 2. PIPP INDEXES FOR NINE COUNTRIES, 1960-2005
2-a. UK, USA and Japan
0
1
2
3
4
5
1960
1963
1966
1969
1972
1975
1978
1981
1984
1987
1990
1993
1996
1999
2002
2005
Year
PIPP
Ind
ex
UK USA Japan
2-b. Brazil, China and India
0
1
2
3
4
5
1960
1963
1966
1969
1972
1975
1978
1981
1984
1987
1990
1993
1996
1999
2002
2005
Year
PIPP
Ind
ex
Brazil China India
2-c. Peru, Senegal and Thailand
0
1
2
3
4
5
1960
1962196
4196
6196
8197
0197
2197
4197
6197
8198
0198
2198
4198
6198
8199
0199
2199
4199
6199
8200
0200
2200
4
Year
PIPP
Ind
ex
Peru Senegal Thailand
17

THE EFFECT OF GDP GROWTH ON PHARMACEUTICAL PATENT PROTECTION, 1945-2005
FIGURE 3. SCATTER PLOTS AND REGRESSION LINE OF GDP PER CAPITA AND PIPP
INDEX, 1960-2005
LUCH
UK
US
01
23
45
PIPP
Ind
ex
4 6 8 10 12
Ln(GDP Per Capita)
3-a. Year: 1960
BI
FR
KWLU
RW
CH
UK
US
01
23
45
PIP
P In
dex
4 6 8 10 12Ln(GDP Per Capita)
3-b. Year: 1970
18
SUMNER LACROIX AND MING LIU
BICF
CG
GA
IS
CI
JP
KW
NO
SN
CH
AE
UK
US
CM
TG DE
FR LUBIBETD
RW LRSE
NLIT
RO
01
23
45
PIPP
Ind
ex
4 6 8 10 12Ln(GDP Per Capita)
3-c. Year: 1980
ATCM CACG
DK
FR
GA
IS
CI
JP
LU
MY
NO
CH
AE
UK
US
DE
NL
ITBE
SEBJTG SN
MR ML
TG
ZM ESBF
CF
01
23
45
PIPP
Ind
ex
4 6 8 10 12Ln(GDP Per Capita)
3-d. Year: 1990
19

THE EFFECT OF GDP GROWTH ON PHARMACEUTICAL PATENT PROTECTION, 1945-2005
AUCA
CN
DK
HU
IS
JPLU
NL
ES
CH
TH
AE
UK
US
DEIEAT
SEFRBEIT
NOFI
NZGR
PTMY KR
SN GACGCMMRGN
BJ
CF
TG
TDSG
01
23
45
PIPP
Ind
ex
4 6 8 10 12Ln(GDP Per Capita)
3-e. Year: 2000
AU
CA
CN
FRHUJPNO
SG
CH
AE
UK
US
NL IE DE LU
SEAT
IT BE
FI
ES NO
TH DKCY PT
GRNZGT
ISILBRGW NE CF TG BF TD
EC
MR SN ML
CG GA
01
23
45
PIP
P In
dex
4 6 8 10 12
Ln(GDP Per Capita)
3-f. Year: 2005
Note: Two-letter country codes: AT-Austria, AU-Australia, BE-Belgium, BF-Burkina Faso, BI-Burundi, BJ-Benin, BR-Brazil, CA-Canada, CD-Congo, CF-Central Africa, CH-Switzerland, CI-Ivory coast, CM-Cameroon, CN-China, CY-Cyprus, DE-Germany, DK-Denmark, EC-Ecuador, ES-Spain, FI-Finland, FR-France, GA-Gabon, GN-Guinea, GR-Greece, GT-Guatemala, GW-Guinea-Bissau, HU-Hungary, IE-Ireland, IL-Israel, IS-Iceland, IT-Italy, JP-Japan, KR-Korea, LR-Liberia, LU-Luxembourg, ML-Mali, MR-Mauritania, MY-Malaysia, NE-Niger, NL-Netherlands, NO-Norway, NZ-New Zealand, PT-Portugal, RO-Romania, RW-Rwanda, SE-Sweden, SN-Senegal, TD-Chad, TG-Togo, TH-Thailand, UK-United Kingdom, US-United States, ZM-Zambia, ZW-Zimbabwe.
20

SUMNER LACROIX AND MING LIU
21
FIGURE 4. SCATTER PLOT AND PREDICTED PIPP INDEX FROM RANDOM-EFFECTS
TOBIT REGRESSION WITHOUT CONTROL VARIABLES: ANNUAL DATA, 1960-2005 0
12
34
5P
IPP
Inde
x
4 6 8 10 12Ln(GDP Per Capita)
FIGURE 5. SCATTER PLOT AND PREDICTED PIPP INDEX FROM RANDOM-EFFECTS
TOBIT REGRESSION WITHOUT CONTROL VARIABLES: FIVE-YEAR AVERAGES, 1970-2000
01
23
45
PIP
P I
ndex
4 6 8 10 12Ln(GDP Per Capita)