Embed Size (px)
Citation preview

1
The Economic Impact of OnDeck’s Lending
Prepared by Analysis Group
November 17, 2015

2
I. Executive Summary
Small businesses account for nearly half the economic output and employment of the U.S.
economy, yet a number of recent studies have shown that small business lending by traditional
lenders has dropped significantly since the Great Recession.1 As these lenders have tightened
their credit standards and generally begun to move away from “Main Street” small business
lending, innovative sources of financing like OnDeck Capital (“OnDeck”) are likely to play an
increasingly important role in supporting the economic contributions of small businesses. These
trends are further supported by shifts in preferences: the overall population, including “bankable”
small businesses, continue to shift more economic activity online, and in particular, are
increasingly comfortable engaging in banking-related activities online.2
OnDeck provides an innovative, alternative source of financing for small businesses that helps to
unlock timely access to capital. Launched in 2007, OnDeck differentiates itself from traditional
lenders through credit and technology innovation that provides a sophisticated credit model,
offers a range of credit solutions that satisfy broad small business needs, and enhances the speed
of its application, approval, and funding processes compared to more traditional providers.
OnDeck has financed over $3 billion in small business loans in all 50 states and Canada, across
more than 700 industries.3
Analysis Group was retained by OnDeck to update a study that we performed in 2014, which
estimated the economic impact of business activity funded by OnDeck loans. This year’s study
utilizes the same economic impact model of the U.S. economy as was used in our 2014 study and
1 Small businesses (enterprises with less than 500 employees) comprised 44.6 percent of the nation’s GDP in 2010
and 48.4 percent of employment in 2012. See Kobe, Kathryn (2012). Small Business GDP: Update 2002-2010.
Report prepared for SBA Office of Advocacy under contract no. SBAHQ-10-M-0258 at Economic Consulting
Services, LLC, Washington, D.C. (henceforth, “Kobe (2012)”), Table 3, and Caruso, Anthony (2015). “Statistics of
U.S. Businesses: Employment and Payroll Summary: 2012,” U.S. Census Bureau Economy-Wide Statistics Briefs,
G12-SUSB (henceforth, “Caruso (2015)”). According to a 2015 study by the Cleveland Federal Reserve, small
business loans had -2.0 percent growth from 2005-2014 (Wiersch, Ann Marie (2015). “Good News & Bad News on
Small Business Lending In 2014”. Retrieved from:
https://www.clevelandfed.org/newsroom-and-events/publications/community-development-briefs/db-20150105-
good-news-bad-news-small-bus-lending.aspx) (henceforth, “Wiersch (2015)”).
Retrieved from http://www2.census.gov/econ/susb/data/2011/us_state_naicssector_small_emplsize_2011.xls, 2 A survey commissioned by Bank of America in 2014 found that 62 percent of respondents have at least tried
mobile banking, while 90 percent are using online banking. Only 23 percent of respondents complete the majority of
their banking transactions at a bank branch (Bank of America (2015). Trends in Consumer Mobility Report: 2014.
Retrieved from:
http://newsroom.bankofamerica.com/sites/bankofamerica.newshq.businesswire.com/files/press_kit/additional/2014_
BAC_Trends_in_Consumer_Mobility.pdf). According to Ernst and Young’s Global Commercial Banking Survey
2014, more than 80 percent of customers in the Americas Developed Region used online banking services at least
weekly and over 60 percent used mobile banking at least weekly. (Ernst & Young (2014). Global Commercial
Banking Survey 2014: Advancing Service in a Digital Age. Retrieved from:
http://www.ey.com/Publication/vwLUAssets/EY-global-commercial-banking-survey-2014/$FILE/EY-global-
commercial-banking-survey-2014.pdf). 3 “Learn About OnDeck,” OnDeck, accessed September 30, 2015, available at https://www.ondeck.com/company/.

3
was similarly informed by our prior survey of OnDeck borrowers (the “2014 OnDeck Survey”),
but is updated to reflect the substantial increase in OnDeck’s lending over approximately the last
year from $975 million to $3 billion.
The 2014 OnDeck Survey was developed and employed in the 2014 study to determine the
economic impact of OnDeck lending to small businesses that could be solely attributed to
OnDeck’s credit solutions. This analysis required consideration of whether a business could have
secured credit elsewhere that satisfied its business needs due to time, credit, or budget
constraints, and a determination of what business activities are funded by OnDeck. Importantly,
the vast majority of survey respondents (90%) reported having some type of borrowing
constraint that precluded them from pursuing loans from other financing sources, whether due to
time, credit, or budget constraints; this implies that OnDeck loans generate economic activity
that would otherwise not occur. The survey also detailed the short term business needs and
productive use-cases that OnDeck loans were used to satisfy, most commonly including the
purchase of inventory, hiring or retention of employees, and the acquisition of business
equipment.
The results of the 2014 OnDeck Survey were then used in an economic impact model,4 which
allowed us to update the economy-wide effects resulting from OnDeck’s lending activity. Given
OnDeck’s total lending of approximately $3 billion, we estimate that OnDeck’s updated 2015
economic impacts are approximately $11.0 billion in additional economic output and 74,000 jobs
created. We find that every $1.00 of lending by OnDeck leads to approximately $3.62 in
economic output.
The above multiplier of $3.62 is slightly larger than that for 2014, in which we found that every
$1.00 of lending by OnDeck leads to approximately $3.42 in economic output.5 There are two
principal explanations for the observed increase in the multiplier. First, the current composition
of OnDeck’s loan portfolio resulted in slight differences in how OnDeck’s loans are distributed
across loan uses. Second, the current composition of OnDeck’s loan portfolio, as compared to
the composition when we undertook our initial study, has resulted in slight differences to how
OnDeck’s loans are distributed across borrower industries. Economic events that occur in
different industries and have different use-cases have different effects on economic output;
therefore, this change in OnDeck’s portfolio may also help to explain changes in the productivity
of OnDeck’s lending.6
4 Our impact study was conducted through the use of IMpact analysis for PLANing (“IMPLAN”), a commonly used
economic analysis software package. 5 Based on OnDeck’s $975 million of lending as of the 2014 study, we found that OnDeck loans had generated
approximately $3.3 billion in economic output and approximately 22,000 U.S. jobs. 6 We also ran the economic impact model using software that has been updated since the 2014 study. Any changes
to how industry changes are modeled in the software would affect the results.

4
Overall, our results indicate that OnDeck’s lending drives substantial economic activity, largely
because the significant majority of businesses to which OnDeck lends are otherwise unable to
efficiently access the capital they need to serve their business needs or use-cases.
II. Introduction
A. Background on the Small Business Credit Environment
Small businesses play an essential role in the U.S. economy, comprising 44.6 percent of the
nation’s GDP in 20107 and 48.4 percent of employment in 2012.8 However, a number of recent
studies have shown that small business lending has dropped in recent years, particularly since the
Great Recession, and has not experienced meaningful improvement.9 For example, a December
2014 survey by the National Small Business Association found that only 69 percent of small
businesses across the U.S. reported that they were able to find adequate financing.10 In addition,
the value of outstanding small business loans for depository lenders has declined by over $100
billion (or 18 percent) over the past several years, from $711.5 billion in 2008 to $585.3 billion
in 2013.11 This lack of available small business credit can be attributed to a combination of
factors, including recent tightening of lending standards and weakened creditworthiness of small
business borrowers in light of the Great Recession.
Since the Great Recession, lenders have tightened their credit standards in an environment where
fewer small business owners have the cash flow, credit standing, or collateral to appear as
attractive borrowers. The Office of the Comptroller of the Currency’s Survey of Credit
Underwriting Practices shows that most banks tightened small business lending standards in
2009 and 2010, with few loosening standards since.12 Small business lending still remains below
its pre-recession levels.13
7 Kobe (2012), Table 3. 8 Caruso (2015). 9 According to a 2015 study by the Cleveland Federal Reserve, small business loans had -2.0 percent growth from
2005-2014 (Wiersch, Ann Marie (2015). “Good News & Bad News on Small Business Lending In 2014”. Retrieved
from:
https://www.clevelandfed.org/newsroom-and-events/publications/community-development-briefs/db-20150105-
good-news-bad-news-small-bus-lending.aspx) (henceforth, “Wiersch (2015)”). For a more complete discussion of
what is highlighted here, see Wiersch, Ann Marie and Scott Shane (2013, August 14). Why Small Business Lending
Isn’t What It Used to Be, Economic Commentary. Federal Reserve Bank of Cleveland. Retrieved from
https://www.clevelandfed.org/research/commentary/2013/2013-10.cfm (henceforth, “Wiersch and Shane (2013)”). 10 National Small Business Association (2014). 2014 Year-End Economic Report, Washington, D.C., p. 11. 11 See Office of Advocacy, U.S. Small Business Administration (2014). Small Business Lending in the United
States: 2013, Washington, D.C. 12 Office of the Comptroller of the Currency, Administrator of National Banks, U.S. Department of Treasury, Survey
of Credit Underwriting Practices: 2014, Washington, D.C. 13 Wiersch (2015).
5
In addition to post-recession trends in small business lending, there has also been a longer-
running trend away from small business lending as the number of small banks in the lending
industry has fallen, increasing consolidation and creating more incentive for banks to target
larger borrowers.14 The change in competition for small business banking has also been
perceived by small business owners who reported in annual surveys to the NFIB Research
Foundation that small business banking competition appeared to peak in 2006, followed by a
steady decline.15 This reduction in the availability of small business credit from traditional
lenders points to a need for alternative financing sources.
Finally, search costs with traditional lenders remain high for small business owners, with reports
suggesting that the average application time at traditional lenders ranges from 24 to 33 hours.16
According to our initial survey, such application times inhibited small business owners from
seeking financing to grow their business.17
B. Background on OnDeck
OnDeck is an innovative online lending platform for small business. OnDeck makes real-time
lending decisions based on its in-house analytics and a business’s individual needs. An
application may take approximately ten minutes to complete and many applicants receive a
decision within minutes. Funding quickly follows, potentially within one business day.
OnDeck also partners with small business service providers, enabling them to connect their
customers to OnDeck financing. OnDeck’s diversified loan funding strategy enables the
company to fund small business loans from various credit facilities, securitization, and a
platform that enables institutional investors to purchase small business loans originated by
OnDeck.
14 Wiersch and Shane (2013). 15 NFIB Research Foundation (2012). Small Business, Credit Access, and a Lingering Recession. Retrieved from
http://www.nfib.com/Portals/0/PDF/AllUsers/research/studies/small-business-credit-study-nfib-2012.pdf, pp. 6-7. 16 A 2012 survey by eVoice asked small business owners to estimate the monetary worth of their time (eVoice
(2012). “25 Hour Day Survey Results”.
Retrieved from: http://home.evoice.com/s/r/evoice/25HourDaySurveyResults.pdf). Federal Reserve Banks of New
York, Atlanta, Cleveland, and Philadelphia (2015). “Joint Small Business Credit Survey Report, 2014” measured the
average amount of time spent searching and applying for credit among small businesses on the east coast. Federal
Reserve Bank of New York (2014). Small Business Credit Survey, Spring 2014. Retrieved from:
https://www.newyorkfed.org/medialibrary/interactives/spring2014/spring2014/pdf/full-report.pdf. 17 Federal Reserve Banks of New York, Atlanta, Cleveland, and Philadelphia (2015). “Joint Small Business Credit
Survey Report, 2014” measured the average amount of time spent searching and applying for credit among small
businesses on the east coast. Federal Reserve Bank of New York (2014). Small Business Credit Survey, Spring
2014. Retrieved from: https://www.newyorkfed.org/medialibrary/interactives/spring2014/spring2014/pdf/full-
report.pdf.

6
Since 2007, OnDeck has deployed more than $3 billion to more than 700 different industries in
all 50 U.S. states and Canada. The company has an A+ rating with the Better Business Bureau18
and operates the website BusinessLoans.com,19 which provides credit education and information
about small business financing. OnDeck is a publicly traded company on the New York Stock
Exchange.20 The plots in Figure 1, below, examine some characteristics of OnDeck customers
using data provided by OnDeck.21
18 “OnDeck Capital, Inc. Review.,” Better Business Bureau, accessed November 13, 2015, available at
http://www.bbb.org/new-york-city/business-reviews/financial-services/on-deck-capital-inc-in-new-york-ny-101780/. 19 “About BusinessLoans.com,” BusinessLoans.com, accessed November 13, 2015, available at
https://www.businessloans.com/about-us/. 20 “OnDeck Announces Pricing of Initial Public Offering,” OnDeck, accessed November 13, 2015, available at
https://www.ondeck.com/company/in-the-news/press-releases/ondeck-announces-pricing-initial-public-offering/. 21 The OnDeck small business customer characteristics provided here are based on U.S. loans originated from
January 1, 2015 through September 30, 2015, and were not used nor required for this study. The data includes time
in business, estimated annual revenues, industry designations by NAICS code, regional lending data, and principal
business owner(s) FICO scores.
Loan Volume Distribution by Time in Business
Figure 1: OnDeck Small Business Customer Characteristics
Loan Volume Distribution by Annual Revenue

7
Note: The industry categorizations provided in this chart are based on two-digit NAICS codes available at
http://www.census.gov/cgi-bin/sssd/naics/naicsrch?chart=2012. This website provides further details
breaking down sub-industries within each categorization.
Loan Volume Distribution by U.S. Census Bureau Region
Note: Census Bureau Regions are available at http://www2.census.gov/geo/pdfs/maps-
data/maps/reference/us_regdiv.pdf.
Loan Volume Distribution by Industry

8
Note: In assessing creditworthiness, OnDeck uses the OnDeck Score®, its proprietary small
business credit scoring system, which aggregates and analyzes thousands of data elements and
attributes related to a business and its owners, and does not rely solely on the personal credit
(FICO) score of the small business owner.22 The personal credit of a small business owner is
only one of many factors that OnDeck considers in making a decision to lend to a small
business.
C. Overview of Study Purpose
On behalf of OnDeck, Analysis Group conducted a study to estimate the economic impact of
business activity funded by OnDeck loans. In 2014, we designed a two-part study consisting of a
survey of OnDeck borrowers and an economic impact model of the U.S. economy. The OnDeck
Survey was designed to inform us about the availability of credit for OnDeck borrowers, in
addition to the ways in which borrowers used their OnDeck loans. The results of the survey then
informed our economic impact model. For this year’s study update, we found that the 2014
OnDeck Survey results are still applicable to OnDeck’s borrowers, especially given the
continued, prevailing state of overall small business lending activity.23 We therefore continue to
inform our economic impact model with the 2014 OnDeck Survey results.
22 One major credit reporting company has observed that “many creditors today are moving away from relying on
personal credit alone when judging a business’s financial health since personal credit is not considered an ideal
predictor of business behavior. Furthermore, smart creditors are taking advantage of new blended commercial
scoring tools that integrate both personal and business credit attributes to assess and predict small business risk.”
“Business Credit vs. Personal Credit,” Experian, accessed November 13, 2015, available at
http://www.experian.com/small-business/business-personal-credit.jsp. 23 Wiersch (2015) finds that “the volume of small loans, those under $1 million, dropped significantly between 2008
and 2012, and has barely recovered. Small business loans now stand 17 percent below the peak reached prior to the
Loan Volume Distribution by FICO Band of Principal Business Owner(s)

9
The results of the 2014 OnDeck Survey indicated that most OnDeck customers did not have
viable financing options outside of OnDeck, implying that many of these businesses were
unwilling to pursue or unable to access credit from traditional lenders; we also found that the
most popular uses of OnDeck loans were purchasing inventory, hiring or retaining workers, and
acquiring business equipment. Given the survey results, we used an economic input-output
model of the U.S. economy to estimate the economic impacts of OnDeck’s lending activities.
The economic model measures the effect of OnDeck loans as the money moves throughout the
economy generating output and jobs. We find that OnDeck loans have generated approximately
$11 billion in economic output and have added more than 74,000 U.S. jobs. Given OnDeck’s
total lending of $3 billion, every $1.00 of lending by OnDeck leads to approximately $3.62 in
economic output.
In the sections that follow, we first present our survey and economic impact model methodology;
we conclude with a discussion of our key results.
III. Survey Methodology and Data Collected
A. Survey Sample
The 2014 OnDeck Survey was established to explore the characteristics of businesses that
receive loans from OnDeck and to complement an economic impact analysis of OnDeck’s
lending. Consequently, the 2014 OnDeck Survey was targeted at recipients of OnDeck loans. Of
OnDeck’s customers that received loans between 2007 and 2014, we sent a survey invitation to
all borrowers who were not in default and were reachable by email. The invitation email
contained a link to a web-based survey.
B. Survey Design
The survey was designed to address two primary goals: first, to determine what alternate
financing sources were available to OnDeck customers and, in particular, whether OnDeck
customers could have funded their businesses with loans that suited their needs from other
traditional providers of credit; and second, to determine how OnDeck customers used their loan.
It is important to know if OnDeck customers had access to sufficient and timely financing
through outlets other than OnDeck, because if they did not, then the entire economic impact of
the loan can be attributed to OnDeck. However, if businesses had access to financing elsewhere,
then we must account for the marginal impact of the OnDeck loan with respect to the next best
recession. In contrast, lending to larger businesses (loans greater than $1 million) bounced back quickly...” (Wiersch
(2015), p. 1).
10
option for financing. We also must know how OnDeck customers used their loan in order to
accurately model the economic impacts associated with OnDeck’s lending.
In order to capture this information, we designed a survey in which OnDeck customers were
asked questions about their experience and choices when seeking credit, as well as questions
about how they used their OnDeck loan. In designing the survey, we employed standard survey
best practices to reduce the likelihood of various respondent biases.24
The survey consisted of three distinct sections of questions. The first section contained general
questions about the respondent’s business and allowed us to ensure that the respondent was
actually the business owner. The second section of questions was directed at the respondent’s
experience with financing options other than OnDeck to allow us to determine to what extent the
respondent was borrowing-constrained. And finally, the third section asked several questions
regarding how the respondent primarily used their OnDeck loan. Responses from this question,
as well as follow-up questions for some of the specific loan uses, were subsequently used to
determine the economic impact of OnDeck’s lending activity.
C. Data Collection
The 2014 OnDeck Survey was a web-based survey. OnDeck customers were invited to
participate in the survey via an email sent on February 25, 2014, which contained a link to the
survey. The survey remained open until March 17, 2014. We used a third party, AMS, to
program and host the survey, as well as to collect survey responses. OnDeck distributed the
survey via email and sent an email reminder a few weeks after the initial launch. Data were
collected with distinct respondent identification numbers for the purpose of linking the survey
data to OnDeck’s lending data for subsequent analysis.
D. Survey Data
In conducting a survey, it is important to ensure that those who respond to the survey are
representative of the broader population. If they are not, then the results can only be interpreted
as representative of the survey respondents themselves and cannot be extrapolated as
representative of the broader population. In the case of our survey of OnDeck customers, if the
businesses who responded to the OnDeck Survey meaningfully differed from OnDeck’s typical
customer’s business, then it would not be possible to determine the total impact of OnDeck’s
lending; instead, it would only be possible to determine the impact of OnDeck’s lending for
those respondents who completed the survey. Upon analyzing the representativeness of the 2014
24 For example, the wording of the questions was designed to avoid leading the respondent into picking a “right”
answer; where appropriate, the order of question responses was randomized across respondents to mitigate order
bias; and, questions were designed to be clear, concise, and specific. In addition, we tested the survey to ensure that
it could be completed in a timely basis, thus reducing or eliminating respondent fatigue.

11
survey respondents relative to the current OnDeck customer population, we found that there were
no meaningful differences, both in terms of business and loan characteristics, between the survey
sample and the OnDeck population.25
IV. Economic Impact Methodology
A. Overview of Input-Output Models and IMPLAN
Numerous public agencies such as federal, state and other governments, academic institutions,
and private businesses produce and rely on economic impact analysis. Economic impact studies
use input-output models to measure the economy-wide effects resulting from an initial change in
economic activity. The initial change in one sector spurs activity in other sectors, creating an
intertwined system that affects the economy on a national level.26
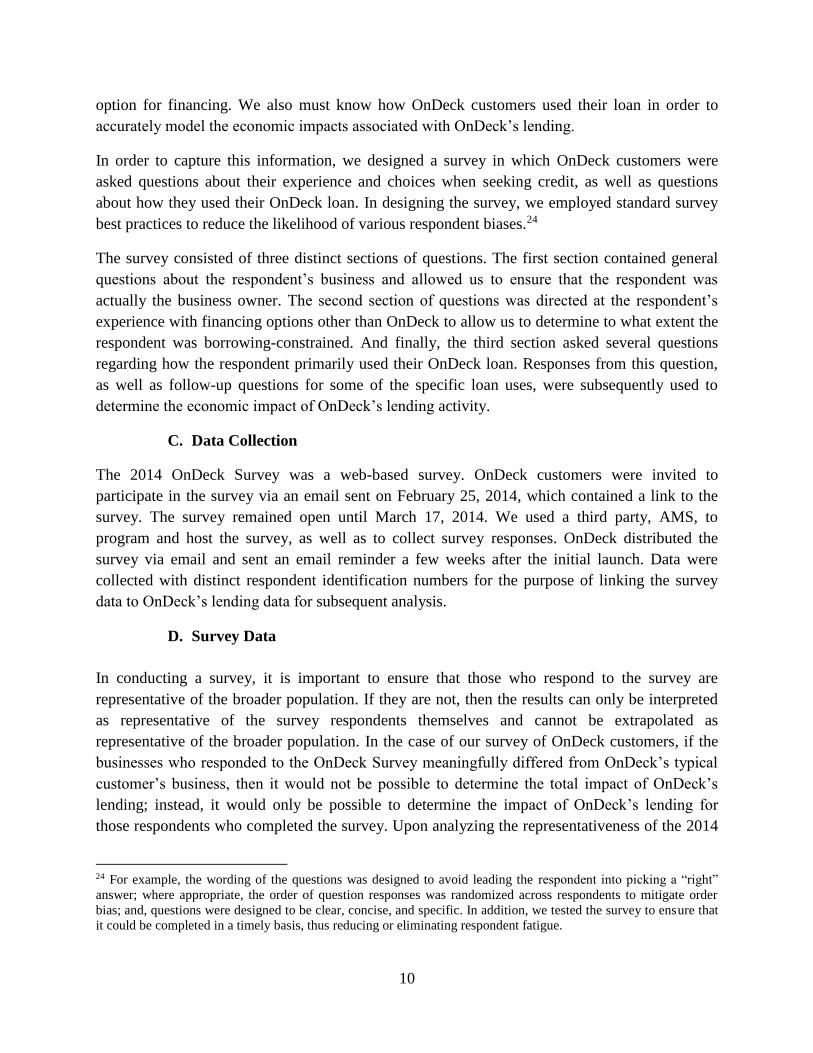
In modeling the effect of an industry change, IMPLAN estimates three distinct types of impacts:
direct, indirect, and induced. Direct effects measure a change or expenditure made in an industry
and the resulting economic response to that change, indirect effects measure the impact of
domestic industries buying goods and services from other domestic, upstream industries, and
lastly, induced effects measure the re-spending of income that occurs as a response to the spurred
economic activity. The three types of effects are laid out below in Figure 2.
25 The survey sample was comprised of the approximately seven percent of customers who received the survey and
completed it. Approximately 83 percent of people who started the survey completed the survey. 26 Input-output models typically use matrices representing the input and output values representative of the initial
change. As the initial change flows through the matrices, there is a multiplier effect as the impacts trickle through
the broader economy.
12
Figure 2: Summary of Direct, Indirect, and Induced Effects
The direct, indirect, and induced effects lead to three distinct impacts: employment, total value
added, and output. Employment is the annual average of monthly full-time jobs by industry;
value added is the difference between an industry’s or an establishment’s total output and the
cost of its intermediate inputs; and, output represents the value of industry production.
B. Analysis of Survey Data using IMPLAN
To analyze the economic impact of OnDeck’s loans, we use survey data, OnDeck’s loan data,
and IMPLAN. We use the sample survey data to approximate how the different loans were used;
examples of different loan uses include purchasing inventory, retaining or hiring employees, and
purchasing equipment. We calculate a percentage breakdown of how the loans were used based
on the survey data and apply those percentages to the full set of OnDeck loan data provided to us
by OnDeck; this allows us to model the impact of all of OnDeck’s lending, rather than simply
modeling the economic impacts of OnDeck’s lending associated with only those who completed
the survey.
To accurately estimate the full economic impact of OnDeck loans, it is important to account for
the cost of the loans, such as origination fees and interest payments, because these payments
must be made by the business receiving the loan (and thus the business has fewer funds available
to, for example, purchase inventory). To do so, we calculate the interest payments and
origination fees for each loan and subtract them from the amount of the loan. The interest- and
fee-adjusted loan amounts are then grossed-up so that the entire OnDeck dataset can be modeled.
13
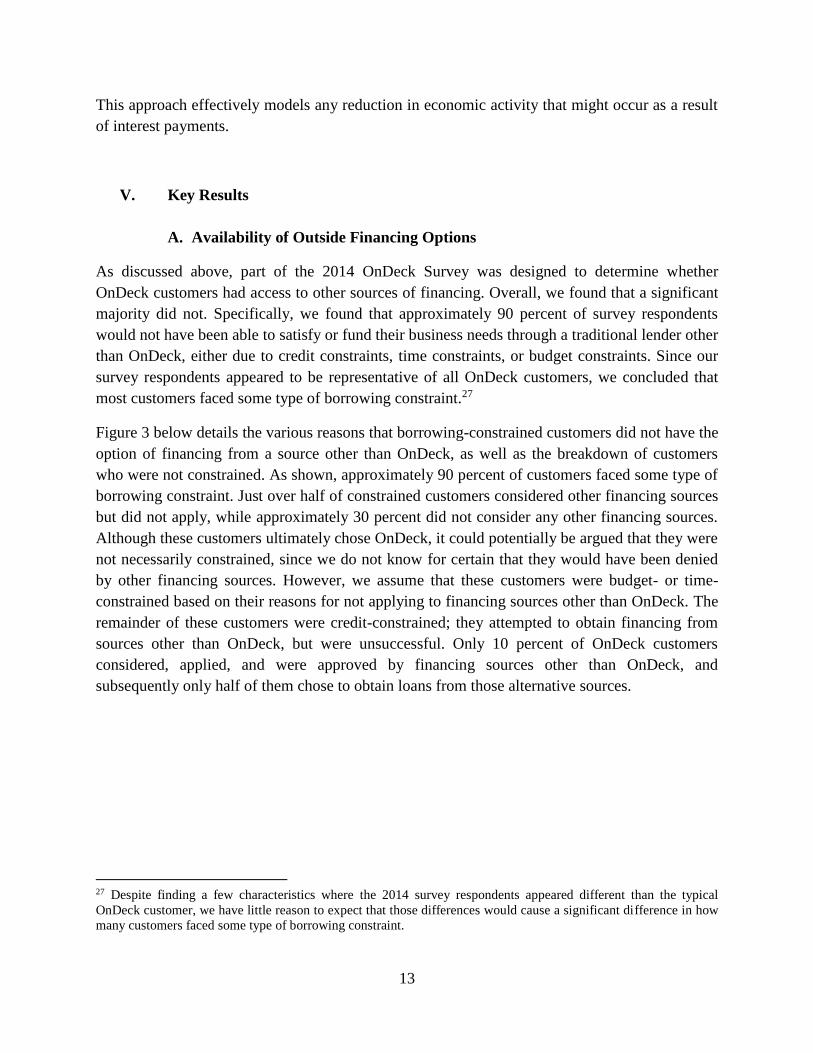
This approach effectively models any reduction in economic activity that might occur as a result
of interest payments.
V. Key Results
A. Availability of Outside Financing Options
As discussed above, part of the 2014 OnDeck Survey was designed to determine whether
OnDeck customers had access to other sources of financing. Overall, we found that a significant
majority did not. Specifically, we found that approximately 90 percent of survey respondents
would not have been able to satisfy or fund their business needs through a traditional lender other
than OnDeck, either due to credit constraints, time constraints, or budget constraints. Since our
survey respondents appeared to be representative of all OnDeck customers, we concluded that
most customers faced some type of borrowing constraint.27
Figure 3 below details the various reasons that borrowing-constrained customers did not have the
option of financing from a source other than OnDeck, as well as the breakdown of customers
who were not constrained. As shown, approximately 90 percent of customers faced some type of
borrowing constraint. Just over half of constrained customers considered other financing sources
but did not apply, while approximately 30 percent did not consider any other financing sources.
Although these customers ultimately chose OnDeck, it could potentially be argued that they were
not necessarily constrained, since we do not know for certain that they would have been denied
by other financing sources. However, we assume that these customers were budget- or time-
constrained based on their reasons for not applying to financing sources other than OnDeck. The
remainder of these customers were credit-constrained; they attempted to obtain financing from
sources other than OnDeck, but were unsuccessful. Only 10 percent of OnDeck customers
considered, applied, and were approved by financing sources other than OnDeck, and
subsequently only half of them chose to obtain loans from those alternative sources.
27 Despite finding a few characteristics where the 2014 survey respondents appeared different than the typical
OnDeck customer, we have little reason to expect that those differences would cause a significant difference in how
many customers faced some type of borrowing constraint.

14
Figure 3: Survey Respondent Borrowing Constraints
To further illustrate why customers were or were not borrowing-constrained, Figure 4 below
shows what types of financing OnDeck customers considered, other than OnDeck. Customers
who did not consider other sources of financing were considered borrowing-constrained.
47%
5%
27%
4%
12%
4%
0%
10%
20%
30%
40%
50%
60%
70%
80%
90%
100%
Credit Constrained Not Credit Constrained
Per
cen
t of
Su
rvey
Res
pon
den
ts
Type of Borrower
Considered other financing but did not hear back
with a financing decision
Considered other financing but was rejected
Did not consider any other financing
Considered other financing but did not apply
Turned down loan from other financing source
Obtained loan from other financing source
90%
10%

15
Figure 4: Alternative Sources of Financing Considered
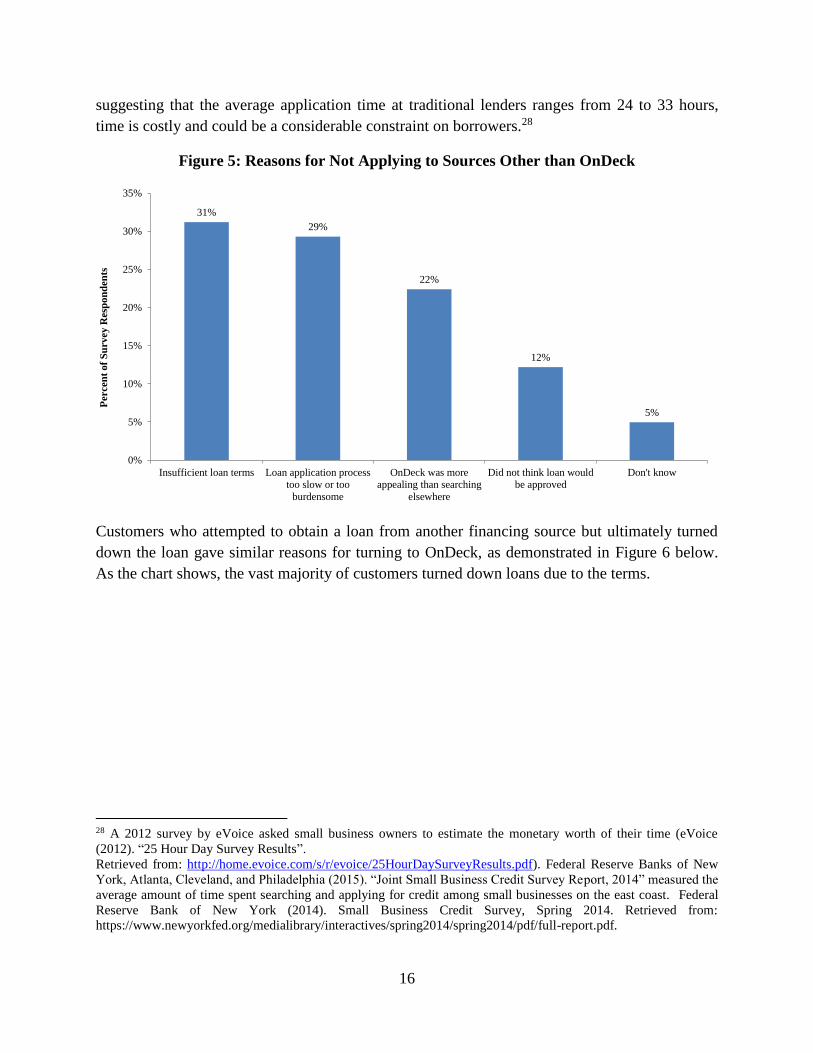
Further, we asked about the reasons that customers were not able or did not attempt to obtain
alternative financing. Of the customers who considered other financing but did not apply, Figure
5 provides detail on why they did not apply. The most common reasons for avoiding sources of
financing other than OnDeck were unattractive loan terms and the time involved in applying. We
assume that these customers were borrowing-constrained due to their given reasons for not
applying elsewhere. First, assuming that customers had an accurate understanding of the loan
terms at other financing sources, loan terms that were less favorable than OnDeck could have led
to loan costs that exceeded budget constraints for some OnDeck customers. We assume that
customers who did not seek alternate financing due to the expectation of unfavorable loan terms
did so due to their budget constraints. Second, customers who cited the need for quick loan
processing were likely affected by time constraints that made OnDeck the only source that could
provide a loan in the time it was needed. A survey conducted by eVoice found that the average
small business owner approximates the value of his time at $250 per hour; with reports
42%
24%
9%
21%
18%
47%
0%
5%
10%
15%
20%
25%
30%
35%
40%
45%
50%
Loan or line of credit
from a Large bank
Loan or line of credit
from a Community
bank
Loan or line of credit
from a Credit union
Did not consider any
other sources of
business financing
Merchant cash
advance
Other
Per
cen
t o
f S
urv
ey R
esp
on
den
ts
Bank Loans
16
suggesting that the average application time at traditional lenders ranges from 24 to 33 hours,
time is costly and could be a considerable constraint on borrowers.28
Figure 5: Reasons for Not Applying to Sources Other than OnDeck
Customers who attempted to obtain a loan from another financing source but ultimately turned
down the loan gave similar reasons for turning to OnDeck, as demonstrated in Figure 6 below.
As the chart shows, the vast majority of customers turned down loans due to the terms.
28 A 2012 survey by eVoice asked small business owners to estimate the monetary worth of their time (eVoice
(2012). “25 Hour Day Survey Results”.
Retrieved from: http://home.evoice.com/s/r/evoice/25HourDaySurveyResults.pdf). Federal Reserve Banks of New
York, Atlanta, Cleveland, and Philadelphia (2015). “Joint Small Business Credit Survey Report, 2014” measured the
average amount of time spent searching and applying for credit among small businesses on the east coast. Federal
Reserve Bank of New York (2014). Small Business Credit Survey, Spring 2014. Retrieved from:
https://www.newyorkfed.org/medialibrary/interactives/spring2014/spring2014/pdf/full-report.pdf.
31%
29%
22%
12%
5%
0%
5%
10%
15%
20%
25%
30%
35%
Insufficient loan terms Loan application process
too slow or too
burdensome
OnDeck was more
appealing than searching
elsewhere
Did not think loan would
be approved
Don't know
Per
cen
t o
f S
urv
ey R
esp
on
den
ts

17
Figure 6: Reasons for Rejecting Other Approved Sources of Financing
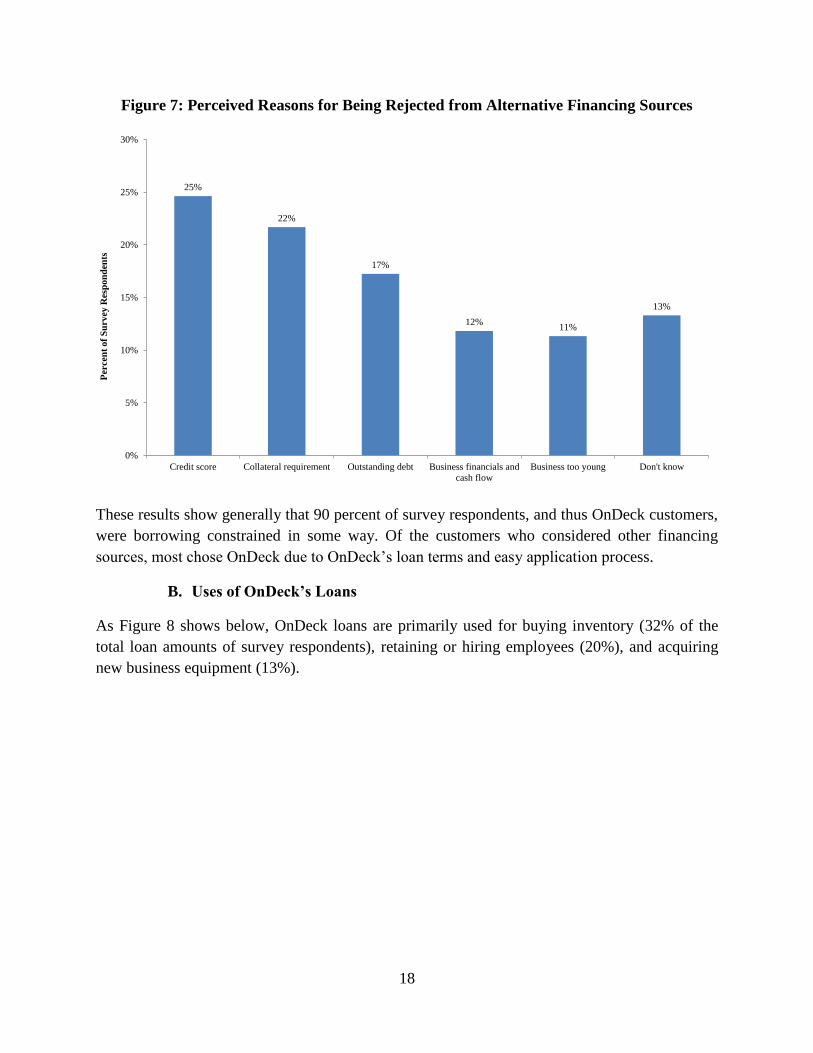
In addition to learning why customers who had alternative financing options available to them
ultimately chose OnDeck, we also wanted to learn why some customers who attempted to find
financing elsewhere were limited to borrowing from OnDeck. Of the customers who considered
other financing but were rejected, Figure 7 below gives detail on why they thought they were
rejected. The most common reasons cited for rejection were credit score, available collateral, and
outstanding debt.
75%
13%
5% 5%
2%
0%
10%
20%
30%
40%
50%
60%
70%
80%
Bad loan terms Previous business
relationship with OnDeck
Speed of receiving funds
too slow
Collateral Requirement Don't know
Per
cen
t o
f S
urv
ey R
esp
on
den
ts
18
Figure 7: Perceived Reasons for Being Rejected from Alternative Financing Sources
These results show generally that 90 percent of survey respondents, and thus OnDeck customers,
were borrowing constrained in some way. Of the customers who considered other financing
sources, most chose OnDeck due to OnDeck’s loan terms and easy application process.
B. Uses of OnDeck’s Loans
As Figure 8 shows below, OnDeck loans are primarily used for buying inventory (32% of the
total loan amounts of survey respondents), retaining or hiring employees (20%), and acquiring
new business equipment (13%).
25%
22%
17%
12%11%
13%
0%
5%
10%
15%
20%
25%
30%
Credit score Collateral requirement Outstanding debt Business financials and
cash flow
Business too young Don't know
Per
cen
t o
f S
urv
ey R
esp
on
den
ts

19
Figure 8: Loan Uses of Survey Respondents
Note: Approximately 4 percent of survey respondent loan amounts are associated with responses of “Don’t
Know/Not Sure” and “Other.” Those categories are not included in this chart.
C. Economic Impact Results
Table 1 below summarizes the economic impacts by the various loan uses identified in the 2014
OnDeck Survey; it also includes information on loans not modeled in IMPLAN. We explicitly
model loans that were used for supporting payroll to retain or hire employees, buying inventory,
upgrading or repairing business facilities, or buying new equipment. Other loan purposes, such
as developing new products/services, advertising and marketing, or buying real estate could not
be explicitly modeled in IMPLAN. The economic impact of those loans and loans attributed to
respondents who did not know the primary use of the loan are listed in Table 1 as “Loans Not
Modeled in IMPLAN.”

20
Table 1: The Economic Impacts of OnDeck’s Lending, by Loan Use
As Table 1 above shows, using the 2014 OnDeck Survey results in combination with an input-
output model of the U.S. economy, we find a positive and large economic impact due to
OnDeck’s lending activity. Specifically, we estimate that OnDeck’s economic impact is
approximately $11 billion in additional economic output, $5.9 billion in value added, and 74,000
jobs created. Given OnDeck’s total lending of approximately $3 billion, we find that every $1.00
of lending by OnDeck leads to approximately $3.62 in economic output.
This year’s multiplier is slightly larger than that for 2014.29 This result can largely be explained
by slight changes in how OnDeck’s loans are distributed across loan uses and borrower
industries. Overall, our results indicate that OnDeck’s lending is driving substantial economic
activity, largely because the significant of majority of businesses to which OnDeck lends would
not otherwise have access to capital that satisfies their specific business needs or use-cases.
29 Based on OnDeck’s $975 million of lending as of the 2014 study, we found that OnDeck loans had generated
approximately $3.3 billion in economic output and approximately 22,000 U.S. jobs, resulting in a multiplier of $3.42
in economic output for every $1.00 of OnDeck lending.
Total
Employment Total Value Added Output
Employee retention and hiring 27,227 $2,131,229,019 $4,047,354,249
Buying inventory 22,559 $1,881,381,110 $3,362,705,807
Upgrading/Repairing existing facility 3,128 $270,352,115 $557,485,279
Acquiring new business equipment 2,906 $162,053,787 $321,536,816
Total Modeled in IMPLAN 55,821 $4,445,016,031 $8,289,082,150
Loans Not Modeled in IMPLAN 18,487 $1,472,131,187 $2,745,235,621
Imputed Total 74,308 $5,917,147,218 $11,034,317,771