Embed Size (px)
Citation preview
Cornell Journal of Law and Public PolicyVolume 21Issue 2 Winter 2011 Article 1
The Impact of State Anti-Predatory Lending Lawson the Foreclosure CrisisAlan White
Carolina Reid
Lei Ding
Roberto G. Quercia
Follow this and additional works at: http://scholarship.law.cornell.edu/cjlpp
Part of the Law Commons
This Article is brought to you for free and open access by the Journals at Scholarship@Cornell Law: A Digital Repository. It has been accepted forinclusion in Cornell Journal of Law and Public Policy by an authorized administrator of Scholarship@Cornell Law: A Digital Repository. For moreinformation, please contact [email protected].
Recommended CitationWhite, Alan; Reid, Carolina; Ding, Lei; and Quercia, Roberto G. (2011) "The Impact of State Anti-Predatory Lending Laws on theForeclosure Crisis," Cornell Journal of Law and Public Policy: Vol. 21: Iss. 2, Article 1.Available at: http://scholarship.law.cornell.edu/cjlpp/vol21/iss2/1
ARTICLES
THE IMPACT OF STATE ANTI-PREDATORYLENDING LAWS ON THE
FORECLOSURE CRISIS
Alan White, Valparaiso University School of Law*Carolina Reid, Federal Reserve Bank of San Francisco
Lei Ding, Wayne State UniversityRoberto G. Quercia, University of North Carolina at Chapel Hill
By the end of 2007, thirty states and the District of Columbia hadpassed some sort of subprime mortgage regulation statute, while the re-maining states left the subprime mortgage market unregulated. Werethese state mortgage laws effective in restraining risky mortgage lendingand mitigating the surge in foreclosures? Our study takes advantage ofthis natural experiment and compares loan terms, mortgage foreclo-sures, and defaults in states with and without anti-predatory lendinglaws (APLs), using a sample of 1.2 million mortgage loans originatedduring the subprime boom and observed monthly through the end of2008. Using these loan level data, we find that state APLs are associ-ated with a 13% reduction in prepayment penalties and appear also toreduce the incidence of option adjustable-rate mortgage (ARM) loansunder some conditions. The effects are particularly strong in the sub-prime market. APLs also reduce the risk of default, although results varydepending on the universe of loans analyzed and the specification of theAPL. The degree of coverage and restrictions also seem to matter, withmore stringent APLs having a stronger dampening effect on the origina-tion of loans with riskier terms and subsequent default rates. This analy-sis, combined with other research, suggests that strong state APLs are animportant tool for consumer protection and that federal preemption mayhave diluted their protective effect.
INTRODUCTION ................................................. 248I. LITERATURE REVIEW .................................... 250
* The views expressed here are those of the authors and do not represent the views ofthe Federal Reserve Bank of San Francisco, or of the other institutions supporting this project.The authors wish to thank the National State Attorneys General Program at Columbia LawSchool, the Center for Community Capital at UNC and Valparaiso University Law School forgenerous financial assistance, Patricia McCoy for her comments, and Lacee Louderback forlegal research assistance.
247
248 CORNELL JOURNAL OF LAW AND PUBLIC POLICY [Vol. 21:247
A. Legal Environment: State High-Cost Mortgage Lawsand Federal Preemption Before the Crisis........... 2501. The Evolution of State APLs ................ 251
B. Prior Research: Impact of State Anti-PredatoryLending Laws on Mortgage Markets ............... 253
C. Prior Research: Impact of State Anti-PredatoryLending Laws on Foreclosure Risk ................. 255
II. ANALYSIS OF THE IMPACT OF ANTI-PREDATORY LENDING
LAWS DURING THE SUBPRIME FORECLOSURE CRISIS:
DATA AND METHODOLOGY .............................. 256III. EMPIRICAL RESULTS ........................ ............ 261
A. Effect of Anti-Predatory Lending Laws on MortgageO riginations ....................................... 261
B. Effect of Anti-Predatory Lending Laws on LoanPerformance ............................... 265
CONCLUSION................................................... 269APPENDIX A: STATE ANTI-PREDATORY LENDING LAW DATA
CODING... ............................................. 284APPENDIX B: DATA AND METHODOLOGY ........................ 288
INTRODUCTION
The unprecedented levels of mortgage defaults that led to the sub-
prime crisis of 2007-2009 have been attributed in part to inadequate reg-ulation of mortgage lending.' At the federal level, Congress fostered thegrowth of subprime and exotic mortgages by displacing state consumerprotection and usury laws through federal preemption in the early1980s.2 However, a number of states, beginning with North Carolina in1999, passed laws intended to restrain mortgage abuses, within the legalspace left outside of Congressional preemption. 3 By the end of 2007,thirty states and the District of Columbia had passed some sort of mort-gage regulation statute, while the remaining states left the mortgage mar-ket unregulated.4 Were these state mortgage laws effective in restrainingrisky mortgage lending and mitigating the surge in foreclosures? Ourstudy takes advantage of this natural experiment, and compares foreclo-
1 See Patricia A. McCoy et al., Systemic Risk Through Securitization: The Result ofDeregulation and Regulatory Failure, 41 CONN. L. REv. 1327, 1333 (2009); Benjamin S.Bemanke, Chairman, U.S. Fed. Reserve, Speech at the Annual Meeting of the American Eco-nomic Association: Monetary Policy and the Housing Bubble (Jan. 3, 2010), http://federalreserve.gov/newsevents/speech/bemanke20lOOlO3a.htm.
2 Cathy Lesser Mansfield, The Road to Subprime HEL was Paved with Good Congres-sional Intentions, 51 S.C. L. REv. 473, 484-510 (2000).
3 Rafael W. Bostic et al., State and Local Anti-Predatory Lending Laws: The Effect ofLegal Enforcement Mechanisms, 60 J. OF EcoN. & Bus. 47, 49 (2008).
4 Id.
2011] THE IMPACT OF STATE ANTI-PREDATORY LENDING LAWS 249
sures and defaults in states with and without anti-predatory mortgagelaws (APLs), using a sample of 1.2 million mortgage loans originatedduring the subprime boom observed monthly through the end of 2008.
Using these loan level data, we find that state APLs are associatedwith a 13% reduction in prepayment penalties and appear also to reducethe incidence of option adjustable-rate mortgage (ARM) loans undersome conditions. The effects are particularly strong in the subprime mar-ket. APLs also reduce the risk of default, although results vary depend-ing on the universe of loans analyzed and the specification of the APL.The degree of coverage and restrictions also seem to matter, with morestringent APLs having a stronger dampening effect on the origination ofloans with riskier terms and subsequent default rates.
The results demonstrate the importance of strong state law con-sumer protections in the mortgage market. Unfortunately, federal regula-tors excused some mortgage lenders from state oversight immediatelypreceding the boom in subprime lending. In 2004, the Office of theComptroller of the Currency (OCC) joined the Office of Thrift Supervi-sion (OTS) in ruling that nationally chartered banks-like the OTS-regu-lated thrifts-were not subject to these state regulations. 5 Consequently,preemption deprived some borrowers of additional protections thatwould have encouraged better underwriting and likely reduced the levelof foreclosures. 6
The proven record of success of state APLs should encourage addi-tional states to adopt stricter mortgage regulations appropriate to theirmarkets. However, more state legislation will only be marginally effec-tive if federal regulators preempt it. The results of this study demon-strate that consumer protections should not be reduced to the leastcommon denominator. Instead, reasonable federal regulation should actas a floor for consumer protection from which states may choose to buildmore protective legislation if desired based on local market conditions.
5 DAN IMMERGLUCK, FORECLOSED: HIGH-RISK LENDING, DEREGULATION, AND THE UN-DERMINING OF AMERICA'S MORTGAGE MARKET 176-83 (2010); McCoy et. al., supra note 1, at1349; Christopher Lewis Peterson, Preemption, Agency Cost Theory, and Predatory Lendingby Banking Agents: Are Federal Regulators Biting Off More Than They Can Chew?, 56 AM.U. L. REv. 515, 529-31 (2007).
6 Lei Ding et. al., The Impact of Federal Preemption of State Anti-Predatory LendingLaws on the Foreclosure Crisis, 41 J. OF PoL'Y ANALYSIS AND MGMT. (forthcoming 2012)(prior version available at http://www.ccc.unc.edu/documents/Preemption-final_August%2027.pdf).
250 CORNELL JOURNAL OF LAW AND PUBLIC POLICY [Vol. 21:247
I. LITERATURE REVIEW
A. Legal Environment: State High-Cost Mortgage Laws and FederalPreemption Before the Crisis
Subprime mortgage lending was impossible before 1980 because ofstate usury laws that banned higher-rate mortgages.7 Many states alsoimposed legal restrictions on adjustable-rate mortgages (ARMs), such asrequiring annual and lifetime caps on upwards rate adjustments, andprohibiting negative amortization or prepayment penalties.8 In 1980,however, Congress preempted all state restrictions on first mortgage in-terest rates and fees.9 Then, in 1982, Congress responded to ARM re-strictions with the Alternative Mortgage Transactions Parity Act of 1982(AMTPA).' 0 AMTPA overrode state laws restrictions on many terms innontraditional mortgages-such as ARMs-including terms that came tobe regarded as problematic after the subprime foreclosure crisis-such asballoon payments and negative amortization." AMTPA also preemptedstate restrictions on prepayment penalties. 12
AMTPA signaled a move towards federal mortgage market regula-tion in that it prohibited states from setting restrictions on certain loanproducts.' 3 However, Congress did not replace state mortgage regula-tions with federal safeguards until 1994, when it enacted the Homeown-ership Equity Protection Act (HOEPA).14 The primary abuses HOEPAsought to regulate were excessive fees (rent-seeking) and equity strip-ping.'5 The latter practice consists of repeated refinancings, togetherwith inclusion in new loans of loan fees, credit insurance premiums, andother closing costs as well as additional cash advances to the home-owner. Because the problem was excessive loan rates and fees, HOEPAcovered only mortgages with very high annual percentage rates (8% to10% above Treasury rates) or very high prepaid points and fees (8% ofthe loan amount).16 Although HOEPA also gave the Federal Reservebroad power to regulate mortgages below these price levels, the FederalReserve did not exercise that authority until 2008.17
7 See KATHLEEN C. ENGEL & PATRICIA A. McCoy, THE SUBPRIME VIRUs: RECKLESS
CREDIT, REGULATORY FAILURE AND NEXT STEPS 16 (2011).
8 See id.9 Mansfield, supra note 2, at 492-95.
10 Pub. L. No. 97-320, 96 Stat. 1469 (codified at 12 U.S.C. §§ 3801-3806 (2006)).11 See McCoy et al., supra note 1, at 1333.12 Id.13 See id. at 1333-35.14 15 U.S.C. § 1639 (2006).15 ENGEL & MCCOY, supra note 7, at 194-95.16 Id. at 194-95; Mansfield, supra note 2, at 562.17 Truth in Lending (Regulation Z), 12 C.F.R. § 226 (2008); see ENGEL & MCCOY,
supra note 7, at 196.

2011] THE IMPACT OF STATE ANTI-PREDATORY LENDING LAWs 251
The effect of HOEPA was not so much to constrain terms of expen-sive mortgages as to simply drive them out of the market. By 2005,while about one-quarter of all mortgages were subprime, based on theFederal Reserve's high-rate threshold, less than 1% of refinancing andhome improvement mortgage loans had rates high enough to be coveredby HOEPA.18
Some states passed their own APLs to extend HOEPA's coverage,but a complicated web of federal preemption statutes limited theirreach.19 In 1996, OTS adopted separate preemption regulations that cov-ered all of their thrifts; in 2004, OCC followed suit, completely exempt-ing federal lenders from coverage by state APLs. 20 The OTS and OCCpreemption statutes also superseded a 2003 OTS ruling, which had liftedthe federal AMPTA preemption of prepayment restrictions. 21 So, duringthe period covered by our study, 2004-2008, states could restrict prepay-ment penalties-but not other nontraditional mortgage loan terms onARM and balloon mortgages-lenders with federal charters could con-tinue to include prepayment penalties. As a result, APLs and federalpreemption applied to both the type of lender and the nature of the mort-gage terms. In practice, this meant that two different lenders-operatingunder different regulatory regimes and different levels of preemption-were potentially subject to different restrictions in the types of loans theycould offer to subprime borrowers, even if they were both originatingloans in the same state.
1. The Evolution of State APLs
In 1999, North Carolina enacted the first of the modern state anti-predatory lending laws. The North Carolina Predatory Lending Act, forthe most part, followed the HOEPA approach of restricting mortgageterms for loans above a price threshold but set the price levels belowthose in HOEPA. 22 The law covered loans with points and fees exceed-ing 5%, rather than 8%.23 Because the North Carolina law prohibited the
18 See Robert B. Avery et al., Higher-Priced Home Lending and the 2005 HMDA Data,2006 FED. RES. BULL A123, A146-47 (2006).
19 See McCoy et al., supra note 1, at 1348.20 See id.21 Alternative Mortgage Transaction Parity Act of 1982; Preemption, 67 Fed. Reg. 60542
(Sep. 26, 2002); Patricia A. McCoy & Elizabeth Renuart, The Legal Infrastructure of Sub-prime and Nontraditional Home Mortgages, in BORROWING To LIVE: CONSUMER AND MORT-GAGE CREDIT REvISITED 424 n.35 (Nicolas P. Retsinas & Eric S. Belsky eds., 2008).
22 North Carolina Predatory Lending Act, N.C. Gen. Stat § 24-1.1E (2009); see Christo-pher L. Peterson, Federalism and Predatory Lending: Unmasking the Deregulatory Agenda,78 TEMP. L. REv. 1, 62 (2005).
23 North Carolina Predatory Lending Act, N.C. Gen. Stat § 24-1.1E (2009).
252 CORNELL JOURNAL OF LAW AND PUBLIC POLICY [Vol. 21:247
financing of points and fees for covered loans, the result was a de factousury cap.24
North Carolina's APL had a few restrictions applicable even toloans below the triggers. It prohibited prepayment penalties for all mort-gages of less than $150,000, prohibited certain repeated "flipping"refinancings, and banned the financing of single-premium credit insur-ance. 25 The Massachusetts, New Jersey, and New Mexico APLs fol-lowed this pattern, proscribing refinancing that did not provide a nettangible benefit to the homeowner under certain circumstances, for allmortgages, and prohibited financing of single-premium credit insur-ance. 26 The complex architecture of these state laws was driven partlyby the limited regulatory space left to the states after the Depository In-stitutions Deregulation and Monetary Control Act's (DIDMCA)27 pre-emption of direct interest and fee regulation, and AMPTA's preemptionof most restrictions on adjustable-rate and balloon loan mortgages.28
A number of other states followed the North Carolina model butusually varied the coverage and nature of the restrictions so that no trulyuniform state APL model emerged. At the same time, some cities andcounties, such as Philadelphia, Cleveland, and Oakland, attempted toregulate subprime mortgages. 29 In these three instances, the lending in-dustry sought protection from local regulation at the state level, and thethree states enacted statutes intended primarily to preempt city andcounty regulation efforts.30 The Pennsylvania and Ohio statutes trans-posed the coverage and restrictions of HOEPA to state law and, unlikeNorth Carolina, did not reduce the high-cost coverage triggers or expandconsumer protections beyond federal law. 3 1 Thus, their primary, if notsole, purpose was to prevent regulation of subprime lending at the localgovernment level. 3 2 California, on the other hand, preempted local ordi-
24 See id. § 24-1.1E(c)(3); see Peterson, supra note 22, at 62.25 N.C. Gen. Stat. §24-LIA(b)(1), § 24-10.2(b), §24-10.2(c) (2009); see Peterson, supra
note 22, at 62-63.26 Massachusetts Predatory Home Loan Practices Act, MASS. ANN. LAWS ch. 183C
(2004); New Jersey Home Ownership Security Act of 2002, N.J. STAT. ANN. §§ 46: 1OB-23 to46:1OB-34 (2002); New Mexico Home Loan Protection Act, N.M. STAT. ANN. §§ 58-21A-1 to21A-14 (2003).
27 Pub. L. No. 96-221, 94 Stat. 132 (1980) (codified as scattered sections of 12 U.S.C(2006)).
28 See Peterson, supra note 22, at 64-67.29 OAKLAND, CA., CODE OF. ORDINANCES 12361 § 2 (Oct. 2, 2001); CLEVELAND, OHIO.,
CITY ORDINANCES No. 737-02 (Mar. 4, 2002) amended at CrrY ORDINANCES No. 45-03 (Jan.14, 2003); PHILA. PA., CODE §§ 9-2400 to 9-2408 (Apr. 9, 2001); Jonathan L. Entin & ShadyaY. Yazbak, City Governments and Predatory Lending, 34 FORDHAM URB. L. J. 757, 773-79(2007).
30 Peterson, supra note 22, at 64-65.31 See id.32 See Am. Fin. Serv. Ass'n. v. City of Cleveland, 858 N. E. 2d. 776 (Ohio 2006) (hold-
ing that the Cleveland predatory lending ordinance was expressly preempted by the Ohio
2011] THE IMPACT OF STATE ANTI-PREDATORY LENDING LAWS 253
nances with an APL that extended beyond HOEPA coverage andrestrictions.33
Although abusive refinancing of mortgages, high loan fees, andcredit insurance premiums were the focus of the North Carolina statute, italso included provisions aimed at excessive foreclosure risk. 34 LikeHOEPA, the North Carolina APL prohibited the making of high-costloans without regard to the borrower's repayment ability.35 It added apresumption that a payment exceeding 50% of the borrower's incomewas unaffordable and also required counseling before a borrower obtainsa high-cost loan. 36 Repayment ability and counseling requirements wereincluded in many states' APLs.37 In this regard, the laws were intendedto reduce default and foreclosure risk directly as well as through restric-tions on pricing and terms.
B. Prior Research: Impact of State Anti-Predatory Lending Laws onMortgage Markets
Since North Carolina passed the first state anti-predatory lendinglaw in 1999, researchers have tried to understand how APLs affect themortgage market, looking to their impact on lending volume, the price ofcredit, and mortgage product substitution. Recent research has started toexamine how APLs affect the use of more exotic loan types and howstate laws have impacted mortgage foreclosure rates across states andneighborhoods.
State APLs were intended to curb so-called predatory practiceswhile permitting non-abusive subprime lending to develop.38 As a result,most empirical studies on the impact of APLs have focused on the effectof state laws on lending volume and loan prices. Some of these studiesfocus on one jurisdiction's law; others analyze outcomes nationally. Onegroup of studies that focused on North Carolina's state anti-predatorylending law found that the subprime market in the state diminished insize as a result of the law's passage. 39 This is consistent with other stud-
APL); Peterson, supra note 22, at 66; Kimm Tynan, Note, Pennsylvania Welcomes PredatoryLenders: Pennsylvania's Act 55 Preempts Philadelphia's Tough Ordinance But Provides LittleProtection for Vulnerable Borrowers, 34 RUTGERS L.J. 837, 837, 861-63 (2003).
33 Peterson, supra note 22, at 66-67.34 N.C. Gen. Stat. § 24-1.1A(c)(2) (2009).35 Id.36 N.C. Gen. Stat. § 24-1.1A(c)(1)-(2) (2009).37 See infra Table 11 and Appendix A for states with repayment ability restrictions.38 See, e.g., Wei Li & Keith S. Ernst, Do State Predatory Lending Laws Work? A Panel
Analysis of Market Reforms, 18 HOUSING POL'Y DEBATE 347, 347 (2007); Roberto G. Quercia,et al., The Impact ofNorth Carolina's Anti-Predatory Lending Law: A Descriptive Assessment,15 HOUSING POL'Y DEBATE 573, 575 (2004).
39 KEffH S. ERNST, ET AL. North Carolina's Subprime Home Loan Market after Preda-
tory Lending Reform iv (Aug. 13, 2002), http://www.responsiblelending.org/north-carolina/nc-
254 CORNELL JOURNAL OF LAW AND PUBLIC POLICY [Vol. 21:247
ies that have looked at APLs and subprime lending in Chicago and Phila-delphia, even though taken as a whole, the national data show a lack of aconsistent relationship between state laws and lending volume.40 Studiesusing state-level law indices find that APLs appear to have little impacton subprime originations, applications, or rejections at the aggregatelevel.41 But APLs with stronger restrictions are associated with a de-crease in subprime lending. 42
There are some possible explanations for these results. First, thereis a fundamental difference between the states that extended restrictionson subprime mortgages beyond federal requirements and states that sim-ply copied federal HOEPA restrictions into their state statutes. Somestate laws did not extend coverage beyond mortgages covered by federallaw. In several instances, the laws were meant to preempt local laws andordinances that imposed greater restrictions than federal law. 4 3 There-fore, it is important to distinguish between these two types of state lawswhen evaluating results.
Second, in addition to examining overall lending volume, it is alsoimportant to examine which segment of the subprime market declined,which remained stable, and which increased. Because APLs were in-tended to reduce the number of predatory or abusive subprime loans, adecline in subprime lending, especially of loans with these traits, wouldnot be surprising. If anti-predatory lending laws have curbed so-calledpredatory practices while permitting non-abusive subprime lending to de-velop, the laws have done what they were intended to do. Except for afew studies, current research has not examined this issue closely."
Another group of studies focuses on APLs' impact on the cost ofcredit. Any costs incurred in complying with regulatory requirements
mortgage/research-analysis/HMDA Study-onNCMarket.pdf; Gregory Elliehausen et al.,The Effects of State Predatory Lending Laws on the Availability of Subprime Mortgage Credit,38 CRED. RES. CTR. MONOGRAPH iv (Mar. 2006), http://www.namb.org/Images/namb/Govern-mentAffairs/Reports-and-Studies/Georgetown%20Study%20(March%202006).pdf; Keith D.Harvey & Peter J. Nigro, Do Predatory Lending Laws Influence Mortgage Lending? An Anal-ysis of the North Carolina Predatory Lending Law, 29 J. OF REAL EST. REs. 435, 439 (2004);Quercia et al., supra note 38, at 7-9.
40 Keith D. Harvey & Peter J. Nigro, How Do Predatory Lending Laws Influence Mort-gage Lending in Urban Areas? A Tale of Two Cities, 25 J. OF REAL EST. RES. 479, 479-83(2003); see Elliehausen et al., supra note 39, at 17-18.
41 Bostic et al., supra note 3, at 61-64.42 See Giang Ho & Anthony Pennington-Cross, The Impact of Local Predatory Lending
Laws on the Flow of Subprime Credit, 60 J. OF URB EcON. 210, 226 (2006); Bostic et al.,supra note 3, at 64-65.
43 See supra notes 30-32 and accompanying text.44 Anthony Pennington-Cross et al., Mortgage Product Substitution and State Anti-Pred-
atory Lending Laws: Better Loans and Better Borrowers? (Univ. Pa., Inst, for Law & Econ.Res., Working Paper No. 09-27), available at http://papers.ssrn.com/sol3/papers.cfm?abstractid=1460871; see ERNST ET AL., supra note 39; Quercia et al., supra note 38.
2011] THE IMPACT OF STATE ANTI-PREDATORY LENDING LAWS 255
might be, at least in part, passed on to the consumer through higher inter-est rates or higher points and fees. However, the evidence suggests thatAPLs generally do not drive up loan prices. Although more restrictivelaws may drive up the cost of borrowing through higher interest rates,this effect is limited to fixed-rate loans and its magnitude is typicallyfairly small.4 5
C. Prior Research: Impact of State Anti-Predatory Lending Laws onForeclosure Risk
Researchers have started to investigate whether differences in regu-latory environment and state APLs contribute to differences in the qual-ity of loans originated and subsequent rates of foreclosure. Data suggestthat high default risk is associated with many of the features restricted byAPLs, such as prepayment penalties, balloon payments, lack of verifica-tion of borrowers' repayment capacity, and very high interest rates andfees. One study found that subprime ARMs have a higher risk of fore-closure because of interest-rate risk and practices, such as underwritingusing teaser rates.46 Additionally, at the aggregate level, the share ofARMs appears to be positively associated with market risk, as measuredby house price declines, 47 and subprime hybrid ARMs, which usuallyhave prepayment penalties, bear particularly high risk of default at thetime the interest rate is reset.48
As to prepayment penalties and balloons, Roberto Quercia and col-leagues found that refinance loans with prepayment penalties are 20%more likely to experience a foreclosure, and loans with balloon paymentsare about 50% more likely to do so. 4 9 Prepayment penalties also tend toreduce prepayments and increase the likelihood of delinquency and de-fault among subprime loans.50 ARMs, prepayment penalties, and brokeroriginations are all significant factors that increase risk of default forsubprime loans.51
45 Li & Ernst, supra note 38, at 380-89; Anthony Pennington-Cross & Giang Ho, Preda-tory Lending Laws and the Cost of Credit, 36 REAL EST. EcON. 175, 203 (2008).
46 Roberto G. Quercia et al., The Impact of Predatory Loan Terms on Subprime Foreclo-sures: The Special Case of Prepayment Penalties and Balloon Payments, 18 HOUSING POL' YDEBATE 311, 335-37 (2007).
47 Dan Immergluck, From the Subprime to the Exotic: Excessive Mortgage Market Riskand Foreclosures, 74 J. OF THE AM. PLAN. Ass'N 59, 60-64 (2008).
48 B.W. Ambrose, et al. A Note on Hybrid Mortgages, 33 REAL EST. EcoN. 765, 781(2005); Anthony Pennington-Cross & Giang Ho, The Termination of Subprime Hybrid andFixed Rate Mortgages, 38 REAL EST. EcON. 399, 401 (2010).
49 Quercia et al., supra note 46, at 335-37.50 IMMERGLUCK, supra note 5, at 60-64.51 Lei Ding et al., Risky Borrowers or Risky Mortgages: Disaggregating Effects Using
Propensity Score Models 19 (U.N.C., Chapel Hill Ctr. for Cmty Capital, Working Paper,2010), available at http://www.ccc.unc.eduldocuments/Risky.Disaggreg.5.17.10.pdf.
256 CORNELL JOURNAL OF LAW AND PUBLIC POLICY [Vol. 21:247
One study examined the impact of state APLs on mortgage-productmix, and found that state APLs significantly reduced the use of mortgagefeatures thought to increase foreclosure risk, including prepayment pen-alties, balloon payments, non-amortizing loans, investor loans. and re-duced income documentation. 52 In other words, APLs resulted in lessrisky mortgage products. The study also found insignificant differencesin borrower credit quality, tending to rule out the hypothesis that lendersin APL states systematically sought better borrowers. 53
Although the literature does document a clear link between riskymortgage product features and foreclosures, very few studies have ex-plicitly examined the link between state APLs and local- or state-levelforeclosure rates. In a working paper, Goodman and Smith suggest thatthe laws governing mortgage underwriting, mortgage foreclosures, andthe potential costs to the lender differ substantially across states.54 Theyfound some evidence that mini-HOEPA laws-APLs-reduce the levelof foreclosure, which suggests that higher lender costs for foreclosureand stringent controls on predatory lending are connected to lower fore-closure rates.55 However, since Goodman and Smith only use a cross-sectional dataset for one particular month, their paper's applicability maybe limited. As regulations are being proposed and amended to addressthe cyrrent mortgage crisis, further research in the area of laws and regu-lations and the measurement of their effectiveness is needed.56
II. ANALYSIS OF THE IMPACT OF ANTI-PREDATORY LENDING LAWS
DURING THE SUBPRIME FORECLOSURE CRISIS: DATAAND METHODOLOGY
APLs were designed to protect consumers by restricting the origina-
tion of loans with predatory features. Some of the restricted loan terms
are known to be associated with increased risk of default and foreclo-sure.57 In addition, APLs may restrict the origination of the riskiest loansby putting some outer limits on subprime mortgage pricing. If APLswork, for example, by improving the quality of loans originated and byreducing the likelihood of default, then they can help to inform the regu-latory landscape going forward. But do they work in this fashion? And
52 Pennington-Cross et al., supra note 44, at 23-24.53 Id. at 22-24.54 Allen C. Goodman & Brent Smith, Hierarchical Modeling of Residential Default:
Does State Level Foreclosure and Predatory Lending Legislation Limit 'Bad' Loans? (Work-
ing Paper, 2009), available at http://ssm.com/abstract=1408212.55 Id. at 27.56 Francisca Richter, An Analysis of Foreclosure Rate Differentials in Soft Markets (Fed.
Reserve Bank of Cleveland, Working Paper 08-11, 2008), available at http://ssm.com/abstract=1316978.
57 See supra notes 35-40.
2011] THE IMPACT OF STATE ANTI-PREDATORY LENDING LAWS 257
what features of APLs are the most important in ensuring consumer pro-tection in the mortgage market?
Following the literature on various effects of APLs described above,we take advantage of the natural experiment resulting from the progres-sive enactment of APLs in 30 states and the District of Columbia.58 Ourstudy first examines whether or not APLs are associated with lower ratesof originations of loans with risky features, and whether or not certainaspects of APLs are more important than others in ensuring responsiblelending. Using a national, loan-level database of mortgages originatedbetween 2002 and 2006, we examine differences in loan terms and out-comes in states with and without APLs, controlling for a wide range ofborrowers, neighborhood, and economic characteristics that might influ-ence underwriting practices and loan performance. We also examine theeffect of different components of APLs by testing whether certain restric-tions, such as banning prepayment penalties or requiring the lender toverify a borrower's ability to repay, influence the product features oforiginated loans.
Then, we look explicitly at whether APLs served to mitigate theforeclosure crisis. Using the same loan-level data, we examine whetherloans in states with APLs were less likely to be ninety or more daysdelinquent than loans made in non-APL states. This effect of APLs ishypothesized to work in two ways. First, APLs may reduce the inci-dence of foreclosure by limiting the number of loans with risky loanfeatures, such as prepayment penalties or option ARM features. Second,by improving overall underwriting quality, APLs may help to ensure thatlenders are more attuned to the borrower risk profile and ability to repaythe loan over the long term.
Because there is significant variation in the coverage and strength ofAPLs across different states, most researchers have developed a set ofindices to quantify the substantial variation in the laws.59 This paperrelies on a state law coding system that includes measures that not onlytest for the presence of a state law, but also its strength and the nature ofits restrictions.60
58 See Benjamin Lindy, The Impact of Teacher Collective Bargaining on StudentAchievement: Evidence from a New Mexico Natural Experiment, 120 YALE L. J. 1130, 1151(2011) (describing natural experiment studies generally). An important limitation of any natu-ral experiment is the possible endogeneity of the variable of interest, in our case the enactmentof state APLs. We are not aware of omitted variables associated with the APL states thatwould have an independent effect on the outcome variables, i.e. on mortgage product mix ordefault rates. Our models attempt to control for demographic and economic variables thatwould separately influence the outcomes measured, but as with any natural experiment study,we cannot entirely rule out the possibility of omitted variable bias.
59 See Pennington-Cross & Ho, supra note 45, at 176.60 See infra Appendix A.

258 CORNELL JOURNAL OF LAW AND PUBLIC POLICY [Vol. 21:247
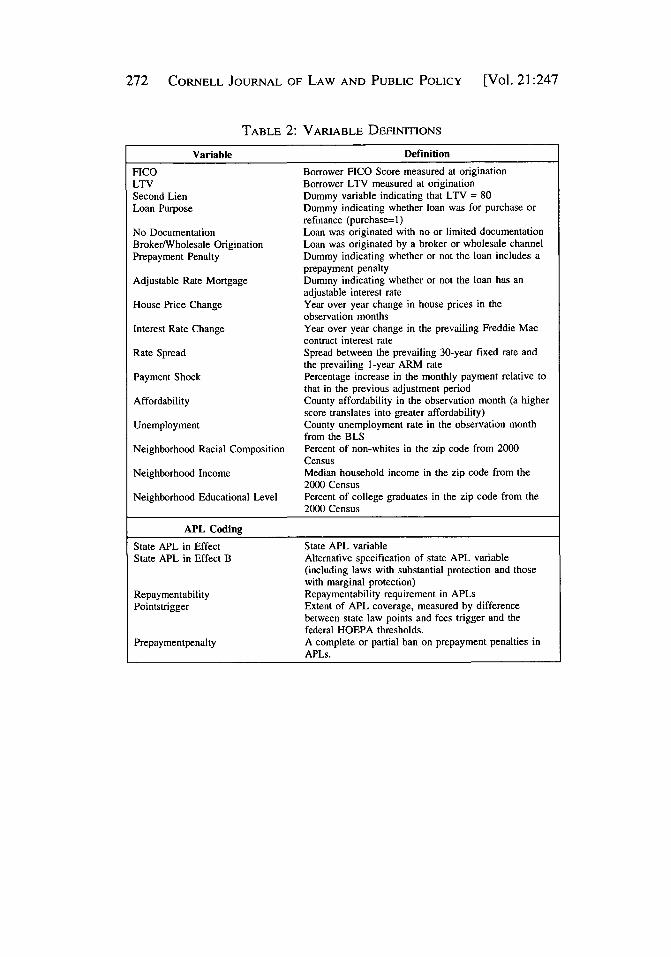
The binary variable ineffect, modeled on prior studies and combinedwith the effective date variable for the same state and law, is intended toidentify states with mortgage statutes that could plausibly have an impacton high-cost or subprime mortgage lending. 6' In a departure from someprior studies, states that simply copied the federal HOEPA restrictionsare not identified as having an anti-predatory lending statute by the inef-fect variable. In several instances, the intent of these laws was to pre-empt local laws and ordinances that imposed greater restrictions thanfederal law. 6 2 However, these eight states are included in an alternativespecification, ineffectb, which allows us to test our coding approach.
In addition to the presence of a state law, this study also identifiesthe nature of its restrictions. The variable pointstrigger quantifies thecoverage of state APLs below the federal HOEPA thresholds. The varia-ble prepaymentpenalty captures the scope and extent of prepayment pen-alty restrictions on a scale of zero to four. Finally, the binary variablerepaymentability identifies states with two types of requirements subjectto enforcement or sanction. One requirement is that repayment ability bedetermined, verified, or both for a significant portion of the mortgagemarket. The other requirement is that borrowers receive counseling as aprecondition to obtaining a mortgage loan. 6 3
The quantitative analysis used in this Article relies on a proprietarydataset on loan performance collected by Lender Processing ServicesApplied Analytics, Inc. (LPS).64 We selected a random 10% sample ofthe 14.6 million loans in the LPS dataset, limiting the sample to owneroccupied, conventional, and first lien loans in this analysis. The datawere cleaned to account for missing information- like missing FICOscore, LTV, or income documentation level-and to remove data withclear reporting errors-such as reported zip code not in property state,and LTV less than 10. The final study sample used in the analysis con-sists of approximately 1.2 million loans that originated between January1, 2002 and December 31, 2006. Performance was observed from origi-nation through December 2008; after 2008, the combination of the reces-sion and financial crisis, sharp increase in unemployment, and the rapidlychanging policy environment make it difficult to isolate the impact ofAPLs on either loan originations or loan performance.65 Each loan was
61 See Bostic et al., supra note 3, at 58; Pennington-Cross et al., supra note 44, at 16-17.62 See Bostic et al., supra note 3, at 49-50.63 For more details on the coding system used for state laws, see infra Appendix A.64 For more details on the LPS dataset, see infra Appendix B.65 See Robert B. Avery et al., The 2009 HMDA Data: The Mortgage Market in a Time of
Low Interest Rates and Economic Distress, 2010 FED. RESERVE BULL. A39, A39 (2010);Timothy Dunne & Kyle Fee, Economic Trends: Changes in Foreclosure and Unemploymentacross States, EcON. TRENDS, FED. RESERVE BANK OF CLEVELAND, Economic Trends, July 6,2010, http://www.clevelandfed.org/research/trends/2010/0710/01regact.cfm.
2011] THE IMPACT OF STATE ANTI-PREDATORY LENDING LAWs 259
repeatedly observed from the month it is originated until the loan (1) waspaid off, (2) became ninety-days delinquent, or (3) was still active andnever experienced a delinquency of more than ninety days by December2008 (right censored). We focused on ninety-day delinquency as op-posed to foreclosure status, because state laws governing foreclosure canhave strong impacts on the length of the foreclosure spell, thus cloudingthe analysis of the effect of state anti-predatory lending laws. 6 6
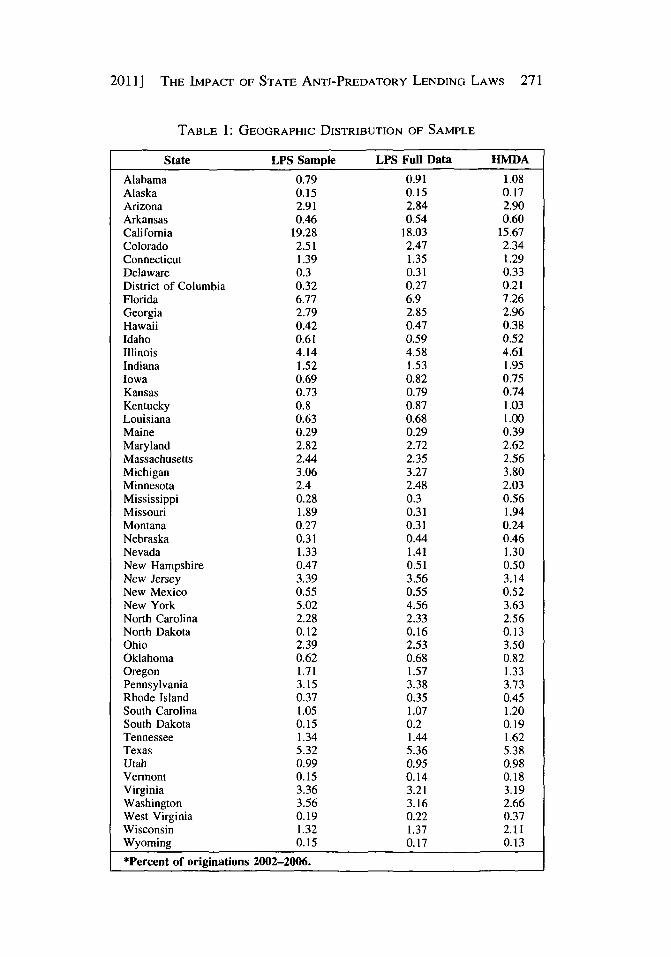
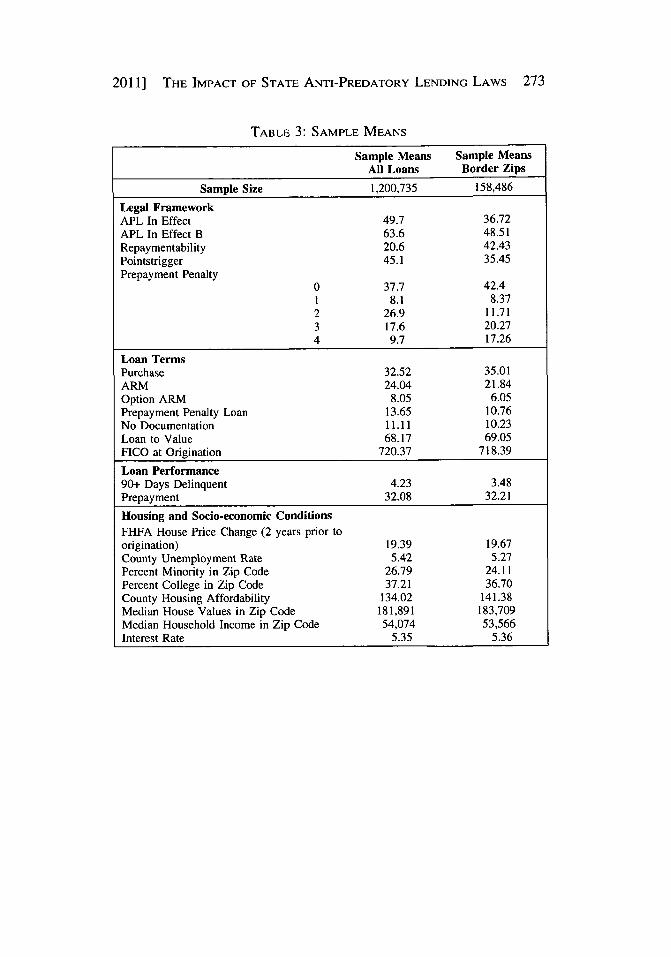
We tested the representativeness of the study sample against theoverall mortgage market. A drawback of the LPS data is that it under-represents the subprime market and does not include either combinedloan-to-value (LTV) ratio or debt-to-income (DTI) information. How-ever, its broad geographic coverage and inclusion of both securitized andportfolio loans allow for an examination of a wider swath of the mort-gage market than other available loan performance data. In terms of thegeographic coverage at the state level, the sample is not significantlydifferent from either the geographic distribution of loans in the full LPSdatabase or the originations as reported in the Home Mortgage Disclo-sure Act (HMDA) data. 67 The one exception is a light overrepresenta-tion of loans originated in California. The performance of the loans inthe sample parallels national delinquency rates for all loans. Of the loansin the sample, 32.08% were paid off, 4.23% became ninety days delin-quent, and the remaining 63.69% were still active as of December 2008.The relatively strong performance of loans in the sample attests to thedistribution of loans in LPS and its underrepresentation of the subprimemarket.
Because differences in both loan originations and loan performanceare driven by factors such as borrower risk profiles and local and nationaleconomic conditions, 68 we also included borrower, housing, and labormarket characteristics in our modeling. At the borrower level, we in-cluded FICO score and LTV at origination, which are both significantand strong predictors of loan product and loan outcomes. Unfortunately,the LPS data do not allow us to control for other borrower characteris-tics, such as income or race. To account for the possibility of loans withsecond liens, we constructed a dummy variable for loans originated atexactly 80% LTV.6 9 We also included variables for whether the loanwas used for purchase or refinance and whether it was originated without
66 See generally Amy Crew Cutts & William A. Merrill, Interventions in Mortgage De-fault: Policies and Practices to Prevent Home Loss and Lower Costs (Freddie Mac WorkingPaper 08-01, 2008), available at http://www.freddiemac.com/news/pdf/interventions-inmort-gage.default.pdf (discussing the effects of state foreclosure laws).
67 See infra Table 1.68 See generally Avery et al., supra note 65.69 During the subprime boom, many lenders offered "80/20" loans, i.e. a first mortgage
for 80% of the home value and a junior mortgage for the remaining 20%. These loans were
260 CORNELL JOURNAL OF LAW AND PUBLIC POLICY [Vol. 21:247
documentation of the borrower's income or assets. To control for mort-gage market channel, we included information as to whether the loan wasoriginated by a mortgage broker, also known as the "wholesale" mort-gage market channel. Studies suggest that loan origination channels playan important role in determining the types of mortgages borrower re-ceive, the cost of credit, and consequently the foreclosure rate. 70
To account for housing-market dynamics, we constructed a house-price change variable for each loan. House-price dynamics are importantpredictors of foreclosure, 71 and falling house prices have been shown tobe a primary driver in the recent foreclosure crisis. 72 House-pricechanges, based on the Federal Housing Finance Agency (FHFA) houseprice index, are measured at the MSAIMetropolitan Division, and arecalculated as a year-over-year rate of change from the month of observa-tion. We also included a yearly measure of housing affordability at thecounty level.7 3 Areas with lower affordability scores saw a large gapbetween local incomes and housing prices, suggesting that fewer house-holds were able to afford a home in that county and making them morelikely to rely on riskier mortgage products.
We also used other variables that capture general housing, mortgagemarket, and economic conditions. These included monthly county un-employment rates from Bureau of Labor Statistics (BLS) and the prevail-ing contract interest rates on commitments for conventional fixed ratemortgages from Freddie Mac each month. To control for general neigh-borhood effects, we incorporated the percent of minority residents, themedian household income, and the percent of college graduates at the zipcode level from the 2000 Census.
Table 2 presents the variables used in the analysis, and Table 3 pro-vides summary statistics and descriptions of the estimation data. Foreach step of the analysis, we present the full model results for all loans,and then provide additional analyses for various loan types reportingonly the coefficients for the state APL variables.
regarded as particularly risky because the borrower had no investment in the property. SeeENGEL & McCoy, supra note 7, at 36.
70 See Keith S. Ernst et al., Steered Wrong: Brokers, Borrowers, and Subprime Loans,Ctr. for Responsible Lending, Apr. 8 2008, at 13, 21, 33, http://www.responsiblelending.org/mortgage-lending/research-analysis/steered-wrong-brokers-borrowers-and-subprime-loans.pdf; Ding et al., supra note 51, at 33-34.
71 Tim S. Campbell & J. Kimball Dietrich, The Determinants of Default on ConventionalResidential Mortgages, 38 J. or FIN. 1569, 1569-70 (1983).
72 Mark Doms et al., Subprime Mortgage Delinquency Rates (Fed. Reserve Bank of S.F.,Working Paper 2007-33, 2007), available at http://www.frbsf.org/publications/economics/pa-pers/2007/wp07-33bk.pdf; Kenneth Gerardi, et al., Subprime Outcomes: Risky Mortgages,Homeownership Experiences, and Foreclosures (Fed. Reserve Bank of Bos., Working Paper07-15, 2007), available at http://www.bos.frb.org/economic/wp/wp2007/wp07l5.htm.
73 Moody's Analytics, Economic & Consumer Credit Analytics, http://www.econ-omy.com provides economic analysis, data, and credit risk services.
2011] THE IMPACT OF STATE ANTi-PREDATORY LENDING LAWS 261
To better capture the relation between APLs and foreclosure ratesand to test whether our general model sufficiently accounted for eco-nomic and other non-legal differences between and among states, wealso used the cross-border approach similar to the one used in other stud-ies.7 4 The cross-border sampling method takes into account intrastatevariation in economic conditions that can significantly influence mort-gage performance by focusing on loans in zip codes that are in the samehousing and labor markets. Borrowers on either side of the border arelikely to be experiencing similar housing market and economic condi-tions, thereby eliminating unobservable differences between differentmarkets that we cannot control for in the model.75 As a result, the majorremaining difference is the legal landscape between the neighboring zipcodes. The approach focuses on zip codes located on state borders (withthe center of the zip code within five miles of the state lines) where oneof the two bordering states had an APL.
While the cross-border method can help to eliminate unobservabledifferences among housing and mortgage markets, it faces some limita-tions of its own in examining patterns of subprime lending. Areas of thecountry that saw the highest rates of subprime lending, such as Califor-nia, Arizona, Nevada, and Florida, do not have any major markets lo-cated at state borders. 76 However, by presenting both the analysis for thecross-border zip codes and the analysis for all the loans in the sample, webelieve that we contributed additional information on the effect of stateAPLs on loan performance that would not have been accounted for bypresenting either method alone. Our hope is that this Article will lay thegroundwork for more detailed examination of the role that APLs play inshaping mortgage market outcomes for consumers.
III. EMPIRICAL RESULTS
A. Effect of Anti-Predatory Lending Laws on Mortgage Originations
In the first stage of the analysis, we examine whether the existenceof APLs influenced the characteristics of originated loans, reducing theincidence of loans with risky features, such as prepayment penalties, in-terest only, negative amortization, balloon payments, and low-documen-tation. For our model specification, we use a logit regression model,
74 Bostic et al., supra note 3, at 50; Pennington-Cross et al., supra note 44, at 13.75 Bostic et al., supra note 3, at 56.76 See Katalina M. Bianco, The Subprime Lending Crisis: Causes and Effect of the Mort-
gage Meltdown, CCH MORTGAGE COMPLIANCE GUIDE AND BANK DIGEST, 2008, available athttp://business.cch.com/bankingfinance/focus/news/SubprimeWP-rev.pdf (describing thehardest-hit areas).
262 CORNELL JOURNAL OF LAW AND PUBLIC POLICY [Vol. 21:247
with loan type as the dependent variable, and cluster the standard errorsby zip code.77 We focus on two key loan types in this analysis.
First, we examine whether state APLs influence the origination ofloans with prepayment penalties. Prepayment penalties, the focus ofmany state APLS, were frequently included in subprime mortgages andhave been found to increase the risk of foreclosure. Second, we examinewhether APLs had any effect on the likelihood of the origination of op-tion ARMs, which we define as ARMs with payment options, includinginterest only loans, loans with negative amortization, and ARM loanswith balloon payments. During the subprime boom, option ARMs be-came widely prevalent as "affordability" products. They were particu-larly risky given the possibility that lenders did not assess the long-termaffordability of the mortgage after the interest-only or negative amortiza-tion period ended.78 In addition, option ARMs were often offered with avery low teaser rate (often as low as 1%), which translates into very lowminimum payments for the first year of the ARM. There has been signif-icant concern that during the subprime boom, lenders underwrote bor-rowers for the initial payments that were significantly below the fullyamortizing payment level, leading to potentially severe subsequent pay-ment shock. For these loans, we only look at the subset of ARMs toassess whether or not the loan was originated with a riskier paymentstructure.
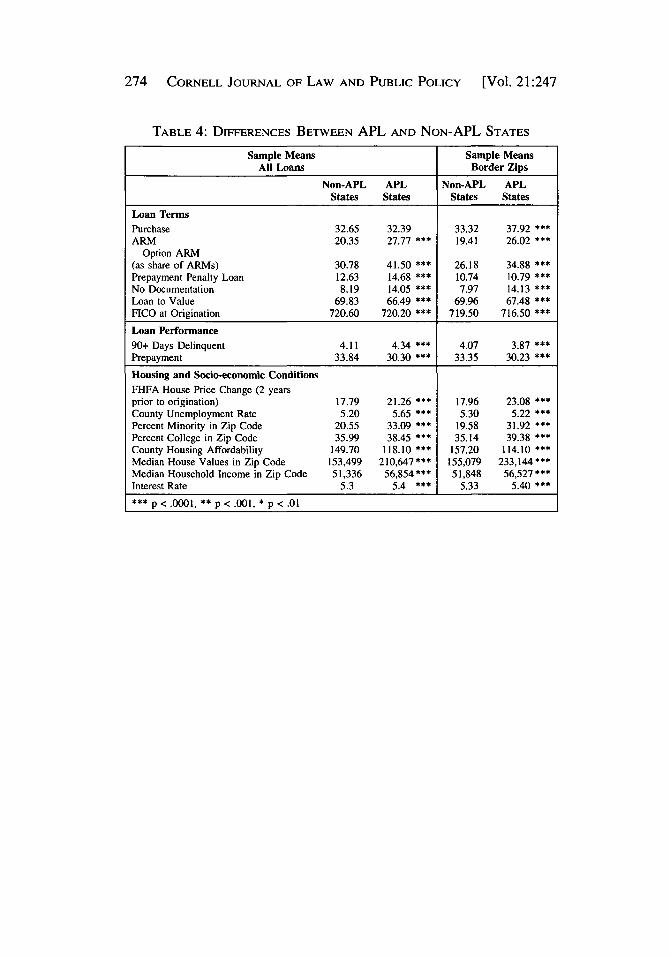
In Table 4, we compare simple descriptive statistics on the origina-tion rates of option ARM loans and loans with prepayment penalties instates with and without APLs. The table shows that there are significantdifferences in the origination of these riskier loan types and that theseloans were more common rather than less in APL states. The popularityof nontraditional mortgages in a single large state, California, whoseAPL was not effective in curbing risky loan features, may help explainmuch of the difference here. In addition, the table also shows that socio-economic conditions in APL states and non-APL states varied signifi-cantly, with APL states having higher housing costs and lower levels ofhousing affordability, higher rates of unemployment, and a higher per-centage of minority residents.
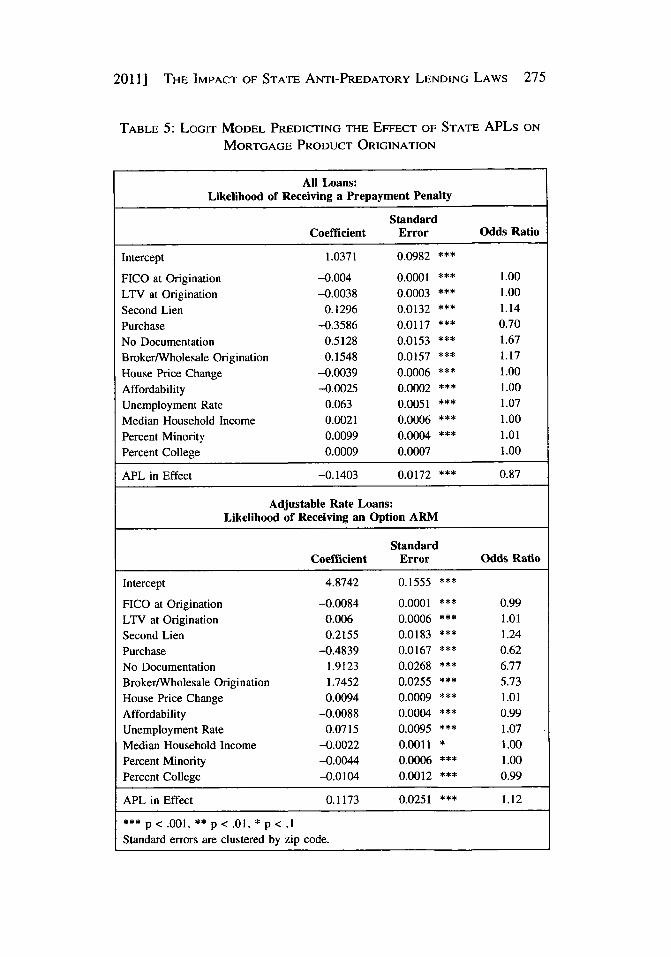
However, once we control for borrower, housing, and labor marketcharacteristics, we see that borrowers in APL states were less likely toreceive a loan product with risky features, particularly when it comes tothe likelihood of receiving a prepayment penalty. 79 Importantly, we findthat APLs reduce the likelihood of the origination of loans with prepay-
77 Further details of the regression models used, the underlying assumptions, and ourtesting of alternative models, are set forth in Appendix B.
78 ENGEL & McCoy, supra note 7, at 35.79 See infra Table 5.
2011] THE IMPACT OF STATE ANTI-PREDATORY LENDING LAWS 263
ment penalties by approximately 13%. The strong effect on prepaymentpenalties is consistent with expectations and prior work,80 because manystate laws focus on restricting or banning prepayment penalties in theirdesign.8'
Consistent with expectations, we find that borrowers with lowercredit scores are more likely to receive a loan with a prepayment penalty,as are loans that are used to refinance, loans originated by mortgage bro-kers, and loans that have no income documentation. The dummy varia-ble indicating the likely presence of a second lien is also positive andhighly significant. Housing affordability affects the likelihood of receiv-ing a loan with prepayment penalties as well. Neighborhoods withhigher percentages of minorities are also more likely to receive a loanwith a prepayment penalty.
In the second half of Table 5, we examine whether the presence ofany APL had an effect on the incidence of option ARM loans. In con-trast to the prepayment penalty analysis, we do not find any effect ofstate APLs on the origination of option ARMs. In fact, the state APLvariable is positive and significant. Several factors could account for thisfinding. The high rate of option ARMs originations in California, anAPL state that did not have any repayment ability restrictions in itsAPLs, may be skewing the results. In additional analysis, we find thatexcluding California from the analysis does influence the results, makingthe APL variable slightly negative but not significant. More likely, how-ever, is that AMTPA restricted the ability of states to regulate mortgageterms on nontraditional mortgages such as ARMs, thereby limiting stateAPLs effectiveness in this market. 82 The full model also shows the de-gree to which option ARMs were offered as affordability products in"hot markets"-housing markets that saw rapid price appreciation and alarge gap between house values and incomes saw a greater incidence ofoption ARM loans. Lower FICO scores, higher LTVs, and a lack ofdocumentation also significantly increased the likelihood of receiving anoption ARM, as did mortgage broker originations.
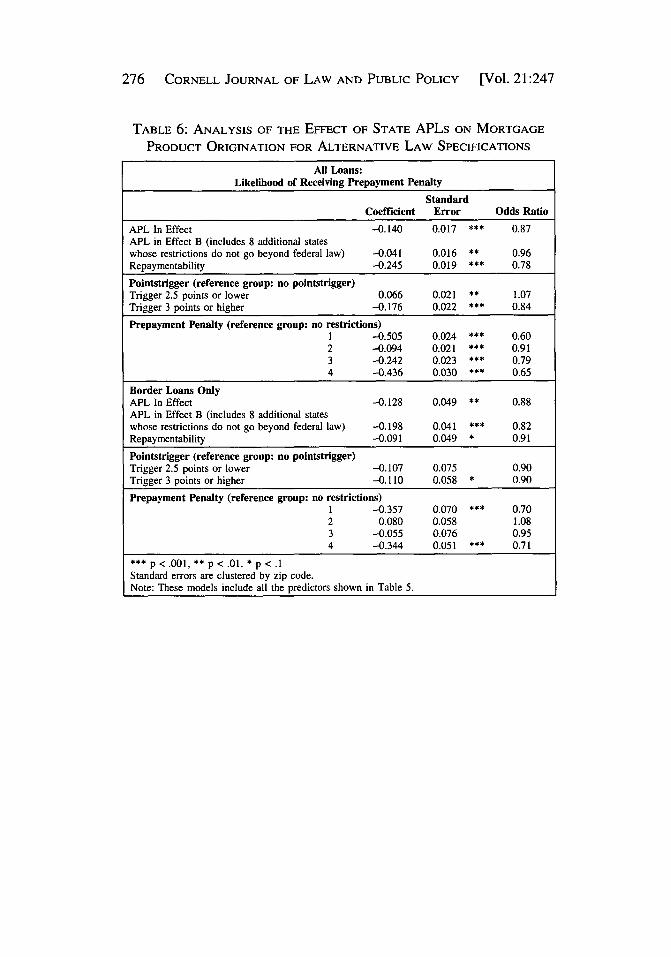
Table 6 presents results using alternative specifications of the APLvariable. For states with APLs that did not go beyond the federal statutes(APL ineffectb), we still see a reduction in the incidence of prepaymentpenalties, but it is lower than in states with stronger APLs. By contrast,stronger restrictions-such as the repaymentability requirement-greatlyreduced the likelihood of both prepayment penalties and option ARMs.A pointstrigger specification of 3 points or higher has a stronger effectfor loans with prepayment penalties than for loans with option ARMs.
80 See, e.g., Pennington-Cross et al., supra note 44.81 See ENGEL & McCoy, supra note 7, at 16; Mansfield, supra note 2, at 556.82 See McCoy et al., supra note 1, at 1333.
264 CORNELL JOURNAL OF LAW AND PUBLIC POLICY [Vol. 21:247
This suggests that the strength of the APL, in particular APLs that re-strict more contract terms, can significantly influence the types of loanproducts that are originated. For example, in California where the APLstatutes lacked repayment ability restrictions and therefore did not re-quire either the verification of a borrower's ability to repay or financialcounseling, there was insufficient consumer protections built into itsAPL to limit the number of option ARM originations, particularly givenits rapidly rising house prices.
Table 6 also demonstrates the importance of the scope and coverageof state APLs in influencing lender underwriting behavior. States withthe strongest restrictions on prepayment penalties (coded "4") reducedthe likelihood of borrowers receiving a loan with a prepayment penaltyby a third (odds ratio = 0.65).83 However, we do not observe a mono-tonic relationship between the strength of prepayment penalty laws andtheir effect; states with weaker prepayment penalty laws (coded "1") alsosaw large reductions in the incidence of prepayment penalties. More re-search is needed to understand the relationship between the elements ofstate APLs and their effects in the marketplace. States with strong pre-payment penalty APLs also saw lower rates of option ARMs, howeverthis is likely more due to the substantial overlap between states withstrong prepayment penalty laws and repaymentability requirements thanto the fact that prepayment penalty APLs have a direct effect on the inci-dence of option ARM originations. There is significant overlap betweenstates that have strong prepayment penalty restrictions and those thathave repaymentability coverage and higher pointstrigger values aswell.84
In the bottom half of the table, we examine the effect of APL speci-fications for only those loans originated along the border zip codes.Overall, the results are quite consistent with the results for all loans, withAPLs decreasing the likelihood of prepayment penalties. Interestingly,among border zip codes, state APLs do reduce the incidence of optionARMs by about 17%. Also of note, repaymentability and pointstriggerrestrictions emerge as more important for option ARMs, proving to beless significant in the likelihood of the origination of loans with prepay-ment penalties. Prepayment penalty restrictions logically have a strongernegative effect for loans with prepayment penalties. If the border zipcodes are effectively controlling unobservable differences between com-munities that might influence the origination of loans with these charac-teristics (thus clouding the interpretation of the model including allloans), these results would suggest that targeted APLs really do influence
83 The state bans were not 100% effective because federal lenders could continue includ-ing prepayment penalties due to OCC and OTS preemption.
84 See infra Appendix A.
2011] THE IMPACT OF STATE ANTI-PREDATORY LENDING LAWS 265
the origination of loans they are intended to: stronger prepayment penaltyrestrictions reduce loans with prepayment penalties but have less of aneffect on option ARMs, and repayment ability restrictions may have agreater influence on the origination of option ARMs. More research intothese relationships is certainly warranted, especially as policymakersstruggle with finding a balance between consumer protections on the onehand and avoiding undue restrictions on access to credit on the other.
In Table 7, we examine the effect of various APL specifications onloan originations within the subprime market, which we define as bor-rowers with a FICO score of less than 620.85 For loans with prepaymentpenalties, we find a much stronger effect of the state APL variable,which aligns with the fact that many state APLs are targeted at the sub-prime market. The effect is similarly strong when we look at the borderzip code loans only. Within the subprime market, state APLs reducedthe incidence of prepayment penalties by 43%. States with strong APLsthat included repaymentability requirements saw reductions in prepay-ment penalties of nearly 50%, and of option ARMs from between 25%and 40%, depending on whether we consider all the loans or only thoseon state borders. On balance, these findings suggest that state APLs caneffectively reduce the incidence of loan originations with riskier productfeatures. However, the analysis also shows that the strength of the APLmatters, and that APLs were not a panacea. In high-cost markets in par-ticular, existing state APLs were not sufficient for reducing the origina-tion of riskier loan products.
B. Effect of Anti-Predatory Lending Laws on Loan Performance
In the next stage of the analysis, we examine whether or not stateAPLs have an effect on loan performance. We expect that once we con-trol for borrower, housing, and labor market characteristics, states withstronger restrictions on predatory loan terms would have, on balance,lower defaults and hence lower foreclosure rates. We theorize that APLswill affect default rates either by limiting the origination of loans withrisky loan features or by improving the overall quality of underwriting,thereby ensuring that borrowers do not obtain loans that they cannot af-ford over the long term.
To account for changes over time in macroeconomic conditions, thevariables capturing interest-rate changes, unemployment, house price
85 To check for robustness, we also tested the model with subprime defined as "B" and"C" mortgage originations, a designation by the originator identified in the data. The resultsare consistent across both definitions, with a stronger effect of the APL variables for "B" and"C" mortgage originations (e.g. an odds ratio of 0.24 compared with 0.72 for the APL in effectmodel). We chose to use the former because the overall number of "B" and "C" mortgages inthe same is quite small, limiting our ability to replicate the analysis for border zip codes.

266 CORNELL JOURNAL OF LAW AND PUBLIC POLICY [Vol. 21:247
changes, and affordability are allowed to be time-varying covariates. Aspreviously mentioned, each loan is repeatedly observed from its monthof origination until (1) it is paid off, (2) it becomes ninety-days delin-quent, or (3) it continues past December 2008 (right censored). To cap-ture changes in interest rates that might influence the prepaymentdecision, we calculate the month-over-month change in the Freddie Macprevailing contract interest rate. For models predicting the performanceof ARMs, we include additional variables to account for potential pay-ment shocks related to changes in the loan interest rate, including a mea-sure of payment shock and the spread between the prevailing thirty-yearfixed rate and the prevailing one-year ARM rate. We also include themortgage origination channel. Since the wholesale mortgage originationchannel was more conducive to mortgage fraud-by brokers and corre-spondents, appraisers, and, some borrowers-we expect to see higherlevels of both serious delinquencies and prepayments in this channel.Finally, in each of the models, we include time dummies for the monthand year of origination.
Building on previous literature on mortgage defaults,'86 we use op-tion theory to develop our modeling approach for this question. Optiontheory posits that borrowers decide each month either to make a mort-gage payment, to exercise the prepayment option (e.g., sell the home orrefinance), or exercise the default option.87 These options are competingrisks; choosing one eliminates the possibility of the other until the nextmonthly payment is due. Loan performance is observed each month, andwe assume that prepayment and default (as opposed to the referencegroup making mortgage payments) are distinct events that are influencedby different underlying mechanisms. We model these competing risksusing the multinominal logit (MNL) framework.88 Although researchersoften rely on the Cox proportional hazards framework to analyze prepay-ment and default, Clapp and his colleagues have shown that using theMNL framework allows for estimating a flexible baseline hazard.89 Theinformation for each loan is restructured to include one observation foreach time period in which that loan is active-from origination up to andincluding the period of termination. Once the data are restructured, thelikelihood function is identical, in discrete time, to the continuous-timelikelihood function for the Cox model.
86 See Ambrose et al., supra note 48, at 772-76. See generally Pennington-Cross & Ho,supra note 48.
87 C. Foster & Robert Van Order, An Option-Based Model of Mortgage Default, 3 Hous-iNG FIN. REV. 351, 352-55 (1984).
88 See, e.g., John M. Clapp et al., Movers and Shuckers: Interdependent PrepaymentDecisions, 29 REAL EsT. ECON. 411, 422-23 (2001). For more detail, see infra Appendix B.
89 See Clapp et. al., supra note 88, at 422-23.
2011] THE IMPACT OF STATE ANTI-PREDATORY LENDING LAWS 267
Table 8 presents the results of our competing-risk model. Delin-quency and prepayment are the competing risks, and the reference groupis loans that remained active without serious delinquency as of December2008. We report the coefficient, standard error, and "relative risk" ratio.The relative risk ratio gauges the effect of an independent variable on thetwo reported outcomes-delinquency and prepayment-relative to thelikelihood of remaining active, given that the other variables in the modelare held constant.
The model shows a strong and significant effect of state APLs onthe likelihood of default. Loans originated in APL states are signifi-cantly less likely to be delinquent by ninety or more days, with a relativerisk ratio of 0.75. The full model reveals important information aboutthe determinants of default and prepayment. First, it is clear that borrow-ers with riskier credit profiles-most notably captured in FICO scores-are much more likely to be in default than are borrowers with highercredit scores. Second, a high loan-to-value ratio significantly increasesthe likelihood of default. Third, borrowers that saw a drop or smallerincrease in neighborhood house values were more likely to be in defaultthan those who saw continued house-price appreciation after origination.As expected, we also see a strong, positive effect of wholesale origina-tion channel on both the likelihood of delinquency and prepayment.
In contrast, borrowers who saw house price declines were much lesslikely to prepay. This is as we expect. Borrowers who saw their equityerode as a result of declining house prices would have to pay a higherrisk premium on a new mortgage, therefore reducing the likelihood ofprepayment, all other things being equal. The model also attests to theimportance of interest rates. If the prevailing interest rate at last point ofobservation is higher than the prevailing rate at origination, the likeli-hood of prepayment decreases significantly. Borrowers living in neigh-borhoods with higher percentages of minorities were more likely toexperience a delinquency, and less likely to prepay, than areas withlower shares of minority households.
Table 9 presents the results of the effect of state APLs using alterna-tive samples of loans, reporting only the coefficients and relative riskratios for the state APL variable, and its relationship to the risk of delin-quency. For the sample of subprime loans, state APLs reduced the likeli-hood for both the full sample and for loans only in border zip codes. Theeffect of APLs appears to be relatively consistent across loan types, re-ducing the likelihood of serious delinquency in the purchase/refinanceand fixed interest rateladjustable interest rate markets. For border zipcode loans, the only effect is in the refinance market. This is not surpris-ing, given that some state APLs had broader coverage and more restric-tions in the refinance market during the study period. The HOEPA law
268 CORNELL JOURNAL OF LAW AND PUBLIC POLICY [Vol. 21:247
adopted in 1994 and the 2002 revision did not cover home purchaseloans.90 As a result, many mini-HOEPA laws, built upon HOEPA, havelimited coverage and restrictions in the home purchase market. For ex-ample, five of the APL states-Arkansas, Colorado, Illinois, Maryland,and Michigan-did not cover home purchase mortgages in their stateAPLs.91
Lastly, in Table 10, we examine alternative specifications for theAPL state law variable. While in all of the previous model specificationsthe general ineffect variable reduced the likelihood of serious delin-quency, the components of the legal framework also turn out to be im-portant. Notably, when we include states with HOEPA copycat statuesas APL states, the protective effect of APLs virtually disappears (relativerisk ratio of 0.96). This could be due to the inclusion of states such asNevada and Florida, both states that had APLs that did not go beyondfederal law and that saw high rates of foreclosure during our period ofobservation.
Results for other state law specifications are mixed. We find thatthe requirement for lenders to verify borrower's ability to repay (repay-mentability) is associated only with a slight reduction in the likelihood ofdelinquency. In contrast, borrowers in states with laws that had abroader coverage as measured by points and fee triggers were signifi-cantly less likely to be seriously delinquent than those in states withAPLs with no coverage. Restrictions on prepayment penalties reduce thelikelihood of delinquency across the board.
In the bottom panel, we examine the effects of APLs for loansoriginated in border zip codes. While we still see an effect of the APLvariable, its strength and significance is greatly reduced. The only maindifference in the border zip code analysis is that states that banned pre-payment penalties for only a subset of mortgages (prepayment penalty =1 or 3), based on loan amount or price, saw a greater effect than stateswith both the weakest and strongest prepayment penalty restrictions.
The results of our analysis suggest that state APLs did reduce theincidence of default of loans originated during the subprime boom, buttheir effect is highly contingent on both the sample choice and the speci-fication of the APL law. At the loan level, many other factors influencedefault. While we control for factors such as house price and interestrate changes, we cannot do so for other triggers of default, such as joblosses or divorce. In that sense, we do not expect to see a large effect ofstate APLs on defaults, other than through better product origination at
90 15 U.S.C. § 1602(w)(aa)(1) (2006).91 ARK. CODE ANN. §§ 23-53-101 to 106 (2000); COLO. REv. STAT. § 5-3.5-101; 815
ILL. COMP. STAT. 137 (2004); MD. CODE ANN., §§ 12-124 to 12-127 (2005) (prior to 2008 and2009 amendments); MICH. COMP. L. §§ 445.1631-1645 (2011).

2011] THE IMPACT OF STATE ANTI-PREDATORY LENDING LAws 269
the front end and a better alignment of loan products with borrowers'ability to repay. Given our findings of strong and consistent effects ofstate APLs on the origination of loans with prepayment penalties andoption ARMs under some conditions, we believe that state APLS alsohelp to protect borrowers from originating loans that are not sustainableover the long term. Future research is necessary to further tease out thevarious elements of state APLs that have the greatest effects in terms ofconsumer protection. Expanding the sample of border state loans, forexample, or looking specifically at some case study states with similarhousing and mortgage markets could further illuminate how state APLscan be designed to best protect consumers from predatory loan terms.Also warranted are similar analyses on other datasets, including nationaldatasets such as Loan Performance, which has better coverage of thesubprime market. Nevertheless, this study provides important new evi-dence on the effectiveness of state APLs that should help policymakersas they reexamine the regulatory landscape for mortgage products.
CONCLUSION
In this study, we used a nationally representative loan level datasetto examine whether state anti-predatory lending laws reduce the likeli-hood of origination of loans with riskier loan terms and the likelihood ofserious delinquency.
In this loan-level analysis, we found strong evidence that APLs af-fected the mix of mortgage products by, inter alia, reducing the inci-dence of prepayment penalties. The conclusions for negative amortizingloans or option ARMs are more mixed because APLs do not have a sig-nificant effect on reducing the origination of loans with option ARMs forthe full sample. However, we did see a significant and positive declinein the origination of option ARMs during the subprime boom once weconsidered alternate samples or law specifications, such as loansoriginated in border states or states with broader restrictions in theirAPLs, such as repayment ability requirements. This, coupled with theeffects of preemption, led us to hypothesize that more general APLswithout specific restrictions on repayment ability requirements were notstrong enough to counteract the deterioration of underwriting standardsthat occurred during the latter half of the subprime boom, particularly inhigh-cost states such as California. Importantly, we also found thatAPLs significantly reduce the likelihood of default, especially in the sub-prime market, even after controlling for a wide range of borrower, hous-ing, and mortgage market characteristics. The results are robust enoughthat we found an effect among loans made in zip codes along state bor-ders, although there was a reduction in strength and significance of thestate APL variable in the border zip model.
270 CORNELL JOURNAL OF LAW AND PUBLIC POLICY [Vol. 21:247
Generally, the goal of anti-predatory lending laws is to ban or re-strict the origination of loans with unfair or abusive terms. By reducingthe origination of loans with exotic features, such as prepayment penal-ties, balloon payments, equity-stripping fees, interest only, and lack ofverification of borrowers' repayment capacity, the overall mortgage de-fault risk can be significantly reduced. In fact, strong APLs may have aneven broader impact on the mortgage market. Many studies havedemonstrated that the loose underwriting and the increased availability ofnontraditional non-prime mortgages was one primary reason for the run-up and subsequent collapse in house prices in the first half of the lastdecade. 92 With a strong APL in place, lenders should be less likely toadopt risky underwriting standards that would allow loan applicants toborrow more than they could afford. This would limit loan loss riskwhen house prices decline, interest rates change, or mortgage paymentsbecome unsustainable.
This study provides compelling evidence that state regulation ofsubprime mortgages can serve as an important tool in the landscape ofmortgage-market regulation and consumer protection. To the extent thatAPLs improve underwriting standards and limit riskier loan products,they also decrease the likelihood of serious delinquencies and foreclo-sures. Given the dire consequences of foreclosure on individual house-holds as well as the negative spillover effects on neighborhoods and evenregional economies, there is a strong case to be made for allowing statesto continue implementing and enforcing effective APLs without federalpreemption.
92 Adam J. Levitin & Susan M. Wachter, Explaining the Housing Bubble, 100 GEo. L. J.(forthcoming 2012) (prior version available at http://ssm.com/abstract=1669401); U.S. DEP'TOF Hous. & URBAN DEv. REPORT TO CONGRESS ON THE RooT CAUSES OF THE FORECLOSURE
CRISIS at ix (2010), available at http://www.huduser.org/Publications/PDF/Foreclosure_09.pdf("In fact, the growth in risky lending seems likely to have fueled the dramatic rise in houseprices.").
2011] THE IMPACT OF STATE ANTI-PREDATORY LENDING LAWS 271
TABLE 1: GEOGRAPHIC DISTRIBUTION OF SAMPLE
State LPS Sample LPS Full Data HMDA
Alabama 0.79 0.91 1.08Alaska 0.15 0.15 0.17Arizona 2.91 2.84 2.90Arkansas 0.46 0.54 0.60California 19.28 18.03 15.67Colorado 2.51 2.47 2.34Connecticut 1.39 1.35 1.29Delaware 0.3 0.31 0.33District of Columbia 0.32 0.27 0.21Florida 6.77 6.9 7.26Georgia 2.79 2.85 2.96Hawaii 0.42 0.47 0.38Idaho 0.61 0.59 0.52Illinois 4.14 4.58 4.61Indiana 1.52 1.53 1.95Iowa 0.69 0.82 0.75Kansas 0.73 0.79 0.74Kentucky 0.8 0.87 1.03Louisiana 0.63 0.68 1.00Maine 0.29 0.29 0.39Maryland 2.82 2.72 2.62Massachusetts 2.44 2.35 2.56Michigan 3.06 3.27 3.80Minnesota 2.4 2.48 2.03Mississippi 0.28 0.3 0.56Missouri 1.89 0.31 1.94Montana 0.27 0.31 0.24Nebraska 0.31 0.44 0.46Nevada 1.33 1.41 1.30New Hampshire 0.47 0.51 0.50New Jersey 3.39 3.56 3.14New Mexico 0.55 0.55 0.52New York 5.02 4.56 3.63North Carolina 2.28 2.33 2.56North Dakota 0.12 0.16 0.13Ohio 2.39 2.53 3.50Oklahoma 0.62 0.68 0.82Oregon 1.71 1.57 1.33Pennsylvania 3.15 3.38 3.73Rhode Island 0.37 0.35 0.45South Carolina 1.05 1.07 1.20South Dakota 0.15 0.2 0.19Tennessee 1.34 1.44 1.62Texas 5.32 5.36 5.38Utah 0.99 0.95 0.98Vermont 0.15 0.14 0.18Virginia 3.36 3.21 3.19Washington 3.56 3.16 2.66West Virginia 0.19 0.22 0.37Wisconsin 1.32 1.37 2.11Wyoming 0.15 0.17 0.13
*Percent of originations 2002-2006.
272 CORNELL JOURNAL OF LAW AND PUBLIC POLICY [Vol. 21:247
TABLE 2: VARIABLE DEFINITIONS
Variable Definition
FICOLTVSecond LienLoan Purpose
No DocumentationBroker/Wholesale OriginationPrepayment Penalty
Adjustable Rate Mortgage
House Price Change
Interest Rate Change
Rate Spread
Payment Shock
Affordability
Unemployment
Neighborhood Racial Composition
Neighborhood Income
Neighborhood Educational Level
Borrower FICO Score measured at originationBorrower LTV measured at originationDummy variable indicating that LTV = 80Dummy indicating whether loan was for purchase orrefinance (purchase=1)Loan was originated with no or limited documentationLoan was originated by a broker or wholesale channelDummy indicating whether or not the loan includes aprepayment penaltyDummy indicating whether or not the loan has anadjustable interest rateYear over year change in house prices in theobservation monthsYear over year change in the prevailing Freddie Maccontract interest rateSpread between the prevailing 30-year fixed rate andthe prevailing 1-year ARM ratePercentage increase in the monthly payment relative tothat in the previous adjustment periodCounty affordability in the observation month (a higherscore translates into greater affordability)County unemployment rate in the observation monthfrom the BLSPercent of non-whites in the zip code from 2000CensusMedian household income in the zip code from the2000 CensusPercent of college graduates in the zip code from the2000 Census
APL Coding
State APL in Effect State APL variableState APL in Effect B Alternative specification of state APL variable
(including laws with substantial protection and thosewith marginal protection)
Repaymentability Repaymentability requirement in APLsPointstrigger Extent of APL coverage, measured by difference
between state law points and fees trigger and thefederal HOEPA thresholds.
Prepaymentpenalty A complete or partial ban on prepayment penalties inAPLs.
2011] THE IMPACT OF STATE ANTI-PREDATORY LENDING LAws 273
TABLE 3: SAMPLE MEANS
Sample Means Sample MeansAll Loans Border Zips
Sample Size 1,200,735 158,486
Legal FrameworkAPL In Effect 49.7 36.72APL In Effect B 63.6 48.51Repaymentability 20.6 42.43Pointstrigger 45.1 35.45Prepayment Penalty
0 37.7 42.41 8.1 8.372 26.9 11.713 17.6 20.274 9.7 17.26
Loan TermsPurchase 32.52 35.01ARM 24.04 21.84Option ARM 8.05 6.05Prepayment Penalty Loan 13.65 10.76No Documentation 11.11 10.23Loan to Value 68.17 69.05FICO at Origination 720.37 718.39
Loan Performance90+ Days Delinquent 4.23 3.48Prepayment 32.08 32.21
Housing and Socio-economic ConditionsFHFA House Price Change (2 years prior toorigination) 19.39 19.67County Unemployment Rate 5.42 5.27Percent Minority in Zip Code 26.79 24.11Percent College in Zip Code 37.21 36.70County Housing Affordability 134.02 141.38Median House Values in Zip Code 181,891 183,709Median Household Income in Zip Code 54,074 53,566Interest Rate 5.35 5.36
274 CORNELL JOURNAL OF LAW AND PUBLIC POLICY [Vol. 21:247
TABLE 4: DIFFERENCES BETWEEN APL AND NON-APL STATES
Sample Means Sample MeansAll Loans Border Zips
Non-APL APL Non-APL APLStates States States States
Loan TermsPurchase 32.65 32.39 33.32 37.92 ***ARM 20.35 27.77 *** 19.41 26.02 ***
Option ARM(as share of ARMs) 30.78 41.50 *** 26.18 34.88 *Prepayment Penalty Loan 12.63 14.68 *** 10.74 10.79 ***No Documentation 8.19 14.05 *** 7.97 14.13 ***
Loan to Value 69.83 66.49 *** 69.96 67.48 ***
FICO at Origination 720.60 720.20 *** 719.50 716.50 ***
Loan Performance90+ Days Delinquent 4.11 4.34 *** 4.07 3.87 *Prepayment 33.84 30.30 *** 33.35 30.23 ***
Housing and Socio-economic ConditionsFHFA House Price Change (2 yearsprior to origination) 17.79 21.26 *** 17.96 23.08 ***County Unemployment Rate 5.20 5.65 *** 5.30 5.22 ***
Percent Minority in Zip Code 20.55 33.09 *** 19.58 31.92 ***Percent College in Zip Code 35.99 38.45 *** 35.14 39.38 ***County Housing Affordability 149.70 118.10 *** 157.20 114.10 ***Median House Values in Zip Code 153,499 210,647*** 155,079 233,144***Median Household Income in Zip Code 51,336 56,854*** 51,848 56,527***Interest Rate 5.3 5.4 * 5.33 5.40 ***
*** p < .0001, ** p < .001, * p < .01
2011] THE IMPACT OF STATE ANTI-PREDATORY LENDING LAws 275
TABLE 5: LOGIT MODEL PREDICTING THE EFFECT OF STATE APLs ON
MORTGAGE PRODUCT ORIGINATION
All Loans:Likelihood of Receiving a Prepayment Penalty
StandardCoefficient Error Odds Ratio
Intercept 1.0371 0.0982 ***
FICO at Origination -0.004 0.0001 *** 1.00
LTV at Origination -0.0038 0.0003 *** 1.00
Second Lien 0.1296 0.0132 *** 1.14
Purchase -0.3586 0.0117 * 0.70
No Documentation 0.5128 0.0153 *** 1.67
Broker/Wholesale Origination 0.1548 0.0157 *** 1.17
House Price Change -0.0039 0.0006 *** 1.00
Affordability -0.0025 0.0002 *** 1.00
Unemployment Rate 0.063 0.0051 ** 1.07
Median Household Income 0.0021 0.0006 *** 1.00
Percent Minority 0.0099 0.0004 *** 1.01
Percent College 0.0009 0.0007 1.00
APL in Effect -0.1403 0.0172 *** 0.87
Adjustable Rate Loans:Likelihood of Receiving an Option ARM
StandardCoefficient Error Odds Ratio
Intercept 4.8742 0.1555 *
FICO at Origination -0.0084 0.0001 *** 0.99LTV at Origination 0.006 0.0006 *** 1.01Second Lien 0.2155 0.0183 *** 1.24
Purchase -0.4839 0.0167 *** 0.62
No Documentation 1.9123 0.0268 * 6.77Broker/Wholesale Origination 1.7452 0.0255 *** 5.73House Price Change 0.0094 0.0009 *** 1.01Affordability -0.0088 0.0004 * 0.99Unemployment Rate 0.0715 0.0095 *** 1.07Median Household Income -0.0022 0.0011 * 1.00Percent Minority -0.0044 0.0006 *** 1.00
Percent College -0.0104 0.0012 * 0.99
APL in Effect 0.1173 0.0251 *** 1.12
*** p < .001, ** p < .01, * p < .1
Standard errors are clustered by zip code.
276 CORNELL JOURNAL OF LAW AND PUBLIC POLICY [Vol. 21:247
TABLE 6: ANALYSIS OF THE EFFECT OF STATE APLs ON MORTGAGE
PRODUCT ORIGINATION FOR ALTERNATIVE LAW SPECIFICATIONS
All Loans:Likelihood of Receiving Prepayment Penalty
StandardCoefficient Error Odds Ratio
APL In Effect -0.140 0.017 * 0.87APL in Effect B (includes 8 additional stateswhose restrictions do not go beyond federal law) -0.041 0.016 ** 0.96Repaymentability -0.245 0.019 *** 0.78
Pointstrigger (reference group: no pointstrigger)Trigger 2.5 points or lower 0.066 0.021 ** 1.07Trigger 3 points or higher -0.176 0.022 *** 0.84
Prepayment Penalty (reference group: no restrictions)1 -0.505 0.024 *** 0.602 -0.094 0.021 *** 0.913 -0.242 0.023 *** 0.794 -0.436 0.030 *** 0.65
Border Loans OnlyAPL In Effect -0.128 0.049 ** 0.88APL in Effect B (includes 8 additional stateswhose restrictions do not go beyond federal law) -0.198 0.041 *** 0.82Repaymentability -0.091 0.049 * 0.91
Pointstrigger (reference group: no pointstrigger)Trigger 2.5 points or lower -0.107 0.075 0.90Trigger 3 points or higher -0.110 0.058 * 0.90
Prepayment Penalty (reference group: no restrictions)1 -0.357 0.070 *** 0.702 0.080 0.058 1.083 -0.055 0.076 0.954 -0.344 0.051 *** 0.71
*** p <.001, ** p < .01, * p < .1Standard errors are clustered by zip code.Note: These models include all the predictors shown in Table 5.
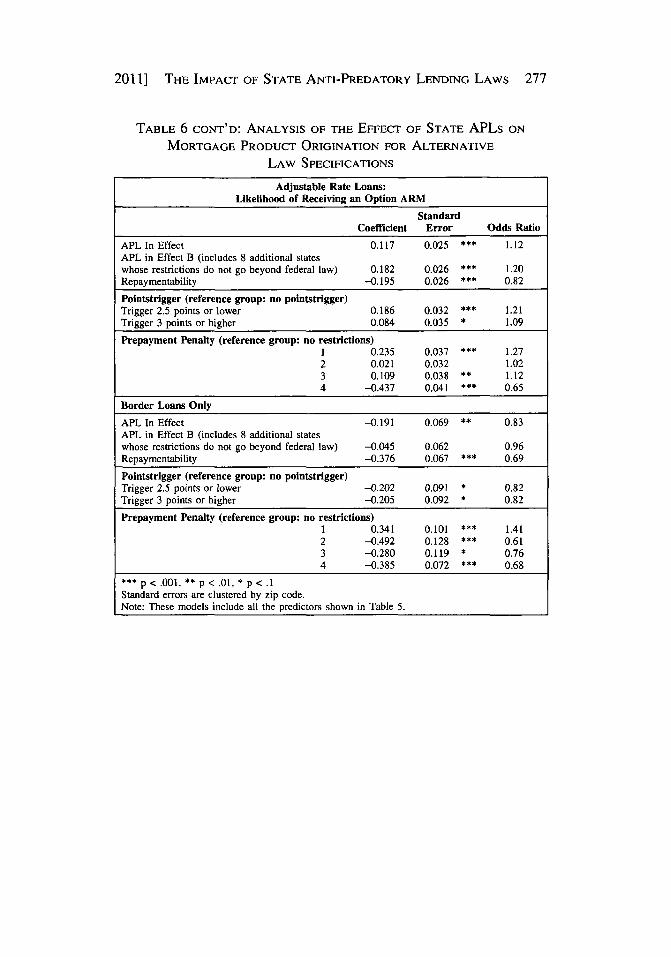
2011] THE IMPACT OF STATE ANTI-PREDATORY LENDING LAWS 277
TABLE 6 CONT'D: ANALYSIS OF THE EFFECT OF STATE APLs ON
MORTGAGE PRODUCT ORIGINATION FOR ALTERNATIVE
LAW SPECIFICATIONS
Adjustable Rate Loans:Likelihood of Receiving an Option ARM
StandardCoefficient Error Odds Ratio
APL In Effect 0.117 0.025 ** 1.12APL in Effect B (includes 8 additional stateswhose restrictions do not go beyond federal law) 0.182 0.026 *** 1.20Repaymentability -0.195 0.026 *** 0.82
Pointstrigger (reference group: no pointstrigger)Trigger 2.5 points or lower 0.186 0.032 *** 1.21Trigger 3 points or higher 0.084 0.035 * 1.09
Prepayment Penalty (reference group: no restrictions)1 0.235 0.037 *** 1.272 0.021 0.032 1.023 0.109 0.038 ** 1.124 -0.437 0.041 *** 0.65
Border Loans Only
APL In Effect -0.191 0.069 ** 0.83APL in Effect B (includes 8 additional stateswhose restrictions do not go beyond federal law) -0.045 0.062 0.96Repaymentability -0.376 0.067 * 0.69
Pointstrigger (reference group: no pointstrigger)Trigger 2.5 points or lower -0.202 0.091 * 0.82Trigger 3 points or higher -0.205 0.092 * 0.82
Prepayment Penalty (reference group: no restrictions)1 0.341 0.101 * 1.412 -0.492 0.128 *** 0.613 -0.280 0.119 * 0.764 -0.385 0.072 *** 0.68
*** p < .001, ** p < .01, * p < .1Standard errors are clustered by zip code.Note: These models include all the predictors shown in Table 5.
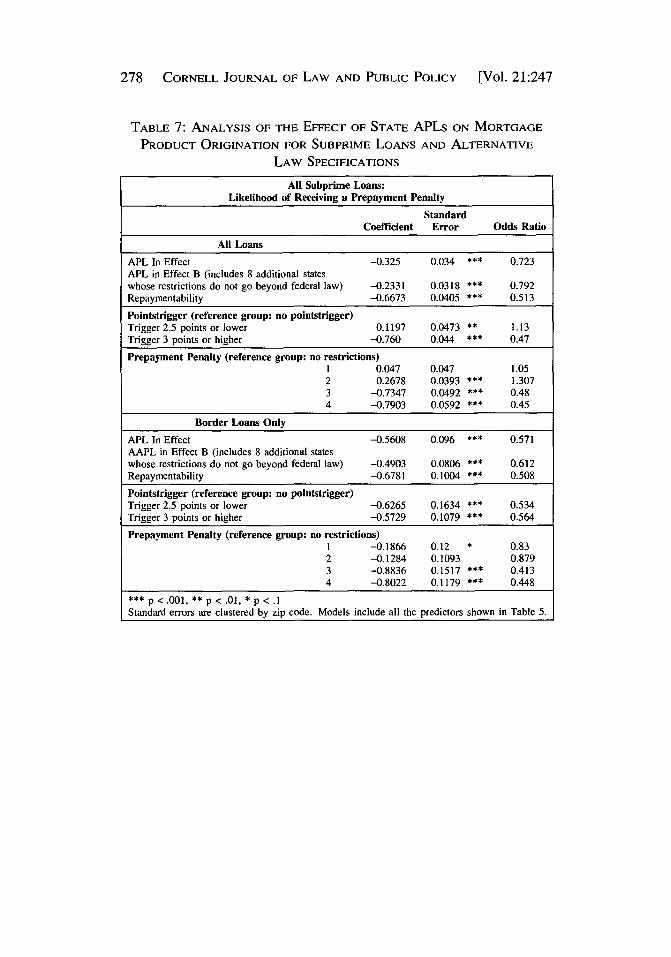
278 CORNELL JOURNAL OF LAW AND PUBLIC POLICY [Vol. 21:247
TABLE 7: ANALYSIS OF THE EFFECT OF STATE APLs ON MORTGAGE
PRODUCT ORIGINATION FOR SUBPRIME LOANS AND ALTERNATIVE
LAW SPECIFICATIONS
All Subprime Loans:Likelihood of Receiving a Prepayment Penalty
StandardCoefficient Error Odds Ratio
All Loans
APL In Effect -0.325 0.034 * 0.723APL in Effect B (includes 8 additional stateswhose restrictions do not go beyond federal law) -0.2331 0.0318 *** 0.792Repaymentability -0.6673 0.0405 * 0.513
Pointstrigger (reference group: no pointstrigger)Trigger 2.5 points or lower 0.1197 0.0473 ** 1.13Trigger 3 points or higher -0.760 0.044 *** 0.47
Prepayment Penalty (reference group: no restrictions)1 0.047 0.047 1.052 0.2678 0.0393 *** 1.3073 -0.7347 0.0492 * 0.484 -0.7903 0.0592 ** 0.45
Border Loans Only
APL In Effect -0.5608 0.096 *** 0.571AAPL in Effect B (includes 8 additional stateswhose restrictions do not go beyond federal law) -0.4903 0.0806 ** 0.612Repaymentability -0.6781 0.1004 *** 0.508
Pointstrigger (reference group: no pointstrigger)Trigger 2.5 points or lower -0.6265 0.1634 *** 0.534Trigger 3 points or higher -0.5729 0.1079 *** 0.564
Prepayment Penalty (reference group: no restrictions)1 -0.1866 0.12 * 0.832 -0.1284 0.1093 0.8793 -0.8836 0.1517 * 0.4134 -0.8022 0.1179 *** 0.448
*** p <.001, ** p < .01, * p < .1Standard errors are clustered by zip code. Models include all the predictors shown in Table 5.
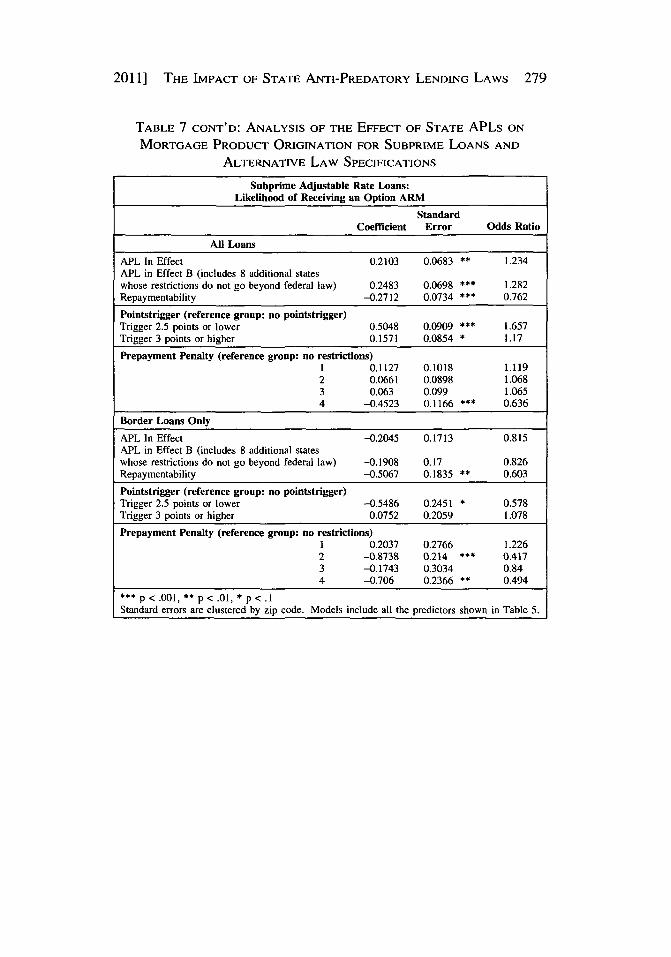
2011] THE IMPACT OF STATE ANTI-PREDATORY LENDING LAWS 279
TABLE 7 CONT'D: ANALYSIS OF THE EFFECT OF STATE APLs ON
MORTGAGE PRODUCT ORIGINATION FOR SUBPRIME LOANS AND
ALTERNATIVE LAW SPECIFICATIONS
Subprime Adjustable Rate Loans:Likelihood of Receiving an Option ARM
StandardCoefficient Error Odds Ratio
All Loans
APL In Effect 0.2103 0.0683 ** 1.234APL in Effect B (includes 8 additional stateswhose restrictions do not go beyond federal law) 0.2483 0.0698 *** 1.282Repaymentability -0.2712 0.0734 *** 0.762
Pointstrigger (reference group: no pointstrigger)Trigger 2.5 points or lower 0.5048 0.0909 *** 1.657Trigger 3 points or higher 0.1571 0.0854 * 1.17
Prepayment Penalty (reference group: no restrictions)1 0.1127 0.1018 1.1192 0.0661 0.0898 1.0683 0.063 0.099 1.0654 -0.4523 0.1166 *** 0.636
Border Loans Only
APL In Effect -0.2045 0.1713 0.815APL in Effect B (includes 8 additional stateswhose restrictions do not go beyond federal law) -0.1908 0.17 0.826Repaymentability -0.5067 0.1835 ** 0.603
Pointstrigger (reference group: no pointstrigger)Trigger 2.5 points or lower -0.5486 0.2451 * 0.578Trigger 3 points or higher 0.0752 0.2059 1.078
Prepayment Penalty (reference group: no restrictions)1 0.2037 0.2766 1.2262 -0.8738 0.214 *** 0.4173 -0.1743 0.3034 0.844 -0.706 0.2366 ** 0.494
*** p < .001, ** p < .01, * p < .1Standard errors are clustered by zip code. Models include all the predictors shown in Table 5.
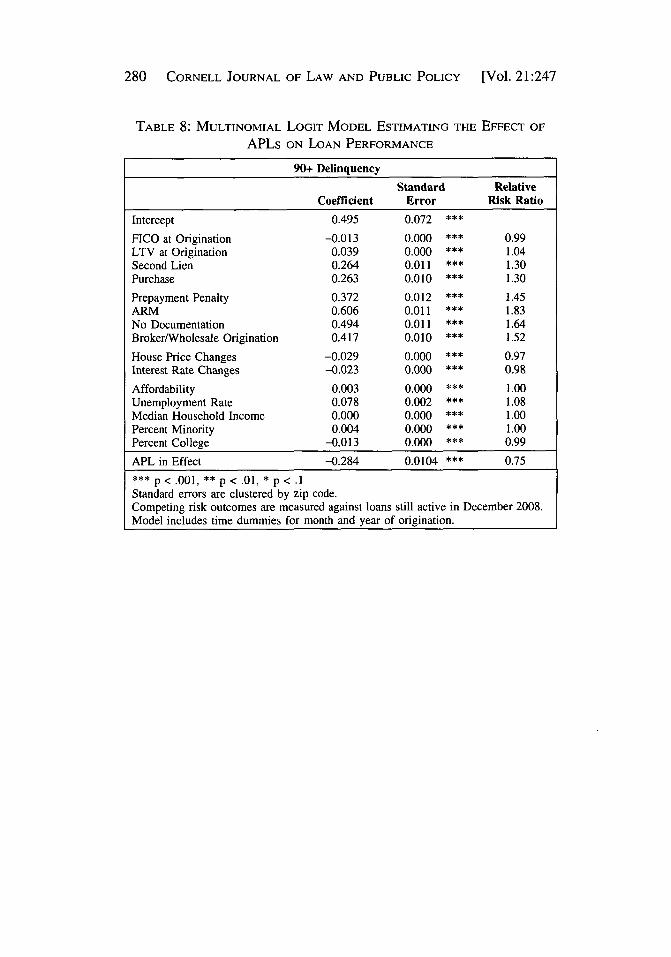
280 CORNELL JOURNAL OF LAW AND PUBLIC POLICY [Vol. 21:247
TABLE 8: MULTINOMIAL LOGIT MODEL ESTIMATING THE EFFECT OF
APLs ON LOAN PERFORMANCE
90+ Delinquency
Standard RelativeCoefficient Error Risk Ratio
Intercept 0.495 0.072 *
FICO at Origination -0.013 0.000 *** 0.99LTV at Origination 0.039 0.000 *** 1.04Second Lien 0.264 0.011 *** 1.30Purchase 0.263 0.010 *** 1.30
Prepayment Penalty 0.372 0.012 *** 1.45ARM 0.606 0.011 *** 1.83No Documentation 0.494 0.011 *** 1.64Broker/Wholesale Origination 0.417 0.010 *** 1.52
House Price Changes -0.029 0.000 *** 0.97Interest Rate Changes -0.023 0.000 *** 0.98
Affordability 0.003 0.000 *** 1.00Unemployment Rate 0.078 0.002 *** 1.08Median Household Income 0.000 0.000 *** 1.00Percent Minority 0.004 0.000 *** 1.00Percent College -0.013 0.000 *** 0.99
APL in Effect -0.284 0.0104 *** 0.75
*** p < .001, ** p < .01, * p < .1Standard errors are clustered by zip code.Competing risk outcomes are measured against loans still active in December 2008.Model includes time dummies for month and year of origination.
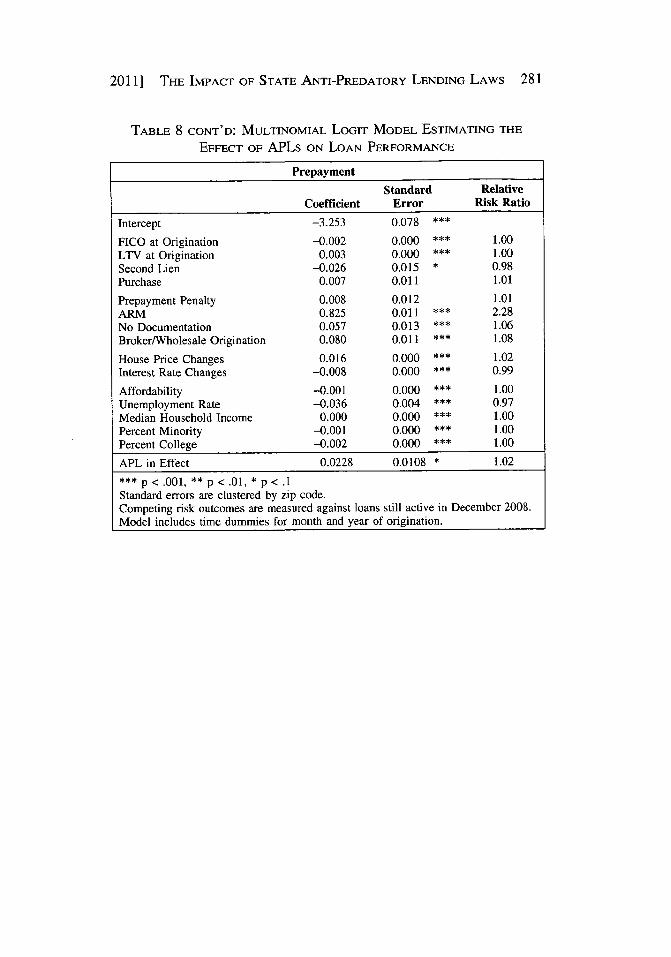
2011] THE IMPACT OF STATE ANTI-PREDATORY LENDING LAWS 281
TABLE 8 CONT'D. MULTINOMIAL LOGIT MODEL ESTIMATING THE
EFFECT OF APLs ON LOAN PERFORMANCE
Prepayment
Standard RelativeCoefficient Error Risk Ratio
Intercept -3.253 0.078 ***
FICO at Origination -0.002 0.000 * 1.00LTV at Origination 0.003 0.000 *** 1.00Second Lien -0.026 0.015 * 0.98Purchase 0.007 0.011 1.01
Prepayment Penalty 0.008 0.012 1.01ARM 0.825 0.011 * 2.28
No Documentation 0.057 0.013 * 1.06Broker/Wholesale Origination 0.080 0.011 * 1.08
House Price Changes 0.016 0.000 *** 1.02Interest Rate Changes -0.008 0.000 *** 0.99
Affordability -0.001 0.000 *** 1.00Unemployment Rate -0.036 0.004 * 0.97Median Household Income 0.000 0.000 *** 1.00Percent Minority -0.001 0.000 *** 1.00Percent College -0.002 0.000 *** 1.00
APL in Effect 0.0228 0.0108 * 1.02
*** p < .001, ** p < .01, * p < .1
Standard errors are clustered by zip code.Competing risk outcomes are measured against loans still active in December 2008.Model includes time dummies for month and year of origination.

282 CORNELL JOURNAL OF LAW AND PUBLIC POLICY [Vol. 21:247
TABLE 9: ANALYSIS OF EFFECT OF STATE APLs ON LOAN
PERFORMANCE FOR DIFFERENT LOAN SAMPLES
90+ Delinquency
Coefficient Standard Relative(ineffect = 1) Error Risk Ratio
All Loans
Subprime
Purchase Fixed -0.1216 0.0206 *** 0.886Purchase ARMRefinance Fixed -0.303 0.0236 *** 0.739Refinance ARM -0.2386 0.0215 *** 0.788
-0.2982 0.018 *** 0.742-0.2921 0.0215 *** 0.747
Border Loans Only
Subprime
Purchase Fixed -0.0894 0.0199 *** 0.914Purchase ARMRefinance Fixed 0.0526 0.0224 * 1.054Refinance ARM 0.0386 0.026 1.039
-0.0378 0.0178 * 0.963-0.0397 0.0246 * 0.961
*** p < .001, ** p < .01, * p < .1Standard errors are clustered by zip code.Competing risk outcomes are measured against loans still active in December 2008.Models include all variables in Table 8 and month/year time dummies; in addition,models predicting performance for ARM loans include payment shock and ratespread covariates.
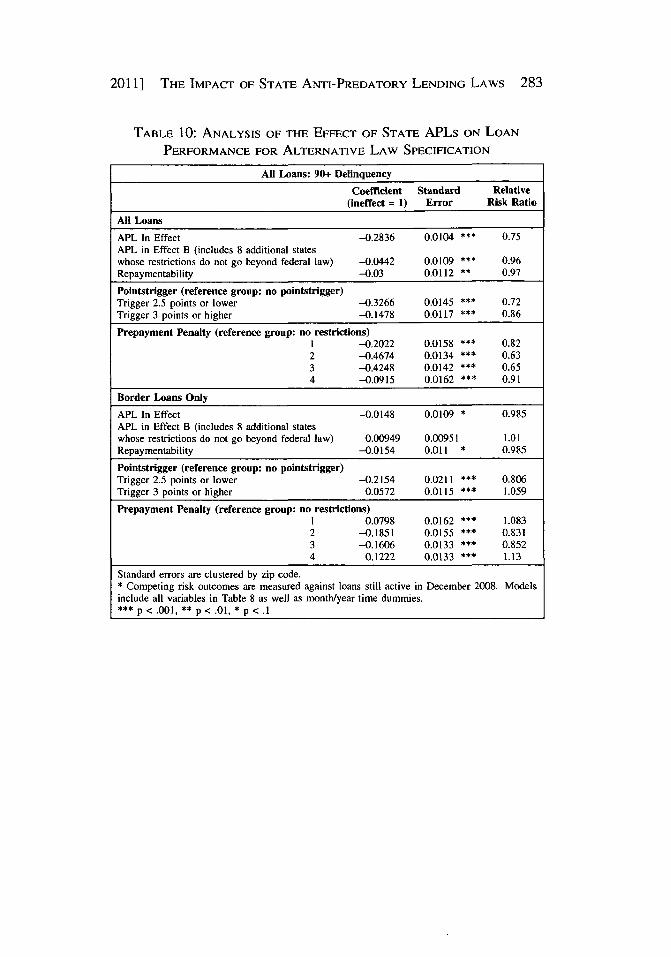
2011] THE IMPACT OF STATE ANTI-PREDATORY LENDING LAWS 283
TABLE 10: ANALYSIS OF THE EFFECT OF STATE APLs ON LOAN
PERFORMANCE FOR ALTERNATIVE LAW SPECIFICATION
All Loans: 90+ Delinquency
Coefficient Standard Relative(ineffect = 1) Error Risk Ratio
All Loans
APL In Effect -0.2836 0.0104 * 0.75APL in Effect B (includes 8 additional stateswhose restrictions do not go beyond federal law) -0.0442 0.0109 * 0.96Repaymentability -0.03 0.0112 ** 0.97
Pointstrigger (reference group: no pointstrigger)Trigger 2.5 points or lower -0.3266 0.0145 * 0.72Trigger 3 points or higher -0.1478 0.0117 * 0.86
Prepayment Penalty (reference group: no restrictions)1 -0.2022 0.0158 ** 0.822 -0.4674 0.0134 * 0.633 -0.4248 0.0142 ** 0.654 -0.0915 0.0162 * 0.91
Border Loans Only
APL In Effect -0.0148 0.0109 * 0.985APL in Effect B (includes 8 additional stateswhose restrictions do not go beyond federal law) 0.00949 0.00951 1.01Repaymentability -0.0154 0.011 * 0.985
Pointstrigger (reference group: no pointstrigger)Trigger 2.5 points or lower -0.2154 0.0211 *** 0.806Trigger 3 points or higher 0.0572 0.0115 * 1.059
Prepayment Penalty (reference group: no restrictions)1 0.0798 0.0162 *** 1.0832 -0.1851 0.0155 *** 0.8313 -0.1606 0.0133 *** 0.8524 0.1222 0.0133 *** 1.13
Standard errors are clustered by zip code.* Competing risk outcomes are measured against loans still active in December 2008. Modelsinclude all variables in Table 8 as well as month/year time dummies.*** p < .001, ** p < .01, * p < .1
284 CORNELL JOURNAL OF LAW AND PUBLIC POLICY [Vol. 21:247
APPENDIX A: STATE ANTI-PREDATORY LENDING LAW DATA CODING
To develop a state-law coding system for high-cost or predatory-mortgage laws, we reviewed existing studies.93 We also reviewed thedescription of state laws in several treatises,94 various rate matrices thatreflect mortgage originators' understanding of state laws, particularly forprepayment penalty restrictions, and then statutory language itself.
We determined that mini-HOEPA laws were adopted in 25 statesand the District of Columbia on or before December 31, 2007. In addi-tion, five states-Michigan, Minnesota, Nevada, Texas, and West Vir-ginia-passed significant subprime mortgage regulation statutes thatwere not HOEPA extension statutes and not based on rate-and-fee trig-gers. Of the mini-HOEPA laws, eight states-Utah, Pennsylvania, Ne-vada, Oklahoma, Ohio (prior to 2007 amendments), Maine (prior to 2007amendments), Kentucky, and Florida-did not extend coverage beyondmortgages covered by federal law. In several instances, the intent ofthese laws was to preempt local laws and ordinances that imposedgreater restrictions than federal law. Because there is thus a fundamentaldifference between the states that extended restrictions on subprimemortgages beyond federal requirements and states that simply copiedfederal HOEPA restrictions into their state statutes, we developed andcoded a set of law variables to describe state laws that could affect thetype of subprime mortgages made and the default and foreclosure ratesof mortgages in a given state.
The binary variable ineffect, modeled on prior studies,95 in combi-nation with the effective date variable for the same state and law, is in-tended to identify states with mortgage statutes that could plausibly havean impact on high-cost or subprime mortgage lending. A value of I wasassigned for the ineffect variable to states with any restrictions on charg-ing or financing points and fees, credit insurance, prepayment penalties,balloon payments, negative amortization, determination or documenta-tion of income or repayment ability, and significant counseling require-ments, so long as the state law covers any share of the subprimemortgage market below the HOEPA rate or fee triggers. A value of 0was assigned to the ineffect variable for the eight states with HOEPAcopycat statutes. This is a departure from some prior studies.96 Whilesome of these eight statutes imposed minor additional restrictions not
93 Bostic et al., supra note 3; Li & Ernst, supra note 38; Pennington-Cross et al., supranote 44.
94 See generally ELIZABETH RENUART ET AL., THE COST OF CREDIT (3d ed. 2005 & Supp.2008); GRANT S. NELSON & DALE A. WHITMAN, REAL ESTATE FINANCE LAW (5th ed. 2007).
95 Bostic et al., supra note 3, at 58; Pennington-Cross et al., supra note 44, at 16.96 Bostic et al., supra note 3; Li & Ernst, supra note 38; Pennington-Cross et al, supra
note 44.
2011] THE IMPACT OF STATE ANTI-PREDATORY LENDING LAWS 285
found in federal law on high-cost loans above the HOEPA triggers, it isdoubtful that a difference in regulation of a negligible slice of the mort-gage market would affect the outcome variables. Thus, based on ourdefinition, states with strong APLs prior to 2007 were Arkansas, Califor-nia, Connecticut, Georgia, Illinois, Indiana, Maryland, Massachusetts,Michigan, Minnesota, New Jersey, New Mexico, New York, North Caro-lina, Rhode Island, South Carolina, Tennessee, Texas, West Virginia,and Wisconsin, as well as the District of Columbia. In this analysis,unless otherwise noted, we classify APL states and non-APL states basedon the more stringent ineffect definition for this analysis.
In order to further measure the reach of state laws, an additionalvariable was created, pointstrigger. Most states laws that do not coverall mortgages use HOEPA-like price triggers in an attempt to cover onlysubprime or higher-cost loans. The pointstrigger variable is calculatedas the numeric difference between the federal HOEPA threshold forpoints and fees and the corresponding state law trigger. For example, theNorth Carolina APL covers loans with points and fees exceeding 5%,compared with the HOEPA trigger of 8%. The value for the pointstrig-ger variable for North Carolina is therefore 3. A state law that prohibitspoints and fees above a certain threshold is treated as having a pointstrig-ger at that price level. West Virginia, for example, prohibits points andfees in excess of 3% for most mortgages and so is assigned a pointstrig-ger value of 5. For states without a mini-HOEPA law, a value of zero isassigned to the pointstrigger variable.
Prepayment penalties were frequently included in subprime mort-gages and have been found to increase the risk of foreclosure. 97 Manystate laws limit the ability of lenders to impose prepayment penalties. 98
The prepaymentpenalty variable captures both the scope and extent ofprepayment penalty restrictions on a scale of 0 to 4. A statute banningall prepayment penalties for all, or nearly all, residential mortgages iscoded as 4. Statutes banning prepayment penalties for only a subset ofmortgages, based on loan amount or price, are coded as 3. Statutes re-stricting but not banning prepayment penalties for all, or nearly all, mort-gages are coded as 2, and statutes banning prepayment penalties onlybeyond twenty-four months and covering only a subset of mortgages arecoded as 1. Statutes without any restriction on prepayment penalties oronly restricting but not banning prepayment penalties are coded as 0 forthis analysis.
The binary repaymentability variable identifies states in which asignificant portion of the mortgage market was subject to two types ofrequirements. One requirement is that repayment ability be determined
97 See Quercia et al., supra note 46, at 333.98 See ENGEL & McCoy, supra note 7, at 16; Mansfield, supra note 2, at 556.
286 CORNELL JOURNAL OF LAW AND PUBLIC POLICY [Vol. 21:247
or verified. The other requirement is that borrowers receive counselingas a precondition to obtaining a mortgage loan. This variable necessarilyincludes some judgmental assessment of various state law provisions.State laws that either impose repayment ability standards, but only onloans above the federal HOEPA triggers, or do not regulate mortgagerepayment ability are assigned a value of 0.*99
99 See infra Table 11 for a summary of all of the described the state law variables.
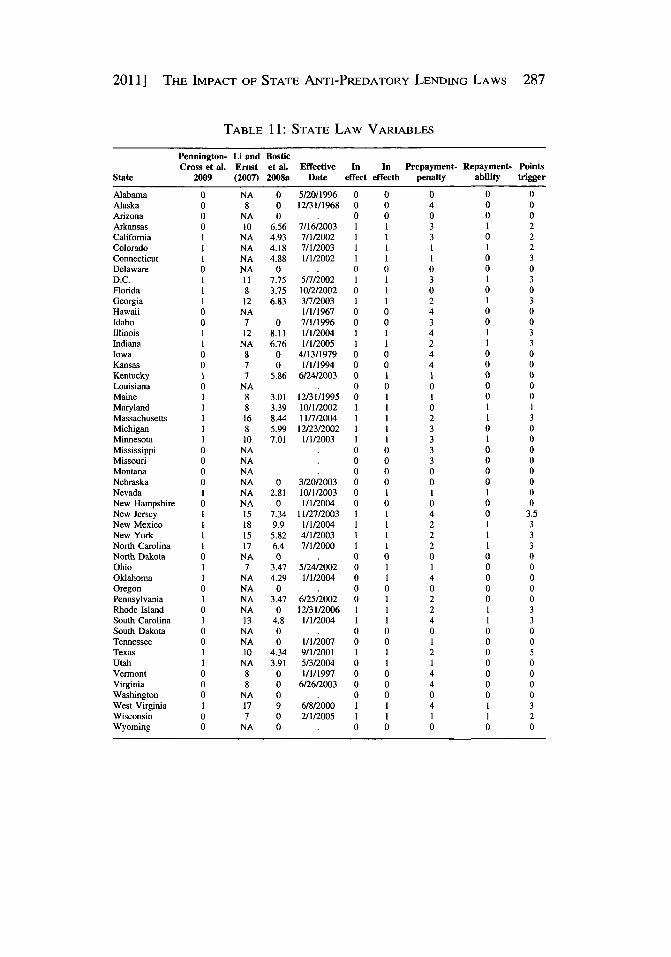
2011] THE IMPACT OF STATE ANTI-PREDATORY LENDING LAWS 287
TABLE 11: STATE LAW VARIABLES
Pennington- Li and BosticCross et al. Ernst et al. Effective In In Prepayment- Repayment- Points
State 2009 (2007) 2008a Date effect effectb penalty ability trigger
Alabama 0 NA 0 5/20/1996 0 0 0 0 0Alaska 0 8 0 12/31/1968 0 0 4 0 0Arizona 0 NA 0 . 0 0 0 0 0Arkansas 0 10 6.56 7/16/2003 1 1 3 1 2California I NA 4.93 7/1/2002 1 1 3 0 2Colorado I NA 4.18 7/1/2003 1 1 1 1 2Connecticut I NA 4.88 1/1/2002 1 1 1 0 3Delaware 0 NA 0 . 0 0 0 0 0D.C. I 11 7.75 5/7/2002 1 1 3 1 3Florida 1 8 3.75 10/2/2002 0 1 0 0 0Georgia 1 12 6.83 3/7/2003 1 1 2 1 3Hawaii 0 NA 1/l/1967 0 0 4 0 0Idaho 0 7 0 7/1/1996 0 0 3 0 0Illinois 1 12 8.11 1/l/2004 1 1 4 1 3Indiana 1 NA 6.76 1/1/2005 1 1 2 1 3Iowa 0 8 0 4/13/1979 0 0 4 0 0Kansas 0 7 0 1/1/1994 0 0 4 0 0Kentucky 1 7 5.86 6/24/2003 0 1 1 0 0Louisiana 0 NA . 0 0 0 0 0Maine 1 8 3.01 12/31/1995 0 1 1 0 0Maryland 1 8 3.39 10/1/2002 1 1 0 1 1Massachusetts 1 16 8.44 11/7/2004 1 1 2 1 3Michigan 1 8 5.99 12/23/2002 1 1 3 0 0Minnesota 1 10 7.01 1/1/2003 1 1 3 1 0Mississippi 0 NA . 0 0 3 0 0Missouri 0 NA . 0 0 3 0 0Montana 0 NA . 0 0 0 0 0Nebraska 0 NA 0 3/20/2003 0 0 0 0 0Nevada I NA 2.81 10/1/2003 0 1 1 1 0New Hampshire 0 NA 0 1/1/2004 0 0 0 0 0New Jersey I 15 7.34 11/27/2003 1 1 4 0 3.5New Mexico 1 18 9.9 1/1/2004 1 1 2 1 3New York 1 15 5.82 4/1/2003 1 1 2 1 3North Carolina 1 17 6.4 7/1/2000 1 1 2 1 3North Dakota 0 NA 0 . 0 0 0 0 0Ohio 1 7 3.47 5/24/2002 0 1 1 0 0Oklahoma 1 NA 4.29 1/1/2004 0 1 4 0 0Oregon 0 NA 0 . 0 0 0 0 0Pennsylvania I NA 3.47 6/25/2002 0 1 2 0 0Rhode Island 0 NA 0 12/31/2006 1 1 2 1 3South Carolina 1 13 4.8 l/1/2004 1 1 4 1 3South Dakota 0 NA 0 . 0 0 0 0 0Tennessee 0 NA 0 1/1/2007 0 0 1 0 0Texas 1 10 4.34 9/1/2001 1 1 2 0 5Utah I NA 3.91 5/3/2004 0 1 1 0 0Vermont 0 8 0 1/l/1997 0 0 4 0 0Virginia 0 8 0 6/26/2003 0 0 4 0 0Washington 0 NA 0 . 0 0 0 0 0West Virginia 1 17 9 6/8/2000 1 1 4 1 3Wisconsin 0 7 0 2/1/2005 1 1 1 1 2Wyoming 0 NA 0 . 0 0 0 0 0
288 CORNELL JOURNAL OF LAW AND PUBLIC POLICY [Vol. 21:247
APPENDIX B: DATA AND METHODOLOGY
A. Lender Processing Services Applied Analytics, Inc. Data
In conducting this mortgage default analysis, we rely on proprietaryloan performance information compiled by Lender Processing ServicesApplied Analytics, Inc. (LPS) and aggregated the data to the zip codelevel. 100
The LPS data is rich in detail, including over 70 variables related toloan characteristics and performance.101 Additionally, the performanceof each loan can be monitored over time. For each month in which agiven loan is in the dataset, we know its outstanding balance, the currentinterest rate, and the borrower's payment status-that is, current; thirty-,sixty-, or ninety-days delinquent; in foreclosure. We also know whethera loan ended in prepayment or foreclosure. Unfortunately, the datasetdoes not permit us to identify the lender's regulator or whether individualloans were subject to OCC or OTS preemption.
The LPS dataset is one of the few loan-level databases that provideexcellent coverage in both the conventional mortgage market and theFHA market as well as for both securitized loans and those that are heldin portfolio. For the 2004-2006 cohorts, LPS data covered roughly 40%of that of the Home Mortgage Disclosure Act (HMDA) data, while itscoverage in the conventional market varies from year to year. 102 TheLPS dataset has grown over time as new servicers have been added, witha substantial increase in coverage of the market in 2005 and in late 2008.Based on our estimation using Mortgage Bankers Association (MBA)data of active loans, the LPS covered about 50% of active mortgages inthe United States during the period from June 2006 to June 2008 (48% in2006 and 53% in 2008).1o3
Of course, one major concern with the LPS is its coverage in thesubprime market. Nationally, as of June 2006, the share of subprime
100 The dataset is sometimes still called the McDash data, although LPS acquired McDashin July 2008. Information on this dataset is available at http://www.lpsvcs.com/Products/Mort-gage/RiskManagement/MortgagePerformanceData/Pages/default.aspx.
101 Variables include zip codes for property, FICO score, debt-to-income ratio (DTI), loanamount, property value, contract-rate type (fixed or adjustable), loan purpose (purchase orrefinance), loan type (conventional, FHA, VA, or subprime), occupancy status (owner-occu-pied or not), documentation status (full documentation or not), existence of a prepayment pen-alty, loan term to maturity, origination channel (wholesale or retail), and delinquency andforeclosure status in each month.
102 See Ernst et al., supra note 70, at 10.103 The LPS dataset has grown over time as new servicers have been added, with a sub-
stantial spread in coverage of the market in 2005. As of December 2008, the coverage of LPSfurther increased to nearly 60% of active residential mortgages in the United States, represent-ing about 29 million loans with a total outstanding balance of nearly $6.5 trillion. See Christo-pher Foote et al., Reducing Foreclosures: No Easy Answers 10 (Nat'l Bureau of Econ.Research, Working Paper No. 15063, 2009), available at http://www.nber.org/papers/wl5063.
2011] THE IMPACT OF STATE ANTI-PREDATORY LENDING LAWS 289
loans among all active loans in the LPS was about 2.8%, lower than the13.4% of subprime reported by the MBA.104 But LPS only counts B&Cloans as subprime, which inevitably leads to an underestimation of thesize of the subprime market. As Lei Ding and colleagues documented,the LPS coverage in the subprime market by volume increased from 14%for the 2004 cohort to over 30% for the 2006 cohort.105 While any em-pirical approach needs to consider the changing nature of the LPS data, itshould not be a serious problem here since we focus on active loans inthe recent years, which have seen a significant expansion in the coverageof LPS.
B. Model Details
To test the effectiveness of state APLs, we measure two potentialimpacts that state APLs should have in the mortgage market. First, usinga logistic regression model, we test the assumption that state APLs pro-tect borrowers by restricting the origination of loans with riskier productfeatures. In this case, we assess the likelihood of receiving a loan with aprepayment penalty-as opposed to a loan without a prepayment pen-alty-and an adjustable rate loan with payment options-as opposed toan adjustable rate mortgage without payment options. Logistic regres-sion-also referred to as a logit model-is used when the dependent va-riable is dichotomous. We chose a logit model instead of a probitbecause of the large sample size and the ease of interpretation of thecoefficients; however, separate analysis using the probit specificationleads to qualitatively similar results.
Second, we test to see whether state APLs have an impact on mort-gage default rates. Building on previous literature on mortgage defaults,we use option theory to develop our modeling approach for this ques-tion. 106 Option theory posits that borrowers decide each month either tomake a mortgage payment, to exercise the prepayment option (e.g., sellthe home or refinance), or exercise the default option.' 0 7 These optionsare competing risks; choosing one eliminates the possibility of the otheruntil the next monthly payment is due. Loan performance is observedeach month, and we assume that prepayment and default-as opposed tothe reference group of making the mortgage payment-are distinctevents that are influenced by different underlying mechanisms. Wemodel these competing risks using the multinominal logit (MNL) frame-
104 See MORTGAGE BANKERS AsSOCIATION OF AMERICA, National Delinquency Survey,Fourth Quarter 2006, available at http://media.miamiherald.com/smedia/2007/03/13/21/mort-gageNDS.source.prodaffiliate.56.pdf.
105 Ding et al., supra note 51, at 13.106 Ambrose et al., supra note 48; Pennington-Cross & Ho, supra note 48.107 See Foster & Van Order, supra note 87, at 352-55.
290 CORNELL JOURNAL OF LAW AND PUBLIC POLICY [Vol. 21:247
work.108 The MNL regression identifies a function to predict an out-come variable with more than two nominal values (in this case,prepayment, default or on-time payment) based on a specified set of in-dependent variables. Although researchers often rely on the Cox propor-tional hazards framework to analyze prepayment and default, Clapp andhis colleagues have shown that using the MNL framework allows forestimating a flexible baseline hazard, as opposed to requiring the propor-tional hazards assumption. 10 The information for each loan is restruc-tured to include one observation for each time period in which that loanis active-from origination up to and including the period of termination.Once the data are restructured, the likelihood function is identical, indiscrete time, to the continuous-time likelihood function for the Coxmodel. Our model takes the following functional form:
N Ti 2L=fl 1 H Z0 *Pr(1', = j)
i=1 t=1 j=0
where
a +APLi,6;+X 1 yj+9(t)
Pr (y, =j) =r i 1 + y 2=e ak+APL,fk+X yk 0d
Pr(Y=O )= 11I+ 1+2=1 a+AP4'i k+Xhyk+'
Here, N refers to the number of observations, t equals the number ofmonths the loan is observed in the data, j represents the competing riskoutcomes, and APL is the state anti-predatory law dummy. Estimationof this model identifies the effect of state APLs on prepayment and de-fault, after controlling for observed borrower and housing market riskcharacteristics.
1os See Clapp et al., supra note 88, at 422-23.109 Id.