Embed Size (px)
Citation preview

The Neighborhood Impact of Subprime Lending, Predatory Lending and Foreclosure
Norman G. Miller, University of San Diego Stephanie Y. Rauterkus, University of Alabama at Birmingham1
Michael A. Sklarz, New City Corporation
Abstract
The neighborhood impact of subprime lending, predatory lending and foreclosure has been estimated at two to ten percent of home value. Further, as some neighborhoods see a concentration of foreclosures, the number of distressed properties in close proximity to a given property also has an impact on home value. Empirical evidence suggests that home values decline by one percent on average for each nearby distressed home. Extrapolated across the national housing stock, this translates into a 1 to 10% (or $5,000 average) spillover effect. We discuss current research in this area and identify gaps in the literature in the wake of the subprime mortgage crisis.
1 Corresponding author, [email protected], (205) 934‐8857.

2
Introduction Many of the recent troubles in the housing market stem from risky behavior on the part of
lenders. The primary research question in this study is ‘what do we know about the impact of
subprime lenders, predatory lending and foreclosure on neighborhoods?’ This leads to the
questions regarding what we can find out about tipping and turning points in foreclosures. This
paper synthesizes existing studies and identifies the current gaps in the literature. The intent is to
stimulate research that will fill the most relevant gaps in order to facilitate appropriate
intervention necessary to stop a freefall in prices that generates excessive collateral damage.
We summarize current research in subprime and predatory lending as it leads to
foreclosure and the resulting effect on neighborhoods with respect to property values. While we
find that predatory lending and subprime lending appear to be intertwined, little evidence exists
regarding effective measures to curb predatory lending or the specific elements of subprime
mortgages that tend to lead to negative outcomes. Those negative outcomes -- default,
foreclosure, real estate owned (REO) sales and a decline in neighborhood house prices -- have
been modeled and documented in various forms in the existing literature. What we know so far
about the contagion price effects of foreclosure is summarized in Table 1. Also, Figure 5 from
Harding, Rosenblatt and Yao (forthcoming) is reproduced below to provide a graphical
representation of what we now know about the neighborhood impact of foreclosure. Current
research provides evidence that foreclosures decrease neighborhood property values by as much
as 10% overall and nearly 1% per foreclosed property. Additional questions remain regarding
the impact of very large numbers of foreclosures on home values. Based on average home
prices, nearby foreclosures reduce the value of each neighboring home by $5,000 on average. In

3
addition, inner cities and areas where new construction is prevalent appear to be the hardest hit
by foreclosure and the related contagion effects. While there is considerable evidence of this
contagion effect, there is little evidence of foreclosure cascading -- where the number of
foreclosures in a given neighborhood reaches a ‘tipping point’ and the foreclosure rate begins to
increase rapidly. Anecdotal evidence suggests that when foreclosures in a given neighborhood
reach this ‘tipping point’ the entire neighborhood can experience hardship due to a lack of
residents to generate fees and taxes needed to support basic services.
Table 1: Summary of Recent Findings This table summarizes what we currently know about subprime lending, foreclosure rates and the contagion effect of foreclosures on neighborhood home values.
Study Neighborhood Impact Findings
Immergluck and Smith (2006)
Each conventional foreclosure within an eighth of a mile of a single-family home results in a decline of 0.9 percent in value.
Pennington-Cross (2006)
Foreclosed property appreciates less than the area average appreciation rate.
Center for Responsible Lending (2008)
40.6 million neighboring homes will experience devaluation because of subprime foreclosures that take place nearby -- estimated at a value of $202 billion or $5,000 on average.
Dubin (2008) Foreclosures adversely affect local housing prices by as much as 5.7%.
Harding, Rosenblatt and Yao (2008)
Nearby distressed properties have significant negative contagion effects over and above the overall trend in house prices of approximately 1% to 1.5% per foreclosure.
ICIC (2008) There are 9.2 REOs per square mile in the inner city (0.63%) compared with 0.2 REOs per square mile (0.31%) in the rest of the United States.
Leonard and Murdoch (2008)
The direct effect of an increase in foreclosures is between $1,320 and $2,020, and the spatial reach of this impact is 250 feet.

4
Mayer and Pence (2008)
Subprime lending in 2005 was concentrated in Nevada, Arizona, California and Florida in the inner cities and the outskirts of metropolitan areas.
Rogers and Winter (2008)
The negative foreclosure effect on housing prices is as much as 5.3% when the foreclosed property is within 100 yards.
Lin, Rosenblatt and Yao (2008)
The spillover effect of foreclosure results in as much as a 9.7% discount in home prices when the foreclosed property is within 100 yards.
Calomiris, Longhofer and Miles (2008)
The national average price decline for houses from second quarter 2007 to fourth quarter 2009 will be approximately 5.5 percent. Further, the future path of housing prices will be flat for the next two years.
Note: Each line in Figure 5 shows how the estimated contagion discount varies with the number of nearby foreclosed properties within each of the specified rings around the subject property. The lines for Rings 1 and 2 are truncated to avoid extrapolating the effect beyond the range of the data used to estimate the models. Ring 1 includes all foreclosures less than 300 feet from the subject property. Ring 2 includes foreclosures that are 300 to 500 feet from the subject. Ring 3 includes foreclosures that are between 500 and 1000 feet from the subject, while Ring 4 includes foreclosures that are between 200 and 1,000 feet from the property.

5
Much additional work is needed in this area. Specifically, we need answers to the
following questions. Why are there large regional differences in mortgage performance? Does
state and local regulatory behavior affect loan behavior? How are age-income-ethnic
characteristics related to ownership, loan issuance and performance? What role did incentives,
moral hazard and adverse selection play in lending behavior? Related to this question, policy-
makers have also asked to what extent foreclosures are the result of a “push me” phenomenon
where borrowers are pushed up into more expensive homes or a “pull me” phenomenon where
brokers are pulled to write more (and larger) loans. How extensive are risk externalities
generated by the housing market? That is, what is the impact of risky behavior in housing
markets on the broader financial markets? How do we stabilize the housing markets and what
roles should state, local and federal entities play in this effort?
Discussion Research related to the current foreclosure situation in U.S. housing markets began in
earnest several years ago when researchers such as Case and Shiller (2003) questioned whether
or not the housing market was experiencing a bubble and the likelihood that such a bubble would
burst.
Shortly thereafter, as the subprime lending market grew in response to this perceived
bubble, researchers such as Schloemer et al (2006), Mallach (2007) and Gerardi et al (2007)
studied the effect of these loans on consumers. Discussions of subprime lending often question
whether these loans are simply those made to borrowers of lower credit quality or if predatory
lenders are extracting rents in excess of those warranted by the riskiness of the loans. Hill and
Kozup (2007) and Wyly et al (2008) consider these questions. In the wake of the subprime
crisis, renewed attention has been given to the policy implications of subprime and predatory

6
lending as well as default. What legislation is currently in place, what is needed and how
effective are these rules and legislation? These are questions posed by Pyle (2003) and Bostic et
al (2007).
As the housing bubble began to burst, borrower default and lender foreclosure became
prevalent in the U.S. housing market. The volume of this activity has renewed old debates on
how to model mortgage default as in Alexander et al (2002) and prompted new questions about
the cost of foreclosure as in Pennington-Cross (2006) and Deng and Gabriel (2006).
These queries lead to the primary concern of this study: the neighborhood impact of
foreclosure. Six sets of researchers approach this issue, each in a different way. Immergluck
and Smith (2006) conduct an empirical analysis of the impact of foreclosures on nearby property
values in Chicago in 1999. Lin, Rosenblatt and Yao (2008) develop a model for pricing this
spillover effect on neighborhood property values and test it on homes in Chicago in 2006.
Rogers and Winter (2008) also analyze the ‘foreclosure effect’ but allow for a dynamic effect –
changing over time and space using data from St. Louis County from 1998 to 2005. Harding,
Rosenblatt and Yao (2008) use a repeat sales model to estimate the foreclosure effect on
neighborhoods. Dubin (2008) estimates the effect of foreclosures on housing prices and,
conversely, the effect of changes in housing prices on foreclosures using a sample of data from
Cuyahoga County, Ohio from 2003 to 2007. Finally, Leonard and Murdoch (2008) model
foreclosure as a proxy for changes in neighborhood quality and then estimate the impact of this
change on home sale prices using a sample of 2006 data from Dallas County, Texas.
Housing Bubble Case and Shiller (2003) ask “Is the housing market experiencing a bubble and if so, is it
likely to burst or deflate?” To answer the question, they define the term ‘bubble’ and argue that

7
while it is popularly referred to as an irrational run-up in home prices with a potential for a crash,
they argue that it needs to be defined in terms of people’s expectations about future price
increases. Further, they argue that a fundamental analysis of current macroeconomic data is
necessary to fully understand the root cause of housing market price increases. The goal of this
analysis should be to assess the stability of the relationship between fundamentals and home
prices over time and space2. They present the results of a 2003 survey of 2002 homebuyers in
Los Angeles, San Francisco, Boston and Milwaukee as well as an analysis of quarterly, state-
level home prices and economic data from 1985 to 2002. Based on the survey results, they find a
strong investment motive, high expectations of future price increases and the strong influence of
word-of-mouth discussion in some cities – all indicative of a speculative bubble. This result is
more prevalent in the ‘glamour’ cities that they studied3. However, they also provide evidence
that home price increases from 1995 to 2003 are driven by fundamentals – particularly income
growth – and that the fundamental measures of bubble activity are down since 19884. Case and
Shiller (2003) conclude that despite people’s expectations of high future prices – indicative of a
bubble the observed rise in housing prices can be explained by historical trends in fundamentals.
Therefore, they argue that a nationwide drop – or deflation of the housing bubble – in real
housing prices is unlikely.
Loutskina and Strahan (2008) analyze lenders who concentrate in a few markets versus
diversified lenders who do not and liken them to informed and uninformed investors. First they
test how mortgage retention and acceptance rates vary with lender diversification. They find that 2 The fundamentals they include in their study are personal income per capita, population, non‐farm payroll employment, the unemployment rate, housing starts and mortgage interest rates. 3 Case and Shiller (2003) define glamour cities as those that are home to international celebrities, the entertainment industry, world‐class universities or high‐technology industries. The prices of homes in these metropolitan areas are high as well as volatile. 4 To test the relation between home prices and fundamentals, Case and Shiller (2003) perform regression analysis to estimate the degree to which changes in home prices can be explained by fundamental variables.

8
concentrated lenders accept and retain a higher proportion of mortgages than diversified lenders.
Second, they compare stock performance and find that concentrated lenders have weathered the
2008 financial crisis better than diversified lenders with respect to stock price. Third, they test
the housing price forecasting power of lender retention rates. They find that concentrated
lenders retain a smaller portion of their loan portfolio when real estate prices are expected to fall,
while diversified lenders loan retention rates are not correlated with expected housing prices.
Finally, the authors conclude that these informed, concentrated lenders provide value to the
markets through information production and the negative correlation between the share of
informed lending to the housing price run-up helps to explain the 2001-08 real estate bubble and
crash.
Subprime Lending What Case and Shiller (2003) failed to consider in their assessment of the likelihood of a
deflation in housing prices was the prevalence of subprime lending and its impact on the housing
market. Using state-level data from the Federal Reserve Bank of New York, we analyzed
outstanding subprime loans as of August 2008 versus outstanding Alt-A loans and found that
subprime borrowers are charged nearly 2% higher interest rates5. As shown in Table 2, we found
evidence that in the subprime market, loans were priced higher based on the riskiness of the
borrowers but little evidence of this risk-based pricing in the Alt-A market. In the subprime
market, the mean interest rate is 8.49 percent and the average FICO score is 6166. In the Alt-A
market, the mean interest rate is 6.68 percent, and the average FICO score is 704. The difference
in both sets of mean values is statistically significant. Moreover, the correlation coefficient
5 Alt‐A loans are defined as “near‐prime”. 6 FICO score is a credit bureau risk score where the higher the score, the lower the believe likelihood of a delinquency or default.

9
between interest rate and FICO in the subprime market is indicative of risk-based pricing, while
this practice is not evident in the Alt-A market.
Table 2: Evidence of Risk-Based Pricing in Subprime Markets
This table presents the mean interest rates and FICO scores on subprime and Alt-A loans as of August 2008 according to state-level data provided by the Federal Reserve Bank of New York. The correlation between average statewide interest rates and FICO scores is also given.
Market Mean Interest Rate Mean FICO Score Correlation Coefficient
Subprime 8.49% 616 -0.7875
Alt-A 6.68% 704 -0.3369
Difference 1.81%*** -88***
Further, we find evidence that affordability-stretching encouraged risky behaviors. Table
3 provides a comparison of subprime and Alt-A loans based on their foreclosure rates and
specific loan characteristics. With the exception of interest-only loans, subprime borrowers tend
to exhibit more risky behavior than Alt-A borrowers as shown by the percentage of ARMs and
high LTV loans. Similar to the risk-based pricing evidenced in the higher interest rates charged
to subprime borrowers, lenders are also more likely to include a prepayment penalty clause in
subprime loans.

10
Table 3: Comparison of Subprime and Alt-A Loans
This table presents the mean values for various characteristics of subprime and Alt-A loans as of August 2008 according to state-level data provided by the Federal Reserve Bank of New York. All differences in means are statistically significant at the 1% level.
Market Foreclosure Rate
% of Interest Only Loans
% of ARM Loans
% of Loans with
Prepayment Penalty at
Origination
% of Loans with a High LTV Ratio7
Subprime 9.3% 8.3% 60.2% 60.4% 32.5%
Alt-A 3.3% 20.0% 36.2% 20.4% 24.7%
Difference 6.0%*** -11.7%*** 24.0%*** 40.0%*** 7.8%***
Lax et al (2004) explain who gets subprime loans. Based on surveys of over 4,000
borrowers originating mortgages from January 1996 to June 1997, they find evidence that these
borrowers are disproportionately minority and lower income, older, less well-educated, less
financially sophisticated and less likely to search for the best interest rate when applying for a
mortgage.
Similar to the Lax et al (2004) examination of subprime borrower characteristics,
Chomsisengphet and Pennington-Cross (2006) examine subprime loan characteristics.
Specifically, they ask “What makes a loan subprime?” The authors provide the simple
explanation that the existence of a premium above the prevailing prime market rate makes a loan
subprime8.
7 The Federal Reserve defines high LTV loans as those loans whose initial LTV is higher than the median LTV. 8 Later studies classify loans as subprime if they are originated by a subprime lender. The Department of Housing and Urban Development maintains a list of subprime lenders.

11
Schloemer et al (2006) examine the trends in foreclosure and how homeowners have
fared in the subprime mortgage market. Specifically, they predict subprime foreclosure rates in
all major metropolitan areas of the United States and examine factors associated with subprime
foreclosures. They analyze a proprietary, loan-level database of over six million securitized
subprime loans totaling $1.2 trillion, originated from January 1998 through December 2004.
They find that 1) as many as one in eight loans (12.5%) in their sample ended in foreclosure
within five years; 2) after adding the delinquent loans that were refinanced, the ‘failure rate’
approaches 25% within five years of origination; 3) distressed prepayments are substitutes for
foreclosure9; 4) using a modified life table, they project that 15.4% of the loans in the sample
will foreclose and that the annual predicted foreclosure rate increases throughout the sample
period; and 5) one-third (33%) of families who received a subprime loan in 2005 and 2006 will
lose their homes10. The factors that they argue contribute to subprime foreclosures are loan risk,
loose underwriting, predatory lending, third-party originators and inadequate oversight11.
Mallach (2007) digs deeper into the effects of the subprime industry and its impact on
consumers. The paper seeks to uncover the underlying issues related to how the workings of the
subprime sector of the lending industry affect the public good or public welfare and how this
sector should be perceived and treated by public policy. Mallach (2007) reports the effect of
subprime mortgage lending on borrowers in two ways: 1) in terms of homeownership rates and
the extent to which the sector leads to either increases or decreases in homeownership; and 2) in
terms of the effect of subprime mortgages on the experience of homeowners and the extent to 9 This conclusion was drawn based on the results of a model that regresses the average housing price appreciation in an MSA on the odds of a given outcome. 10 This finding assumes: 1) 60% of borrowers who refinance a subprime loan will receive another subprime loan; 2) the rate of foreclosure will continue at the 2005‐06 rate of 19.4%; and 3) these probabilities are constant for borrowers across multiple loans. 11 Schloemer et al (2006) cites loan features such as adjustable interest rates, balloon payments, prepayment penalties and low documentation requirements as those contributing to the riskiness of subprime loans.

12
which it either does or does not impair their ability to share in the benefits of homeownership12.
Citing Schloemer et al (2006), Mallach (2007) finds that due to the associated high rate of
foreclosure, the subprime mortgage sector results in an actual decline in the number of
homeowners overall with that decline likely disproportionately concentrated among African-
American and Latino borrowers in lower-income neighborhoods. Mallach (2007) argues that the
common features of subprime loans have the potential to negatively affect the homeownership
experience in ways that affect the extent to which the borrower is likely to experience the
benefits of homeownership13. Thus, the risk of foreclosures is greater with subprime loans as
compared with traditional loans. Mallach (2007) concludes that the existence of the subprime
lending industry has resulted in a net loss of public welfare as evidenced by a net decrease in
homeownership and foreclosure fears associated with the riskiness of common features
embedded in subprime loans.
Gerardi, Shapiro and Willen (2007) also consider the net effect of the subprime lending
industry, but focus strictly on the state of Massachusetts. They ask: “What are the outcomes of
ownership experiences in Massachusetts that started with a subprime mortgage, and what was
their role in the Massachusetts foreclosure crisis of 2007?” Here, the authors differentiate
between subprime loans that result from borrowers refinancing loans initially made to purchase
their homes through prime lenders and home purchases initially financed with subprime loans.
This exercise allows the authors to focus their analysis on the subset of subprime borrowers that
12 Mallach (2007) identifies both social and economic benefits to homeownership that can either accrue to the individual homeowner or the community. See Mallach (2007) for a list of these benefits. 13 Schloemer et al (2006) also described the common features of subprime loans as contributing to the riskiness of the loans.

13
some argue are not prepared for the responsibility of homeownership14. Using a dataset of deeds
records from January 1987 through August 2007 for the entire state of Massachusetts and 2006-
07 Massachusetts assessor data, they find that approximately 30% of the 2006 and 2007
foreclosures in Massachusetts can be traced to homeowners who used a subprime mortgage to
purchase their house. The authors also find that house price appreciation is the main driver of
foreclosures. They estimate that the probability of default (for either a subprime or prime
borrower) increases significantly in periods with low or negative house price appreciation.
Mayer and Pence (2008) examine the data sources available to examine subprime
mortgages and also describe nationwide subprime lending patterns in 200515. They found the
highest concentration of subprime lending activity in Nevada, Arizona, California and Florida,
where the subprime lending rates were two to three times the national average in metropolitan
areas of 3.6 subprime loans per 100 housing units. Further analysis of these subprime
origination trends reveals that they are only partially correlated with house price appreciation.
Also, Mayer and Pence (2008) find a higher concentration of subprime lending in inner cities and
the outskirts of metropolitan areas16. Lastly, they find that economically depressed areas in the
Midwest do not appear to have high rates of subprime originations – despite their weak housing
markets.
Anderson, Capozza and Van Order (2008) examine the root causes of the negative
outcomes related to subprime lending. They focus on changes in underwriting standards. They
examine two time periods – the 1990s and post-2004 – and document specific changes in
14 The results of the study appear to support this argument as these borrowers experience foreclosure more than six times as often as borrowers who initially finance their home through a prime lender. 15 Perry (2007) also reviews data sources for subprime lending research. 16 This finding is similar to that of an ICIC (2008) study discussed later, which finds a high concentration of REOs in inner cities.

14
underwriting standards such as lowering of required loan-to-value ratios. Using Mortgage
Bankers Association data, the authors estimate a fixed-effects model that considers the impact of
both economic factors and underwriting changes on foreclosure rates. They find that both the
unfavorable economic conditions and a loosening of underwriting standards has led to an
increase in foreclosure.
Predatory Lending Predatory lending is commonly identified as a harmful lending practice and researchers
and lawmakers continue to argue for and against methods to eliminate it. Pyle (2003), for
example, considers legislative measures and questions the efficacy of the revised Regulation Z
“flipping” prohibition. The type of “flipping” that this legislation seeks to eradicate is the early
or frequent refinancing of a loan to extract greater points and fees from a borrower. Pyle argues
that the intended gains to social welfare from subprime lending will only be realized if the
subprime mortgage market is “actively policed,” which history indicates is unlikely.
Schloemer et al (2006) identify predatory lending as a factor contributing to the riskiness
of subprime loans. While investigating these practices is outside the scope of the Schloemer et al
(2006) study, Hill and Kozup (2007) focus on exactly that issue. Their primary research
question is: “What are the consumer experiences of predatory lenders – particularly in the
exchange process?” Based on a series of telephone interviews with subjects identified from
complaints filed in federal and state courts, the researchers present a thematic interpretation of
their survey data. They identify common themes present in the collective experiences of
consumers in four large cities. The authors dub these themes: ‘The Friendly Veneer,’ which
occurs at the beginning of the relationship; ‘The Rules of Engagement,’ which details the three
key rules that the borrower must follow to continue to experience ‘The Friendly Veneer,’ and

15
‘An Aggressive Response,’ which happens later in the relationship – particularly if it has soured.
Several of the subcategories within these themes support the argument by Schloemer et al (2006)
and Mallach (2007) that the predatory lending practices of subprime lenders contribute to the
riskiness of subprime loans relative to prime loans17.
Bostic et al ( 2007) study specific legislation to determine the effect of legal enforcement
mechanisms and law design on the subprime home loan market. The authors use an updated
version of the Ho and Pennington-Cross (2006) legal index. They estimate a model where the
lending outcome is explained by variables that indicate whether the state in which the loan was
originated has an anti-predatory lending law, whether the loan was originated in a border county,
borrower characteristics, location characteristics, and regulation by the U.S. Office of the
Comptroller of the Currency. They find – consistent with Pyle’s arguments outlined earlier—
evidence that the presence of state-level laws that regulate subprime lending appear to have little
impact on subprime originations, applications or rejections.
Wyly et al (2008) take a different approach to predatory lending after observing that
evidence linking the existence of the subprime mortgage market to predatory lending is often
dismissed as anecdotal or isolated to a few unique locations. They consider how the
justifications for deregulated risk-based pricing in the mortgage market differ by geographic
region. Their argument is that if subprime lending is the optimal solution to the problems of
credit rationing and exclusion, there should be lower denial rates in places with higher subprime
activity. Hence, if subprime lending truly makes credit more accessible, subprime lending
activity should lead to lower denial rates. To test this proposition, Wyly et al (2008) use HMDA
17 ‘Lack of full disclosure,’ ‘don’t ask questions,’ ‘borrow more over time,’ ‘changing the loan package,’ ‘blaming the victim’ and ‘continuous assault’ are examples of specific categories of experiences that, in the context of Schloemer et al (2006), arguably increase borrower fear associated with the likelihood of foreclosure.

16
data to estimate a model that attempts to explain denial rates (and separately, subprime market
share) in metropolitan areas while controlling for economic and demographic variations across
housing markets. Their results indicate that it is possible to account for 80% of denial rates
across metropolitan areas (based on R-squared). However, rate-spread is the single most
important factor explaining variations in metropolitan mortgage rejection rates18. The authors
find no evidence that subprime credit helps to reduce the traditional problems of credit rationing
and exclusion. Further, they find that subprime lending actually exacerbates these issues, and
appears to persist in metropolitan areas throughout the nation.
Default/Foreclosure ‘Bubbles’ in the housing market increase homebuyers’ willingness to purchase more
expensive homes. The subprime lending sector provides loans to the portion of those borrowers
who cannot qualify for a prime loan. Predatory lending practices are a common feature of these
subprime loans. This string of events often leads to default. Because this default is often
unobservable to researchers, studies frequently use foreclosure as a proxy for this negative
borrowing outcome. Other aspects of the methodology used in default studies vary widely.
Alexander et al (2002), for example, identify third-party originators as the root cause of the
disproportionate underperformance of subprime loans as compared to prime loans. They model
mortgage default as a principal-agent problem where lenders are the principals and third-party
originators (TPOs) are the agents. They use a sample of 23,200 mortgage loans issued by a
single, national subprime mortgage lender originated between January 1, 1996 and December 31,
1998. After estimating a hazard model with jointly estimated competing risks and unobserved
18 ‘Rate‐spread’ loans are loans where the annual percentage rate is more than three percentage points higher than the reported yield on Treasury securities of comparable maturity for first‐lien obligations and 5% for subordinate liens.

17
heterogeneity, they find that TPO loans have a higher default probability and that this increased
riskiness explains a 50 basis point rate difference between TPO loans and non-TPO loans.
Pennington-Cross (2006) examines expected price appreciation to determine if unique
pairs of transactions (normal property, foreclosed property) appreciate in a systematically
different way than a typical pair of repeat transactions. Using a sample of over 12,000 lender-
owned property (REOs) sales in metropolitan areas, Pennington-Cross (2006) finds that
foreclosed property appreciates less than the area average appreciation rate. Further, the author
finds that the deviation between foreclosed HPA rates and non-foreclosed HPA rates is sensitive
to loan characteristics, legal restrictions, housing market conditions and marketing time.
Deng and Gabriel (2006) find good news on default rates when compared to prepayment
rates. The authors apply an options-based model to simultaneously estimate default and
prepayment. That is, they model default as a borrower’s decision to exercise a put option on the
property and prepayment as a borrower’s decision to exercise a call option. Thus, the mortgage
instrument contains these embedded options and their values fluctuate with the value of the
property relative to the mortgage balance. They estimate the model using data provided by HUD
on FHA loans originated between 1992 and 1996. They find that both call and put options are
more likely to be exercised when the option values are greatest. That is, default is most likely
when there is a high probability of negative equity. Prepayment, often due to refinancing, is most
likely when there is a high probability of positive equity. Further, they find that borrowers
exercising the put (default) option tend to have similar characteristics such as lower credit scores.
These higher default probabilities, however, are more than offset by their lower prepayment
probabilities. The pricing implications of this simultaneous estimation of default and

18
prepayment risk are that financing costs could be lowered for these borrowers thus, increasing
homeownership opportunities for underrepresented groups.
Dubin (2008) uses a system of two simultaneous equations to model house prices and
foreclosures in an attempt to determine what factors impact home prices and the probability of
foreclosure. The first equation is a hedonic pricing equation, and the second equation estimates
the probability that the home will go into foreclosure. The first equation states that the sales
price of a home is a function of the structural characteristics of the home, the fixed effects for the
year and the neighborhood in which the home is located and the inverse distance-weighted sum
of foreclosures surrounding the house. The second equation states that the probability that a
home will go into foreclosure is a function of the LTV, whether or not the mortgage was made
by a subprime lender, the age of the mortgage, the size of the mortgage pool, the neighborhood
characteristics and the change in house prices since the purchase date. Dubin estimates the
model using a data set consisting of all housing transactions between the first quarter of 2003 and
the third quarter of 2007 in Cuyahoga County, Ohio. Dubin obtains dramatically different results
dependent upon the estimation method used. However, Dubin concludes that regardless of the
estimation method, foreclosures adversely affect local housing prices by as much as 5.7% and
changes in housing prices affect the foreclosure rate.
Neighborhood Effects An understanding of foreclosure as a proxy for default and the various ways in which
foreclosure is modeled in the literature leads to a discussion of the impact of these events on
neighborhoods. Rich datasets that provide detailed information on properties in a specific
geographic region provide researchers with the opportunity to study foreclosure in the context of
neighborhood effects.

19
Immergluck and Smith (2006) study the impact of foreclosures on nearby property
values. The authors estimate a regression model that uses a vector of property characteristics, a
vector of neighborhood characteristics and six foreclosure variables to explain changes in
housing prices19. They use data on over 9,600 properties sold in Chicago, Ill., in 1999. They
find that each conventional foreclosure within an eighth of a mile of a single-family home results
in a decline of 0.9 percent in value.
Leonard and Murdoch (2008) study the impact of neighborhood quality (whose change is
proxied by the rate of foreclosure) on home sale prices. The authors first put forth a model in
which homeowners seek to maximize their utility subject to annual appreciation. Both the
homeowners’ utility and the rate of appreciation are modeled as a function of neighborhood
quality. Utility is also dependent upon housing attributes, and appreciation is also dependent
upon the homeowner’s contribution to neighborhood quality. The authors estimate the model
using a sample of 26,456 single-family homes that sold in Dallas County, Texas in 2006 with a
neighboring sale within 1,320 feet20. Assuming that neighborhood quality decreases with
foreclosure, the authors use the number of foreclosures within various distances of the property
as a proxy for neighborhood quality. They estimate the direct effect of an increase in
foreclosures is between $1,320 and $2,020, and the spatial reach of this impact is 250 feet.
In 2008, the Center for Responsible Lending (2008) updated its December 2006 study on
foreclosures and the subprime mortgage market. The center quantifies the neighborhood effect
of foreclosure by determining how many homes will suffer a decline in property values because
19 These foreclosure variables are the number of foreclosures of conventional, government‐insured, multi‐family and commercial properties of varying distances – up to ¼ mile –from the property. 20 As in Immergluck and Smith (2006), the authors refer to the literature on the effects of proximate phenomena on property values to determine that significant impacts of foreclosures on property values will occur with ¼ of a mile (1,320 feet) or less.

20
of foreclosures in their neighborhoods and the monetary value of these losses. The CRL uses the
Immergluck and Smith (2006) estimate of a 0.9 percent decline in value per foreclosure.
Applying this estimate to nationwide foreclosure and housing stock data, the CRL estimates that
40.6 million neighboring homes will experience devaluation because of subprime foreclosures
that take place nearby. This decline, the CRL estimates, is valued at $202 billion. This
translates into a $5,000 decline on average for a homeowner living near a foreclosed property.
An ICIC (2008) briefing paper studies the impact of foreclosures on the inner city by
focusing on real-estate owned (REO) properties. The ICIC argues that the recent proliferation of
these properties whose ownership has reverted back to banks has led to a decline in
neighborhood values. This decline is argued to result from the high incidence of blight,
abandonment and auction sales associated with these properties. The central theme of the ICIC
briefing paper is that REOs are heavily concentrated in the inner city as compared with the rest
of the United States. The paper provides statistics indicating that .63% of housing units in the
inner city are REOs versus .31% in the rest of the United States. Further, the paper reports that
there are 9.2 REOs per square mile in the inner city compared with 0.2 REOs per mile in the rest
of the United States. The ICIC finds the highest REO rates in Detroit, Cleveland, Atlanta,
Indianapolis and Akron – all with over 1.5% of owner-occupied housing units in REO.
As we have shown, most of the current research focuses on specific demographic areas.
However, we obtained current foreclosure data from the Federal Reserve Bank of New York in
order to extend the ICIC analysis of REO rates. The data suggests that the subprime foreclosure
fallout is very concentrated. We see this concentration by state and within states and within
cities. We see 75% of the subprime foreclosures in only 12 states as shown in the Figure below.

21
Further, certain regions appear to be subject to multiple factors that have been linked to
increased foreclosure rates. Additional analysis of data from the Federal Reserve Bank of New
York and the Office of Federal Housing Enterprise Oversight (OFHEO) shows that Arizona,
California, Connecticut, Florida and Nevada not only experienced above average foreclosure
rates, but above average exposure to default risk. Each of these states is either a non-recourse
lending or a one action state (or both). This means that the consequences of foreclosure are
lessened for borrowers in such states. Further, the percentage of interest-only and adjustable rate
mortgages is above average in these states. Therefore, borrowers in these states are more
sensitive to changing interest rates than borrowers in other states who are more likely to use
fixed-rate mortgage debt. The percentage of subprime loans is above average and nearly double
the national average in some of these states. As previously discussed, subprime borrowers carry
higher default risk due to inferior credit histories, debt ratios and other characteristics relative to
22
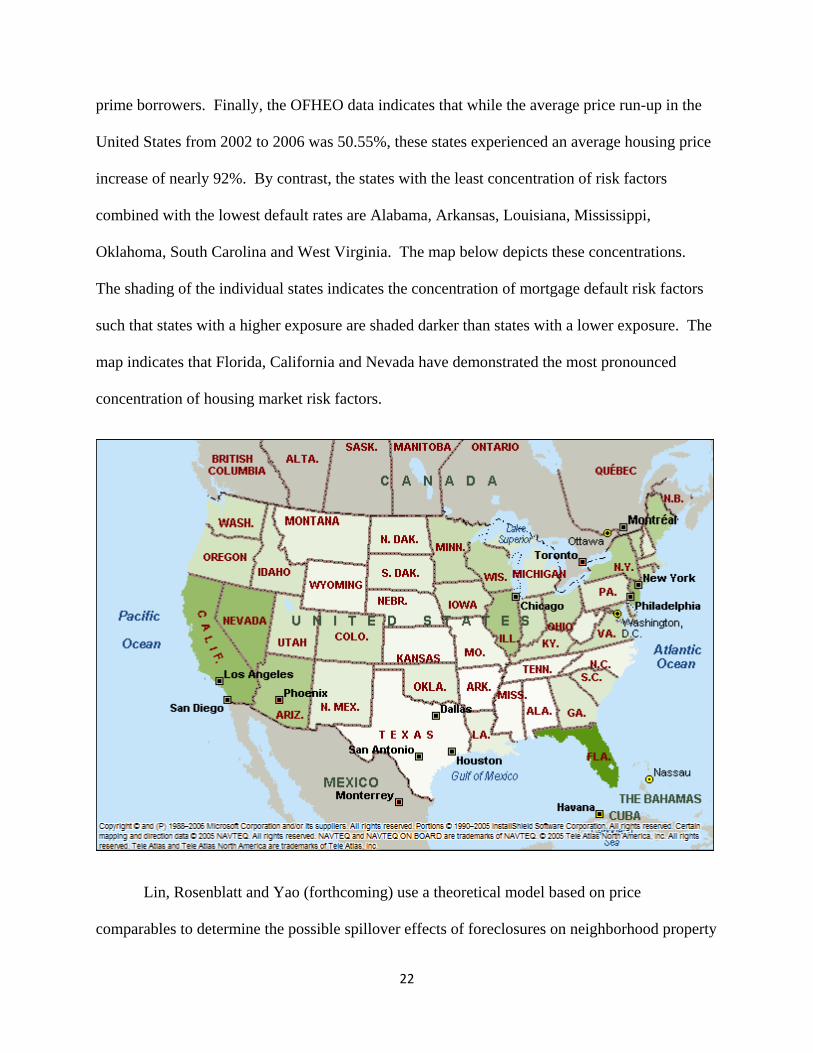
prime borrowers. Finally, the OFHEO data indicates that while the average price run-up in the
United States from 2002 to 2006 was 50.55%, these states experienced an average housing price
increase of nearly 92%. By contrast, the states with the least concentration of risk factors
combined with the lowest default rates are Alabama, Arkansas, Louisiana, Mississippi,
Oklahoma, South Carolina and West Virginia. The map below depicts these concentrations.
The shading of the individual states indicates the concentration of mortgage default risk factors
such that states with a higher exposure are shaded darker than states with a lower exposure. The
map indicates that Florida, California and Nevada have demonstrated the most pronounced
concentration of housing market risk factors.
Lin, Rosenblatt and Yao (forthcoming) use a theoretical model based on price
comparables to determine the possible spillover effects of foreclosures on neighborhood property

23
values. The paper theorizes that the spillover effect of foreclosure is equal to the sum of the
weighted prices of comparable properties discounted at a rate based upon the current state of the
housing cycle21. The authors empirically test the model using a random sample of mortgages
made in Chicago from 1990 to 2006. They find that the spillover effect results in as much as a
9.7% discount in home prices for homes located within a 0.1 km (300 feet) radius from a
foreclosed property. Further, they find that the spillover effect is always significant for distances
within 0.9 km (3,000 feet).
Just as the Lin, Rosenblatt and Yao (forthcoming) study factored time and space
(distance) into its weighting of comparables into its spillover effect model, Rogers and Winter
(2008) consider time and space when estimating the impact of foreclosures on housing sales.
The authors build upon the Immergluck and Smith (2006) model and estimate the sales price
based on two sets of independent variables. The first set includes dummy variables that account
for the time of sales, structural characteristics of the property and spatial characteristics. The
second set includes foreclosure variables. The authors estimate the model using data from
94,424 single-family property sales in St. Louis from 1998 to 2005. They find a foreclosure
effect of as much as 5.3% at 100 yards and six months. They find that the negative impact of
foreclosures does extend at least 400 yards and 18 months. They do not, however, find evidence
of a ‘tipping point,’ where at some point sales decline rapidly. Instead, they find evidence of a
diminishing marginal effect of foreclosure – the opposite effect.
Harding, Rosenblatt and Yao (2008) study the observed price declines of properties near
foreclosures to determine if they are the result of an overall neighborhood decline in property
21 These weights are based upon the time between the liquidation date of the foreclosure and the sales date of the subject property and the distance between the two properties.

24
values or if foreclosures reduce the prices of nearby non-distressed sales as the result of a
contagion effect. The authors use a repeat sales approach to overcome perceived deficiencies in
hedonic pricing models that do not account for the local trend in prices – resulting in an omitted
variable problem. The authors use a sample of approximately 600,000 repeat sales transactions
in seven MSAs from 1998 to 2007 from a private mortgage database22. They find evidence that
nearby distressed properties have significant negative contagion effects over and above the
overall trend in house prices of approximately 1% to 1.5% per foreclosure. They find three
things: 1) the foreclosure effect is greater, the longer it takes to sell the foreclosed property; 2) it
peaks at the time of the REO sale; and 3) it lingers beyond the REO sale.
Calomiris, Longhofer and Miles (2008) also consider the impact of foreclosures on house
prices. However, they incorporate other macroeconomic and housing variables in a vector
autoregressive (VAR) model to analyze these interactions. The variables in their model are
employment, existing home sales, housing permits, the Office of Federal Housing Enterprise
Oversight (OFHEO) home price index and the ratio of foreclosures to total mortgages. In
contrast to other studies, they find that the impact of foreclosure on prices is negative and
significant, but small in magnitude. The authors estimate that the national average price decline
for houses from second quarter 2007 to fourth quarter 2009 will be approximately 5.5 percent.
Further, they conclude that the future path of housing prices will be flat for the next two years.
Conclusion An analysis of the neighborhood impact of subprime lending, predatory lending and
foreclosure must initially address each of these issues independently. Our review of the existing
literature has revealed that the subprime lending market grew at an unprecedented rate at a time
22 The MSAs included in the Harding, Rosenblatt and Yao (2008) study are Atlanta, Charlotte, Columbus, Las Vegas, Los Angeles, Memphis and St. Louis.

25
when house prices were also experiencing a ‘bubble’. Many of these subprime loans, however,
were fraught with terms and conditions that could be considered predatory in nature. Many laws
have been enacted at the state level to combat these practices while still allowing the subprime
market to make homeownership possible for underrepresented groups. The impact of this
legislation has been minimal. As the housing bubble began to deflate, many subprime loans
defaulted. Mortgages originated by third-party originators were more likely to default as well as
those loans that represented the first mortgage on a property and were obtained from a subprime
lender. The extent of this default is estimated at over $200 billion. Further, African-American
and Hispanic borrowers with low credit scores are more likely to default as the probability of
negative equity increases. This default risk, however, is more than offset by empirical evidence
suggesting that these same borrowers are less likely to prepay as the probability of positive
equity increases. These results, coupled with the ineffectiveness of legislation in curbing
predatory lending practices have significant policy implications.
As housing prices change, subprime lending increases, and homeowners default, there is
a foreclosure or spillover effect on neighborhoods. Depending upon variances in time and space,
foreclosures can depress home prices by as much as 10 percent. When taking into consideration
the number of distressed properties in close proximity to a given residence, the residence will
decrease in value by an average amount of 1% per distressed nearby property. When this value
is extrapolated across the entire U.S. housing stock, the spillover effect is estimated at
approximately $5,000 per home.
Due to data constraints, much of the detailed analysis conducted to-date is local, with
generalizations made in order to quantify the national impact. Chicago, St. Louis, Cleveland and
other large metropolitan areas have received the most attention. One reason for the emphasis on

26
these urban areas is due to the correlation between recent foreclosures and subprime lending
activity, which is most prevalent in the inner cities. Gaps remain in the literature to take on more
detailed analyses on a national level covering a wider range of MSAs. More work needs to be
done to quantify the impact of subprime lending and foreclosure on the national housing market
– beyond extrapolating local trends. This can best be accomplished through a large-scale
national study of mortgage loans that identifies subprime versus prime loans across several
MSAs, analyzes foreclosure rates for both populations at the ZIP code level and tracks the
changes in mean home value across time in those same ZIP codes. Second, much of the work on
neighborhood effects has focused on home prices and returns as opposed to the volatility of those
returns. Finally, more work is necessary to examine the link between predatory and subprime
lending and home price decline in neighborhoods. While it has been established that foreclosure
leads to price decline in neighborhoods, is it possible to move back farther in the chain of events
and establish a link between subprime lending concentration, foreclosure and price decline?

27
References
Alexander, W.P., Grimshaw, S.D., McQueen, G.R., and Slade, B.A. (2002). Some Loans are More Equal than Others: Third-Party Originations and Defaults in the Subprime Mortgage Industry. Real Estate Economics, 30 (4), 667-697.
Anderson, C.D., Capozza, D.R., and Van Order, R. (2008). Deconstructing the Subprime Debacle Using New Indices of Underwriting Quality and Economic Conditions: A First Look. Unpublished working paper.
Bostic, R.W., Engel, K.C., McCoy, P.A., Pennington-Cross, A., and Wachter, S.M. (2007). State and Local Anti-Predatory Lending Laws: The Effect of Legal Enforcement Mechanisms. Unpublished working paper.
Calomiris, C.W., Longhofer, S.D., and Miles, William (2008). The Foreclosure-House Price Nexus: Lessons from the 2007-2008 Housing Turmoil. Unpublished working paper.
Case, K.E., and Shiller, R.J. (2003). Is There a Bubble in the Housing Market? Brookings Papers on Economic Activity , 2003 (2), 299-342.
Chomsisengphet, S. and Pennington-Cross, A. (2006). The Evolution of the Subprime Mortgage Market. Federal Reserve Bank of St. Louis Review, 88 (1), 31-56.
Deng, Y., and Gabriel, S. (2006). Risk-Based Pricing and the Enhancement of Mortgage Credit Availaility among Underserved and Higher Credit-Risk Populations. Journal of Money, Credit and Banking, 38 (6), 1431-1460.
Dubin, R. (2008). Foreclosures in Cleveland. Unpublished working paper.
Gerardi, K., Shapiro, A.H., and Willen, P.S. (2007). Subprime Outcomes: Risky Mortgages, Homeownership Experiences, and Foreclosures. Unpublished working paper .
Harding, J., Rosenblatt, E., and Yao, V.W. (2008). The Contagion Effect of Foreclosed Properties. Unpublished working paper .
Hill, R.P., and Kozup, J.C. (2007). Consumer Experiences with Predatory Lending Practices. The Journal of Consumer Affairs, 41 (1), 29-46.
Ho, G., and Pennington-Cross, A. (2006). Predatory Lending Laws and the Cost of Credit. Federal Reserve Bank of St. Louis working paper .

28
ICIC. (2008). Foreclosures and the Inner City: The Current Morgage Crisis and Its Inner City Implications.
Immergluck, D., and Smith, G. (2006). The External Costs of Foreclosure: The Impact of Single-Family Mortgage Foreclosures on Property Values. Housing Policy Debate, 17 (1), 57-79.
Center for Responsible Lending (2008). Subprime Spillover: Foreclosures Cost Neighbors $202 Billion; 40.6 Million Homes Lose $5,000 on Average.
Lax, H., Manti, M., Raca, P., and Zorn, P. (2004). Subprime Lending: An Investigation of Economic Efficiency. Housing Policy Debate, 15 (3), 533-571.
Leonard, T., and Murdoch, J. (2008). The Neighborhood Effects of Foreclosure. Unpublished working paper .
Lin, Z., Rosenblatt, E., and Yao, V.W. (Forthcoming). Spillover Effects of Foreclosures on Neighborhood Property Values. Journal of Real Estate, Finance and Economics.
Loutskina, E., and Strahan, P.E. (2008). Informed and Uninformed Investment in Housing: The Downside of Diversification. Unpublished working paper.
Mallach, A. (2007). Lower Income Homeownership, the Subprime Lending Industry and the Public Good: A Conceptual Inquiry. Unpublished working paper.
Mayer, Chris, and Pence, Karen (2008). Subprime Mortgages: What, Where, and To Whom? Unpublished working paper.
National Conference of State Legislatures. (2008). 2008 Foreclosure Legislation. Denver.
Pennington-Cross, A. (2006). The Value of Foreclosed Property. Journal of Real Estate Research, 28 (2), 193-214.
Pyle, M.J. (2003). A "Flip" Look at Predatory Lending: Will the Fed's Revised Regulation Z End Abusive Refinancing Practices? The Yale Law Journal, 112 (7), 1919-1926.
Rogers, W.H., and Winter, W. (2008). The Impact of Foreclosures on Neighboring Housing Sales. Unpublished working paper.
Schloemer, E., Li, W., Ernst, K., and Keest, K. (2006). Losing Ground: Foreclosures in the Subprime Market and Their Cost to Homeowners. Center for Responsible Lending.
Schwartz, N.D. (2007). Can the Mortgage Crisis Swallow a Town? The New York Times. Sept. 2, 2007.

29
Shwiff, K., and Kingsbury, K. (2008). Home Prices Decline at Record Rates. The Wall Street Journal.
Tootell, G.M. (1996). Redlining in Boston: Do Mortgage Lenders Discriminate Against Neighborhoods? The Quarterly Journal of Economics, 111 (4), 1049-1079.
Wyly, E.K., Moos, M., Foxcroft, H., and Kabahizi, E. (2008). Subprime Mortgage Segmentation in the American Urban System. Tijdschrift voor Economische en Sociale Geografie, 99 (1), 3-23.