Embed Size (px)
Citation preview
Collaborative Research Center Transregio 224 - www.crctr224.de Rheinische Friedrich-Wilhelms-Universität Bonn - Universität Mannheim
Discussion Paper No. 073 Project A 01 The Dynamics of Motivated Beliefs Florian Zimmermann* March 2019 *University of Bonn and briq, CESifo, IZA; briq – Institute on Behavior & Inequality, Schaumburg-Lippe-Str 5-9, 53113 Bonn, Germany; [email protected] Funding by the Deutsche Forschungsgemeinschaft (DFG, German Research Foundation) through CRC TR 224 is gratefully acknowledged.
Discussion Paper Series – CRC TR 224
The Dynamics of Motivated Beliefs
Florian Zimmermann∗
February 22, 2019
Abstract
A key question in the literature on motivated reasoning and self-deception is how
motivated beliefs are sustained in the presence of feedback. In this paper, we explore
dynamic motivated belief patterns after feedback. We establish that positive feedback
has a persistent effect on beliefs. Negative feedback, instead, influences beliefs in the
short-run, but this effect fades over time. We investigate the mechanisms of this dynamic
pattern, and provide evidence for an asymmetry in the recall of feedback. Finally, we
establish that, in line with theoretical accounts, incentives for belief accuracy mitigate
the role of motivated reasoning.
JEL classification: C91, D03, D12, D83
Keywords : Motivated Beliefs, Feedback, Self-Deception, Overconfidence, Selective Recall,Memory, Polarization, Experiments.
∗University of Bonn and briq, CESifo, IZA; Membership in the Deutsche Forschungsgemeinschaft (DFG,German Research Foundation) through CRC TR 224 is gratefully acknowledged; Address: briq - Instituteon Behavior & Inequality, Schaumburg-Lippe-Str 5-9, 53113 Bonn, Germany; [email protected]
1 Introduction
The process of belief formation is not exclusively guided by a desire for accuracy. Instead,
the literature on motivated reasoning argues that the desire to hold a positive self-view or to
maintain a certain conviction constitute strong motives to manipulate beliefs in a self-serving
way. One of the most prominent consequences of such motives is overconfidence, or the sys-
tematic overestimation of one’s skills and abilities. People want to believe that they are able
or skilled, for instance, due to motivational reasons (Bénabou and Tirole, 2002) or ego-utility
(Kőszegi, 2006), and thus deceive themselves to achieve such beliefs. The implications of over-
confident self-assessments are manifold and have been studied in different contexts, ranging
from tournament entry decisions (Dohmen and Falk, 2011), CEO behavior (Malmendier and
Tate, 2005 and 2008) and self-control problems (DellaVigna and Malmendier, 2006). In the
domain of prosocial behavior, people generally like to think of themselves as generous and
selfless. At the same time, they often succumb to the temptation to act in a selfish manner.
The tension that results between the desired self-view and actual behavior is often resolved
by manipulating beliefs or perceptions related to moral transgressions, thereby restoring the
self-view of being a moral person (see, e.g., Haisley and Weber, 2010; Gneezy et al., 2015; Di
Tella et al., 2015). Moving beyond individual behavior, motivated reasoning can shape belief
patterns at the group or societal level (Bénabou, 2013). Phenomena such as the pronounced
polarization of beliefs within societies on topics such as climate change have been attributed
to motivated cognition (e.g., Kahan, 2013).
A key question in the literature on motivated beliefs is how people maintain a self-servingly
biased view of themselves and the world, even though they frequently obtain feedback from,
for example, friends, employers, the news media and the market. Managers eventually learn
about their investment failures, and consumers find that their plans to regularly go to the
gym fail, and yet, overly optimistic self-assessments seem to persist. Theoretical contributions
(Bénabou and Tirole, 2002, 2004) have emphasized the role of selective recall as a means to
deal with ego-threatening information, but empirical evidence remains scarce and lags behind
the theoretical advances. Taking this as point of departure, in this paper we employ a series
of laboratory experiments in the context of an IQ test to make three key contributions.
First, we explore dynamic belief patterns after the provision of feedback about relative
test performance. The context we implement in our study is that of an IQ test. IQ is
ideal for our purposes, as it constitutes an important skill and is known to be highly ego
relevant for most people. At the same time, it permits the provision of feedback related to
test performance in a straightforward way. In the experiment, subjects first complete an
IQ test. We then randomly place subjects into groups of 10 and elicit their beliefs about
their rank in the group according to IQ test performance. Afterwards, we provide them
with unbiased but noisy feedback about their rank. The noise component is crucial because
it allows us to causally identify the role of positive versus negative feedback in shaping
belief and memory patterns. Specifically, we provide each subject with an indication of their
1
actual rank by randomly selecting three members of their group of 10 and informing them
as to whether they are ranked higher or lower compared to each of these three members.
This generates exogenous variation in feedback, conditional on the subjects’ true rank. To
investigate dynamic belief patterns, we elicit beliefs about the rank in the group of 10 for a
second time after subjects are given the feedback. Our key treatment variation is that we
exogenously vary, in a between-subjects design, the time between feedback and the elicitation
of posterior beliefs. In one treatment, we elicit beliefs directly after the feedback, while in a
second treatment beliefs are elicited one month after subjects are given the feedback.
We find that, measured directly after the feedback, beliefs show adjustments in the ap-
propriate directions. Subjects who received positive feedback adjusted their beliefs upwards,
while subjects who received negative feedback adjusted their beliefs downwards. This pat-
tern changes if we consider beliefs elicited one month after the feedback. While beliefs
after positive feedback remain adjusted upwards, beliefs after negative feedback substantially
“recovered” and reflect the feedback to a much smaller extent; thus, the effect of negative
feedback on beliefs is mitigated over time. Even though individuals’ adjust their beliefs to
negative feedback in the short run, over the course of one month, confidence returns to a
level comparable to that prior to the feedback. This suggests that confidence-levels follow
specific temporal patterns. An overconfident CEO may be less overconfident right after a
failed merger, compared to a situation in which the failure occurred months or years ago.
Likewise, a consumer may reach a certain level of sophistication about his/her present bias
right after failing to stick to an exercise plan, but over time return to a state of naïveté.
Second, we explore the underlying mechanisms of this dynamic pattern. A potential
candidate highlighted in the theoretical literature is selective recall (Bénabou and Tirole,
2002, 2004). It is conceivable that, over time, individuals manage to forget or suppress
negative feedback. Accordingly, in a new set of experiments, we investigate the extent to
which subjects recall the feedback one month after receiving it. The basic experimental
design is identical to the experiments described above, except that we measure the accuracy
with which subjects recall the feedback one month after they receive it. Specifically, instead
of eliciting posterior beliefs, we directly ask individuals to recall the feedback they received
and pay them for accuracy.
We find that negative feedback is indeed recalled with significantly lower accuracy, com-
pared to positive feedback, which suggests that the dynamic belief pattern we have identified
is indeed driven by the selective recall of information. Next, we make use of additional
outcome variables and a placebo condition to delve into how selective recall operates. In
a nutshell, the following patterns emerge. Our results suggest that participants are able to
suppress the recall of unwanted memories. Furthermore, participants appear to suppress the
recall of not only negative feedback but also the IQ test more broadly. Our results lend direct
support to key modeling assumptions in Bénabou and Tirole (2002, 2004). From a policy
perspective, our findings suggest that policy interventions aimed at correcting self-servingly
biased misperceptions via information or feedback are unlikely to be effective in the long run
2
due to people’s ability to forget or suppress information that threatens their desired views.1
Third, we ask if there are factors that mitigate people’s tendency to suppress feedback they
dislike. The theoretical literature on motivated beliefs suggests that basic economic incentives
may work. Specifically, models such as those by Brunnermeier and Parker, 2005 and Bénabou
and Tirole, 2002, formalize a simple but fundamental trade-off, where self-servingly biased
beliefs bolster individuals’ ego and self-esteem but come at the cost of potentially distorting
decision-making. In the last part of the paper, we exogenously manipulate this trade-off.
Interestingly, in the dynamic context we are considering, there are two conceptually distinct
ways in which incentives for accuracy may matter. The first one builds on an important
feature of our experiments, namely that the belief elicitation or recall accuracy tasks always
come as a surprise for participants. Our findings suggest that in such environments, people try
to (and manage to) suppress feedback that threatens their desired self-view. This may change
if future belief elicitation is announced in advance. We conduct an additional treatment
where, after subjects receive feedback, we announce that in one month, subjects will face a
belief elicitation task, and we emphasize that subjects’ earnings will depend on the accurate
assessment of their actual rank in their group of 10. Our findings reveal that the mere
announcement of a future belief elicitation task alters people’s mindset and attenuates their
desire to suppress negative feedback. As a consequence, negative feedback has a significantly
more pronounced effect on beliefs.
The second way in which incentives may matter is at the recall stage. Even in contexts
where people have set their mind on suppressing feedback that threatens their ego, unexpected
and sufficiently high incentives for recall may nonetheless induce them to access memory
traces of that feedback. Here, an interesting distinction between suppressing and a naïve
interpretation of forgetting as “erasure from memory” becomes apparent. If subjects erase
negative feedback from their memory, then higher incentives to recall should not improve
recall accuracy. In contrast, if subjects are merely suppressing, then sufficient incentives may
induce them to dig out the memory traces they were suppressing. We implement a treatment
variation identical to the recall condition, except that we substantially increase incentives
to recall feedback correctly. Indeed, we find that subjects are willing to uncover unpleasant
memory traces if the monetary gains are large enough. Taken together, while our findings
demonstrate the ability of subjects to gradually suppress feedback they dislike, they also
reveal that self-deception is not without limits. Instead, incentives can play an important
role in bounding the effects of motivated cognition on beliefs.
Research on motivated reasoning has a long-standing tradition (see, e.g., Kunda, 1990;
Epley and Gilovich, 2016). Implications have been studied in diverse contexts such as
(over)confidence (see, e.g., Bénabou and Tirole, 2002; Kőszegi, 2006; Sharot et al., 2011),
moral behavior (see, e.g., Babcock et al., 1995; Konow, 2000; Dana et al., 2007; Haisley and
1Recent literature has begun to investigate the effectiveness of feedback and information in correcting beliefbiases and misperceptions (see e.g., Grigorieff et al, 2018; Kuziemko et al., 2015). Our findings highlight theimportance of studying the long-run effects of these interventions.
3
Weber, 2010; Exley, 2015; Gneezy et al., 2015; Di Tella et al., 2015; Falk, 2017; Grossman
and van der Weele, forthcoming), and belief polarization (see, e.g., Kahan, 2013).
In terms of the underlying reasons for motivated beliefs (“demand side” of self-deception),
several motives have been suggested. Kőszegi (2006) and Brunnermeier and Parker (2005)
pointed towards belief-based utility, suggesting that people directly derive consumption util-
ity from being optimistic about themselves and/or the future in general. Bénabou and Tirole
(2002) highlighted the motivational value of optimistic beliefs and showed that they can
help present-biased agents overcome self-control problems. Another strand of literature em-
phasizes the role of (stated) optimism as a social signal (see Burks, Carpenter, Goette and
Rustichini, 2013; Charness, Rustichini and van de Ven, 2014; Ewers and Zimmermann, 2015;
and Schwardmann and van der Weele, 2017).2 Our paper does not take a stand on the de-
mand side of self-deception. In fact, all these mechanisms could be at work in our study and
could drive subjects’ desire to have optimistic beliefs about themselves. We focus on how
such optimism can be maintained in the presence of feedback.
Our findings most closely relate to studies that look at the “supply side” of self-deception.
In the context of overconfidence, several studies have looked at short-run updating. Two basic
results emerged: people seem to update conservatively (Möbius et al., 2013), and they seem
to asymmetrically process information, putting more weight on positive than on negative
information (see e.g. Eil and Rao, 2011; Sharot et al., 2011 and Möbius et al., 2013).3
In medical contexts, Oster et al. (2013) and Ganguly and Tasoff (2017) provide evidence
that people may attempt to avoid feedback to begin with if they expect it to threaten their
belief-based utility. Different from existing work, our study emphasizes the important role
of dynamic processes after obtaining feedback and the critical role memory plays in these
processes. None of the concepts that emerged from these studies can explain our results.
Our paper also relates and contributes to the literature on the determinants and implica-
tions of memory (see also the discussions in section 3). Schacter (1996) and Kahana (2012)
provide excellent overviews. In the economics literature, see Bénabou and Tirole (2002) for
a theoretical analysis of the role of memory in motivated reasoning. Mullainathan (2002),
Gennaioli and Shleifer (2010), Bordalo, Coffman, Gennaioli and Shleifer (2016), and Bordalo,
Gennaioli and Shleifer (2017) focus on the role of cognitive limitations in recall and model
implications for belief formation and decision-making.
The remainder of the paper is structured as follows. We first study belief dynamics after
feedback. Section 3 considers the role of selective recall, and section 4 studies the trade-off
between affective benefits and incentives for accuracy. Section 5 concludes.
2Schwardmann and van der Weele (2017) advanced this literature strand by providing causal evidence thatpeople actually deceive themselves in order to more effectively deceive others and by demonstrating that thisis an effective persuasion strategy.
3Recent studies have found somewhat weaker and sometimes no evidence for an asymmetry in informationprocessing. See, for example, Barron (2016), Coutts (2016), and Schwardmann and van der Weele (2017).In our study, we do find conservatism in updating, but we see little evidence for asymmetry in short-runupdating (see section 2.3 and Appendix A.6).
4
2 Motivated Belief Dynamics
2.1 Experimental Design
An environment to study motivated belief dynamics after feedback requires (i) a context that
gives rise to motivated reasoning, (ii) exogenous variation in feedback conditional on true
ability, and (iii) the clean manipulation of time between feedback and belief elicitation.
Our design accommodates all these features. Table 1 summarizes the main treatment con-
ditions for this paper. In this section, we focus on the ConfidenceDirect, Confidence1month,
and ConfidenceNoFeedback treatments. The Recall, RecallHigh, and Announcement treat-
ments are introduced in later sections.
For all treatments, subjects completed an IQ test. Specifically, subjects solved a total of
10 Raven matrices, which are frequently used as a non-verbal test of intelligence. Subjects
were explicitly told that this type of test is often used to measure intelligence. After the
test, subjects were informed that they were randomly matched into a group with nine other
subjects that had participated in an earlier experiment and completed the same intelligence
test and that we had computed a ranking of the group according to performance on the IQ
test.
We measured subjects’ beliefs about their rank in this group before and after they received
(noisy) feedback about their rank. This allowed us to precisely track belief adjustments to
feedback, which served as our key outcome measure. Specifically, directly after the IQ test
but before receiving any feedback about their relative test performance, we elicited subjects’
beliefs for the first time about their rank in the group. We asked subjects to estimate the
likelihood that they ranked in the upper half of the group. Subjects had to provide their
estimate in percentage, and every integer between 0 and 100 was admissible. Incentive
compatibility was ensured by using a quadratic scoring rule. In an additional step, to obtain
a full prior belief distribution, for each possible position in the ranking, we also elicited
subjects’ beliefs about the likelihood that they ranked in this position. Again, we ensured
incentive compatibility by using a quadratic scoring rule (see section 2.2 for details).
Next, for the ConfidenceDirect and Confidence1month treatments, we provided subjects
with noisy feedback about their rank in the group. Specifically, we randomly selected three of
the nine other group members and, for each of these three members, informed subjects about
whether they ranked higher or lower than the respective member (see Eil and Rao, 2011).
The noise component in feedback is crucial, as it implies that subjects with the exact same
rank obtained different feedback - some positive, some negative. Thus, potential asymmetries
in belief dynamics cannot be driven by individual characteristics. This allows us to causally
identify the effect of feedback (positive and negative) on beliefs. We ensured that subjects
realized the feedback by asking them to repeat it on the next screen.
After the provision of feedback, we elicited subjects’ beliefs about their position in the
group for the second time. We again used a quadratic scoring rule to elicit subjects’ beliefs
5

Table 1: Main Experimental Conditions and Descriptions
Treatment Feedback Outcome Measure Time of Elicitation Announcement
ConfidenceDirect Yes Beliefs Direct No
Confidence1month Yes Beliefs One month later No
ConfidenceNoFeedback No Beliefs One month later No
Recall Yes Recall Accuracy One month later No
Announcement Yes Beliefs One month later Yes
RecallHigh Yes Recall Accuracy One month later No
about the likelihood that they ranked in the upper half of the group. We ruled out possible
hedging motives between the different belief elicitation tasks by randomly selecting one task
for payment (see section 2.2 for details).
The key difference between the ConfidenceDirect and Confidence1month treatments was
the time between feedback and belief elicitation. For ConfidenceDirect, we elicited beliefs
immediately after feedback whereas for Confidence1month, we elicited beliefs one month after
subjects received the feedback. Comparisons between these treatments allow us to precisely
track the time pattern of belief adjustments after feedback.
Note that the ConfidenceDirect treatment was split into two subconditions. In one sub-
condition, beliefs were indeed elicited directly after the feedback, while in the other sub-
condition, we let 15 minutes elapse between feedback and belief elicitation. The reason we
implemented these two subconditions was to enable us to measure potential short-term dy-
namics in belief adjustment. As we show later, we did not detect any difference between the
two subconditions.
ConfidenceNoFeedback served as a control condition where subjects did not receive any
feedback, and beliefs were elicited one month after the IQ test. This treatment allowed us to
identify potential time trends in beliefs that might be present independent of feedback.
2.2 Procedures
To avoid selection effects, subjects in all treatments had to sign up for two experimental
sessions, with one month between sessions, and were informed that it was randomly de-
termined whether they had to come to the second session or not. Subjects in treatment
ConfidenceDirect were informed at the end of the experimental session that a random device
had determined that they would not need to come to the second experimental session for
6
which they had signed up.4
The experiment was organized into seven parts. At the end of the experiment, one of
the seven parts was randomly selected for payment.5 Some of the seven parts were unrelated
to the IQ test. This was mainly done to obfuscate the purpose of the experiment and to
have filler tasks for the subcondition of ConfidenceDirect, where 15 minutes elapsed between
feedback and the subsequent belief elicitation. It also served the purpose of creating an
additional recall measure, which is introduced in section 3.
The timeline for ConfidenceDirect was as follows: The experiment started with a simple
dictator game. Subjects were endowed with 10 euros and could decide if they wanted to
donate part of this endowment to a charity organization, the German Red Cross. All integers
between 0 and 10 were possible. Part 2 of the experiment consisted of the IQ test and the
subsequent belief elicitation. Subjects earned a fixed payment of 4 Euros for this part, plus
additional earnings from the belief elicitation.6 In the next part (Part 3), subjects were
provided with noisy feedback about their ranking in the group and were asked to repeat the
feedback on the next screen. Subjects obtained a fixed payment of 5 Euros if this part was
payoff-relevant.
In the subcondition of treatment ConfidenceDirect, where beliefs were elicited immediately
after the feedback, the experiment continued with the second belief elicitation. Subjects
obtained a fixed payment of 4 Euros and were also paid according to the quadratic scoring
rule.7 Part 5 consisted of a real-effort task. Subjects had to count the number of zeros
that showed up in a table of zeros and ones (see Abeler et al., 2011 and Gneezy et al.,
2017). They were given five minutes to count as many zeros as they could and earned a fixed
payment of 5 Euros as well as 0.2 Euros for every table counted correctly. In Part 6, subjects
received a fixed payment of 3 Euros and an endowment of 2 Euros and could decide how
much of this endowment to invest in a risky asset (see Gneezy and Potters, 1997). In Part
7, sociodemographic information was collected. Subjects obtained a fixed amount of 5 Euros
for this part.
In the subcondition of treatment ConfidenceDirect, where 15 minutes elapsed between the
feedback and the second belief elicitation, the timeline was slightly different. After obtaining
the feedback, subjects continued with the real-effort task followed by the investment task,
which typically took about 15 minutes. Then, in Part 6 of the experiment, we elicited
4Subjects made all their decisions anonymously on a computer in carrels with closed curtains. Decisionsfrom the first and second sessions were matched using individualized codes that only the subjects knew. Wealso informed subjects that the set of people involved in running the experiment and analyzing the data wouldbe the same for the first and second sessions.
5In addition, subjects received a show-up fee of 10 Euros. Subjects in Confidence1month and Confiden-ceNoFeedback received an additional show-up fee of 15 Euros since they had to come to the lab twice.
6The formula for the quadratic scoring rule for beliefs about the likelihood of ranking in the upper half wasas follows: Earnings = 2euros − 2(I(rank ≤ 5) − belief/100)2, where I(rank ≤ 5) is an indicator functionand takes the value 1 if a subject’s actual rank is 5 or higher. The subsequent elicitation of the full prior beliefdistribution was also incentivized using a quadratic rule. Subjects were informed that if Part 2 was randomlychosen to be payoff-relevant, one of the two belief elicitations would be randomly selected for payment.
7The formula for the quadratic scoring rule was again: Earnings = 2Euros−2(I(rank ≤ 5)−belief/100)2.
7
subjects’ posterior beliefs. Part 7, again, collected sociodemographic information.
The timeline in Confidence1month was similar, except for one key difference. The second
belief elicitation was conducted one month after all the other parts were conducted. Thus,
subjects completed the dictator game and the IQ test, followed by the first belief elicitation
and the provision of feedback. Then, they performed the real-effort task, made a series of
choices under risk and, in Part 6, provided sociodemographic information. Part 7 consisted
of the second belief elicitation, which was conducted one month later.
ConfidenceNoFeedback was identical to Confidence1month in terms of timing, except, of
course, that no feedback was provided. To keep the number of parts identical to the other
conditions, the sociodemographic section was split into two parts.
An important challenge was to minimize attrition in the Confidence1month and Confi-
denceNoFeedback treatments. Three design features were included to reduce attrition to a
minimum: (i) all payments from the experiment were made at the second meeting, to max-
imize the incentive for subjects to show up to the second lab session;8 (ii) at the end of the
first lab session, subjects were handed slips of paper stating the exact date and time of the
second meeting and were reminded twice via email about the second lab session; (iii) subjects
that did not show up for the second lab session received an email with a Qualtrics link that
allowed them to complete the study online within the following 24 hours. Efforts to reduce
attrition were quite effective. Out of 161 subjects that participated in the first session of
treatments Confidence1month and ConfidenceNoFeedback, all but two also participated in
the second session.
A total of 339 subjects participated in the experiments: 178 in treatment ConfidenceDi-
rect, 109 in Confidence1month, and 52 in ConfidenceNoFeedback.9 Experimental sessions
took on average about 50 minutes. The second sessions for treatments Confidence1month
and ConfidenceNoFeedback took about 30 minutes. The experiments were conducted in Jan-
uary and February 2016 at the BonnEconLab of the University of Bonn. Subjects were mainly
students from the University of Bonn and were recruited using the hroot online recruitment
system (Bock, Baetge and Nicklisch, 2014). The experiments were computerized using z-tree
experimental software (Fischbacher, 2007) and the Qualtrics online survey tool.
8Thus, subjects knew from the show-up fees for the two meetings alone that they would receive a paymentof at least 25 Euros when they showed up to the second session.
9We oversampled treatment ConfidenceDirect to have enough statistical power to compare the two sub-conditions of the treatment.
8
2.3 Results
We define positive and negative feedback, respectively, based on the following rule: subjects
that learned they ranked higher than at least two out of the three randomly selected group
members are classified as having received positive feedback, and all others as having received
negative feedback. In the Appendix, we show that all our results are robust to using alter-
native definitions of positive and negative feedback. We are interested in belief dynamics
after feedback. For this purpose, we compare the ConfidenceDirect and Confidence1month
treatments.10
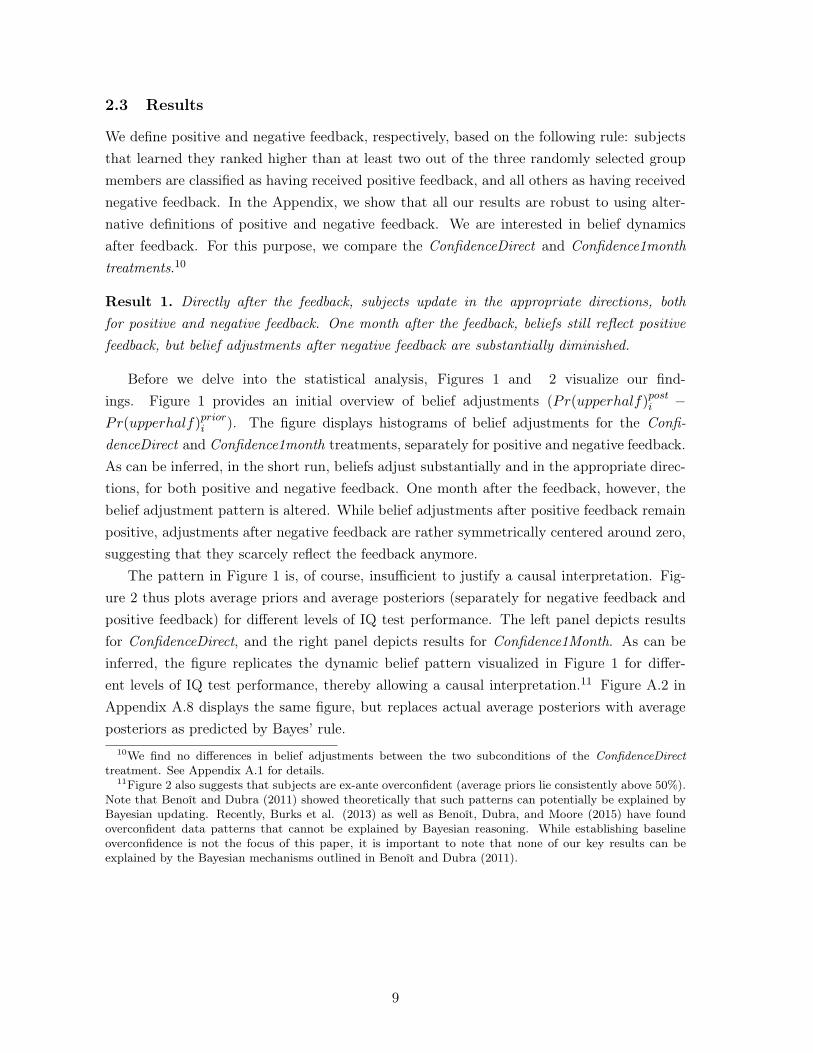
Result 1. Directly after the feedback, subjects update in the appropriate directions, both
for positive and negative feedback. One month after the feedback, beliefs still reflect positive
feedback, but belief adjustments after negative feedback are substantially diminished.
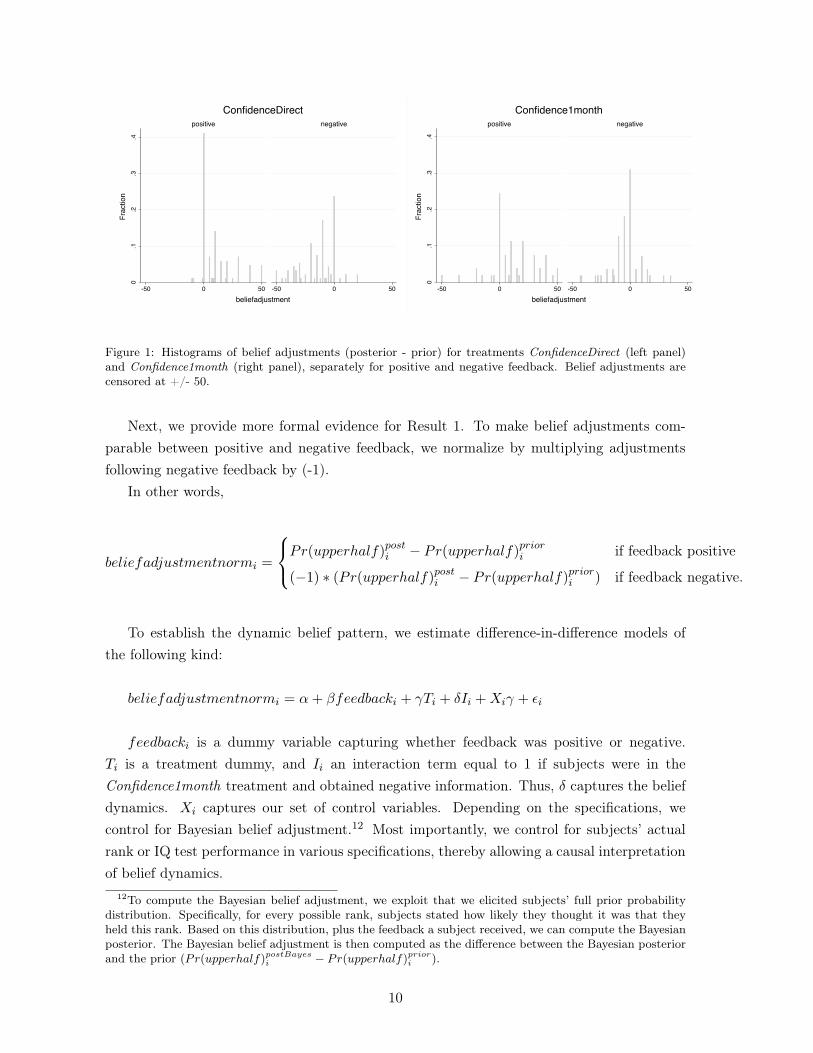
Before we delve into the statistical analysis, Figures 1 and 2 visualize our find-
ings. Figure 1 provides an initial overview of belief adjustments (Pr(upperhalf)posti −
Pr(upperhalf)priori ). The figure displays histograms of belief adjustments for the Confi-
denceDirect and Confidence1month treatments, separately for positive and negative feedback.
As can be inferred, in the short run, beliefs adjust substantially and in the appropriate direc-
tions, for both positive and negative feedback. One month after the feedback, however, the
belief adjustment pattern is altered. While belief adjustments after positive feedback remain
positive, adjustments after negative feedback are rather symmetrically centered around zero,
suggesting that they scarcely reflect the feedback anymore.
The pattern in Figure 1 is, of course, insufficient to justify a causal interpretation. Fig-
ure 2 thus plots average priors and average posteriors (separately for negative feedback and
positive feedback) for different levels of IQ test performance. The left panel depicts results
for ConfidenceDirect, and the right panel depicts results for Confidence1Month. As can be
inferred, the figure replicates the dynamic belief pattern visualized in Figure 1 for differ-
ent levels of IQ test performance, thereby allowing a causal interpretation.11 Figure A.2 in
Appendix A.8 displays the same figure, but replaces actual average posteriors with average
posteriors as predicted by Bayes’ rule.
10We find no differences in belief adjustments between the two subconditions of the ConfidenceDirect
treatment. See Appendix A.1 for details.11Figure 2 also suggests that subjects are ex-ante overconfident (average priors lie consistently above 50%).
Note that Benoît and Dubra (2011) showed theoretically that such patterns can potentially be explained byBayesian updating. Recently, Burks et al. (2013) as well as Benoît, Dubra, and Moore (2015) have foundoverconfident data patterns that cannot be explained by Bayesian reasoning. While establishing baselineoverconfidence is not the focus of this paper, it is important to note that none of our key results can beexplained by the Bayesian mechanisms outlined in Benoît and Dubra (2011).
9
0.1
.2.3
.4
-50 0 50 -50 0 50
positive negativeFraction
beliefadjustment
ConfidenceDirect
0.1
.2.3
.4
-50 0 50 -50 0 50
positive negative
Fraction
beliefadjustment
Confidence1month
Figure 1: Histograms of belief adjustments (posterior - prior) for treatments ConfidenceDirect (left panel)and Confidence1month (right panel), separately for positive and negative feedback. Belief adjustments arecensored at +/- 50.
Next, we provide more formal evidence for Result 1. To make belief adjustments com-
parable between positive and negative feedback, we normalize by multiplying adjustments
following negative feedback by (-1).
In other words,
beliefadjustmentnormi =
Pr(upperhalf)posti − Pr(upperhalf)priori if feedback positive
(−1) ∗ (Pr(upperhalf)posti − Pr(upperhalf)priori ) if feedback negative.
To establish the dynamic belief pattern, we estimate difference-in-difference models of
the following kind:
beliefadjustmentnormi = α+ βfeedbacki + γTi + δIi +Xiγ + ǫi
feedbacki is a dummy variable capturing whether feedback was positive or negative.
Ti is a treatment dummy, and Ii an interaction term equal to 1 if subjects were in the
Confidence1month treatment and obtained negative information. Thus, δ captures the belief
dynamics. Xi captures our set of control variables. Depending on the specifications, we
control for Bayesian belief adjustment.12 Most importantly, we control for subjects’ actual
rank or IQ test performance in various specifications, thereby allowing a causal interpretation
of belief dynamics.
12To compute the Bayesian belief adjustment, we exploit that we elicited subjects’ full prior probabilitydistribution. Specifically, for every possible rank, subjects stated how likely they thought it was that theyheld this rank. Based on this distribution, plus the feedback a subject received, we can compute the Bayesianposterior. The Bayesian belief adjustment is then computed as the difference between the Bayesian posteriorand the prior (Pr(upperhalf)postBayes
i − Pr(upperhalf)priori ).
10
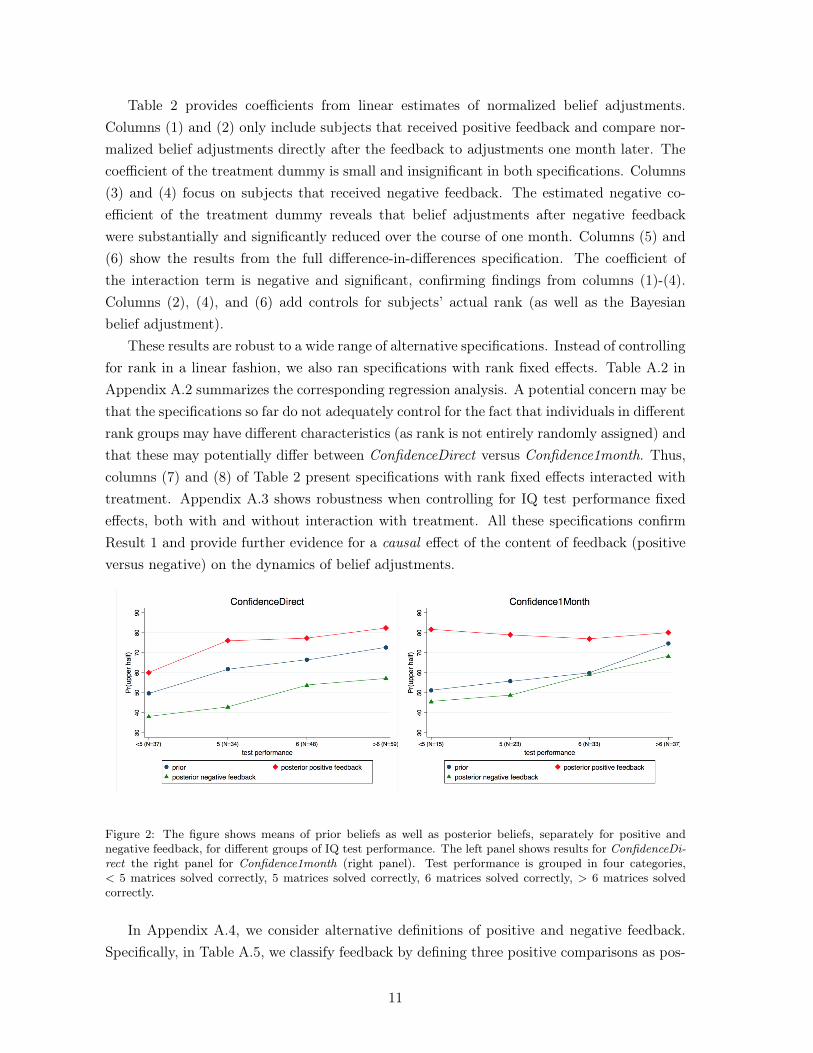
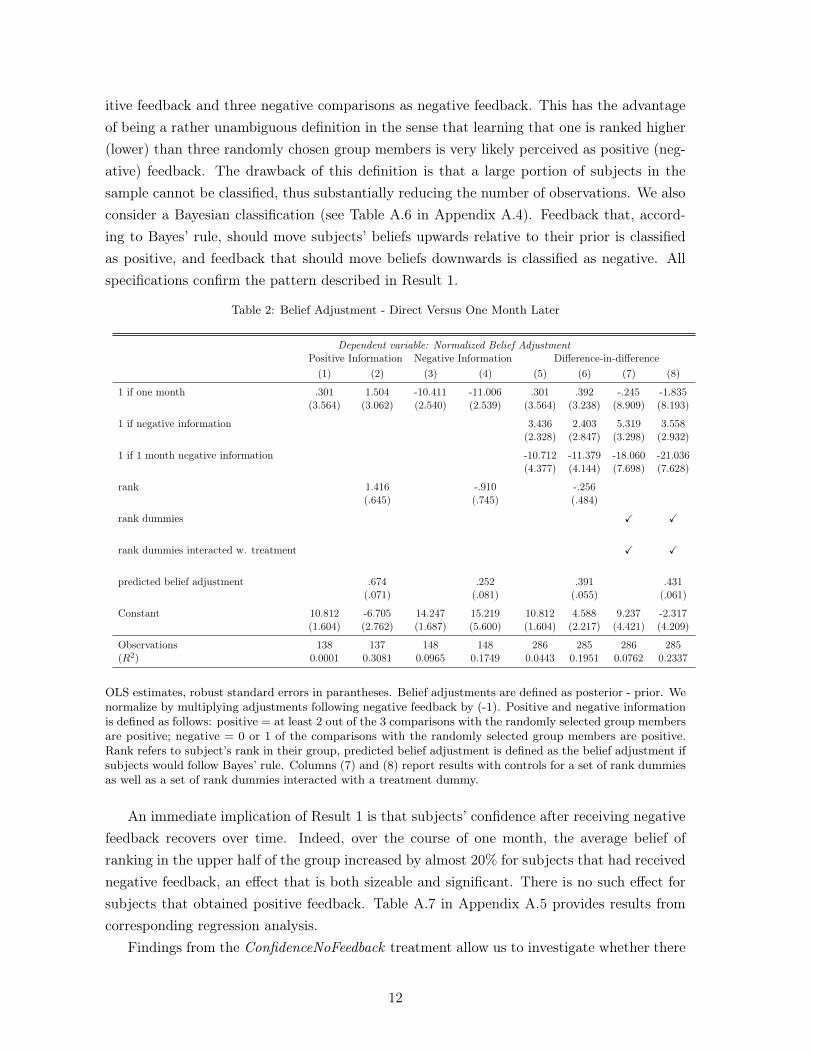
Table 2 provides coefficients from linear estimates of normalized belief adjustments.
Columns (1) and (2) only include subjects that received positive feedback and compare nor-
malized belief adjustments directly after the feedback to adjustments one month later. The
coefficient of the treatment dummy is small and insignificant in both specifications. Columns
(3) and (4) focus on subjects that received negative feedback. The estimated negative co-
efficient of the treatment dummy reveals that belief adjustments after negative feedback
were substantially and significantly reduced over the course of one month. Columns (5) and
(6) show the results from the full difference-in-differences specification. The coefficient of
the interaction term is negative and significant, confirming findings from columns (1)-(4).
Columns (2), (4), and (6) add controls for subjects’ actual rank (as well as the Bayesian
belief adjustment).
These results are robust to a wide range of alternative specifications. Instead of controlling
for rank in a linear fashion, we also ran specifications with rank fixed effects. Table A.2 in
Appendix A.2 summarizes the corresponding regression analysis. A potential concern may be
that the specifications so far do not adequately control for the fact that individuals in different
rank groups may have different characteristics (as rank is not entirely randomly assigned) and
that these may potentially differ between ConfidenceDirect versus Confidence1month. Thus,
columns (7) and (8) of Table 2 present specifications with rank fixed effects interacted with
treatment. Appendix A.3 shows robustness when controlling for IQ test performance fixed
effects, both with and without interaction with treatment. All these specifications confirm
Result 1 and provide further evidence for a causal effect of the content of feedback (positive
versus negative) on the dynamics of belief adjustments.
Figure 2: The figure shows means of prior beliefs as well as posterior beliefs, separately for positive andnegative feedback, for different groups of IQ test performance. The left panel shows results for ConfidenceDi-
rect the right panel for Confidence1month (right panel). Test performance is grouped in four categories,< 5 matrices solved correctly, 5 matrices solved correctly, 6 matrices solved correctly, > 6 matrices solvedcorrectly.
In Appendix A.4, we consider alternative definitions of positive and negative feedback.
Specifically, in Table A.5, we classify feedback by defining three positive comparisons as pos-
11
itive feedback and three negative comparisons as negative feedback. This has the advantage
of being a rather unambiguous definition in the sense that learning that one is ranked higher
(lower) than three randomly chosen group members is very likely perceived as positive (neg-
ative) feedback. The drawback of this definition is that a large portion of subjects in the
sample cannot be classified, thus substantially reducing the number of observations. We also
consider a Bayesian classification (see Table A.6 in Appendix A.4). Feedback that, accord-
ing to Bayes’ rule, should move subjects’ beliefs upwards relative to their prior is classified
as positive, and feedback that should move beliefs downwards is classified as negative. All
specifications confirm the pattern described in Result 1.
Table 2: Belief Adjustment - Direct Versus One Month Later
Dependent variable: Normalized Belief AdjustmentPositive Information Negative Information Difference-in-difference
(1) (2) (3) (4) (5) (6) (7) (8)
1 if one month .301 1.504 -10.411 -11.006 .301 .392 -.245 -1.835(3.564) (3.062) (2.540) (2.539) (3.564) (3.238) (8.909) (8.193)
1 if negative information 3.436 2.403 5.319 3.558(2.328) (2.847) (3.298) (2.932)
1 if 1 month negative information -10.712 -11.379 -18.060 -21.036(4.377) (4.144) (7.698) (7.628)
rank 1.416 -.910 -.256(.645) (.745) (.484)
rank dummies X X
rank dummies interacted w. treatment X X
predicted belief adjustment .674 .252 .391 .431(.071) (.081) (.055) (.061)
Constant 10.812 -6.705 14.247 15.219 10.812 4.588 9.237 -2.317(1.604) (2.762) (1.687) (5.600) (1.604) (2.217) (4.421) (4.209)
Observations 138 137 148 148 286 285 286 285(R2) 0.0001 0.3081 0.0965 0.1749 0.0443 0.1951 0.0762 0.2337
OLS estimates, robust standard errors in parantheses. Belief adjustments are defined as posterior - prior. Wenormalize by multiplying adjustments following negative feedback by (-1). Positive and negative informationis defined as follows: positive = at least 2 out of the 3 comparisons with the randomly selected group membersare positive; negative = 0 or 1 of the comparisons with the randomly selected group members are positive.Rank refers to subject’s rank in their group, predicted belief adjustment is defined as the belief adjustment ifsubjects would follow Bayes’ rule. Columns (7) and (8) report results with controls for a set of rank dummiesas well as a set of rank dummies interacted with a treatment dummy.
An immediate implication of Result 1 is that subjects’ confidence after receiving negative
feedback recovers over time. Indeed, over the course of one month, the average belief of
ranking in the upper half of the group increased by almost 20% for subjects that had received
negative feedback, an effect that is both sizeable and significant. There is no such effect for
subjects that obtained positive feedback. Table A.7 in Appendix A.5 provides results from
corresponding regression analysis.
Findings from the ConfidenceNoFeedback treatment allow us to investigate whether there
12
are systematic belief dynamics in the absence of feedback. Such dynamics could, for instance,
be due to exposure to information structures over the course of one month that generate an
upward trend in beliefs (see Benoît and Dubra, 2011). We find that over the course of one
month, about 31% of subjects adjusted their beliefs downwards and 33% adjusted their beliefs
upwards. The average estimate of the likelihood of ranking in the upper half of the group
elicited after one month is virtually identical to that one month before. This suggests that
over the time span we are considering, there were no systematic belief dynamics other than
those induced by the feedback. See Appendix A.7 for details.
While not the main focus of this paper, we can also analyze short-run updating more
closely. Note that from the left panel of Figure 1, it looks as if subjects have a greater
response to negative compared to positive feedback in the short run. This effect, however,
disappears once we control for the Bayesian prediction of how much people should adjust
their beliefs. In Appendix A.6, we analyze short-run updating in more detail. We find
conservatism in updating as in Möbius et al. (2013). Eil and Rao (2011) and Möbius et
al. (2013) identified an asymmetry in short-run updating, meaning that subjects put more
weight on positive compared to negative feedback. Recently, the evidence for asymmetric
processing of feedback has been mixed, and several papers have not found asymmetry (see
e.g., Barron, 2016; Coutts, 2016; Schwardmann and van der Weele, 2017). In our study, we
find only weak evidence for short-run asymmetry, and it tends to be insignificant in most
specifications.
3 The Role of Memory
We next seek to elucidate the driving forces underlying the dynamic pattern identified in
section 2. An intuitive candidate is selective recall. The notion that people may (selectively)
remember positive feedback better than negative feedback has been brought forward in the
theoretical literature (see Bénabou and Tirole, 2002, 2004) and would provide a natural
explanation for the asymmetric pattern of dynamic belief adjustment we identify.
3.1 Experimental Design
To investigate the prevalence of selective recall in our setting, we conducted the Recall treat-
ment (see Table 1), which was identical to Confidence1month except for the main outcome
measure. Instead of measuring beliefs one month after the feedback, we measured subjects’
recall accuracy. Specifically, one month after the feedback, we elicited the accuracy with
which subjects recalled the feedback they had received during the first session. We reminded
subjects that in the experiment they had participated in one month before, they were given
feedback about their rank in the group, namely three of the nine other group members had
randomly been selected and, for each of these three members, subjects had been informed
about whether they ranked higher or lower than the respective member.
13
We asked subjects how many of the three comparisons were positive. Possible answers
were “0”, “1”, “2”, and “3”, and subjects were also given the option to state “I don’t recall”.
They received 2 Euros if their answer was correct.13
All other aspects of the design were identical to Confidence1month. A total of 119 subjects
participated in the Recall treatment.14 Experimental sessions took on average about 50
minutes. The second sessions took about 30 minutes. The experiments were conducted in
January and February 2016 at the BonnEconLab. Subjects were mainly students from the
University of Bonn and were recruited using the hroot online recruitment system (Bock,
Baetge and Nicklisch, 2014). The experiments were computerized using z-tree experimental
software (Fischbacher, 2007) and the Qualtrics online survey tool.
3.2 Results
3.2.1 Main Findings
Result 2. Subjects recall negative feedback with less accuracy, compared to positive feedback.
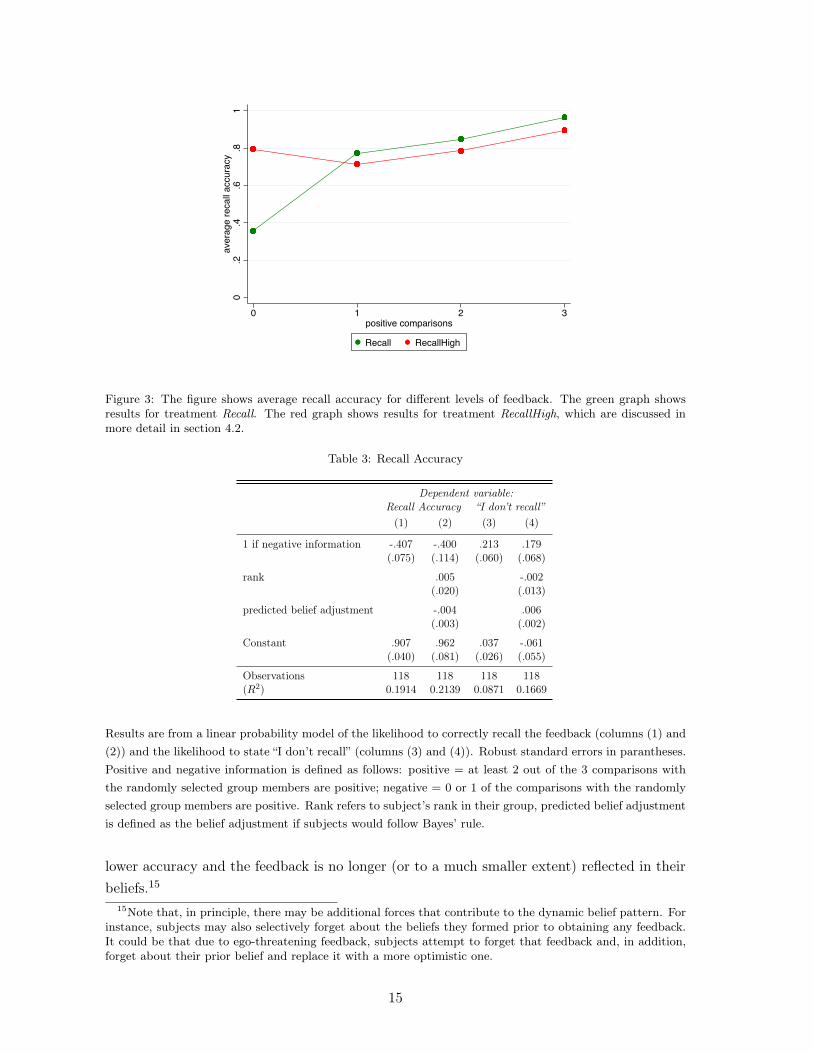
We first analyze the overall accuracy of recall after one month. Figure 3 depicts average
recall accuracy for the different leves of feedback. As can be inferred from the graph (green
line), recall accuracy substantially decreases as we move from positive feedback (two or three
postive comparisons) to negative feedback (zero or one positive comparison). In Table 3
we move to more formal analysis. Columns (1) and (2) of Table 3 provide coefficients from
estimating a linear probability model of the probability that feedback is correctly recalled
on a dummy variable for positive or negative feedback. The estimated negative coefficients
of the feedback dummy reveal that subjects that obtained negative feedback recall that
feedback with significantly less accuracy one month later, compared to subjects that received
positive feedback. Column (2) adds controls for rank, thereby allowing a causal interpretation
of the recall pattern, and the predicted (Bayesian) belief adjustment. These findings are
robust to a wide range of alternative specifications. Tables B.1 and B.2 in Appendix B.1
summarize regressions controlling for rank fixed effects. In Appendix B.2, we control for
IQ test performance fixed effects. In Appendix B.3, we consider alternative definitions of
positive and negative feedback.
Note that we also asked subjects at the end of the first session if they recalled the feedback
about 20 minutes after they received it. All but one subject in the Recall treatment correctly
remembered the feedback at that point. This confirms the dynamic belief pattern we saw in
section 2. When the feedback is relatively fresh in subjects’ minds, they do remember it, and,
as seen in section 2, it is reflected in their beliefs. Over the course of one month, however,
subjects appear to dissociate from negative feedback. As a consequence, they recall it with
13Thus, the option “I don’t recall” was payoff-dominated as it ensured a payoff of zero.14We again tried very hard to reduce attrition to a minimum. Only one subject that participated in the
first session of treatment Recall did not participate in the second session.
14
0.2.4.6
.81average recal
l accuracy0 1 2 3positive comparisonsRecall RecallHigh
Figure 3: The figure shows average recall accuracy for different levels of feedback. The green graph showsresults for treatment Recall. The red graph shows results for treatment RecallHigh, which are discussed inmore detail in section 4.2.
Table 3: Recall Accuracy
Dependent variable:Recall Accuracy “I don’t recall”
(1) (2) (3) (4)
1 if negative information -.407 -.400 .213 .179(.075) (.114) (.060) (.068)
rank .005 -.002(.020) (.013)
predicted belief adjustment -.004 .006(.003) (.002)
Constant .907 .962 .037 -.061(.040) (.081) (.026) (.055)
Observations 118 118 118 118(R2) 0.1914 0.2139 0.0871 0.1669
Results are from a linear probability model of the likelihood to correctly recall the feedback (columns (1) and
(2)) and the likelihood to state “I don’t recall” (columns (3) and (4)). Robust standard errors in parantheses.
Positive and negative information is defined as follows: positive = at least 2 out of the 3 comparisons with
the randomly selected group members are positive; negative = 0 or 1 of the comparisons with the randomly
selected group members are positive. Rank refers to subject’s rank in their group, predicted belief adjustment
is defined as the belief adjustment if subjects would follow Bayes’ rule.
lower accuracy and the feedback is no longer (or to a much smaller extent) reflected in their
beliefs.15
15Note that, in principle, there may be additional forces that contribute to the dynamic belief pattern. Forinstance, subjects may also selectively forget about the beliefs they formed prior to obtaining any feedback.It could be that due to ego-threatening feedback, subjects attempt to forget that feedback and, in addition,forget about their prior belief and replace it with a more optimistic one.
15
In terms of the direction of recall bias, we find that subjects that received negative
feedback tended to misremember in an optimistic fashion. Table B.7 in Appendix B.4 sum-
marizes results from regression analysis, where we regress the difference between the number
of positive comparisons subjects recalled and the actual number of positive comparisons on a
feedback dummy. It can be inferred that subjects that received negative feedback systemati-
cally misremember in an optimistic way. In other words, they tend to recall having received
more positive comparisons than they actually did (see Appendix B.4 for details).
Result 2 provides direct evidence for key assumptions in the “supply side” model of moti-
vated reasoning by Bénabou and Tirole (2002).16 Chew et al. (2018) extended this model. In
their model, in addition to forgetting past events, people can also misremember events (“con-
fabulation”) and invent events that never happened (“delusion”). The authors also conducted
a lab experiment to test for the existence of these memory distortions and to study their
relationship with present bias and anticipatory utility.17 Their study sets a different focus
than ours. They did not study belief dynamics, the underlying mechanisms of selective recall,
or the role of incentives for selective recall. While the findings in Chew et al. (2018) nicely
relate to our Result 2, our design allows us to establish a causal relation between feedback
and recall accuracy and separates selective recall from inattention and information process-
ing. Huffman et al. (2018) studied overconfidence in a field setting with store managers. The
study provides evidence of persistent overconfidence among managers. Their findings also
suggest that managers have overly-positive memories about past negative feedback.18
We proceed by studying the underlying mechanisms of the recall pattern we identified.
3.2.2 Mechanisms
The first question we ask is whether unwanted experiences are actually erased from memory,
or whether they are instead suppressed. While the memory literature argues that actual
16In Bénabou and Tirole (2002), agents can distort their beliefs by forgetting unpleasant feedback. In anutshell, their model has two key components: first, the ability of agents to suppress signals that threatentheir self-confidence and second, a notion of metacognition where the agent’s future self attempts to formaccurate beliefs based on what he/she recalls. Metacognition can be fully sophisticated in the sense that thefuture self is aware that recall may be self-servingly biased and makes inferences in a fully Bayesian fashion.It can also be fully naïve (e.g., the future self takes at face value the content of its memory) or lie somewherein between sophistication and naïveté. Our study was designed to provide a direct and causal assessment ofsubjects’ ability to suppress unpleasant feedback, thereby testing a key assumption in Bénabou and Tirole(2002). Our design is not well-suited to precisely measure the degree of sophistication of the future self, partlybecause in our setting, subjects at the time of recall very likely continue to have ego-related benefits fromself-deception, while in Bénabou and Tirole (2002), the future self attempts to develop accurate beliefs.
17Mischel et al. (1976) studied the effect of current affective state on the recall of positive and negativeinformation about personality traits. They found that subjects in a positive affective state tend to have betterrecall of positive personality traits, while subjects in a negative affective state exhibit the opposite pattern.Kouchaki and Gino (2016) and Saucet and Villeval (2018) studied recall of past prosocial behavior and foundthat people recall their own past ethical behavior more accurately than unethical behavior. See also Li (2013)for a study on recall of behavior in social interactions.
18Findings in Huffman et al. (2018) nicely complement our results. While in their field setting, they arenot able to establish causality, compare short-run versus long-run updating, or study underlying mechanisms,their paper provides field-type evidence for overconfidence and selective recall in an important domain ofeconomic decision-making.
16
erasure from memory (in the sense that no memory traces are left) is very unlikely (Kahana,
2012), it emphasizes that people can suppress memory traces. Specifically, it appears that
people can suppress unwanted memories, such that they do not enter into daily reasoning
(see e.g., Anderson and Levy, 2009 and Benoit and Anderson, 2012). The frequency with
which subjects selected the payoff-dominated option “I don’t recall” may shed some light on
this; stating “I don’t recall” could allow subjects to suppress or dissociate themselves from
the negative feedback they received and ensure it does not enter mental awareness. At the
same time, subjects that erased negative feedback from their memory might as well guess
rather than clicking “I don’t recall”, as this would yield a higher expected payoff.
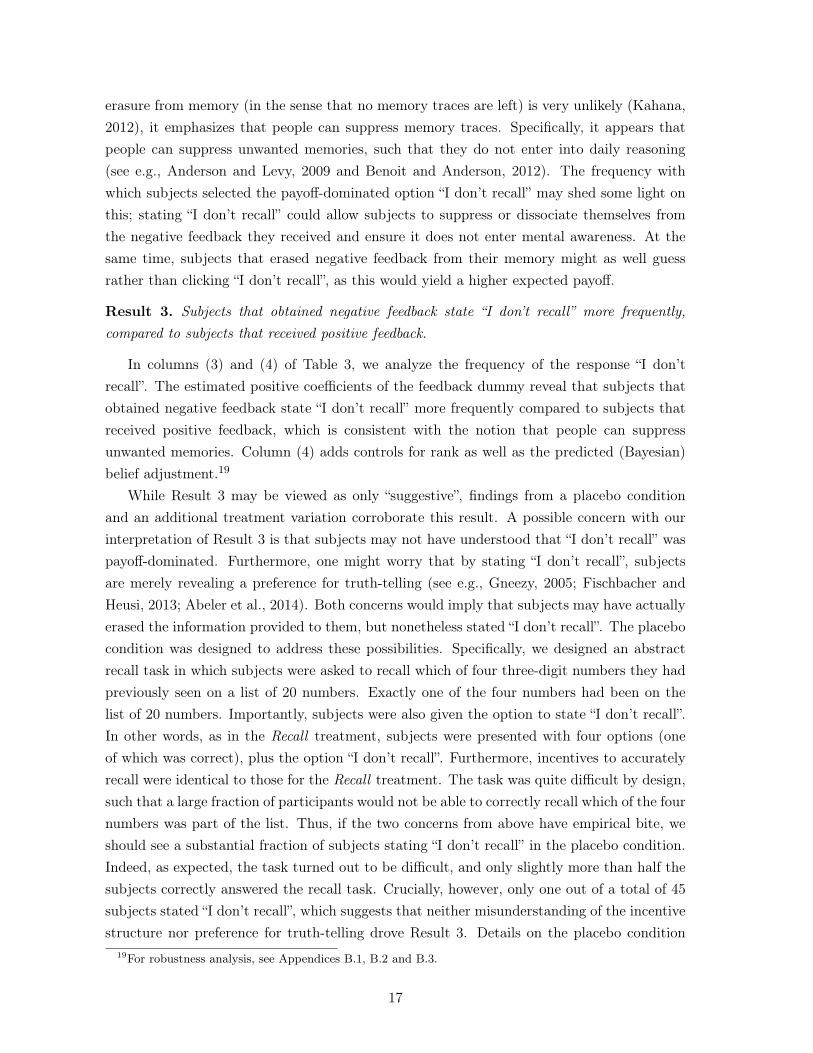
Result 3. Subjects that obtained negative feedback state “I don’t recall” more frequently,
compared to subjects that received positive feedback.
In columns (3) and (4) of Table 3, we analyze the frequency of the response “I don’t
recall”. The estimated positive coefficients of the feedback dummy reveal that subjects that
obtained negative feedback state “I don’t recall” more frequently compared to subjects that
received positive feedback, which is consistent with the notion that people can suppress
unwanted memories. Column (4) adds controls for rank as well as the predicted (Bayesian)
belief adjustment.19
While Result 3 may be viewed as only “suggestive”, findings from a placebo condition
and an additional treatment variation corroborate this result. A possible concern with our
interpretation of Result 3 is that subjects may not have understood that “I don’t recall” was
payoff-dominated. Furthermore, one might worry that by stating “I don’t recall”, subjects
are merely revealing a preference for truth-telling (see e.g., Gneezy, 2005; Fischbacher and
Heusi, 2013; Abeler et al., 2014). Both concerns would imply that subjects may have actually
erased the information provided to them, but nonetheless stated “I don’t recall”. The placebo
condition was designed to address these possibilities. Specifically, we designed an abstract
recall task in which subjects were asked to recall which of four three-digit numbers they had
previously seen on a list of 20 numbers. Exactly one of the four numbers had been on the
list of 20 numbers. Importantly, subjects were also given the option to state “I don’t recall”.
In other words, as in the Recall treatment, subjects were presented with four options (one
of which was correct), plus the option “I don’t recall”. Furthermore, incentives to accurately
recall were identical to those for the Recall treatment. The task was quite difficult by design,
such that a large fraction of participants would not be able to correctly recall which of the four
numbers was part of the list. Thus, if the two concerns from above have empirical bite, we
should see a substantial fraction of subjects stating “I don’t recall” in the placebo condition.
Indeed, as expected, the task turned out to be difficult, and only slightly more than half the
subjects correctly answered the recall task. Crucially, however, only one out of a total of 45
subjects stated “I don’t recall”, which suggests that neither misunderstanding of the incentive
structure nor preference for truth-telling drove Result 3. Details on the placebo condition
19For robustness analysis, see Appendices B.1, B.2 and B.3.
17
and the corresponding results are provided in Appendix B.5. In section 4, we present results
from a high-stakes recall condition that further corroborate the notion that people suppress
unwanted memories, rather than erasing them from memory.
In light of these findings, the second question we ask is how people manage to suppress
negative feedback. To make progress in addressing this question, we build on a fundamental
principle in memory research that states that recall is associative, meaning that the recall
of a memory trace is triggered by cues that are mentally associated with the trace (see e.g.,
Kahana, 2012; Bordalo, Gennaioli and Shleifer, 2017). This implies that to suppress the
recall of a certain memory trace, people also need to suppress cues that may trigger recall
of that trace. Applying this to our context, it seems likely that thinking about the IQ test
triggers the recall of the received feedback; thus, the principle of associative recall suggests
that subjects who want to suppress recall of the feedback also need to suppress the IQ test
more broadly.
To formally investigate this, we consider an alternative measure of recall. Instead of
focusing on recall accuracy of the feedback, we asked subjects how well they recalled the
experiment overall. Remember that the first experimental session for the Recall treatment
consisted of six different parts. Two of these parts were related to the IQ test, while four were
completely unrelated to it. In the session one month later, before eliciting recall accuracy of
the feedback, we asked subjects to describe as many parts of the experiment as they could.
Specifically, before asking subjects in the Recall treatment if they accurately remembered
the feedback, we asked them if they recalled the different parts of the session one month ago.
Subjects were asked to describe each part they recalled from the session one month ago in
one sentence. This was implemented with paper and pencil, and subjects obtained one Euro
for each sufficiently accurate description.20
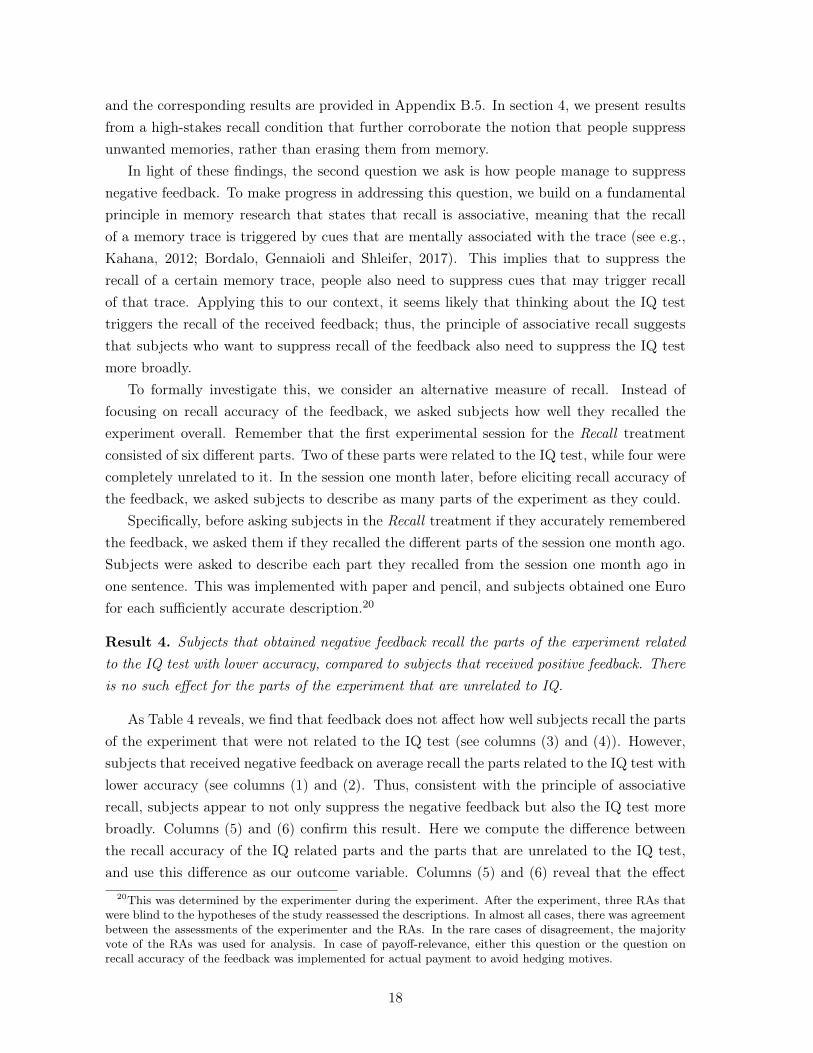
Result 4. Subjects that obtained negative feedback recall the parts of the experiment related
to the IQ test with lower accuracy, compared to subjects that received positive feedback. There
is no such effect for the parts of the experiment that are unrelated to IQ.
As Table 4 reveals, we find that feedback does not affect how well subjects recall the parts
of the experiment that were not related to the IQ test (see columns (3) and (4)). However,
subjects that received negative feedback on average recall the parts related to the IQ test with
lower accuracy (see columns (1) and (2). Thus, consistent with the principle of associative
recall, subjects appear to not only suppress the negative feedback but also the IQ test more
broadly. Columns (5) and (6) confirm this result. Here we compute the difference between
the recall accuracy of the IQ related parts and the parts that are unrelated to the IQ test,
and use this difference as our outcome variable. Columns (5) and (6) reveal that the effect
20This was determined by the experimenter during the experiment. After the experiment, three RAs thatwere blind to the hypotheses of the study reassessed the descriptions. In almost all cases, there was agreementbetween the assessments of the experimenter and the RAs. In the rare cases of disagreement, the majorityvote of the RAs was used for analysis. In case of payoff-relevance, either this question or the question onrecall accuracy of the feedback was implemented for actual payment to avoid hedging motives.
18
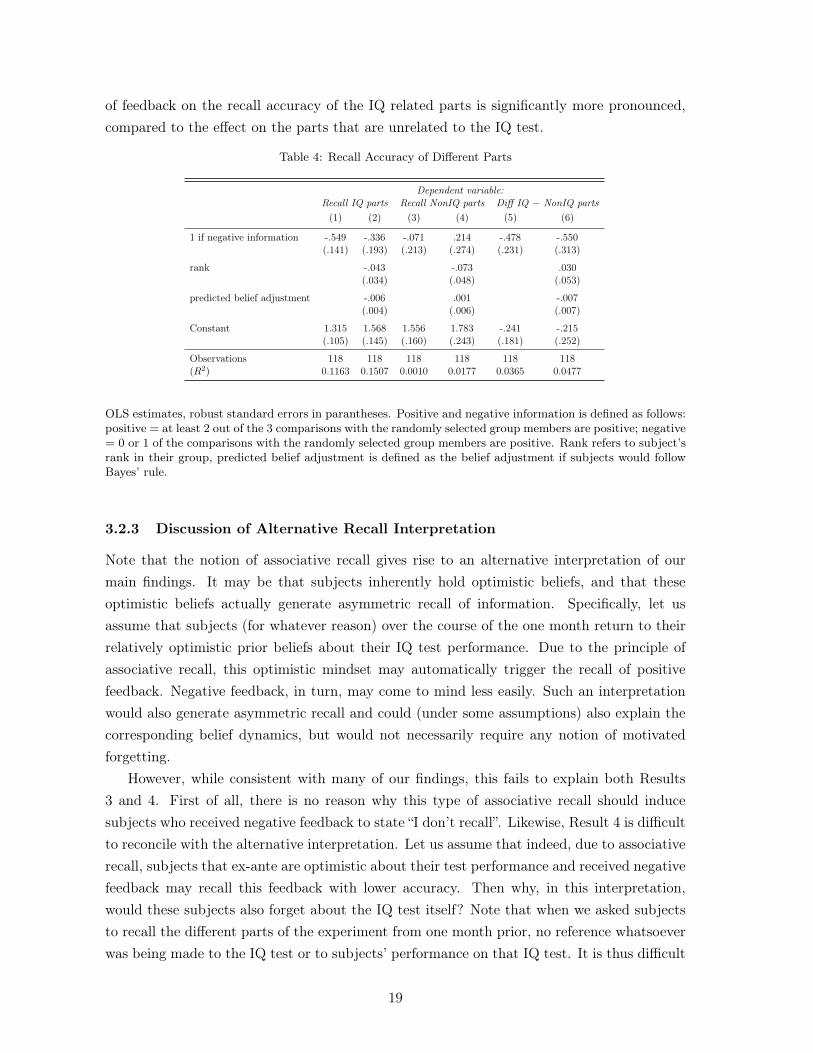
of feedback on the recall accuracy of the IQ related parts is significantly more pronounced,
compared to the effect on the parts that are unrelated to the IQ test.
Table 4: Recall Accuracy of Different Parts
Dependent variable:Recall IQ parts Recall NonIQ parts Diff IQ − NonIQ parts
(1) (2) (3) (4) (5) (6)
1 if negative information -.549 -.336 -.071 .214 -.478 -.550(.141) (.193) (.213) (.274) (.231) (.313)
rank -.043 -.073 .030(.034) (.048) (.053)
predicted belief adjustment -.006 .001 -.007(.004) (.006) (.007)
Constant 1.315 1.568 1.556 1.783 -.241 -.215(.105) (.145) (.160) (.243) (.181) (.252)
Observations 118 118 118 118 118 118(R2) 0.1163 0.1507 0.0010 0.0177 0.0365 0.0477
OLS estimates, robust standard errors in parantheses. Positive and negative information is defined as follows:positive = at least 2 out of the 3 comparisons with the randomly selected group members are positive; negative= 0 or 1 of the comparisons with the randomly selected group members are positive. Rank refers to subject’srank in their group, predicted belief adjustment is defined as the belief adjustment if subjects would followBayes’ rule.
3.2.3 Discussion of Alternative Recall Interpretation
Note that the notion of associative recall gives rise to an alternative interpretation of our
main findings. It may be that subjects inherently hold optimistic beliefs, and that these
optimistic beliefs actually generate asymmetric recall of information. Specifically, let us
assume that subjects (for whatever reason) over the course of the one month return to their
relatively optimistic prior beliefs about their IQ test performance. Due to the principle of
associative recall, this optimistic mindset may automatically trigger the recall of positive
feedback. Negative feedback, in turn, may come to mind less easily. Such an interpretation
would also generate asymmetric recall and could (under some assumptions) also explain the
corresponding belief dynamics, but would not necessarily require any notion of motivated
forgetting.
However, while consistent with many of our findings, this fails to explain both Results
3 and 4. First of all, there is no reason why this type of associative recall should induce
subjects who received negative feedback to state “I don’t recall”. Likewise, Result 4 is difficult
to reconcile with the alternative interpretation. Let us assume that indeed, due to associative
recall, subjects that ex-ante are optimistic about their test performance and received negative
feedback may recall this feedback with lower accuracy. Then why, in this interpretation,
would these subjects also forget about the IQ test itself? Note that when we asked subjects
to recall the different parts of the experiment from one month prior, no reference whatsoever
was being made to the IQ test or to subjects’ performance on that IQ test. It is thus difficult
19
to imagine an associative link between being optimistic or pessimistic about IQ and recall
accuracy of the different parts of the experiment from one month prior.
To further assess the empirical validity of this interpretation, we test what may be its most
direct implication. If people return to their priors and positive priors generate positive recall,
then we should not see an asymmetric recall pattern for subjects with rather pessimistic
priors. In fact, for people with a more pessimistic mindset, we should even see the opposite
asymmetry, that negative priors cause negative recall. Table B.8 in Appendix B.6 looks at
this prediction more closely. Columns (1) and (2) show selective recall based on all subjects
from the Recall treatment and thus simply replicate columns (1) and (2) from Table 3. In
columns (3) - (6), we focus only on those subjects that hold rather pessimistic priors about
their relative IQ. As the table reveals, ex-ante pessimistic subjects also show asymmetric recall
of the form that they tend to recall positive feedback more accurately. While fully consistent
with a motivated recall story, this seems at odds with the alternative interpretation.
4 The Trade-off Between Motivated and Accurate Beliefs
The results we have presented so far indicate both a desire and a remarkable ability of sub-
jects to suppress feedback that threatens their confidence. At the same time, the theoretical
literature (Brunnermeier and Parker, 2005 and Bénabou and Tirole, 2002) as well as basic
intuition suggests that the degree to which people deceive themselves is limited by a simple
but powerful trade-off. While belief-based utility pulls people towards self-deception, stan-
dard outcome-based utility creates incentives for belief accuracy. In this section, we seek to
elucidate the role of incentives for accuracy and shed light on this trade-off. In doing so, we
distinguish two conceptually different ways in which incentives might matter, both of which
are intimately linked to the way memory operates. Very roughly, memory processes can be
conceptualized in two steps: (i) encoding of signals, both initially and in intermediate periods
through rehearsal, and (ii) retrieval of signals. Incentives can matter for both steps. Subject
that anticipate high future incentives for belief accuracy may try to achieve accuracy via
intensive encoding of feedback (e.g. rehearsing, writing things down), which then facilitates
retrieval. At the same time, surprise incentives for belief accuracy can also be effective. In a
situation where a subject did not invest in intensive encoding or even tried to suppress pieces
of information, recall can nonetheless be accurate if surprise incentives induce high effort in
the retrieval process.
Thus, incentives for belief accuracy may affect the way subjects deal with feedback in two
distinct ways. First, if subjects, at the time they receive the feedback, expect substantial
future benefits from belief accuracy, this may change the way they encode the feedback
(i.e., they may not attempt to suppress it but rather invest in intense encoding). Second,
unexpected incentives at the time of retrieval may induce subjects to put more effort into
the retrieval of suppressed feedback, thereby improving belief accuracy. We conducted the
Announcement and RecallHigh treatments to address these two channels.
20
4.1 Announcement
Note that, so far, the belief elicitation or recall accuracy tasks that were conducted after
feedback always came as a surprise as they were not announced beforehand. Our findings
suggest that in such contexts, people set their mind to suppress negative feedback. In the
following, we ask if we can change this mindset by announcing, during the first lab session,
that in one month we will conduct a belief elicitation task, thereby possibly changing the
way people encode and rehearse feedback.
We conducted the Announcement treatment to address this question (see Table 1). The
purpose of the treatment was to make the costs from self-deception salient by announcing the
belief elicitation task. The treatment was based on Confidence1month, with the key difference
being that we announced at the first lab meeting that in one month, subjects would need to
assess the likelihood that they rank in the upper half of the group of 10. We kept the specific
incentives of the belief elicitation task vague, but we emphasized that it would be important
for subjects to be able to precisely estimate how well they did on the IQ test compared to
the other group members. The belief elicitation task was announced during the first session,
after subjects received feedback. In addition, subjects were reminded in a letter they received
at the end of the first session.21
All other aspects of the design, including the actual belief elicitation task one month later,
were identical to Confidence1month. A total of 115 subjects participated in the Announce-
ment treatment.22 The first experimental session took on average about 50 minutes. The
second session took about 35 minutes. The experiments were conducted in October 2017
at the BonnEconLab. Subjects were mainly students from the University of Bonn and were
recruited using the hroot online recruitment system (Bock, Baetge and Nicklisch, 2014). The
experiments were computerized using z-tree experimental software (Fischbacher, 2007) and
the Qualtrics online survey tool.
Result 5. The announcement of the belief elicitation task changes the dynamics of belief
adjustment. One month after the feedback, negative (like positive) feedback is still reflected in
beliefs.
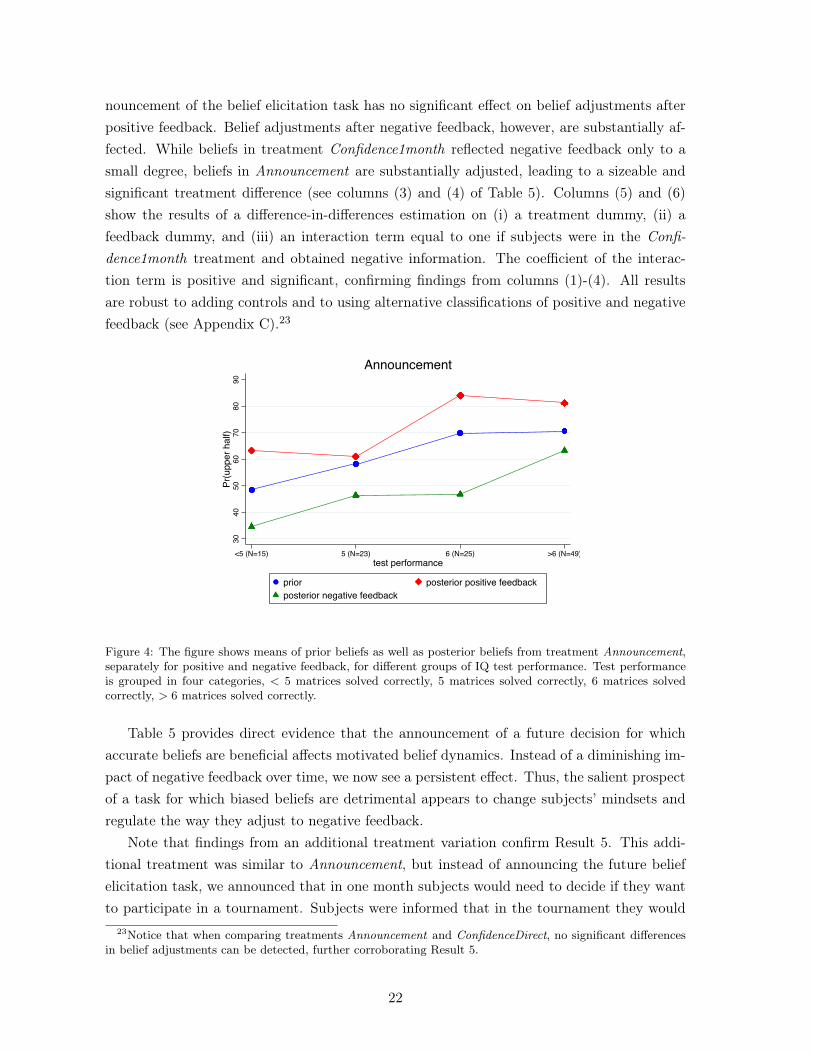
Figure 4 summarizes results from treatment Announcement. Repeating the logic under-
lying Figure 2, the figure shows average priors and average posteriors (separately for negative
feedback and positive feedback) for different levels of test performance. As can be inferred,
in contrast to treatment Confidence1month, negative feedback in treatment Announcement
is still reflected in beliefs one month after the feedback.
In Table 5 we formally compare belief adjustments after one month between treatment
Announcement and treatment Confidence1month. Columns (1) and (2) reveal that the an-
21Note that all subjects from the Confidence1month, ConfidenceNoFeedback, Recall, and Announcement
treatments received such a letter. The letter reminded them about the second experimental session. Inaddition, in the Announcement treatment, they were reminded about the belief elicitation task.
22There was no attrition; all subjects that showed up to the first experimental session also participated inthe second experimental session.
21
nouncement of the belief elicitation task has no significant effect on belief adjustments after
positive feedback. Belief adjustments after negative feedback, however, are substantially af-
fected. While beliefs in treatment Confidence1month reflected negative feedback only to a
small degree, beliefs in Announcement are substantially adjusted, leading to a sizeable and
significant treatment difference (see columns (3) and (4) of Table 5). Columns (5) and (6)
show the results of a difference-in-differences estimation on (i) a treatment dummy, (ii) a
feedback dummy, and (iii) an interaction term equal to one if subjects were in the Confi-
dence1month treatment and obtained negative information. The coefficient of the interac-
tion term is positive and significant, confirming findings from columns (1)-(4). All results
are robust to adding controls and to using alternative classifications of positive and negative
feedback (see Appendix C).23
30405060
708090
Pr(upper half)
<5 (N=15) 5 (N=23) 6 (N=25) >6 (N=49)test performanceprior posterior positive feedbackposterior negative feedback
Announcement
Figure 4: The figure shows means of prior beliefs as well as posterior beliefs from treatment Announcement,separately for positive and negative feedback, for different groups of IQ test performance. Test performanceis grouped in four categories, < 5 matrices solved correctly, 5 matrices solved correctly, 6 matrices solvedcorrectly, > 6 matrices solved correctly.
Table 5 provides direct evidence that the announcement of a future decision for which
accurate beliefs are beneficial affects motivated belief dynamics. Instead of a diminishing im-
pact of negative feedback over time, we now see a persistent effect. Thus, the salient prospect
of a task for which biased beliefs are detrimental appears to change subjects’ mindsets and
regulate the way they adjust to negative feedback.
Note that findings from an additional treatment variation confirm Result 5. This addi-
tional treatment was similar to Announcement, but instead of announcing the future belief
elicitation task, we announced that in one month subjects would need to decide if they want
to participate in a tournament. Subjects were informed that in the tournament they would
23Notice that when comparing treatments Announcement and ConfidenceDirect, no significant differencesin belief adjustments can be detected, further corroborating Result 5.
22
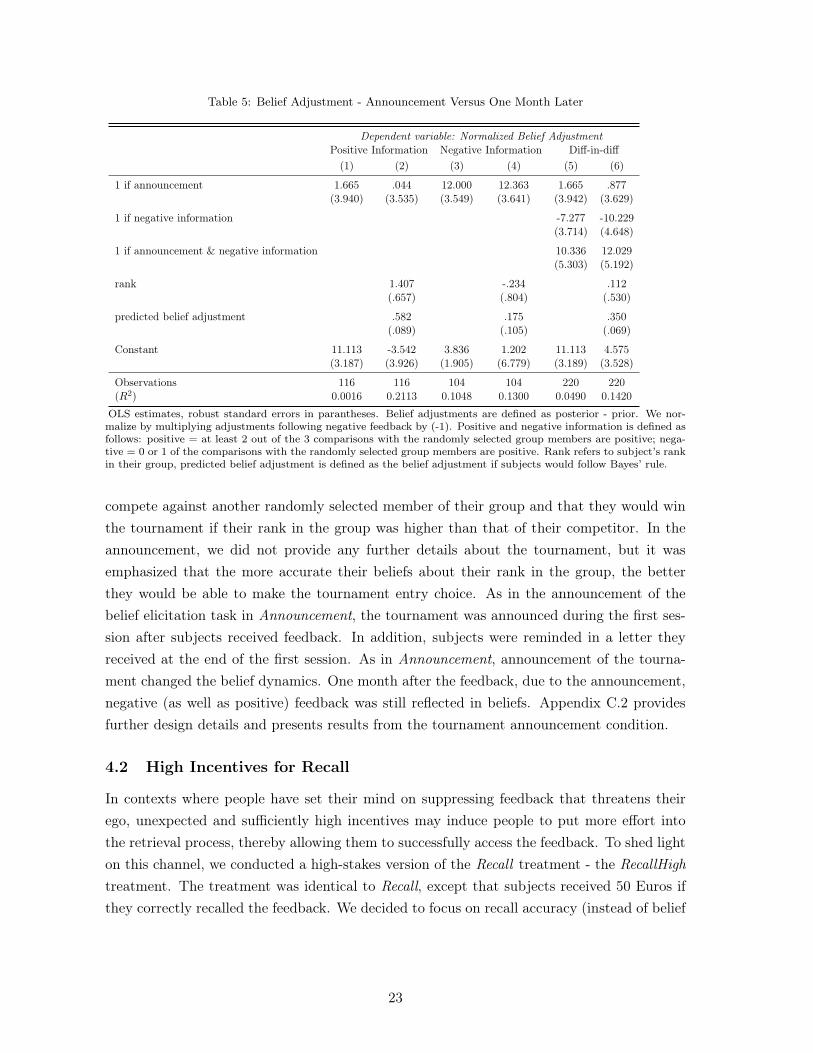
Table 5: Belief Adjustment - Announcement Versus One Month Later
Dependent variable: Normalized Belief AdjustmentPositive Information Negative Information Diff-in-diff
(1) (2) (3) (4) (5) (6)
1 if announcement 1.665 .044 12.000 12.363 1.665 .877(3.940) (3.535) (3.549) (3.641) (3.942) (3.629)
1 if negative information -7.277 -10.229(3.714) (4.648)
1 if announcement & negative information 10.336 12.029(5.303) (5.192)
rank 1.407 -.234 .112(.657) (.804) (.530)
predicted belief adjustment .582 .175 .350(.089) (.105) (.069)
Constant 11.113 -3.542 3.836 1.202 11.113 4.575(3.187) (3.926) (1.905) (6.779) (3.189) (3.528)
Observations 116 116 104 104 220 220(R2) 0.0016 0.2113 0.1048 0.1300 0.0490 0.1420
OLS estimates, robust standard errors in parantheses. Belief adjustments are defined as posterior - prior. We nor-malize by multiplying adjustments following negative feedback by (-1). Positive and negative information is defined asfollows: positive = at least 2 out of the 3 comparisons with the randomly selected group members are positive; nega-tive = 0 or 1 of the comparisons with the randomly selected group members are positive. Rank refers to subject’s rankin their group, predicted belief adjustment is defined as the belief adjustment if subjects would follow Bayes’ rule.
compete against another randomly selected member of their group and that they would win
the tournament if their rank in the group was higher than that of their competitor. In the
announcement, we did not provide any further details about the tournament, but it was
emphasized that the more accurate their beliefs about their rank in the group, the better
they would be able to make the tournament entry choice. As in the announcement of the
belief elicitation task in Announcement, the tournament was announced during the first ses-
sion after subjects received feedback. In addition, subjects were reminded in a letter they
received at the end of the first session. As in Announcement, announcement of the tourna-
ment changed the belief dynamics. One month after the feedback, due to the announcement,
negative (as well as positive) feedback was still reflected in beliefs. Appendix C.2 provides
further design details and presents results from the tournament announcement condition.
4.2 High Incentives for Recall
In contexts where people have set their mind on suppressing feedback that threatens their
ego, unexpected and sufficiently high incentives may induce people to put more effort into
the retrieval process, thereby allowing them to successfully access the feedback. To shed light
on this channel, we conducted a high-stakes version of the Recall treatment - the RecallHigh
treatment. The treatment was identical to Recall, except that subjects received 50 Euros if
they correctly recalled the feedback. We decided to focus on recall accuracy (instead of belief
23
adjustment) because it directly corresponds to the notion of “digging out” memory traces.24
A total of 115 subjects participated in the high-stakes recall condition. All other aspects
of the design were identical to Recall.25 The first experimental session took on average about
50 minutes. The second session took about 35 minutes. The experiments were conducted
in October 2017 at the BonnEconLab. Subjects were mainly students from the University
of Bonn and were recruited using the hroot online recruitment system (Bock, Baetge and
Nicklisch, 2014). The experiments were computerized using z-tree experimental software
(Fischbacher, 2007) and the Qualtrics online survey tool.
Result 6. Higher incentives significantly improve the recall accuracy of subjects that received
negative feedback
The red graph in Figure 3 depicts average recall accuracy for the different leves of feedback
in treatment RecallHigh. As can be seen, the graph is relatively flat. Thus, different to findings
from treatment Recall, recall accuracy in treatment RecallHigh does not seem to depend on
the feedback received. Table 6 formally compares the recall accuracy between treatment
Recall and the high stakes condition. In columns (1) and (2), we compare the recall accuracy
after positive feedback and show that accuracy is not significantly affected by stakes size.
For negative feedback, however, recall accuracy is substantially larger when stakes are high
(see columns (3) and (4)). Columns (5) and (6) show the results of a difference-in-difference
estimation on (i) a treatment dummy, (ii) a feedback dummy, and (iii) an interaction term
equal to one if subjects were in the high stakes condition treatment and obtained negative
information. The coefficient of the interaction term is positive and significant, confirming
findings from columns (1)-(4). Appendix C.3 provides further details on the high stakes
condition and demonstrates the robustness of this result.26
In addition to highlighting the important role of incentives, Result 6 further substantiates
our finding that subjects seem to suppress negative feedback, rather than erasing it from
their memory. The notion of suppressing implies that sufficiently high incentives may induce
subjects to dig out suppressed memory traces. If, in turn, subjects were entirely erasing
negative feedback, then high incentives for recall should not improve the accuracy of recall.
24Note that in RecallHigh, we elicited only our main recall measure; we did not ask subjects to recall thedifferent parts of the experiment.
25In RecallHigh, only one subject did not participate in the second lab meeting one month later, so again,attrition was very low.
26Further notice that in treatment RecallHigh, no significant asymmetry in recall accuracy between positiveand negative feedback can be detected.
24
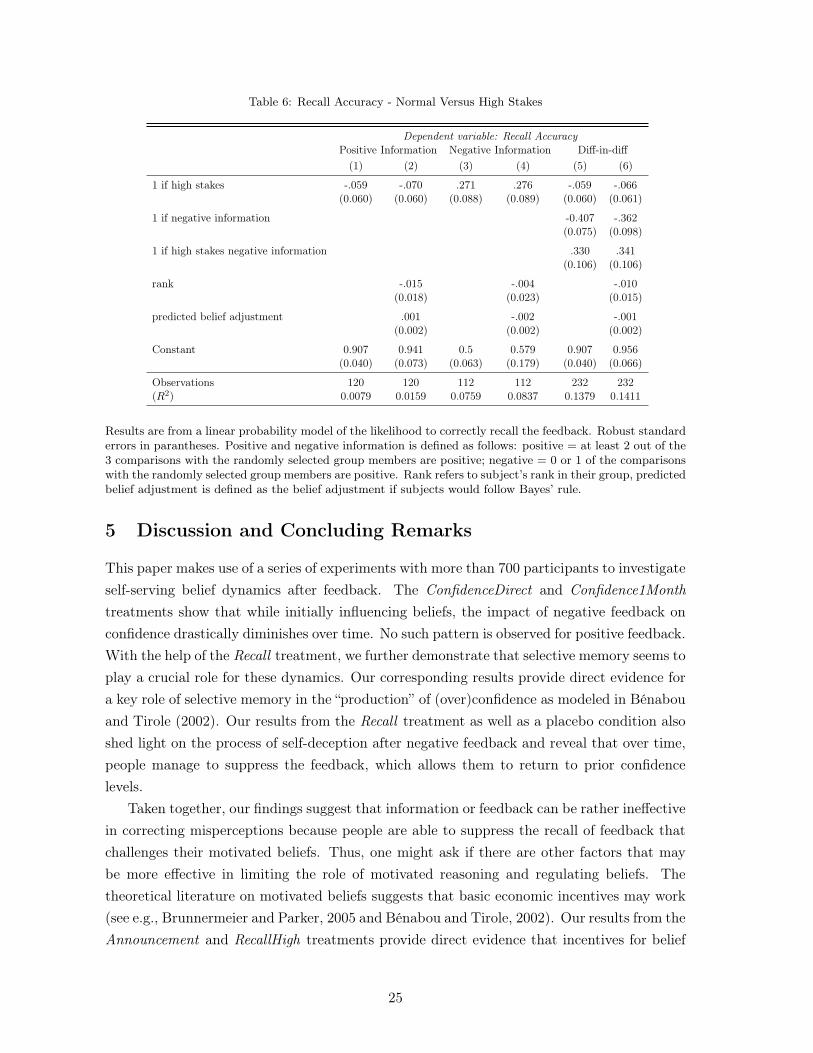
Table 6: Recall Accuracy - Normal Versus High Stakes
Dependent variable: Recall AccuracyPositive Information Negative Information Diff-in-diff
(1) (2) (3) (4) (5) (6)
1 if high stakes -.059 -.070 .271 .276 -.059 -.066(0.060) (0.060) (0.088) (0.089) (0.060) (0.061)
1 if negative information -0.407 -.362(0.075) (0.098)
1 if high stakes negative information .330 .341(0.106) (0.106)
rank -.015 -.004 -.010(0.018) (0.023) (0.015)
predicted belief adjustment .001 -.002 -.001(0.002) (0.002) (0.002)
Constant 0.907 0.941 0.5 0.579 0.907 0.956(0.040) (0.073) (0.063) (0.179) (0.040) (0.066)
Observations 120 120 112 112 232 232(R2) 0.0079 0.0159 0.0759 0.0837 0.1379 0.1411
Results are from a linear probability model of the likelihood to correctly recall the feedback. Robust standarderrors in parantheses. Positive and negative information is defined as follows: positive = at least 2 out of the3 comparisons with the randomly selected group members are positive; negative = 0 or 1 of the comparisonswith the randomly selected group members are positive. Rank refers to subject’s rank in their group, predictedbelief adjustment is defined as the belief adjustment if subjects would follow Bayes’ rule.
5 Discussion and Concluding Remarks
This paper makes use of a series of experiments with more than 700 participants to investigate
self-serving belief dynamics after feedback. The ConfidenceDirect and Confidence1Month
treatments show that while initially influencing beliefs, the impact of negative feedback on
confidence drastically diminishes over time. No such pattern is observed for positive feedback.
With the help of the Recall treatment, we further demonstrate that selective memory seems to
play a crucial role for these dynamics. Our corresponding results provide direct evidence for
a key role of selective memory in the “production” of (over)confidence as modeled in Bénabou
and Tirole (2002). Our results from the Recall treatment as well as a placebo condition also
shed light on the process of self-deception after negative feedback and reveal that over time,
people manage to suppress the feedback, which allows them to return to prior confidence
levels.
Taken together, our findings suggest that information or feedback can be rather ineffective
in correcting misperceptions because people are able to suppress the recall of feedback that
challenges their motivated beliefs. Thus, one might ask if there are other factors that may
be more effective in limiting the role of motivated reasoning and regulating beliefs. The
theoretical literature on motivated beliefs suggests that basic economic incentives may work
(see e.g., Brunnermeier and Parker, 2005 and Bénabou and Tirole, 2002). Our results from the
Announcement and RecallHigh treatments provide direct evidence that incentives for belief
25
accuracy effectively mitigate the role of motivated reasoning. However, our findings allow us
to go further. We empirically distinguish two separate ways in which incentives matter, both
of which are closely related to the way memory operates. First, incentives determine how
people encode and rehearse negative feedback. While there is a clear tendency to suppress
unwanted feedback, announcements that make monetary costs from self-deception salient
can strengthen encoding and mitigate the tendency to suppress. Second, in contexts where
people have set their mind on suppressing feedback that threatens their ego, high incentives
can induce people to retrieve that feedback nonetheless.
In light of the finding that negative feedback has only limited effects on beliefs in the
long run, the question arises as to whether people should become entirely delusional about
themselves over time. Note that results from the incentive treatments highlight that in-
centives for recall accuracy bound the degree of self-deception and thereby possibly prevent
motivated agents from becoming entirely delusional. Further note that there exists another
rather mechanical counterforce, which is that the perception of feedback likely changes as
people become more confident. In terms of the experiment, if a subject believes that the
chances of ranking in the upper half are mediocre, then that subject will likely perceive two
comparisons out of three as positive feedback. If, instead, the same subject is almost certain
they rank in the upper half, then that subject will likely perceive the same feedback as rather
negative. Note that this “perception effect” is reflected in the Bayesian definition of feedback
that we report as a robustness check in the Appendix of the paper. An immediate conse-
quence of this change in perception is that the more confident an agent becomes, the more
likely it is that they will obtain negative feedback. Unless an agent does not incorporate
negative feedback at all, this should act as a force that bounds people’s delusions.
26
REFERENCES
Abeler, Johannes, Anke Becker and Armin Falk (2014). “Representative Evidence on Lying
Costs.” Journal of Public Economics, 113, 96-104.
Abeler, Johannes, Armin Falk, Lorenz Goette and David Huffman (2011). “Reference
Points and Effort Provision.” American Economic Review, 101 (2), 470-492.
Anderson, Michael and Benjamin Levy (2009). “Suppressing Unwanted Memories.” Cur-
rent Directions in Psychological Science, 8 (4).
Babcock, Linda, George Loewenstein, Samuel Issacharoff and Colin Camerer (1995). “Bi-
ased Judgments of Fairness in Bargaining.” American Economic Review, 85 (5), 1337-
1343
Barron, Kai (2016). “Belief updating: Does the ‘good-news, bad-news’ asymmetry ex-
tend to purely financial domains?”. Working Paper, Wissenschaftszentrum Berlin für
Sozialforschung.
Bénabou, Roland (2013). “Groupthink: Collective Delusions in Organizations and Mar-
kets.” Review of Economic Studies, 80 (2), 429-462
Bénabou, Roland and Jean Tirole (2002). “Self-Confidence and Personal Motivation.”
Quarterly Journal of Economics, 117, 871-915.
Bénabou, Roland and Jean Tirole (2004). “Willpower and Personal Rules.” Journal of
Political Economy, 112.
Benoit, Roland and Michael Anderson (2012). “Opposing Mechanisms Support the Volun-
tary Forgetting of Unwanted Memories.” Neuron, 76, 450-460.
Bock, Olaf, Ingmar Baetge, and Andreas Nicklisch (2014). “hroot: Hamburg Registration
and Organization Online Tool.” European Economic Review, 71, 117-120.
Bordalo, Pedro, Katherine Coffman, Nicola Gennaioli, and Andrei Shleifer (2016). “Stereo-
types.” Quarterly Journal of Economics, 131 (4): 1753-1794.
Bordalo, Pedro, Nicola Gennaioli, and Andrei Shleifer (2017). “Memory, Attention, and
Choice.” Working Paper, Harvard University.
Brunnermeier, Markus K. and Jonathan A. Parker (2005). “Optimal Expectations.” Amer-
ican Economic Review, 95, 1092-1118.
Burks, Stephen V., Jeffrey P. Carpenter, Lorenz Goette, and Aldo Rustichini (2013). “Over-
confidence and Social Signaling.” Review of Economic Studies, 80, 949-983.
27
Chew, Soo Hong, Wei Huang and Xiaojian Zhao (2018). “Motivated False Memory.”
Working Paper.
Charness, Gary, Aldo Rustichini, and Jeroen van de Ven (2013). “Self-Confidence and
Strategic Behavior.” Working Paper, University of Amsterdam.
Coutts, Alexander (2016). “Good News and Bad News are Still News: Experimental Evi-
dence on Belief Updating”. Working Paper, Nova School of Business and Economics.
Dana, Jason, Roberto Weber and Jason Xi Kuang (2007). “Exploiting moral wiggle room:
Experiments demonstrating an illusory preference for fairness.” Economic Theory, 33
(1).
DellaVigna, Stefano and Ulrike Malmendier (2006). “Paying Not to Go to the Gym.”
American Economic Review, 96, 694-719.
Di Tella, Rafael, Ricardo Perez-Truglia, Andres Babino and Mariano Sigman (2015). “Con-
veniently Upset: Avoiding Altruism by Distorting Beliefs About Others’ Altruism,”
American Economic Review, 105 (11).
Dohmen, Thomas and Armin Falk (2011). “Performance Pay and Multi-Dimensional Sort-
ing: Productivity, Preferences and Gender.” American Economic Review, 101, 556-590.
Eil, David and Justin Rao (2011). “The Good News-Bad News Effect: Asymmetric Pro-
cessing of Objective Information about Yourself.” American Economic Journal, Mi-
croeconomics, 3, 114-138.
Epley, Nicholas and Thomas Gilovoch (2016). “The Mechanics of Motivated Reasoning.”
Journal of Economic Perspectives, 30 (3): 133-140.
Ewers, Mara and Florian Zimmermann (2015). “Image and Misreporting.” Journal of the
European Economic Association, 13 (2): 362-380.
Exley, Christine (2015). “Excusing Selfishness in Charitable Giving: The Role of Risk.”
Review of Economic Studies, 83 (2): 587-628.
Falk, Armin (2017). “Facing yourself: a note on self-image.” unpublished manuscript.
Fischbacher, Urs (2007). “z-Tree: Zurich Toolbox for Ready-Made Economic Experiments.”
Experimental Economics, 10 (2): 171-178.
Fischbacher, Urs and Franziska Heusi. (2013). “Lies in Disguise - An Experimental Study
on Cheating.” Journal of the European Economic Association, 11 (3): 525-547.
Ganguly, Ananda and Joshua Tasoff. (2017). “Fantasy and Dread: The Demand for
Information and the Consumption Utility of the Future.” Management Science, 63
(12): 4037-4060.
28
Gennaioli, Nicola and Andrei Shleifer (2010). “What comes to mind.” Quarterly Journal
of Economics, 125 (4): 1399-1433.
Gneezy, Uri (2005). “Deception: The role of consequences.” American Economic Review,
95 (1): 384-394.
Gneezy, Uri, Lorenz Goette, Charles Sprenger and Florian Zimmermann (2017). “The Lim-
its of Expectations-Based Reference Dependence.” Journal of the European Economic
Association. 15 (4), 861-876.
Gneezy, Uri and Jan Potters (1997). “An Experiment on Risk Taking and Evaluation
Periods.” Quarterly Journal of Economics, 112 (2): 631-645.
Gneezy, Uri, Silvia Saccardo, Marta Serra-Garcia and Roel van Veldhuizen (2015). “Moti-
vated Self-Deception and Unethical Behavior.” unpublished manuscript.
Grigorieff, Alexis, Christopher Roth and Diego Ubfal (2018) “Does Information Change
Attitudes Towards Immigrants? Representative Evidence from Survey Experiments.”
Working Paper.
Grossman, Zachary and Joel van der Weele (forthcoming). “Self-Image and Willful Igno-
rance in Social Decisions.” Journal of the European Economic Association.
Haisley, Emily and Roberto Weber (2010). “Self-serving interpretations of ambiguity in
other-regarding behavior.” Games and Economic Behavior, 68 (2), 614-625.
Huffman, David, Collin Raymond and Julia Shvets (2018) “Persistent Overconfidence and
Biased Memory: Evidence from Managers.” Mimeo.
Kahan, Dan (2013). “Ideology, Motivated Reasoning, and Cognitive Reflection: An Exper-
imental Study.” Nature, 488, 255.
Kahana, Michael (2012). “Foundations of Human Memory.” Oxford University Press.
Kahneman, Daniel, Barbara Frederickson, Charles Schreiber and Donald Redelmeier
(1993). “When More Pain Is Preferred to Less: Adding a Better End.” Psychologi-
cal Science, 4 (6), 401-406.
Konow, James (2000). “Fair Shares: Accountability and Cognitive Dissonance in Allocation
Decisions.” American Economic Review, 90 (4): 1072-1091.
Kuziemko, Ilyana, Michael Norton, Emmanuel Saez, and Stefanie Stantcheva (2015). “How
Elastic are Preferences for Redistribution: Evidence from Randomized Survey Experi-
ments.” American Economic Review ,105 (4), 1478-1508.
Kőszegi, B. (2006). “Ego Utility, Overconfidence, and Task Choice”, Journal of the European
Economic Association, v4 (4), 673-707.
29
Kouchaki, Maryam and Francesca Gino (2016). “Memories of unethical actions become
obfuscated over time.” Proceedings of the National Academy of Science.
Kunda, Ziva (1990). “The case for motivated reasoning.” Psychological Bulletin, 108 (3),
480-498.
Li, King King (2013). “Asymmetric memory recall of positive and negative events in social
interactions.” Experimental Economics, 16 (3), 248-262.
Malmendier, Ulrike and Geoffrey Tate (2005). “CEO Overconfidence and Corporate In-
vestment.” Journal of Finance, 60 (6).
Malmendier, Ulrike and Geoffrey Tate (2008). “Who Makes Acquisitions? CEO Overcon-
fidence and the Market’s Reaction.” Journal of Financial Economics, 89, 20-43.
Mischel, Walter, Ebbe Ebbesen and Antoinette Zeiss (1976). “Determinants of Selective
Memory About the Self.” Journal of Consulting and Clinical Psychology, 44 (1), 92-103.
Möbius, Markus M., Muriel Niederle, Paul Niehaus, and Tanya S. Rosenblat (2013). “Man-
aging Self-Confidence: Theory and Experimental Evidence.” Working Paper, Stanford
University.
Mullainathan, Sendhil (2002). “A Memory-Based Model of Bounded Rationality.” Quar-
terly Journal of Economics, 117 (3), 735-774.
Oster, Emily, Ira Shoulson and Ray Dorsey 2013. “Optimal Expectations and Limited
Medical Testing: Evidence from Huntington Disease.” American Economic Review,
103 (2), 804-830.
Saucet, Charlotte and Marie Claire Villeval (2018). “Motivated Memory in Dictator
Games.” Working Paper, University of Lyon.
Schacter, Daniel (1996). “Searching for memory: The brain, the mind, and the past.” New
York: Basic Books.
Schwardmann, Peter and Joel van der Weele (2017). “Deception and Self-deception.” Work-
ing Paper, University of Munich.
Sharot, Tali, Christoph Korn and Raymond Dolan (2011). “How unrealistic optimism is
maintained in the face of reality.” Nature Neuroscience, 14, 1475-1479.
30
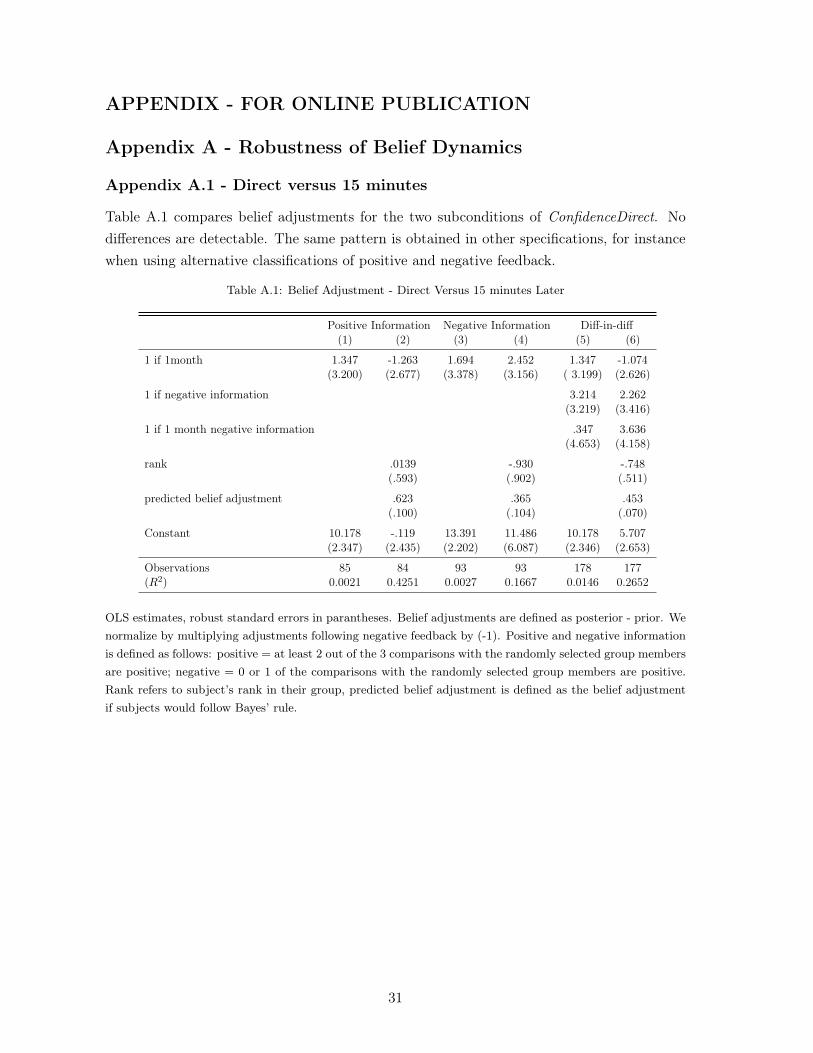
APPENDIX - FOR ONLINE PUBLICATION
Appendix A - Robustness of Belief Dynamics
Appendix A.1 - Direct versus 15 minutes
Table A.1 compares belief adjustments for the two subconditions of ConfidenceDirect. No
differences are detectable. The same pattern is obtained in other specifications, for instance
when using alternative classifications of positive and negative feedback.
Table A.1: Belief Adjustment - Direct Versus 15 minutes Later
Positive Information Negative Information Diff-in-diff(1) (2) (3) (4) (5) (6)
1 if 1month 1.347 -1.263 1.694 2.452 1.347 -1.074(3.200) (2.677) (3.378) (3.156) ( 3.199) (2.626)
1 if negative information 3.214 2.262(3.219) (3.416)
1 if 1 month negative information .347 3.636(4.653) (4.158)
rank .0139 -.930 -.748(.593) (.902) (.511)
predicted belief adjustment .623 .365 .453(.100) (.104) (.070)
Constant 10.178 -.119 13.391 11.486 10.178 5.707(2.347) (2.435) (2.202) (6.087) (2.346) (2.653)
Observations 85 84 93 93 178 177(R2) 0.0021 0.4251 0.0027 0.1667 0.0146 0.2652
OLS estimates, robust standard errors in parantheses. Belief adjustments are defined as posterior - prior. We
normalize by multiplying adjustments following negative feedback by (-1). Positive and negative information
is defined as follows: positive = at least 2 out of the 3 comparisons with the randomly selected group members
are positive; negative = 0 or 1 of the comparisons with the randomly selected group members are positive.
Rank refers to subject’s rank in their group, predicted belief adjustment is defined as the belief adjustment
if subjects would follow Bayes’ rule.
31
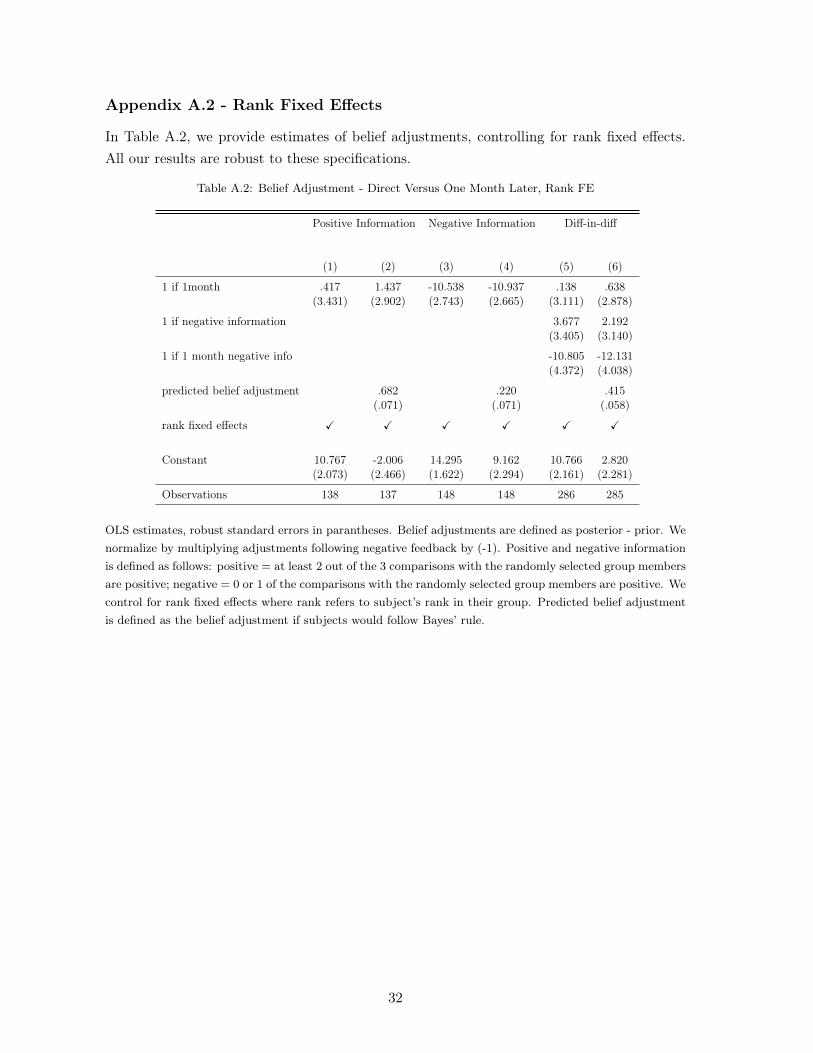
Appendix A.2 - Rank Fixed Effects
In Table A.2, we provide estimates of belief adjustments, controlling for rank fixed effects.
All our results are robust to these specifications.
Table A.2: Belief Adjustment - Direct Versus One Month Later, Rank FE
Positive Information Negative Information Diff-in-diff
(1) (2) (3) (4) (5) (6)
1 if 1month .417 1.437 -10.538 -10.937 .138 .638(3.431) (2.902) (2.743) (2.665) (3.111) (2.878)
1 if negative information 3.677 2.192(3.405) (3.140)
1 if 1 month negative info -10.805 -12.131(4.372) (4.038)
predicted belief adjustment .682 .220 .415(.071) (.071) (.058)
rank fixed effects X X X X X X
Constant 10.767 -2.006 14.295 9.162 10.766 2.820(2.073) (2.466) (1.622) (2.294) (2.161) (2.281)
Observations 138 137 148 148 286 285
OLS estimates, robust standard errors in parantheses. Belief adjustments are defined as posterior - prior. We
normalize by multiplying adjustments following negative feedback by (-1). Positive and negative information
is defined as follows: positive = at least 2 out of the 3 comparisons with the randomly selected group members
are positive; negative = 0 or 1 of the comparisons with the randomly selected group members are positive. We
control for rank fixed effects where rank refers to subject’s rank in their group. Predicted belief adjustment
is defined as the belief adjustment if subjects would follow Bayes’ rule.
32

Appendix A.3 - IQ Test Performance Fixed Effects
In Table A.3, we provide estimates of belief adjustments, controlling for IQ test performance
fixed effects. In Table A.4, we provide estimates of belief adjustments, controlling for a set
of IQ test score dummies as well as a set of IQ test score dummies interacted with treatment
(direct versus one month later). All our results are robust to these specifications.
Table A.3: Belief Adjustment - Direct Versus One Month Later, Score FE
Positive Information Negative Information Diff-in-diff
(1) (2) (3) (4) (5) (6)
1 if 1month -.259 .533 -10.658 -11.027 .163 .554(3.247) (2.759) (2.627) (2.540) (2.981) (2.772)
1 if negative information 3.223 1.210(2.860) (2.675)
1 if 1 month negative info -10.447 -11.456(4.185) (3.888)
predicted belief adjustment .631 .224 .379(.087) (.067) (.056)
score fixed effects X X X X X X
Constant 11.027 -.716 14.339 9.107 10.923 4.041(2.002) (2.363) (2.627) (2.199) (1.940) (2.086)
Observations 138 137 148 148 286 285
OLS estimates, robust standard errors in parantheses. Belief adjustments are defined as posterior - prior. We
normalize by multiplying adjustments following negative feedback by (-1). Positive and negative information
is defined as follows: positive = at least 2 out of the 3 comparisons with the randomly selected group members
are positive; negative = 0 or 1 of the comparisons with the randomly selected group members are positive.
We control for score fixed effects, where score captures subjects’ overall score in Raven test. Predicted belief
adjustment is defined as the belief adjustment if subjects would follow Bayes’ rule.
33
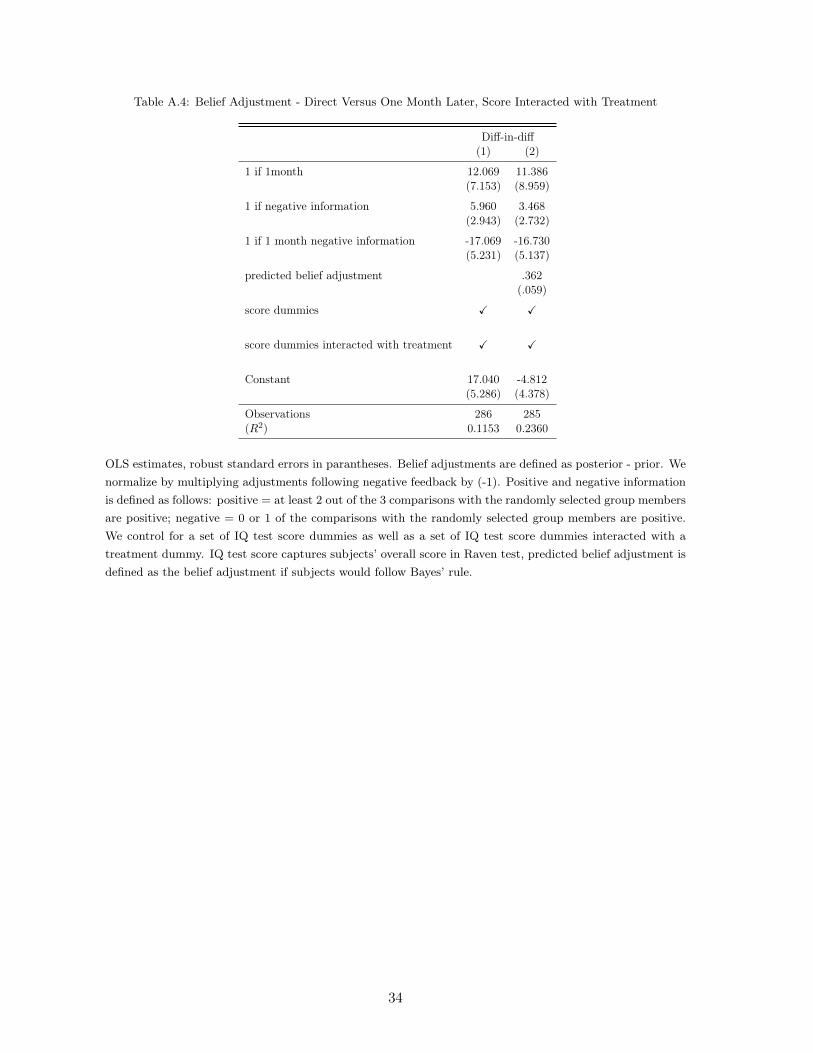
Table A.4: Belief Adjustment - Direct Versus One Month Later, Score Interacted with Treatment
Diff-in-diff(1) (2)
1 if 1month 12.069 11.386(7.153) (8.959)
1 if negative information 5.960 3.468(2.943) (2.732)
1 if 1 month negative information -17.069 -16.730(5.231) (5.137)
predicted belief adjustment .362(.059)
score dummies X X
score dummies interacted with treatment X X
Constant 17.040 -4.812(5.286) (4.378)
Observations 286 285(R2) 0.1153 0.2360
OLS estimates, robust standard errors in parantheses. Belief adjustments are defined as posterior - prior. We
normalize by multiplying adjustments following negative feedback by (-1). Positive and negative information
is defined as follows: positive = at least 2 out of the 3 comparisons with the randomly selected group members
are positive; negative = 0 or 1 of the comparisons with the randomly selected group members are positive.
We control for a set of IQ test score dummies as well as a set of IQ test score dummies interacted with a
treatment dummy. IQ test score captures subjects’ overall score in Raven test, predicted belief adjustment is
defined as the belief adjustment if subjects would follow Bayes’ rule.
34
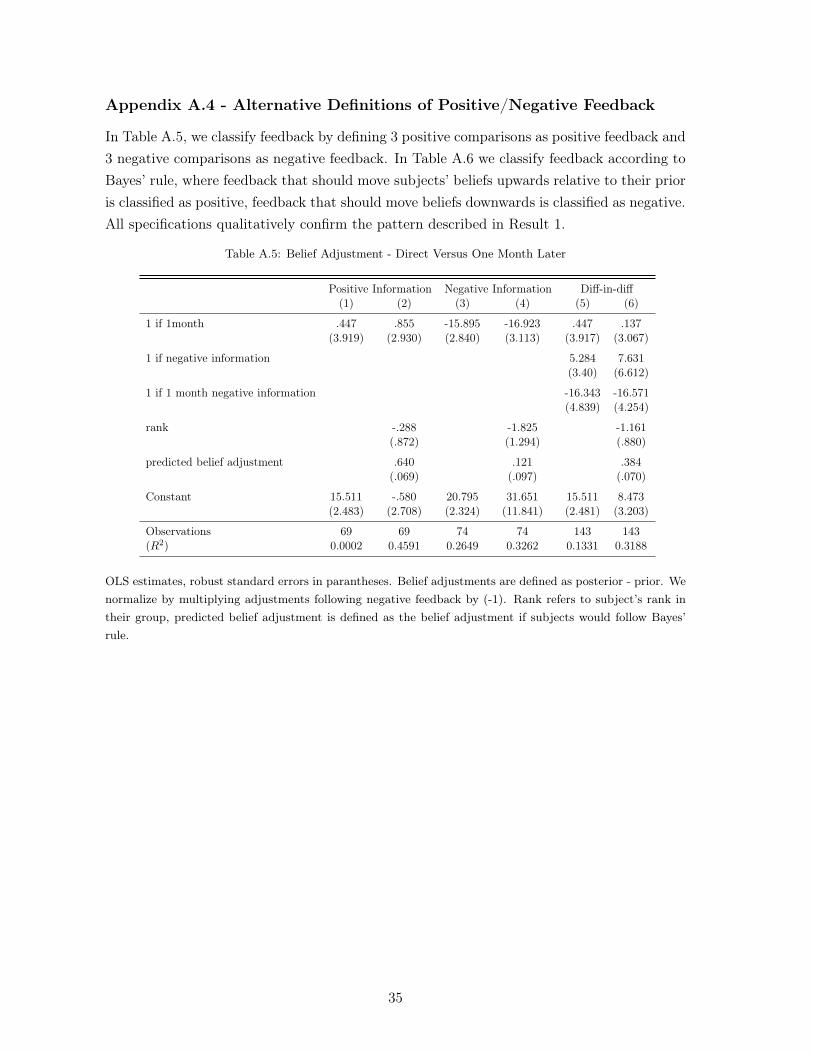
Appendix A.4 - Alternative Definitions of Positive/Negative Feedback
In Table A.5, we classify feedback by defining 3 positive comparisons as positive feedback and
3 negative comparisons as negative feedback. In Table A.6 we classify feedback according to
Bayes’ rule, where feedback that should move subjects’ beliefs upwards relative to their prior
is classified as positive, feedback that should move beliefs downwards is classified as negative.
All specifications qualitatively confirm the pattern described in Result 1.
Table A.5: Belief Adjustment - Direct Versus One Month Later
Positive Information Negative Information Diff-in-diff(1) (2) (3) (4) (5) (6)
1 if 1month .447 .855 -15.895 -16.923 .447 .137(3.919) (2.930) (2.840) (3.113) (3.917) (3.067)
1 if negative information 5.284 7.631(3.40) (6.612)
1 if 1 month negative information -16.343 -16.571(4.839) (4.254)
rank -.288 -1.825 -1.161(.872) (1.294) (.880)
predicted belief adjustment .640 .121 .384(.069) (.097) (.070)
Constant 15.511 -.580 20.795 31.651 15.511 8.473(2.483) (2.708) (2.324) (11.841) (2.481) (3.203)
Observations 69 69 74 74 143 143(R2) 0.0002 0.4591 0.2649 0.3262 0.1331 0.3188
OLS estimates, robust standard errors in parantheses. Belief adjustments are defined as posterior - prior. We
normalize by multiplying adjustments following negative feedback by (-1). Rank refers to subject’s rank in
their group, predicted belief adjustment is defined as the belief adjustment if subjects would follow Bayes’
rule.
35
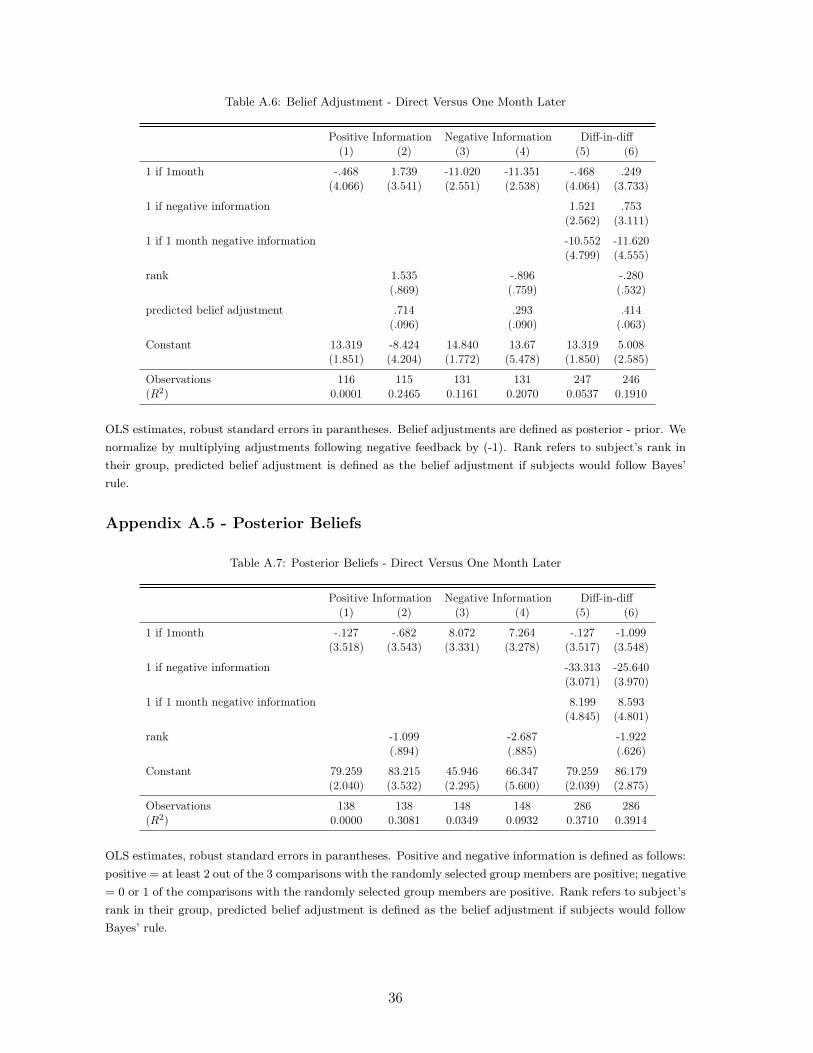
Table A.6: Belief Adjustment - Direct Versus One Month Later
Positive Information Negative Information Diff-in-diff(1) (2) (3) (4) (5) (6)
1 if 1month -.468 1.739 -11.020 -11.351 -.468 .249(4.066) (3.541) (2.551) (2.538) (4.064) (3.733)
1 if negative information 1.521 .753(2.562) (3.111)
1 if 1 month negative information -10.552 -11.620(4.799) (4.555)
rank 1.535 -.896 -.280(.869) (.759) (.532)
predicted belief adjustment .714 .293 .414(.096) (.090) (.063)
Constant 13.319 -8.424 14.840 13.67 13.319 5.008(1.851) (4.204) (1.772) (5.478) (1.850) (2.585)
Observations 116 115 131 131 247 246(R2) 0.0001 0.2465 0.1161 0.2070 0.0537 0.1910
OLS estimates, robust standard errors in parantheses. Belief adjustments are defined as posterior - prior. We
normalize by multiplying adjustments following negative feedback by (-1). Rank refers to subject’s rank in
their group, predicted belief adjustment is defined as the belief adjustment if subjects would follow Bayes’
rule.
Appendix A.5 - Posterior Beliefs
Table A.7: Posterior Beliefs - Direct Versus One Month Later
Positive Information Negative Information Diff-in-diff(1) (2) (3) (4) (5) (6)
1 if 1month -.127 -.682 8.072 7.264 -.127 -1.099(3.518) (3.543) (3.331) (3.278) (3.517) (3.548)
1 if negative information -33.313 -25.640(3.071) (3.970)
1 if 1 month negative information 8.199 8.593(4.845) (4.801)
rank -1.099 -2.687 -1.922(.894) (.885) (.626)
Constant 79.259 83.215 45.946 66.347 79.259 86.179(2.040) (3.532) (2.295) (5.600) (2.039) (2.875)
Observations 138 138 148 148 286 286(R2) 0.0000 0.3081 0.0349 0.0932 0.3710 0.3914
OLS estimates, robust standard errors in parantheses. Positive and negative information is defined as follows:
positive = at least 2 out of the 3 comparisons with the randomly selected group members are positive; negative
= 0 or 1 of the comparisons with the randomly selected group members are positive. Rank refers to subject’s
rank in their group, predicted belief adjustment is defined as the belief adjustment if subjects would follow
Bayes’ rule.
36
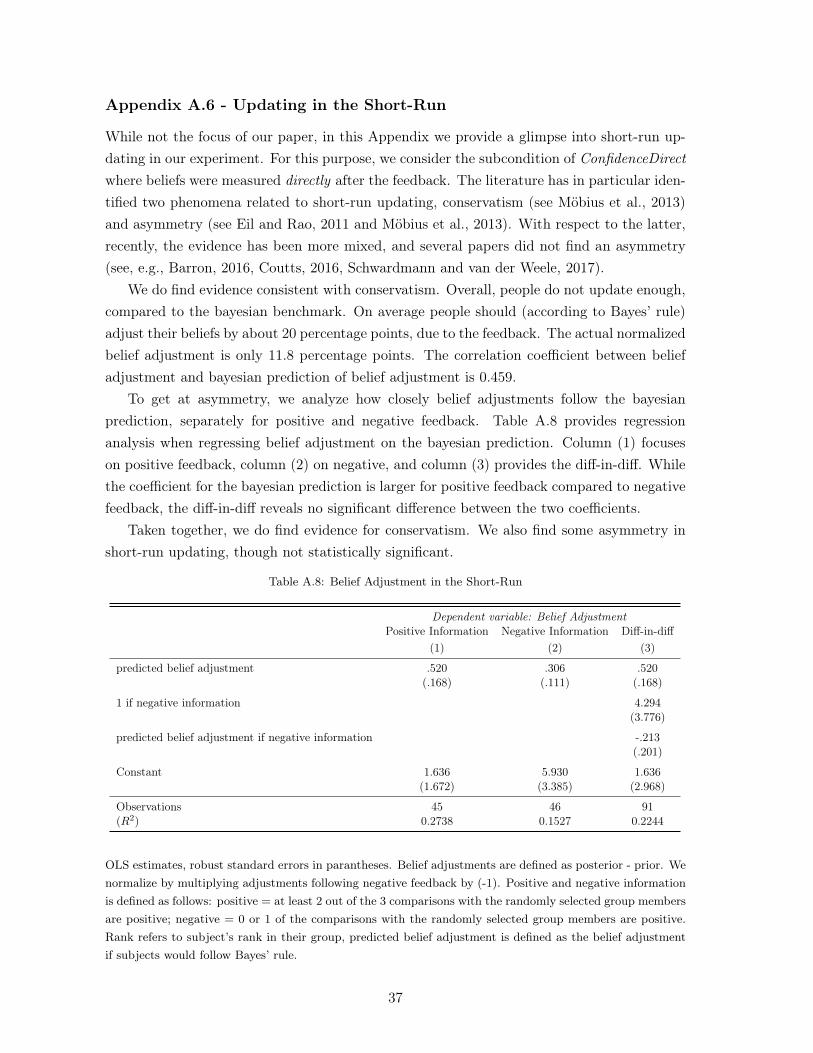
Appendix A.6 - Updating in the Short-Run
While not the focus of our paper, in this Appendix we provide a glimpse into short-run up-
dating in our experiment. For this purpose, we consider the subcondition of ConfidenceDirect
where beliefs were measured directly after the feedback. The literature has in particular iden-
tified two phenomena related to short-run updating, conservatism (see Möbius et al., 2013)
and asymmetry (see Eil and Rao, 2011 and Möbius et al., 2013). With respect to the latter,
recently, the evidence has been more mixed, and several papers did not find an asymmetry
(see, e.g., Barron, 2016, Coutts, 2016, Schwardmann and van der Weele, 2017).
We do find evidence consistent with conservatism. Overall, people do not update enough,
compared to the bayesian benchmark. On average people should (according to Bayes’ rule)
adjust their beliefs by about 20 percentage points, due to the feedback. The actual normalized
belief adjustment is only 11.8 percentage points. The correlation coefficient between belief
adjustment and bayesian prediction of belief adjustment is 0.459.
To get at asymmetry, we analyze how closely belief adjustments follow the bayesian
prediction, separately for positive and negative feedback. Table A.8 provides regression
analysis when regressing belief adjustment on the bayesian prediction. Column (1) focuses
on positive feedback, column (2) on negative, and column (3) provides the diff-in-diff. While
the coefficient for the bayesian prediction is larger for positive feedback compared to negative
feedback, the diff-in-diff reveals no significant difference between the two coefficients.
Taken together, we do find evidence for conservatism. We also find some asymmetry in
short-run updating, though not statistically significant.
Table A.8: Belief Adjustment in the Short-Run
Dependent variable: Belief AdjustmentPositive Information Negative Information Diff-in-diff
(1) (2) (3)
predicted belief adjustment .520 .306 .520(.168) (.111) (.168)
1 if negative information 4.294(3.776)
predicted belief adjustment if negative information -.213(.201)
Constant 1.636 5.930 1.636(1.672) (3.385) (2.968)
Observations 45 46 91(R2) 0.2738 0.1527 0.2244
OLS estimates, robust standard errors in parantheses. Belief adjustments are defined as posterior - prior. We
normalize by multiplying adjustments following negative feedback by (-1). Positive and negative information
is defined as follows: positive = at least 2 out of the 3 comparisons with the randomly selected group members
are positive; negative = 0 or 1 of the comparisons with the randomly selected group members are positive.
Rank refers to subject’s rank in their group, predicted belief adjustment is defined as the belief adjustment
if subjects would follow Bayes’ rule.
37
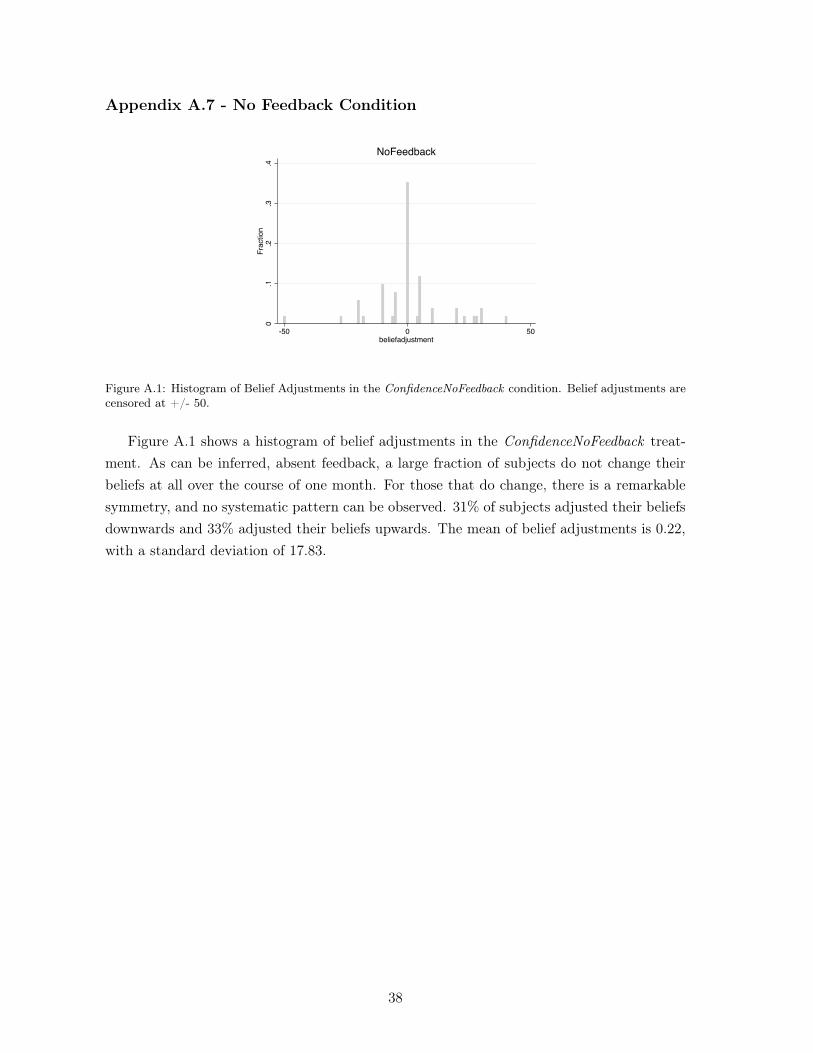
Appendix A.7 - No Feedback Condition
0.1
.2.3
.4Fraction
-50 0 50beliefadjustment
NoFeedback
Figure A.1: Histogram of Belief Adjustments in the ConfidenceNoFeedback condition. Belief adjustments arecensored at +/- 50.
Figure A.1 shows a histogram of belief adjustments in the ConfidenceNoFeedback treat-
ment. As can be inferred, absent feedback, a large fraction of subjects do not change their
beliefs at all over the course of one month. For those that do change, there is a remarkable
symmetry, and no systematic pattern can be observed. 31% of subjects adjusted their beliefs
downwards and 33% adjusted their beliefs upwards. The mean of belief adjustments is 0.22,
with a standard deviation of 17.83.
38
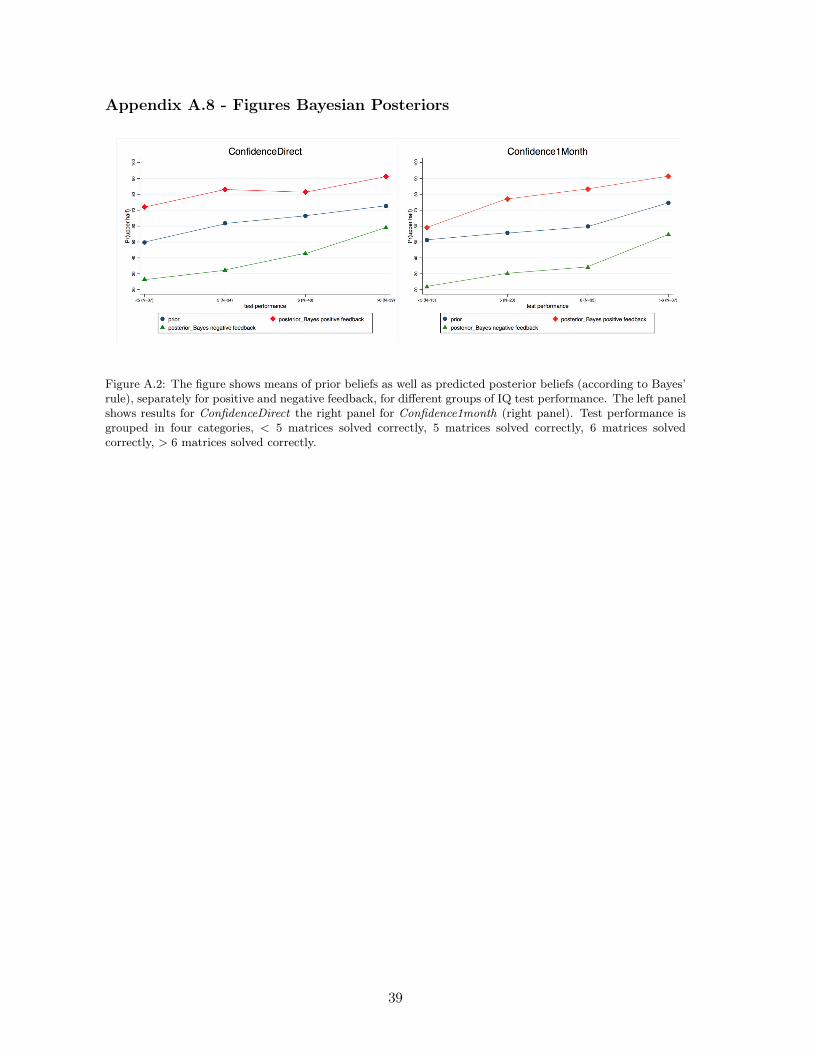
Appendix A.8 - Figures Bayesian Posteriors
Figure A.2: The figure shows means of prior beliefs as well as predicted posterior beliefs (according to Bayes’rule), separately for positive and negative feedback, for different groups of IQ test performance. The left panelshows results for ConfidenceDirect the right panel for Confidence1month (right panel). Test performance isgrouped in four categories, < 5 matrices solved correctly, 5 matrices solved correctly, 6 matrices solvedcorrectly, > 6 matrices solved correctly.
39
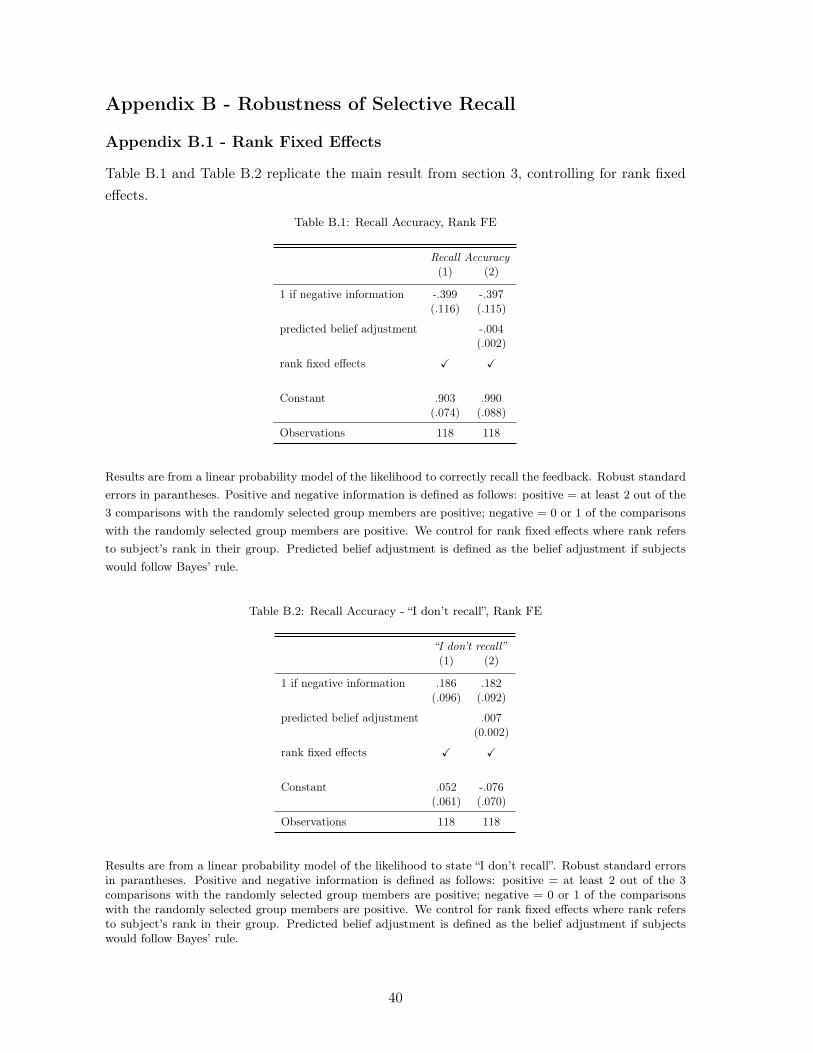
Appendix B - Robustness of Selective Recall
Appendix B.1 - Rank Fixed Effects
Table B.1 and Table B.2 replicate the main result from section 3, controlling for rank fixed
effects.
Table B.1: Recall Accuracy, Rank FE
Recall Accuracy(1) (2)
1 if negative information -.399 -.397(.116) (.115)
predicted belief adjustment -.004(.002)
rank fixed effects X X
Constant .903 .990(.074) (.088)
Observations 118 118
Results are from a linear probability model of the likelihood to correctly recall the feedback. Robust standard
errors in parantheses. Positive and negative information is defined as follows: positive = at least 2 out of the
3 comparisons with the randomly selected group members are positive; negative = 0 or 1 of the comparisons
with the randomly selected group members are positive. We control for rank fixed effects where rank refers
to subject’s rank in their group. Predicted belief adjustment is defined as the belief adjustment if subjects
would follow Bayes’ rule.
Table B.2: Recall Accuracy - “I don’t recall”, Rank FE
“I don’t recall”(1) (2)
1 if negative information .186 .182(.096) (.092)
predicted belief adjustment .007(0.002)
rank fixed effects X X
Constant .052 -.076(.061) (.070)
Observations 118 118
Results are from a linear probability model of the likelihood to state “I don’t recall”. Robust standard errorsin parantheses. Positive and negative information is defined as follows: positive = at least 2 out of the 3comparisons with the randomly selected group members are positive; negative = 0 or 1 of the comparisonswith the randomly selected group members are positive. We control for rank fixed effects where rank refersto subject’s rank in their group. Predicted belief adjustment is defined as the belief adjustment if subjectswould follow Bayes’ rule.
40
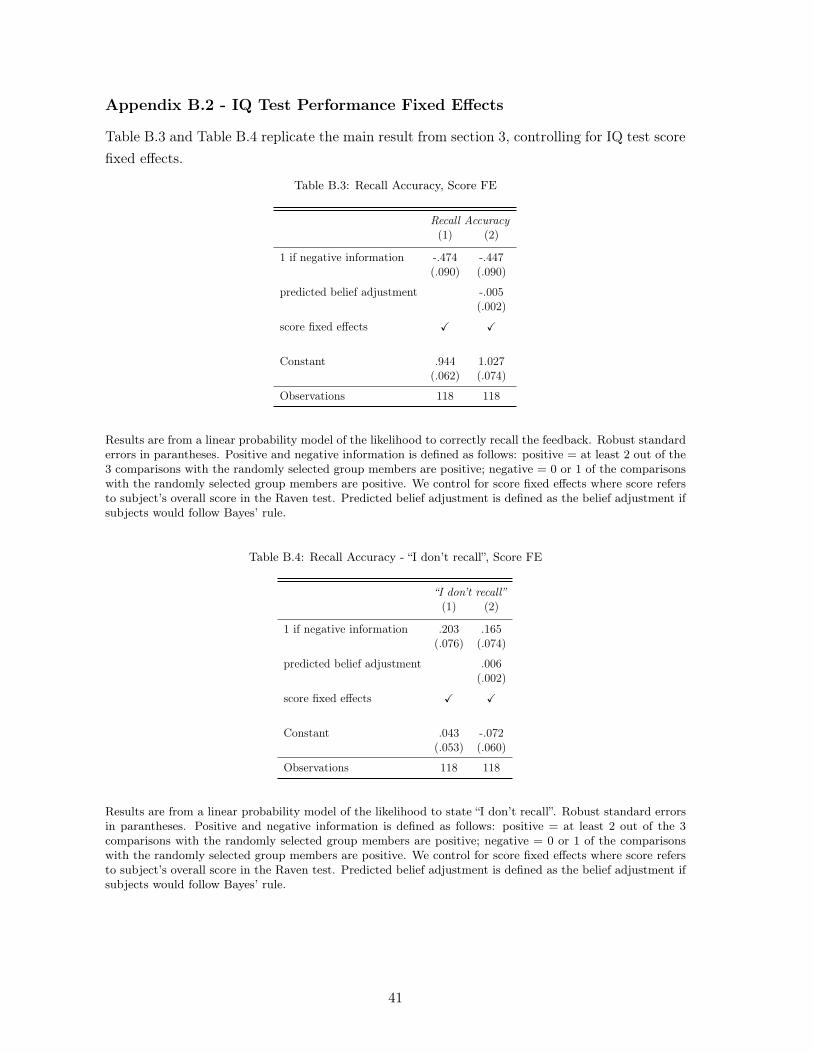
Appendix B.2 - IQ Test Performance Fixed Effects
Table B.3 and Table B.4 replicate the main result from section 3, controlling for IQ test score
fixed effects.
Table B.3: Recall Accuracy, Score FE
Recall Accuracy(1) (2)
1 if negative information -.474 -.447(.090) (.090)
predicted belief adjustment -.005(.002)
score fixed effects X X
Constant .944 1.027(.062) (.074)
Observations 118 118
Results are from a linear probability model of the likelihood to correctly recall the feedback. Robust standarderrors in parantheses. Positive and negative information is defined as follows: positive = at least 2 out of the3 comparisons with the randomly selected group members are positive; negative = 0 or 1 of the comparisonswith the randomly selected group members are positive. We control for score fixed effects where score refersto subject’s overall score in the Raven test. Predicted belief adjustment is defined as the belief adjustment ifsubjects would follow Bayes’ rule.
Table B.4: Recall Accuracy - “I don’t recall”, Score FE
“I don’t recall”(1) (2)
1 if negative information .203 .165(.076) (.074)
predicted belief adjustment .006(.002)
score fixed effects X X
Constant .043 -.072(.053) (.060)
Observations 118 118
Results are from a linear probability model of the likelihood to state “I don’t recall”. Robust standard errorsin parantheses. Positive and negative information is defined as follows: positive = at least 2 out of the 3comparisons with the randomly selected group members are positive; negative = 0 or 1 of the comparisonswith the randomly selected group members are positive. We control for score fixed effects where score refersto subject’s overall score in the Raven test. Predicted belief adjustment is defined as the belief adjustment ifsubjects would follow Bayes’ rule.
41
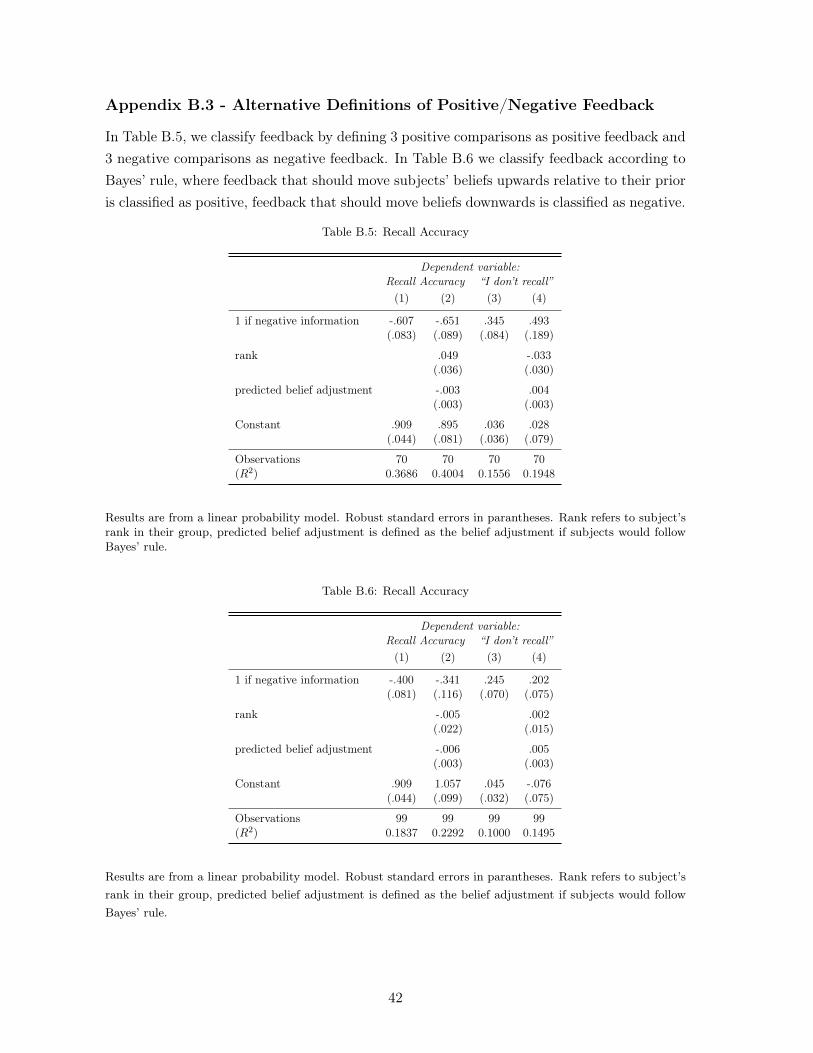
Appendix B.3 - Alternative Definitions of Positive/Negative Feedback
In Table B.5, we classify feedback by defining 3 positive comparisons as positive feedback and
3 negative comparisons as negative feedback. In Table B.6 we classify feedback according to
Bayes’ rule, where feedback that should move subjects’ beliefs upwards relative to their prior
is classified as positive, feedback that should move beliefs downwards is classified as negative.
Table B.5: Recall Accuracy
Dependent variable:Recall Accuracy “I don’t recall”
(1) (2) (3) (4)
1 if negative information -.607 -.651 .345 .493(.083) (.089) (.084) (.189)
rank .049 -.033(.036) (.030)
predicted belief adjustment -.003 .004(.003) (.003)
Constant .909 .895 .036 .028(.044) (.081) (.036) (.079)
Observations 70 70 70 70(R2) 0.3686 0.4004 0.1556 0.1948
Results are from a linear probability model. Robust standard errors in parantheses. Rank refers to subject’srank in their group, predicted belief adjustment is defined as the belief adjustment if subjects would followBayes’ rule.
Table B.6: Recall Accuracy
Dependent variable:Recall Accuracy “I don’t recall”
(1) (2) (3) (4)
1 if negative information -.400 -.341 .245 .202(.081) (.116) (.070) (.075)
rank -.005 .002(.022) (.015)
predicted belief adjustment -.006 .005(.003) (.003)
Constant .909 1.057 .045 -.076(.044) (.099) (.032) (.075)
Observations 99 99 99 99(R2) 0.1837 0.2292 0.1000 0.1495
Results are from a linear probability model. Robust standard errors in parantheses. Rank refers to subject’s
rank in their group, predicted belief adjustment is defined as the belief adjustment if subjects would follow
Bayes’ rule.
42
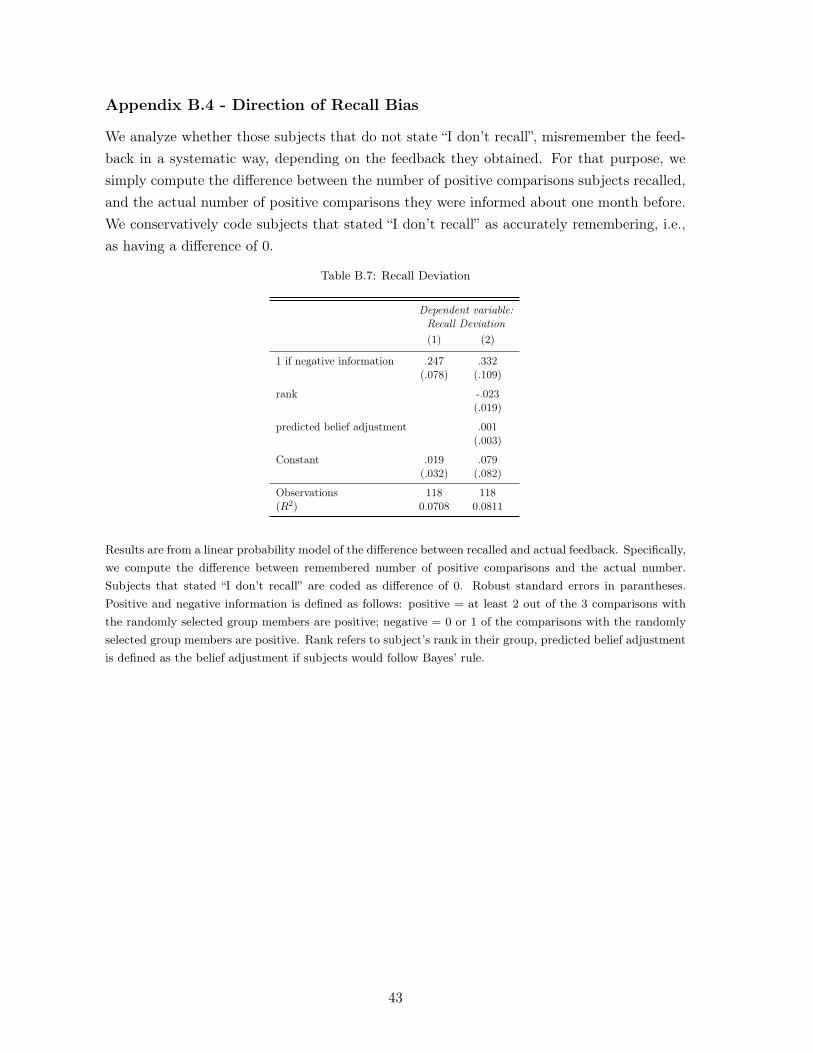
Appendix B.4 - Direction of Recall Bias
We analyze whether those subjects that do not state “I don’t recall”, misremember the feed-
back in a systematic way, depending on the feedback they obtained. For that purpose, we
simply compute the difference between the number of positive comparisons subjects recalled,
and the actual number of positive comparisons they were informed about one month before.
We conservatively code subjects that stated “I don’t recall” as accurately remembering, i.e.,
as having a difference of 0.
Table B.7: Recall Deviation
Dependent variable:Recall Deviation
(1) (2)
1 if negative information .247 .332(.078) (.109)
rank -.023(.019)
predicted belief adjustment .001(.003)
Constant .019 .079(.032) (.082)
Observations 118 118(R2) 0.0708 0.0811
Results are from a linear probability model of the difference between recalled and actual feedback. Specifically,
we compute the difference between remembered number of positive comparisons and the actual number.
Subjects that stated “I don’t recall” are coded as difference of 0. Robust standard errors in parantheses.
Positive and negative information is defined as follows: positive = at least 2 out of the 3 comparisons with
the randomly selected group members are positive; negative = 0 or 1 of the comparisons with the randomly
selected group members are positive. Rank refers to subject’s rank in their group, predicted belief adjustment
is defined as the belief adjustment if subjects would follow Bayes’ rule.
43
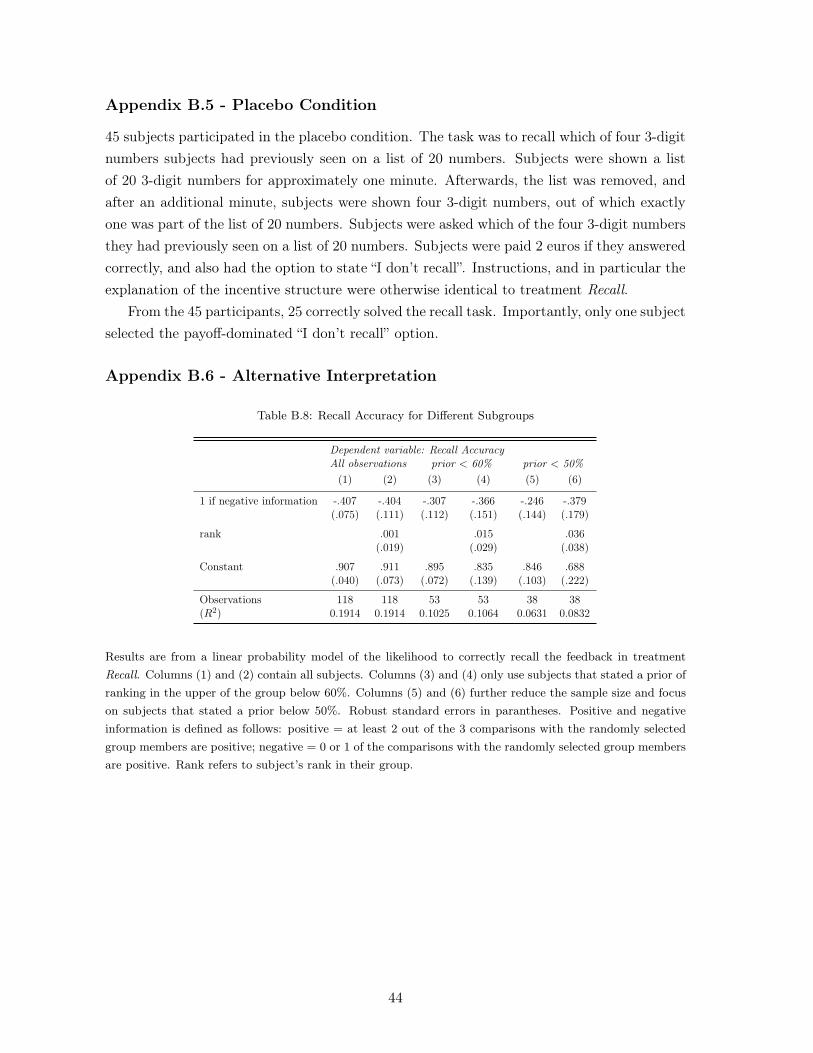
Appendix B.5 - Placebo Condition
45 subjects participated in the placebo condition. The task was to recall which of four 3-digit
numbers subjects had previously seen on a list of 20 numbers. Subjects were shown a list
of 20 3-digit numbers for approximately one minute. Afterwards, the list was removed, and
after an additional minute, subjects were shown four 3-digit numbers, out of which exactly
one was part of the list of 20 numbers. Subjects were asked which of the four 3-digit numbers
they had previously seen on a list of 20 numbers. Subjects were paid 2 euros if they answered
correctly, and also had the option to state “I don’t recall”. Instructions, and in particular the
explanation of the incentive structure were otherwise identical to treatment Recall.
From the 45 participants, 25 correctly solved the recall task. Importantly, only one subject
selected the payoff-dominated “I don’t recall” option.
Appendix B.6 - Alternative Interpretation
Table B.8: Recall Accuracy for Different Subgroups
Dependent variable: Recall AccuracyAll observations prior < 60% prior < 50%
(1) (2) (3) (4) (5) (6)
1 if negative information -.407 -.404 -.307 -.366 -.246 -.379(.075) (.111) (.112) (.151) (.144) (.179)
rank .001 .015 .036(.019) (.029) (.038)
Constant .907 .911 .895 .835 .846 .688(.040) (.073) (.072) (.139) (.103) (.222)
Observations 118 118 53 53 38 38(R2) 0.1914 0.1914 0.1025 0.1064 0.0631 0.0832
Results are from a linear probability model of the likelihood to correctly recall the feedback in treatment
Recall. Columns (1) and (2) contain all subjects. Columns (3) and (4) only use subjects that stated a prior of
ranking in the upper of the group below 60%. Columns (5) and (6) further reduce the sample size and focus
on subjects that stated a prior below 50%. Robust standard errors in parantheses. Positive and negative
information is defined as follows: positive = at least 2 out of the 3 comparisons with the randomly selected
group members are positive; negative = 0 or 1 of the comparisons with the randomly selected group members
are positive. Rank refers to subject’s rank in their group.
44
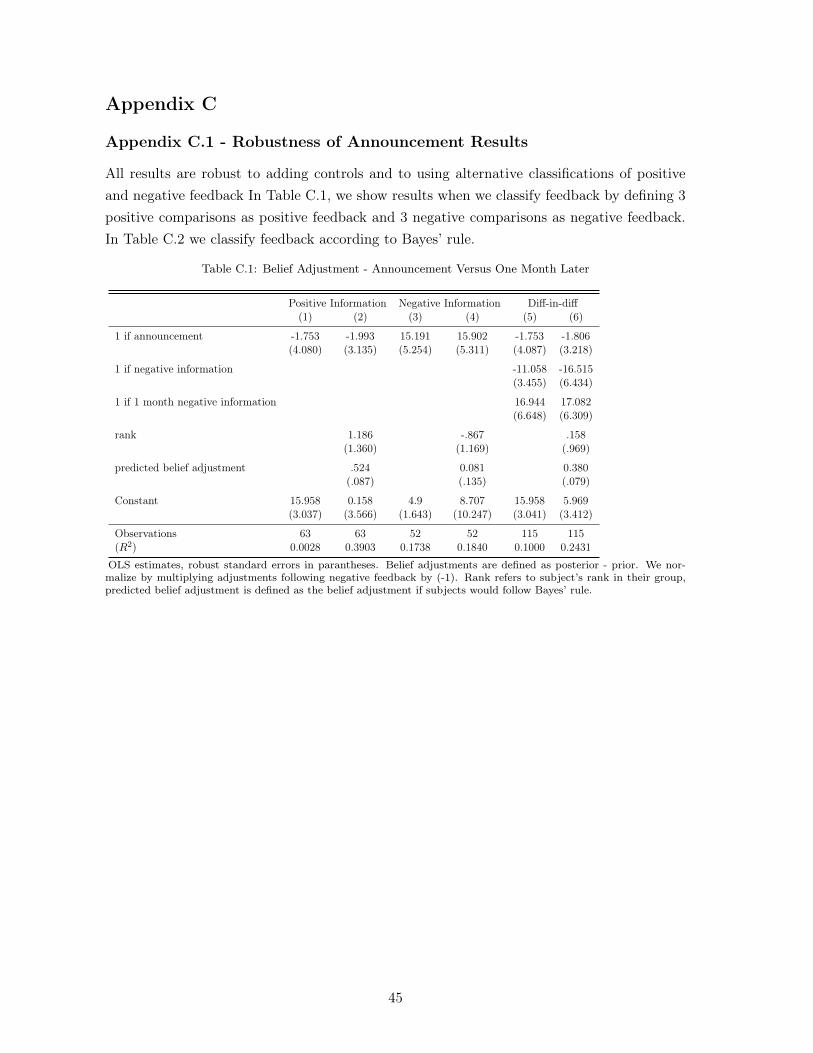
Appendix C
Appendix C.1 - Robustness of Announcement Results
All results are robust to adding controls and to using alternative classifications of positive
and negative feedback In Table C.1, we show results when we classify feedback by defining 3
positive comparisons as positive feedback and 3 negative comparisons as negative feedback.
In Table C.2 we classify feedback according to Bayes’ rule.
Table C.1: Belief Adjustment - Announcement Versus One Month Later
Positive Information Negative Information Diff-in-diff(1) (2) (3) (4) (5) (6)
1 if announcement -1.753 -1.993 15.191 15.902 -1.753 -1.806(4.080) (3.135) (5.254) (5.311) (4.087) (3.218)
1 if negative information -11.058 -16.515(3.455) (6.434)
1 if 1 month negative information 16.944 17.082(6.648) (6.309)
rank 1.186 -.867 .158(1.360) (1.169) (.969)
predicted belief adjustment .524 0.081 0.380(.087) (.135) (.079)
Constant 15.958 0.158 4.9 8.707 15.958 5.969(3.037) (3.566) (1.643) (10.247) (3.041) (3.412)
Observations 63 63 52 52 115 115(R2) 0.0028 0.3903 0.1738 0.1840 0.1000 0.2431
OLS estimates, robust standard errors in parantheses. Belief adjustments are defined as posterior - prior. We nor-malize by multiplying adjustments following negative feedback by (-1). Rank refers to subject’s rank in their group,predicted belief adjustment is defined as the belief adjustment if subjects would follow Bayes’ rule.
45

Table C.2: Belief Adjustment - Announcement Versus One Month Later
Positive Information Negative Information Diff-in-diff(1) (2) (3) (4) (5) (6)
1 if announcement 3.449 .654 13.021 13.410 3.449 2.015(4.520) (4.279) (3.685) (3.765) (4.521) (4.301)
1 if negative information -9.031 -10.975(4.068) (5.271)
1 if 1 month negative information 9.572 11.922(5.832) (5.774)
rank 1.430 -.722 -.091(.966) (.848) (.643)
predicted belief adjustment .556 .192 .319(.135) (.113) (.085)
Constant 12.851 -3.106 3.82 3.835 12.851 6.593(3.627) (6.068) (1.841) (7.494) (3.627) (4.492)
Observations 97 97 94 94 191 191(R2) 0.0062 0.1411 0.1257 0.1503 0.0671 0.1275
OLS estimates, robust standard errors in parantheses. Belief adjustments are defined as posterior - prior. We nor-malize by multiplying adjustments following negative feedback by (-1). Rank refers to subject’s rank in their group,predicted belief adjustment is defined as the belief adjustment if subjects would follow Bayes’ rule.
46
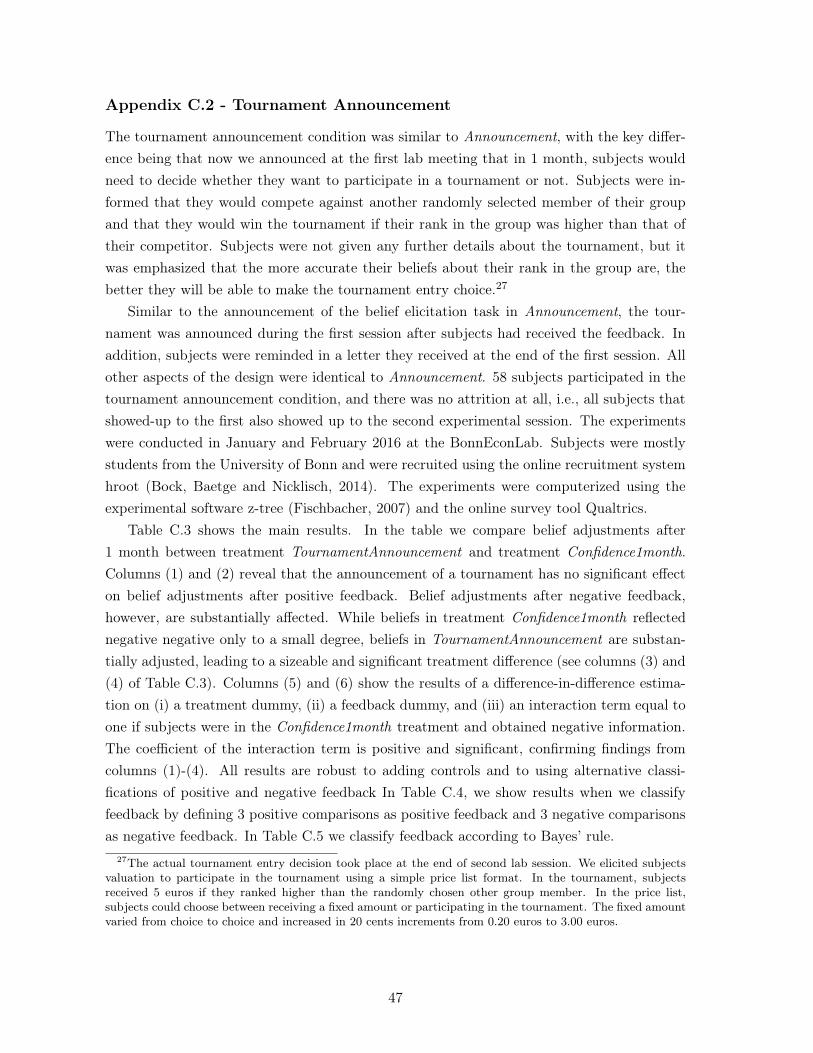
Appendix C.2 - Tournament Announcement
The tournament announcement condition was similar to Announcement, with the key differ-
ence being that now we announced at the first lab meeting that in 1 month, subjects would
need to decide whether they want to participate in a tournament or not. Subjects were in-
formed that they would compete against another randomly selected member of their group
and that they would win the tournament if their rank in the group was higher than that of
their competitor. Subjects were not given any further details about the tournament, but it
was emphasized that the more accurate their beliefs about their rank in the group are, the
better they will be able to make the tournament entry choice.27
Similar to the announcement of the belief elicitation task in Announcement, the tour-
nament was announced during the first session after subjects had received the feedback. In
addition, subjects were reminded in a letter they received at the end of the first session. All
other aspects of the design were identical to Announcement. 58 subjects participated in the
tournament announcement condition, and there was no attrition at all, i.e., all subjects that
showed-up to the first also showed up to the second experimental session. The experiments
were conducted in January and February 2016 at the BonnEconLab. Subjects were mostly
students from the University of Bonn and were recruited using the online recruitment system
hroot (Bock, Baetge and Nicklisch, 2014). The experiments were computerized using the
experimental software z-tree (Fischbacher, 2007) and the online survey tool Qualtrics.
Table C.3 shows the main results. In the table we compare belief adjustments after
1 month between treatment TournamentAnnouncement and treatment Confidence1month.
Columns (1) and (2) reveal that the announcement of a tournament has no significant effect
on belief adjustments after positive feedback. Belief adjustments after negative feedback,
however, are substantially affected. While beliefs in treatment Confidence1month reflected
negative negative only to a small degree, beliefs in TournamentAnnouncement are substan-
tially adjusted, leading to a sizeable and significant treatment difference (see columns (3) and
(4) of Table C.3). Columns (5) and (6) show the results of a difference-in-difference estima-
tion on (i) a treatment dummy, (ii) a feedback dummy, and (iii) an interaction term equal to
one if subjects were in the Confidence1month treatment and obtained negative information.
The coefficient of the interaction term is positive and significant, confirming findings from
columns (1)-(4). All results are robust to adding controls and to using alternative classi-
fications of positive and negative feedback In Table C.4, we show results when we classify
feedback by defining 3 positive comparisons as positive feedback and 3 negative comparisons
as negative feedback. In Table C.5 we classify feedback according to Bayes’ rule.
27The actual tournament entry decision took place at the end of second lab session. We elicited subjectsvaluation to participate in the tournament using a simple price list format. In the tournament, subjectsreceived 5 euros if they ranked higher than the randomly chosen other group member. In the price list,subjects could choose between receiving a fixed amount or participating in the tournament. The fixed amountvaried from choice to choice and increased in 20 cents increments from 0.20 euros to 3.00 euros.
47
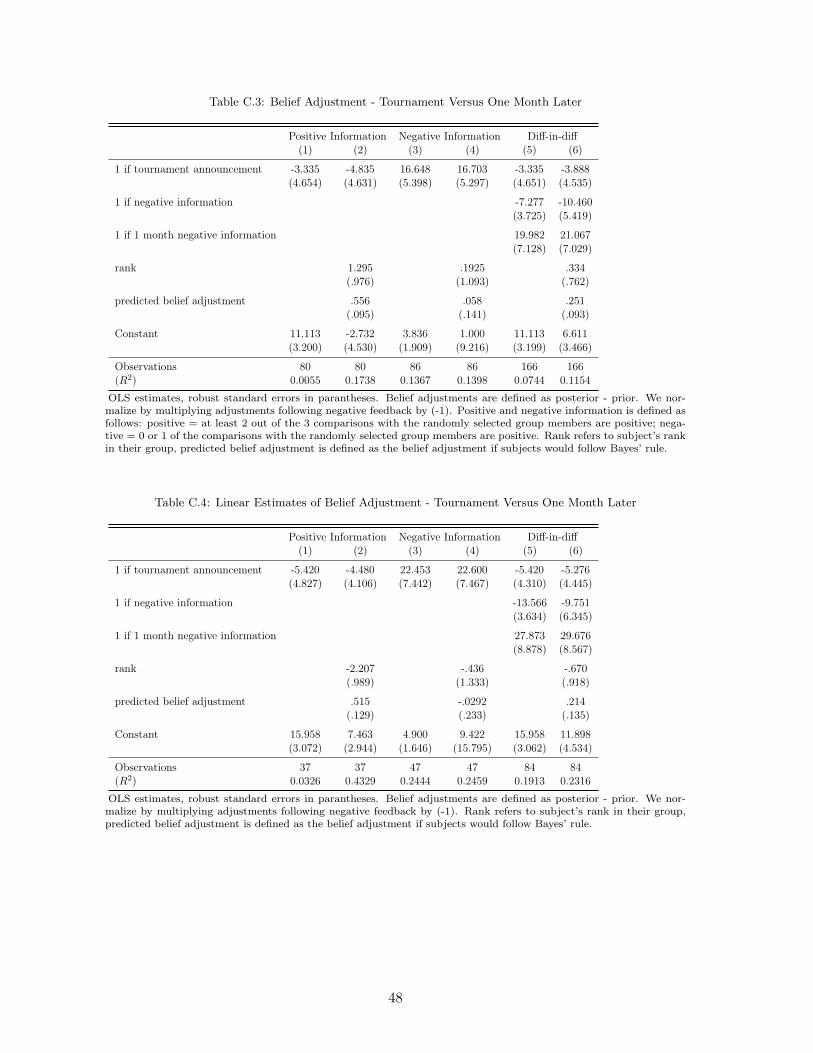
Table C.3: Belief Adjustment - Tournament Versus One Month Later
Positive Information Negative Information Diff-in-diff(1) (2) (3) (4) (5) (6)
1 if tournament announcement -3.335 -4.835 16.648 16.703 -3.335 -3.888(4.654) (4.631) (5.398) (5.297) (4.651) (4.535)
1 if negative information -7.277 -10.460(3.725) (5.419)
1 if 1 month negative information 19.982 21.067(7.128) (7.029)
rank 1.295 .1925 .334(.976) (1.093) (.762)
predicted belief adjustment .556 .058 .251(.095) (.141) (.093)
Constant 11.113 -2.732 3.836 1.000 11.113 6.611(3.200) (4.530) (1.909) (9.216) (3.199) (3.466)
Observations 80 80 86 86 166 166(R2) 0.0055 0.1738 0.1367 0.1398 0.0744 0.1154
OLS estimates, robust standard errors in parantheses. Belief adjustments are defined as posterior - prior. We nor-malize by multiplying adjustments following negative feedback by (-1). Positive and negative information is defined asfollows: positive = at least 2 out of the 3 comparisons with the randomly selected group members are positive; nega-tive = 0 or 1 of the comparisons with the randomly selected group members are positive. Rank refers to subject’s rankin their group, predicted belief adjustment is defined as the belief adjustment if subjects would follow Bayes’ rule.
Table C.4: Linear Estimates of Belief Adjustment - Tournament Versus One Month Later
Positive Information Negative Information Diff-in-diff(1) (2) (3) (4) (5) (6)
1 if tournament announcement -5.420 -4.480 22.453 22.600 -5.420 -5.276(4.827) (4.106) (7.442) (7.467) (4.310) (4.445)
1 if negative information -13.566 -9.751(3.634) (6.345)
1 if 1 month negative information 27.873 29.676(8.878) (8.567)
rank -2.207 -.436 -.670(.989) (1.333) (.918)
predicted belief adjustment .515 -.0292 .214(.129) (.233) (.135)
Constant 15.958 7.463 4.900 9.422 15.958 11.898(3.072) (2.944) (1.646) (15.795) (3.062) (4.534)
Observations 37 37 47 47 84 84(R2) 0.0326 0.4329 0.2444 0.2459 0.1913 0.2316
OLS estimates, robust standard errors in parantheses. Belief adjustments are defined as posterior - prior. We nor-malize by multiplying adjustments following negative feedback by (-1). Rank refers to subject’s rank in their group,predicted belief adjustment is defined as the belief adjustment if subjects would follow Bayes’ rule.
48
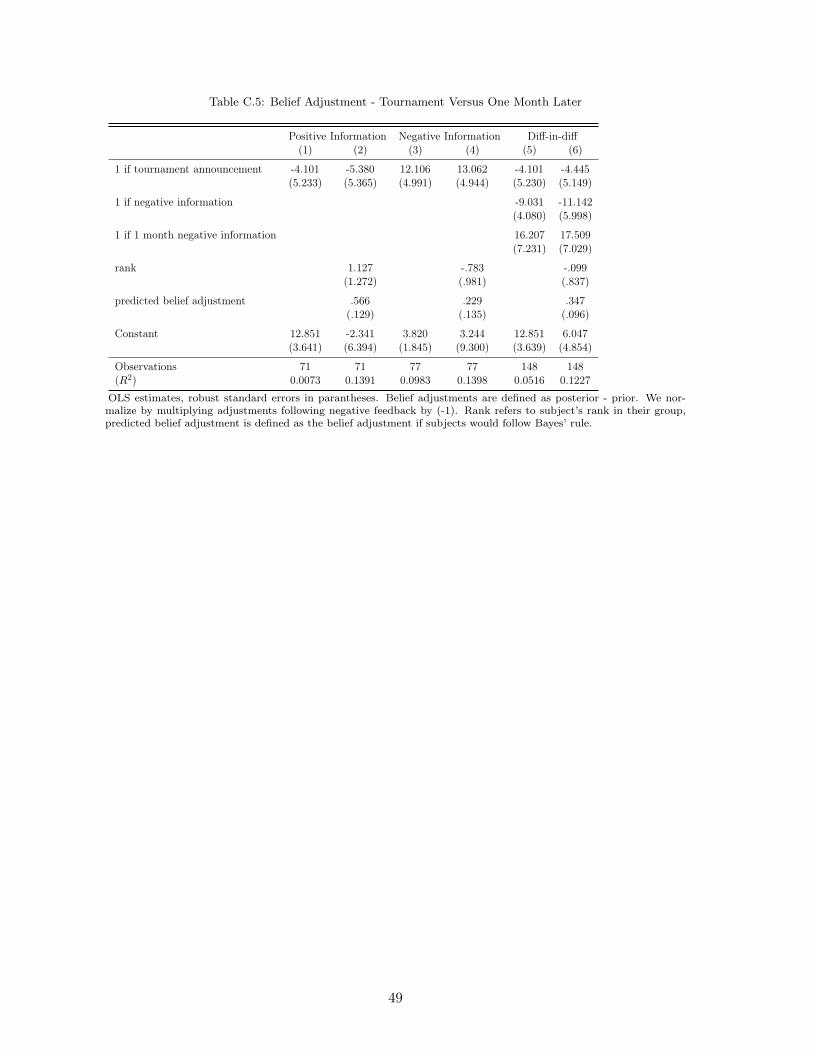
Table C.5: Belief Adjustment - Tournament Versus One Month Later
Positive Information Negative Information Diff-in-diff(1) (2) (3) (4) (5) (6)
1 if tournament announcement -4.101 -5.380 12.106 13.062 -4.101 -4.445(5.233) (5.365) (4.991) (4.944) (5.230) (5.149)
1 if negative information -9.031 -11.142(4.080) (5.998)
1 if 1 month negative information 16.207 17.509(7.231) (7.029)
rank 1.127 -.783 -.099(1.272) (.981) (.837)
predicted belief adjustment .566 .229 .347(.129) (.135) (.096)
Constant 12.851 -2.341 3.820 3.244 12.851 6.047(3.641) (6.394) (1.845) (9.300) (3.639) (4.854)
Observations 71 71 77 77 148 148(R2) 0.0073 0.1391 0.0983 0.1398 0.0516 0.1227
OLS estimates, robust standard errors in parantheses. Belief adjustments are defined as posterior - prior. We nor-malize by multiplying adjustments following negative feedback by (-1). Rank refers to subject’s rank in their group,predicted belief adjustment is defined as the belief adjustment if subjects would follow Bayes’ rule.
49
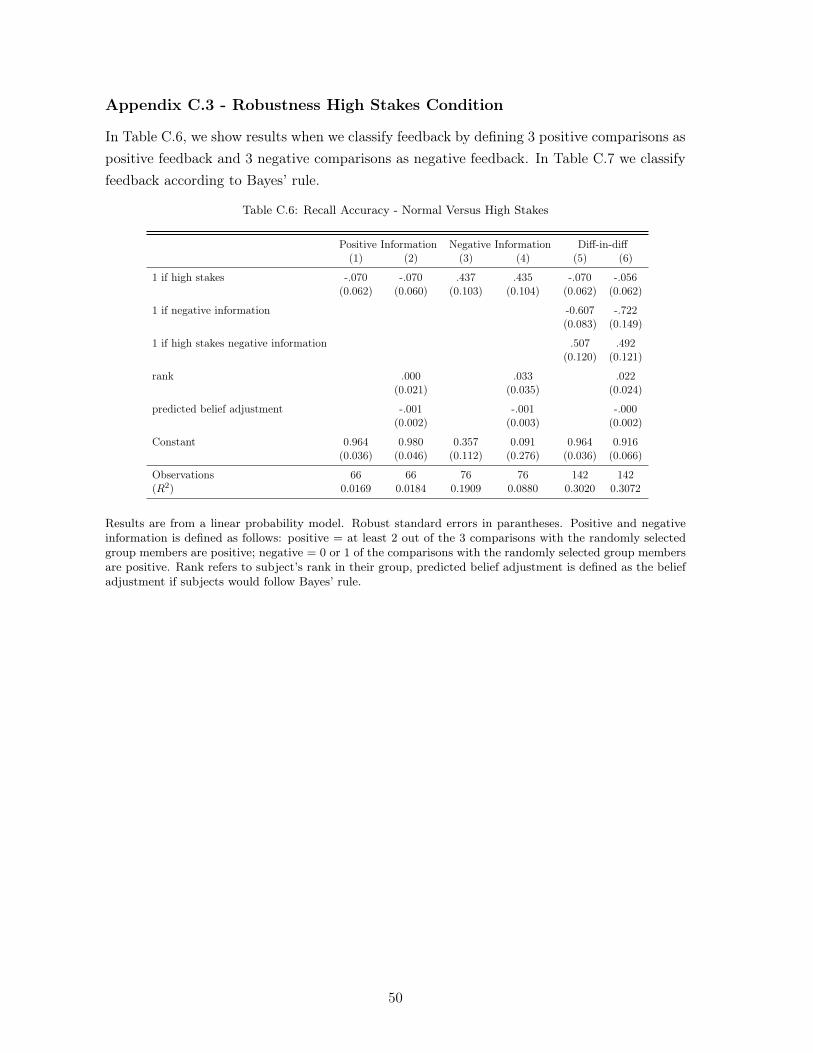
Appendix C.3 - Robustness High Stakes Condition
In Table C.6, we show results when we classify feedback by defining 3 positive comparisons as
positive feedback and 3 negative comparisons as negative feedback. In Table C.7 we classify
feedback according to Bayes’ rule.
Table C.6: Recall Accuracy - Normal Versus High Stakes
Positive Information Negative Information Diff-in-diff(1) (2) (3) (4) (5) (6)
1 if high stakes -.070 -.070 .437 .435 -.070 -.056(0.062) (0.060) (0.103) (0.104) (0.062) (0.062)
1 if negative information -0.607 -.722(0.083) (0.149)
1 if high stakes negative information .507 .492(0.120) (0.121)
rank .000 .033 .022(0.021) (0.035) (0.024)
predicted belief adjustment -.001 -.001 -.000(0.002) (0.003) (0.002)
Constant 0.964 0.980 0.357 0.091 0.964 0.916(0.036) (0.046) (0.112) (0.276) (0.036) (0.066)
Observations 66 66 76 76 142 142(R2) 0.0169 0.0184 0.1909 0.0880 0.3020 0.3072
Results are from a linear probability model. Robust standard errors in parantheses. Positive and negativeinformation is defined as follows: positive = at least 2 out of the 3 comparisons with the randomly selectedgroup members are positive; negative = 0 or 1 of the comparisons with the randomly selected group membersare positive. Rank refers to subject’s rank in their group, predicted belief adjustment is defined as the beliefadjustment if subjects would follow Bayes’ rule.
50

Table C.7: Recall Accuracy - Normal Versus High Stakes
Positive Information Negative Information Diff-in-diff(1) (2) (3) (4) (5) (6)
1 if high stakes -.057 -.072 .260 .276 -.057 -.071(0.066) (0.067) (0.096) (0.099) (0.066) (0.068)
1 if negative information -0.400 -.335(0.081) (0.103)
1 if high stakes negative information .317 .342(0.117) (0.119)
rank -.015 -.008 -.015(0.020) (0.025) (0.016)
predicted belief adjustment .001 -.003 -.002(0.003) (0.003) (0.002)
Constant 0.909 0.943 0.509 0.665 0.909 .999(0.044) (0.099) (0.068) (0.192) (0.044) (0.082)
Observations 98 98 94 94 192 192(R2) 0.0075 0.0160 0.0695 0.0876 0.1356 0.1437
Results are from a linear probability model. Robust standard errors in parantheses. Positive and negative
information is defined as follows: positive = at least 2 out of the 3 comparisons with the randomly selected
group members are positive; negative = 0 or 1 of the comparisons with the randomly selected group members
are positive. Rank refers to subject’s rank in their group, predicted belief adjustment is defined as the belief
adjustment if subjects would follow Bayes’ rule.
51

Appendix D - Sociodemographics Summary and Balance
52
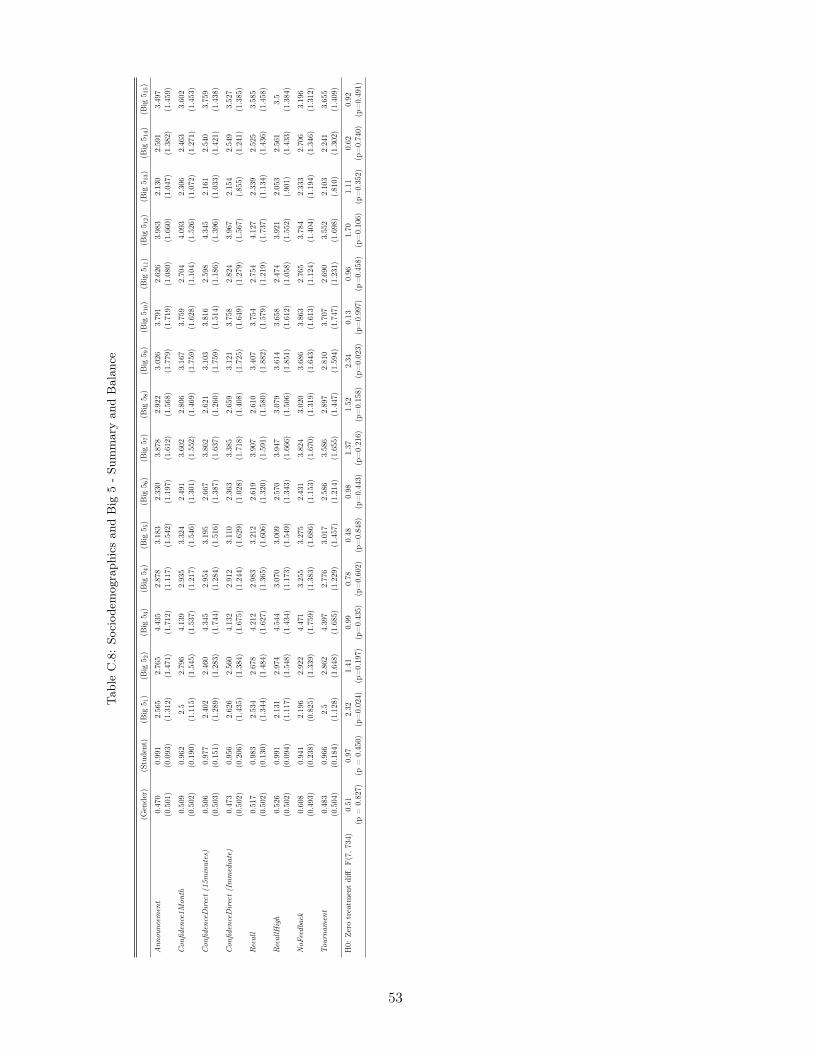
Table
C.8
:Soci
odem
ogra
phic
sand
Big
5-
Sum
mary
and
Bala
nce
(Gen
der
)(S
tuden
t)(B
ig5 1)
(Big
5 2)
(Big
5 3)
(Big
5 4)
(Big
5 5)
(Big
5 6)
(Big
5 7)
(Big
5 8)
(Big
5 9)
(Big
5 10)
(Big
5 11)
(Big
5 12)
(Big
5 13)
(Big
5 14)
(Big
5 15)
Announce
men
t0.
470
0.99
12.
565
2.76
54.
435
2.87
83.
183
2.33
03.
878
2.92
23.0
263.
791
2.62
63.
983
2.13
02.
591
3.49
7(0
.501
)(0
.093
)(1
.312
)(1
.471
)(1
,712
)(1
.117
)(1
.542
)(1
.197
)(1
.612
)(1
.568
)(1
.779
)(1
.719
)(1
.080
)(1
.660
)(1
.047
)(1
.382
)(1
.459
)
Confiden
ce1M
onth
0.50
90.
962
2.5
2.79
64.
139
2.93
53.
324
2.49
13.
602
2.80
63.
167
3.75
92.
704
4.09
32.
306
2.46
33.
602
(0.5
02)
(0.1
90)
(1.1
15)
(1.5
45)
(1.5
37)
(1.2
17)
(1.5
46)
(1.3
01)
(1.5
52)
(1.4
69)
(1.7
59)
(1.6
28)
(1.1
04)
(1.5
26)
(1.0
72)
(1.2
71)
(1.4
53)
Confiden
ceD
irec
t(1
5m
inute
s)0.
506
0.97
72.
402
2.46
04.
345
2.95
43.
195
2.66
73.
862
2.62
13.1
033.
816
2.59
84.
345
2.16
12.
540
3.75
9(0
.503
)(0
.151
)(1
.289
)(1
.283
)(1
.744
)(1
.284
)(1
.516
)(1
.387
)(1
.637
)(1
.260
)(1
.759
)(1
.514
)(1
.186
)(1
.396
)(1
.033
)(1
.421
)(1
.438
)
Confiden
ceD
irec
t(I
mm
edia
te)
0.47
30.
956
2.62
62.
560
4.13
22.
912
3.11
02.
363
3.38
52.
659
3.1
213.
758
2.82
43.
967
2.15
42.
549
3.52
7(0
.502
)(0
.206
)(1
.435
)(1
.384
)(1
.675
)(1
.244
)(1
.629
)(1
.028
)(1
.718
)(1
.408
)(1
.725
)(1
.649
)(1
.279
)(1
.567
)(.
855)
(1.2
41)
(1.3
85)
Rec
all
0.51
70.
983
2.53
42.
678
4.21
22.
983
3.21
22.
619
3.90
72.
610
3.4
073.
754
2.75
44.
127
2.33
92.
525
3.58
5(0
.502
)(0
.130
)(1
.344
)(1
.484
)(1
.627
)(1
.365
)(1
.606
)(1
.320
)(1
.591
)(1
.580
)(1
.882
)(1
.579
)(1
.219
)(1
.737
)(1
.134
)(1
.436
)(1
.458
)
Rec
allH
igh
0.52
60.
991
2.13
12.
974
4.54
43.
070
3.00
92.
570
3.94
73.
079
3.6
143.
658
2.47
43.
921
2.05
32.
561
3.5
(0.5
02)
(0.0
94)
(1.1
17)
(1.5
48)
(1.4
34)
(1.1
73)
(1.5
49)
(1.3
43)
(1.6
66)
(1.5
06)
(1.8
51)
(1.6
12)
(1.0
58)
(1.5
52)
(.90
1)(1
.433
)(1
.384
)
NoFee
dba
ck0.
608
0.94
12.
196
2.92
24.
471
3.25
53.
275
2.43
13.
824
3.02
03.6
863.
863
2.76
53.
784
2.33
32.
706
3.19
6(0
.493
)(0
.238
)(0
.825
)(1
.339
)(1
.759
)(1
.383
)(1
.686
)(1
.153
)(1
.670
)(1
.319
)(1
.643
)(1
.613
)(1
.124
)(1
.404
)(1
.194
)(1
.346
)(1
.312
)
Tourn
am
ent
0.48
30.
966
2.5
2.86
24.
397
2.77
63.
017
2.58
63.
586
2.89
72.
810
3.70
72.
690
3.55
22.
103
2.24
13.
655
(0.5
04)
(0.1
84)
(1.1
28)
(1.6
48)
(1.6
85)
(1.2
29)
(1.4
57)
(1.2
14)
(1.6
55)
(1.4
47)
(1.5
94)
(1.7
47)
(1.2
31)
(1.6
98)
(.81
0)(1
.302
)(1
.409
)
H0:
Zer
otr
eatm
ent
diff
.F(7
,73
4)0.
510.
972.
321.
410.
990.
780.
480.
981.
371.
522.
340.
130.
961.
701.
110.
620.
92(p
=0.
827)
(p=
0.45
0)(p
=0.
024)
(p=
0.19
7)(p
=0.
435)
(p=
0.602
)(p
=0.
848)
(p=
0.44
3)(p
=0.
216)
(p=
0.15
8)(p
=0.
023)
(p=
0.99
7)(p
=0.
458)
(p=
0.10
6)(p
=0.
352)
(p=
0.74
0)(p
=0.
491)
53