Embed Size (px)
Citation preview

T
Bo
http://ww
THE DIRE
oston Univer
Bos
Bos
This paper
ww.bu.edu/l
ECT COST
rsity School(Jun
Jamston Unive
Michaston Unive
r can be do
aw/faculty/
TS FROM
of Law Worne 25, 2012)
es Besseersity Scho
ael J. Meuersity Scho
ownloaded w
/scholarship
NPE DIS
rking Paper )
en ool of Law
urer ool of Law
without cha
p/workingpa
SPUTES
No. 12-34
w
w
arge at:
apers/20122.html

The Direct Costs from NPE Disputes
By James Bessen and Michael J. Meurer (Boston University School of Law)
6/22/12
Abstract:
In the past, “non-practicing entities” (NPEs), popularly known as “patent trolls,” have helped small inventors profit from their inventions. Is this true today or, given the unprecedented levels of NPE litigation, do NPEs reduce innovation incentives? Using a survey of defendants and a database of litigation, this paper estimates the direct costs to defendants arising from NPE patent assertions. We estimate that firms accrued $29 billion of direct costs in 2011. Moreover, although large firms accrued over half of direct costs, most of the defendants were small or medium-sized firms, indicating that NPEs are not just a problem for large firms. We thank David Anderson and the staff at RPX for invaluable assistance. We thank Brian Love, Michael Risch, and Catherine Tucker for helpful comments, and Cong Yao, supported by funds from the Coalition for Patent Fairness, for able research assistance.

2
Executive Summary
This paper analyzes the direct costs of patent assertions by “non-practicing entities”
(NPEs) against operating companies using a survey of defendants and a comprehensive
database of NPE lawsuits. The main findings include:
• NPE litigation is growing rapidly, affecting 5,842 defendants in 2011.
• The direct costs of NPE patent assertions are substantial, totaling about $29 billion
accrued cost in 2011, including the costs of non-litigated assertions. This figure
excludes various indirect costs to the defendants’ businesses such as diversion of
resources, delays in new products, and loss of market share.
• Much of this burden falls on small and medium-sized companies. The median
company sued had $10.8 million in annual revenues. 82% of the defendants had less
than $100 million in revenue and these accounted for 50% of the defenses. Small
and medium-sized companies account for 37% of the accrued direct costs.
Moreover, compared to revenues, the direct costs of NPE patent assertions are
relatively larger for small companies.
• We find little evidence that NPEs promote invention overall. Publicly-traded NPEs
cost small and medium-sized firms more money than these NPEs could possibly
transfer to inventors. This reduces the net amount that firms of any size have
available to invest in innovation.
• NPEs appear to be highly heterogeneous. Much of the litigation appears to consist
of nuisance suits that settle for a few hundred thousand dollars. But some NPEs are
“big game hunters” who seek and get settlements in the tens or hundreds of million
dollars.

3
Introduction
What sort of costs do Non-Practicing Entities (NPEs) impose on firms targeted for
the assertion of their patents? What do target firms spend on legal services and how much
do they pay for licenses? And what sort of firms do NPEs target? We present answers to
these questions based on a unique survey of defendant companies and a comprehensive
database of NPE litigation. The survey, which covers 82 firms who mounted 1,184 defenses
against NPE litigation, is unique in three ways. First, it includes defendant companies that
are privately held, including small firms. Second, it reveals information about costs
associated with cases in which NPE patents are asserted but which are resolved before a
lawsuit is filed. Finally, it provides aggregated information about NPE patent license fees.
These kinds of information have not been available, in part, because the terms of patent
licenses are often secret, and in part because previous surveys have simply not asked about
assertions that did not advance to the filing of lawsuits. The costs disclosed by this survey
are significant and should play a prominent role in policy debates about the treatment of
NPE patent lawsuits.
NPEs are individuals and firms who own patents but do not directly use their
patented technology to produce goods or services, instead they assert them against
companies that do produce goods and services. In the past, some NPEs have played a
valuable role in bringing innovations from small inventors to market. Some inventors lack
the resources and expertise needed to successfully license their technologies or, if necessary,
to enforce their patents. NPEs provide a way for these inventors to earn rents that they
might not otherwise realize, thus providing them with greater incentives to innovate. But in

4
the past, also, some NPEs have used patents opportunistically. During the late nineteenth
century, “patent sharks” were widely seen as extracting money from innocent individual
farmers and railroad companies (Magliocca 2007).
However, while NPEs have been around for a long time, over the last few years,
NPE litigation has reached a wholly unprecedented scale and scope (Patent Freedom, 2012;
RPX, 2012). In 2011, 2,150 unique companies were forced to mount 5,842 defenses in
lawsuits initiated by the actions of NPEs.1 Moreover, the number of defenses has been
growing rapidly (see Figure 1). Part of this growth has been fueled by new sources of
funding and new business models.
The costs born by defendants in these assertions are key to evaluating the private and
social impact of this new phenomenon. In previous research with co-author Jennifer Ford
(Bessen et al. 2011), we have estimated the total costs of NPE litigation for publicly listed
firms using stock market event studies. This study complements our earlier study by
obtaining estimates of the direct cost portion of total costs using data from a survey of
defendants.2 Direct costs include the cost of outside legal services, licenses fees, and other
direct costs incurred in response to NPE litigation risk.3
This study also complements our earlier study by providing information on
companies that are not publicly listed, including small companies. This information helps
1 These figures come from the RPX database described below. About 4% of these defenses were mounted as declaratory actions rather than infringement suits; these were nevertheless initiated by the NPEs. The figure for 2011 reflects, to some extent, an effort by NPEs to initiate litigation before the America Invents Act took effect, restricting multi-party lawsuits. Nevertheless, the trend shown in Figure 1 illustrates rapid growth before 2011. 2 The survey was conducted by RPX, a firm that helps companies manage risk from exposure to patent litigation. The Coalition for Patent Fairness reimbursed RPX for part of the expense of conducting this survey. 3 Indirect costs captured by our event study methodology include the opportunity costs of the effort exerted legal, managerial, engineering, and scientific personnel inside the firm, and other business disruption costs such as loss of goodwill, loss of market share, or disruption of innovative activities.

5
reveal the extent to which NPEs help small firms realize profits from their innovations and
the extent to which small firms, to the contrary, incur costs as the targets of NPEs.
Literature Review
Large scale NPE patent litigation is a recent development, thus the empirical
literature is thin. Our NPE lawsuit event study is the most closely related piece of earlier
research; in it we found that the annual wealth lost from NPE lawsuits was about $80 billion
for publicly traded U.S. firms (Bessen et al. 2011). In theory, this cost could be composed
mostly of transfers in the form of royalty payments to NPEs. Indeed, a number of papers
argue that NPEs play a socially valuable role by enabling small inventors to realize greater
profits from their inventions (Hosie 2008, McDonough 2006, Shrestha 2010, Myhrvold
2010, Morgan 2008). These papers, however, do not provide empirical evidence to support
that assertion.
Our 2011 paper rejected that possibility based on the evidence available to us; we
concluded that much of the cost borne by technology companies as they defend against
NPE lawsuits is a social loss and not a mere transfer. The survey results we describe below
provide strong additional support for our view that much of cost imposed on defendants is a
social loss. In particular, the current study finds that NPEs impose costs not only on large
technology companies, but also on very many small and medium firms, making it even less
likely that innovative start-ups are net beneficiaries of NPE activity.
One other researcher has quantified the costs to defendants from NPE litigation.
Catherine Tucker examines the effect of a lawsuit by an NPE (Acacia) against several firms
that make medical imaging software. She compares the impact of the lawsuit on sales of
both medical imaging and text-based medical software produced by the targeted firms. She

6
also compares the sales by the targeted firms to the sales of medical imaging software made
by other firms in the industry who were not targeted with a lawsuit. She finds that sales of
medical imaging software declined by one-third for targeted firms. She attributes the sales
decline to a “lack of incremental product innovation during the period of litigation,” and she
conjectures that incremental innovation was deterred by concerns it would create additional
risks in the on-going litigation. (Tucker 2011).
Two other strands of previous research are especially relevant to this project. First,
earlier work has quantified legal fees associated with patent litigation. We collected data
about legal fees that were made public in court decisions concerning fee-shifting in patent
cases (Bessen and Meurer 2012). Also, the American Intellectual Property Law Association
conducts a biannual survey of its members and includes questions about fees in patent
lawsuits (AIPLA 2011). The sources are helpful and we report some of their findings below,
but they do not contain information about NPE litigation in particular, and they do not
contain information about assertions that never reach the filing of a lawsuit.
A better-developed strand of literature reports various characteristics of NPE
litigation.4 While not measuring costs, these studies do shed light on the question of whether
the private losses to firms targeted by NPE patent assertions also tend to be social losses.
The answer appears to be yes. NPE patent litigation has all the hallmarks of patent notice
failure that distorts the patent system and makes it impede technological progress. In Patent
Failure (Bessen and Meurer 2008) we show that the U.S. patent system works well for
chemical and pharmaceutical inventions because the system provides clear notice to the
world of the scope and existence of patent-based property rights. For most other inventions,
4 This includes Allison et al. (2010), Chien (2009), Love (2010), Risch (2012), Schwartz (2012), and Tucker (2012). Other studies have looked at the characteristics of NPE patents asserted in lawsuits, including Shrestha (2010), Allison et al. (2009), Risch (2012), and Fischer and Henkel (2011).

7
especially software and business methods, notice failure means that innovative firms are
targeted in patent infringement suits through no fault of their own.
Notice failure is likely for NPE lawsuits. Sixty-two percent of the time they feature
software patents (Bessen et al. 2011) which are notoriously difficult to interpret. Allison et al.
(2010) study patents litigated multiple times and usually asserted by NPEs; they find that
software patents account for 94% of such lawsuits. The patents asserted in NPE lawsuits are
often subject to lengthy prosecutions which delays public access to information about patent
claims (Allison et al., 2009, Love 2010, Risch 2012). Rather than transferring technology and
aiding R&D it appears that NPEs usually arrive on the scene after the targeted innovator has
already commercialized some new technology (FTC 2011).
Data
Survey
Between February and April 2012, RPX invited about 250 companies to participate
in a survey of their NPE-related costs. The pool of invitees included RPX clients and non-
client companies with whom RPX has relationships. Most invitees were technology
companies, but certain non-technology companies with NPE exposure were also invited (for
example retailers with e-commerce exposure). Participants provided information to the
extent that doing so was consistent with their obligations to third parties. The information
was aggregated and anonymized such that individual data was not disclosed.5
Participants filled out a standardized Excel template that included a range of
questions about their NPE-related costs. The instructions for the template asked that
participants include certain statistics estimating all of their direct (external spend) NPE-
5 Although RPX provided data for this study, RPX did not exercise control over the substance of our text.

8
related costs from 2005-2011. An NPE was defined to include patent assertion entities,
individual inventors, universities, and non-competing entities (operating companies asserting
patents well outside the area in which they make products and compete). This is the same
definition of NPE used on the NPE Lawsuit Database (see below). A list of each
participant’s NPE litigations from that database was provided to ensure alignment between
the survey response and database. Templates were submitted by email or directly into a
secure online data room. To the extent possible, an RPX study team reviewed the
submission for quality and completeness. If needed, the company was asked certain follow-
up questions. Finally, RPX aggregated the submitted data within a secure computing
environment. The resulting dataset forms the basis of the data tables provided in this
document.
Of the 250 companies invited to participate, 82 provided data on lawsuits and of
these, 46 also provided data on non-litigation patent assertions and related costs.
NPE Lawsuit Database
In addition to the survey, we also used a comprehensive database of NPE litigation
developed by RPX. These NPE litigation statistics are based on cases coded “830 Patent” in
the PACER database which is maintained by the Administrative Office of the U.S. Courts.6
In case counts, RPX excludes misfiles, non-patent, false marking and other non-core patent
infringement cases. When a case is transferred, RPX counts it as one case and allocates it to
the venue to which it was transferred. When several cases are consolidated into one, RPX
counts it as one case but with multiple defendants. When a case is severed RPX counts it as
separate cases. In defendant counts, RPX rolls up operating company subsidiaries into a
6 This database does not include patent disputes before the International Trade Commission.

9
parent entity (Samsung Group and Samsung Electronics count as one defendant).
Declaratory actions are included in case counts unless otherwise noted.
RPX defines NPEs as discussed above and identifies NPEs through a manual review
process. In this review process, RPX reads patent complaints found in PACER and checks
information in the complaint against its NPE database. RPX also checks its database of
plaintiff counsel, searches public filings and performs web research. Some of the factors
they consider when determining whether a company is an NPE (or more specifically a patent
assertion entity “PAE”) include: Is the entity the same as or share a substantial financial link
with a known PAE? Is there any evidence that the company sells a product or offers a
service? Does the entity webpage prominently mention technology, licensing, and patents;
and not offer a product or sales? Does the complaint indicate whether the entity has a
product in-market or in-development that is being harmed by infringement? Are the lawyers
involved known to specialize in representing NPEs? Is this entity known as an NPE or as an
established operating company?7
Sample characteristics
Table 1 compares characteristics of the survey sample with RPX’s database of NPE
lawsuit defenses. Data for the survey are on the left while data for the entire database of
NPE defenses are on the right. The 82 surveyed companies collectively mounted 1,184
defenses in NPE lawsuits beginning between 2005 and 2011. Of these, 784, or 66%, were
resolved by adjudication or settlement and did not involve indemnification or other factors
that cause costs to be atypical.
7 There are a range of views among scholars and policy-makers about the appropriate definition of NPE, and different analysts are likely to assembly different NPE litigation databases. Based on our experience researching patent litigation, we believe that the RPX database yields statistics that are consistent with information about NPE patent litigation from other sources.

10
Note that a possible truncation bias arises because so many lawsuits were unresolved
at the time of the survey. Because lengthier disputes tend to be more costly, at least as far as
legal costs are concerned (Kesan and Ball 2005), and because the number of lawsuit filings
has risen sharply in recent years, cost estimates based only on resolved lawsuits might be
understated.
We divided the companies into sub-categories based on their revenue in the most
recent year reported. We categorize companies as small, medium or large depending on
whether reported revenue for the most recent year is less than $100 million, between $100
million and $1 billion, or above $1 billion. The $100 million revenue cutoff for small
companies corresponds roughly to 500 employees, which is the cutoff used by the US Patent
and Trademark Office and other government bodies to categorize small companies. While
we have revenue data on all of the companies in the survey sample, the RPX database
reports company revenue for only 74% of the defenses. These data come from public
reports and from Dun and Bradstreet, which estimates revenues for private companies. It is
thus likely that almost all of the companies without reported revenue are small companies. In
much of the analysis below, we explicitly assume this to be the case. This assumption is
conservative in that it results in a lower estimate of aggregate costs of litigation.
We also divided companies into two broad industry sectors depending on whether
they were in the broad software industry, including e-commerce and finance, or instead in a
hardware industry (everything else).8 The latter distinction might be significant because most
8 To preserve data confidentiality, statistical analysis was performed by RPX personnel working under our direction.

11
hardware industries involve greater sunk capital costs than do software industries or finance
and for this reason hardware industries may be more at risk of hold up.9
The right panel shows that small and medium firms dominate the universe of NPE
defendants. Small and medium-sized companies make up 90% of the defendant firms,
mounting 59% of the defenses. Firms making less than $100 million in revenue account for
82% of the defendants and 50% of the defenses, assuming that firms with unreported
revenue are small.10 The median revenue of a defendant company reporting revenue is $10.8
million.
As the Table shows, our survey sample consists of companies that are larger, more
likely to be public and which experience relatively more lawsuits than the average NPE
defendant firm. In the rows that control for size and industry sector, survey firms appear to
experience about twice as many lawsuits as companies in the comprehensive database. This
is not surprising, however, it raises the possibility that our sample might be unrepresentative
of the broader population, possibly experiencing costs that are greater or smaller than those
of the universe of sued companies. Below we do a check on legal costs to test whether the
survey appears to have unrepresentative costs.
9 Readers should be mindful of the distinction between the industry of the defendant and the technology covered by the patent asserted by the NPE. In particular, it is important to recognize that problematic software patents are often asserted against hardware manufacturers. 10 If, instead, we look only at firms with reported revenue, 66% are small, accounting for 33% of the defenses.

12
Findings
Mean and median costs
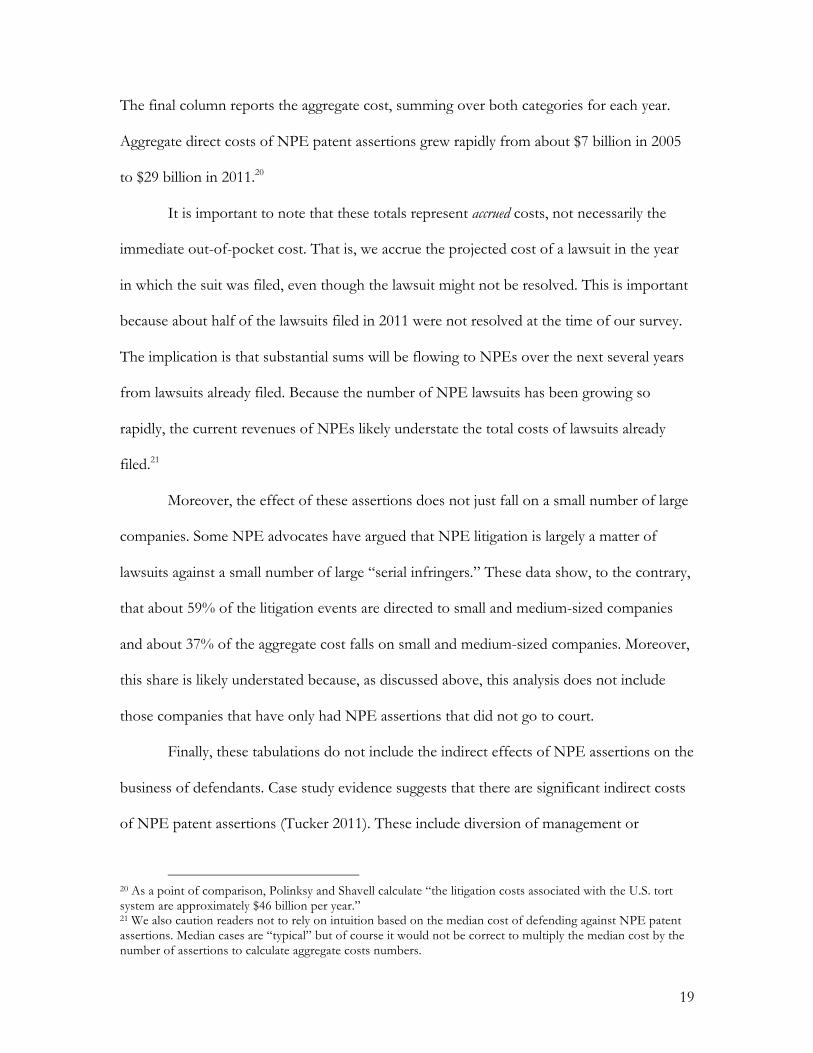
Table 2 provides estimates of mean legal11 costs, licensing costs and total costs (the
sum of these) with standard errors in parentheses. The table also shows median costs.
Median total costs per litigation defense fall roughly around half a million dollars,
smaller for small and medium firms, larger for big ones. However, mean total costs are much
higher, nearly eight million dollars for our survey sample. This difference implies that the
distribution of costs is highly skewed, as we explore below. Thus one must be particularly
careful in extending judgments about the costs of litigation based on small samples. While
“typical” costs might only be a few hundred thousand dollars, mean costs—reflecting the
large costs in a small number of very costly lawsuits—are an order of magnitude higher.
Mean total costs are, not surprisingly, significantly greater for large companies than
small and medium companies. This difference is significant at the 1% level.
The first column reports the legal component of costs. Mean legal costs per defense
range from $420,000 for small/medium companies to $1.52 million for large companies.
Column 2 of Table 2 reports the dollar amounts paid to the plaintiff to settle the
case.12 Column 3 reports the total costs, the sum of legal and settlement costs. The mean
settlement costs for small/medium companies are $1.33 million and for large companies,
11 In the survey estimated legal costs for a particular case were specified as: “Value of any legal costs related to this matter through December 31, 2011. Include outside counsel (lead and local), experts, discovery costs, prior art searching, jury consultants, graphics, other expenses, and other related costs. Include any costs that were ultimately recouped or expected to be recouped by indemnification agreements or other mechanisms. Exclude in-house legal costs.” 12 In the survey estimated settlement costs for a particular case were specified as: “Value of settlement. If a running royalty, estimate the present value of royalties. If there was an exchange of patents or other non-standard deal structure then estimate expected present value cost of that deal..” Settlement costs include damage awards in a small number of cases.

13
$7.27 million. Mean total litigation costs are $1.75 million for small/medium companies and
$8.79 million for large companies.
Legal costs are about a third as large as settlement costs, or about one quarter of
total litigation costs (slightly larger for small/medium companies).13 This implies that a
substantial part of direct costs of NPE litigation is a deadweight loss to society.14 For the
median case, legal costs are roughly equal to settlement costs.
Also note that NPE litigation is relatively more costly to smaller companies. In our
sample, the large company litigation costs were five times as high as small/medium company
litigation costs. But (see Table 1) the mean revenue of large companies in our sample is
nearly seven times the mean revenue of the small and medium companies. This means that,
roughly speaking, smaller companies pay more in direct NPE litigation costs relative to their
size.
Hardware firms have higher costs than software firms. This difference is significant
at the 5% level. Since hardware firms generally have greater sunk costs than software firms,
this difference is consistent with the interpretation that hardware firms are more easily
subject to holdup and hence they have to pay more to settle litigation.
Comparison to other studies
As noted above, the survey sample was not randomly selected and hence it could be
unrepresentative. In particular, it might be that survey respondents tended to be firms with
higher than average litigation costs.
13 Weighting the ratios in Table 2 to represent the relative weights of small and large companies in the total database, legal costs are 23% of the total and licensing costs are 77%. 14 The indirect costs of NPE lawsuits, such as those measured by Tucker (2011) and Bessen et al. (2011) are likely to be a more significant source of deadweight loss.

14
We can check the representativeness of our sample by comparing our findings to
other empirical evidence. In particular, legal costs can be compared to estimates derived
from two other sources. First, AIPLA conducts a bi-annual survey of its members who
estimate typical legal costs through discovery and through trial. They report these estimates
for three categories of patent lawsuits depending on the amount at issue in the controversy,
specifically, whether the amount at issue is less than $1 million, between $1 million and $25
million, and greater than $25 million. The first and third categories provide the ranges shown
in the addendum to Table 2.15 Few patent lawsuits go to trial (Kesan and Ball 2005), so the
figure for costs through discovery is probably closer to the mean cost for patent litigation.
On this basis, the AIPLA cost estimates are comparable or even higher than the mean cost
estimates from our survey.
We also compared the survey means to means from 137 cases where one party in a
lawsuit had been required to pay the others’ legal fees. These were for cases between 1985
and 2004 (Bessen and Meurer 2012). Converted into 2011 dollars, the cost for lawsuits that
ended in summary judgments was $840,000; the cost for those that ended in a trial verdict
was $3.64 million. Since most lawsuits are not settled by an initial summary judgment but are
settled before trial, mean legal costs should fall between these figures. Again, the survey
estimates seem broadly comparable. This suggests that our survey sample is not
unrepresentative.
It is possible, of course, that our survey might report representative legal costs but
unrepresentative licensing costs. This might happen, for instance, if our survey over-
represented hardware companies who tend to have relatively higher licensing costs.
However, Table 1 suggests that the share of hardware firms in the survey roughly matches
15 For the middle range, the estimated costs are $1.6 million through discovery and $2.8 through trial.

15
the share in the universe of NPE defendants found in the database. Generally speaking,
firms with higher licensing costs will tend to have higher legal costs, all else equal. This is
because firms facing a large payout can typically reduce the payout or the likelihood of
having to pay damages in trial by mounting a more aggressive (and more expensive) legal
defense. That said, we cannot be certain that our estimates are representative, nevertheless,
the representativeness of our legal cost estimates provides some comfort that licensing cost
estimates are not too far off.
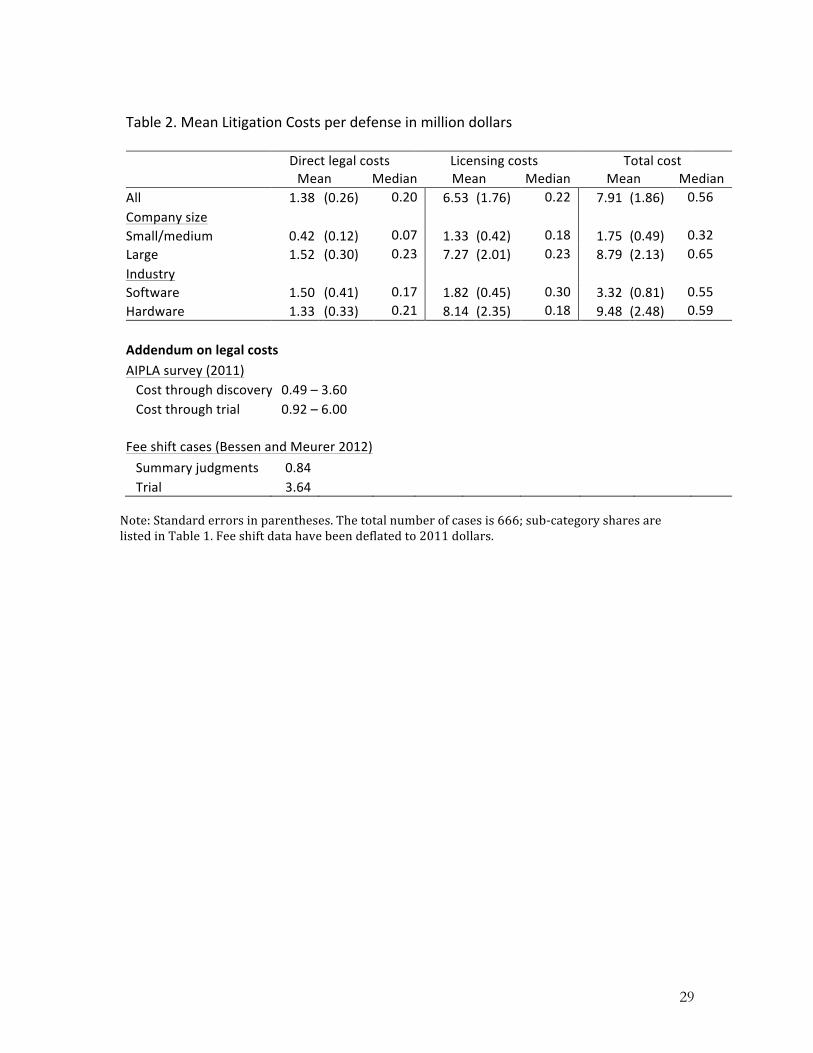
The distribution of litigation costs
Sample means do not capture the distribution of costs. In fact, litigation costs are
highly heterogeneous. Figure 2 shows cumulative distribution plots of total litigation costs
for the small/medium and large companies in our sample. The smooth curves represent
lognormal distribution functions fitted to the data.
As can be seen, the distribution is highly skewed. The median total litigation cost for
small/medium companies is $318,000 and for large companies it is $646,000. A large
fraction of lawsuits cost less than $200,000. But a small number of lawsuits cost much, much
more. For large companies, 5% of the lawsuits cost more than $22 million.
This heterogeneity likely arises in part from variation in NPE tactics. Schwartz (2012)
reports that some NPEs pursue nuisance suits in which they sue many companies, big and
small. Plaintiffs using this tactic are willing to settle for small payments, often no more than
the amount a defendant would spend on legal fees to defend the case. As one such plaintiff
lawyer put it, “An NPE intuitively understands that we could go for triples or home runs,
but we can also go for singles and get a good return and work on other things (Schwartz
2012).” Alternatively, NPEs may act like big game hunters, targeting only one or a few firms,
but hoping to win tens of millions of dollars. The lawsuit by NTP against BlackBerry maker

16
RIM is a good example. NTP asserted patents of doubtful validity but managed to win at
trial and obtain a settlement of $612.5 million from RIM (Bessen and Meurer, 2006). The
survey data does not permit us to clearly identify NPE tactics, but it does suggest that NPE
activity is not uniform.
While there are far fewer suits initiated by “big game hunters,” they represent a
disproportionate share of the cost. The distribution of costs is such that the top 5% of
defenses for large companies account for about two thirds of the total cost of defense for
large companies.
Costs from cases settled without litigation
Many NPE patent assertions are settled without a lawsuit being filed. To gather
information on non-litigated assertions, the survey also asked a series of questions regarding
these. Rather than count assertions, the survey asked respondents to report cumulative costs.
Most reported costs for the period from 2005 – 2011, but some did not have data for the
entire period. Moreover, only 46 of the companies completed this section of the survey.
The costs of assertions settled without litigation consist mainly of legal fees and
settlement costs paid to patent holders. They also include smaller amounts spent on NPE-
specific patent buying programs (including RPX services), on NPE-specific clearance
searches and on re-examinations of NPE patents.
The means of these components are reported in Table 3 along with the cumulative
litigation costs incurred by these same companies. For the sample as a whole, NPE costs
from cases without litigation were about half of the comparable costs of litigated cases. For
small/medium companies, in particular, however, costs of non-litigated cases exceeded
litigation costs. This might be because smaller firms lack internal legal resources, making it
relatively more expensive for them to pursue litigation. Also, costs of non-litigated cases

17
were higher relative to litigation costs for hardware firms, perhaps again because hardware
firms, being more at risk of hold up, find it less costly to settle sooner. This difference is not,
however, statistically significant.
In any case, it is clear that non-litigated patent assertions are responsible for much of
the direct costs imposed by NPEs on operating companies. In this regard, it is likely that our
sample under-represents these cost because we have only surveyed companies that have
been involved in litigation. That is, we have not included potentially large numbers of small
companies that have only settled NPE patent assertions and have not gone to court.
Anecdotal evidence from small companies suggests that there might be very many such
firms and their costs are missing from our analysis.
Aggregate Costs of NPE Assertions
Aggregation
What is the aggregate cost of NPE patent assertions, including both litigated and
non-litigated assertions? To estimate this, we began by estimating the mean cost of resolved
litigation for small/medium firms and for large firms. We could have directly used the data
in Table 2, however, this might overstate costs because the average small/medium firm in
our survey sample is larger than the average small/medium firm in the entire database (see
Table 1).16 To correct for this within-category variation, we regressed log cost against log
revenue for the survey sample and, using this, computed the predicted mean cost over the
actual distribution in the database for each size category.17 In using these means, we assume
16 In fact, we calculated aggregate costs using the data in Table 2, including the software/hardware categories. These estimates came out about 5-10% higher than those reported in Table 4. 17 Regressions are reported in the Appendix. We used a regression that also included a dummy variable for firms with less than $100 million in revenue in order to capture a non-linearity in the relationship between log cost and log revenue. The predicted mean cost per litigation was $1.527 million for small/medium firms and

18
that the lawsuits in each category in the database will on average accrue costs equal to these
respective mean values. That is, for lawsuits where the defendant was indemnified by a third
party, we assume that some party will pay an amount equal to the mean cost for defendants
in that category, even if the defendant firm itself does not necessarily pay this amount. Also,
we assume that lawsuits that are still underway will eventually accrue costs equal to these
means, even if the current out-of-pocket costs are not yet equal to this accrued cost.
To adjust these figures to account for assertions that are settled without litigation, for
each category we divided the total cost of non-litigated cases by the total number of lawsuits
filed, including lawsuits that were still active. This gave us a pro-rated cost of non-litigated
cases per lawsuit filed. We added this to the mean litigation cost for each category to give a
total cost of NPE assertions per lawsuit filed.18
The second part of this exercise consisted of breaking the cases in the RPX NPE
database into the two size categories. Where revenue was reported (about 74% of the
database), we allotted the defenses to small and large cells depending on whether the revenue
was smaller than or larger than $1 billion.19 We conservatively assigned those companies
without reported revenue to the “small” cells.
Year-‐by-‐year accrued costs
The left portion of Table 4 reports the number of defenses reported in the NPE
database by year for each size category. The right portion shows the aggregate cost of NPE
assertions per year calculated by multiplying the number of defenses reported on the left by
the prorated total cost of defense per cell (where the cost of defense includes license cost).
$5.641 million for large firms. We also ran regressions using hardware/software dummy variables, however, the coefficients on these dummies were not statistically significant. 18 These are $3.17 million for small/medium firms and $7.59 million for large firms. 19 RPX gathered revenue data from financial statements of publicly listed firms as well as estimates based on information such as number of employees available for private firms. Revenues were not reported when a private firm could not be definitely identified in their data sources.
19
The final column reports the aggregate cost, summing over both categories for each year.
Aggregate direct costs of NPE patent assertions grew rapidly from about $7 billion in 2005
to $29 billion in 2011.20
It is important to note that these totals represent accrued costs, not necessarily the
immediate out-of-pocket cost. That is, we accrue the projected cost of a lawsuit in the year
in which the suit was filed, even though the lawsuit might not be resolved. This is important
because about half of the lawsuits filed in 2011 were not resolved at the time of our survey.
The implication is that substantial sums will be flowing to NPEs over the next several years
from lawsuits already filed. Because the number of NPE lawsuits has been growing so
rapidly, the current revenues of NPEs likely understate the total costs of lawsuits already
filed.21
Moreover, the effect of these assertions does not just fall on a small number of large
companies. Some NPE advocates have argued that NPE litigation is largely a matter of
lawsuits against a small number of large “serial infringers.” These data show, to the contrary,
that about 59% of the litigation events are directed to small and medium-sized companies
and about 37% of the aggregate cost falls on small and medium-sized companies. Moreover,
this share is likely understated because, as discussed above, this analysis does not include
those companies that have only had NPE assertions that did not go to court.
Finally, these tabulations do not include the indirect effects of NPE assertions on the
business of defendants. Case study evidence suggests that there are significant indirect costs
of NPE patent assertions (Tucker 2011). These include diversion of management or
20 As a point of comparison, Polinksy and Shavell calculate “the litigation costs associated with the U.S. tort system are approximately $46 billion per year.” 21 We also caution readers not to rely on intuition based on the median cost of defending against NPE patent assertions. Median cases are “typical” but of course it would not be correct to multiply the median cost by the number of assertions to calculate aggregate costs numbers.

20
engineering resources, delays in new product introductions and improvements, loss or delay
of revenue, and credit constraints. Bessen et al. (2011) estimate the total business costs of
NPE litigation for public firms using stock market event studies. Although the samples and
methods are not directly comparable, they find an aggregate loss of stock market
capitalization of around $80 billion per year during recent years, corresponding to an
aggregate cost in operational funds to the firms of about half that amount. This suggests
loosely that total business costs of NPE assertions might be at least twice as large as the
figures reported in Table 4.
Benefits to innovators
It is sometimes argued that NPEs facilitate innovation by providing incentives to
small inventors who would not otherwise be able to license their patents. In this view,
“NPEs create patent markets, and that those markets enhance investment in start-up
companies by providing additional liquidity options. NPEs help businesses crushed by larger
competitors who infringe valid patents with impunity. (Risch 2012)”
Michael Risch (2012) looks at the original assignees of patents used in NPE lawsuits
and finds that the David vs. Goliath narrative is not representative. Few of the patents in his
sample came from venture capital financed startup firms. Although 29% of the patents in his
sample were originally filed by individual inventors, 43% were from large companies. The
median revenue of a company filing an NPE patent in his sample is $6.3 million. Given that
the median revenue of a company in the RPX database of firms sued by NPEs is $10.8
million, it appears that the typical firm sued by an NPE is roughly the same size as the
typical firm benefiting from NPE activity.
How much of the costs accrued by defendants actually flow to inventors? We can
gain some indication of this by looking at the expenditures of publicly listed NPE firms.

21
Table 5 reports cumulative figures in 2011 dollars for 12 NPE firms that were active
from 2005 – 2011.22 During this period, these firms cumulatively earned $5.8 billion in
revenues. If we assume that these revenues consisted entirely of licensing royalties from
resolved patent assertions and we assume that defendants in these cases also incurred legal
costs in the same ratio as those reported in Table 2, then these NPEs were responsible for
$10 billion in direct accrued costs to defendants from 2005 – 2011, about 10% of the totals
reported in Table 4.23
Looking at the financial statements of these NPE companies, we find that the
cumulative net increase in intangible assets—acquisitions of patents from small inventors
would be included in this accounting category along with acquisitions of other intangible
assets—amount to $679 million, or about 7% of the direct costs to defendants. Two of the
publicly listed NPE firms also perform their own R&D. That amounts to about 14% of the
direct costs to defendants. These two categories might overlap somewhat if R&D generates
intangible assets. Nevertheless, these figures indicate that for publicly listed NPE firms, no
more than a quarter of the direct spending by defendants flows to innovative activity.
Based on these figures, it seems difficult to make a convincing argument that the
effect of NPEs is to increase innovation incentives. First, previous research has shown that
the defendants in these lawsuits are largely tech companies that invest heavily in R&D
(Bessen et al. 2011, Chien 2009). This estimate suggests that their losses are much larger than
the possible flows to small inventors, especially if one adds indirect costs of NPE litigation
to the direct costs reported in Table 5. Effectively, what defendants pay in costs as a result of
22 Not all of these firms were publicly listed all years. Note that we perform a similar exercise in Bessen et al. (2011). 23 To calculate accrued costs from lawsuits already filed, we divide revenue by .75. That is, since 75% of lawsuits in the total database are unresolved (Table 1), we assume that these NPE firms have so far received only 75% of the revenue they will receive from the lawsuits already filed.

22
NPE litigation reduces their own R&D budgets. This is because companies become targets
for litigation mainly when they introduce innovative products.24 Hence R&D managers must
anticipate NPE costs as part of the cost of innovating. Small inventors would have to be an
order of magnitude more innovative per dollar of R&D than the defendant companies, in
order for the net effect of NPE activity on innovation to be positive.
Second, to the extent that small inventors are important for innovation, NPE patent
assertions hurt small inventors in at least two ways. As we have seen, the majority of
defendants in NPE lawsuits are small/medium companies and these companies accrue larger
costs relative to their size. Small/medium firms accrue 37% of the costs, but small inventors
receive at most 21% of NPE costs. Also, these costs make things more difficult for small
inventors who wish to license their technology—not just their patents—to other firms. If
the prospective licensees expect NPE-related costs, they will be less willing to license from
small inventors or they will not be willing to pay as much.
Third, the incentives provided to patent holders by the current crop of NPEs may be
the wrong kind of incentives. NPE activity may skew the research agenda of small firms
away from disruptive technologies and toward mainstream technology and associated
patents that can be asserted against big incumbents. Even worse, small firms are encouraged
to divert investment from genuine invention toward simply obtaining broad and vague
patents that might one day lead to a credible, if weak, lawsuit.
Policy implications
The rapid growth and high cost of NPE litigation documented here should set off an
alarm warning policy makers that the patent system still needs significant reform to make it a
truly effective system for promoting innovation. The heterogeneous nature of NPEs –
24 Bessen and Meurer (2012) find that the hazard of being sued increases with firm R&D.

23
ranging from universities, to patent brokers, to trolls25 – suggests that policy reform should
address troll-like behavior rather than merely status as an NPE (Geradin et al., 2008; Merges,
2011).
The top priority is reform of the patent system to improve notice; this kind of
reform will make the patent system perform more like an idealized property system (Bessen
and Meurer, 2008; FTC, 2011). More rigorous enforcement of the claim definiteness
standard would be an excellent step forward. Likewise, we favor rigorous implementation of
recent Supreme Court decisions restricting the patentability of business methods and other
abstract processes that are difficult to propertize. It is also crucial to provide greater
transparency in the patent system. Feldman and Ewing (2012) document the remarkable
opaqueness of Intellectual Ventures in connection to its patent ownership and patent
assertion. Finally, courts should rigorously supervise patent damages awards to make sure
that damages are proportionate to the value of the patented technology (Lemley and Shapiro,
2007). These reforms should not harm genuine inventors who crave publicity rather than
secrecy, and who should still be able to obtain broad, but clear patent protection.
It is also instructive to look for policy reforms suggested by the law and economics
analysis of the generic problem of frivolous lawsuits. One promising policy reform is greater
use of fee-shifting to favor defendants in cases brought by trolls. Allison et al. (2010) find
that troll patents fare poorly in court. The bargaining power of a troll seeking a nuisance
settlement would be great diminished in an aggressive fee-shifting regime. Similarly, more
25 “To some the use of the troll “moniker might be considered derogatory, [but] recently, in Highland Plastics, Inc. v. Sorensen Research and Development Trust, 11-cv-2246 (C.D.Ca. Aug. 17, 2011), the court denied a motion to strike the term “patent troll” from the complaint, stating that patent troll “is a term commonly used and understood in patent litigation and is not so pejorative as to make its use improper.” Id., Dn. 21 at 3.” Ralph Dengler, Is It Open Season Now for NPEs? IPLaw Alert, Oct. 31, 2011, available at: http://www.iplawalert.com/2011/10/articles/patent-1/is-it-open-season-now-for-npes/

24
stringent pleading requirements have been justified in other areas of the law as a method of
reducing frivolous lawsuits; this strategy might also work for patent litigation (Blaze, 1990).
Conclusion
Using these survey data and the associated database of NPE litigation our major
findings are these:
• The direct costs of NPE patent assertions are substantial, totaling about $29
billion accrued in 2011. This figure does not include indirect costs to the
defendant’s business such as diversion of resources, delays in new products,
and loss of market share. Even so, the direct costs are large relative to total
business spending on R&D, which totaled $247 billion in 2009 (NSF 2012),
implying that NPE patent assertions effectively impose a significant tax on
investment in innovation.
• Much of this burden falls on small and medium-sized companies who make
up 90% of the companies sued, accounting for 59% of the defenses, and
who pay about 37% of the direct costs. The median revenue of companies
sued by NPEs is $10.8 million. NPE litigation costs smaller companies more
relative to their revenues. In addition, smaller companies pay relatively more
to NPEs from assertions that do not go to court. The burden of all of these
costs appears to rebut the assertions that NPEs play an important role in
improving the profits of innovative start-ups.
• About a third of the cost to defendants involves patent assertions that do not
go to court. Moreover, we have likely underestimated these costs because we

25
have not surveyed small companies that do not also have NPE patent
litigation.
• NPEs appear to be highly heterogeneous. Much of the litigation appears to
consist of nuisance suits that settle for a few hundred thousand dollars. But
some NPEs are “big game hunters” who seek and get settlements in the tens
or hundreds of million dollars.
• Much of the cost to defendants implies a net loss of social welfare. About
one quarter of the cost of NPE litigation consists of legal fees. Of the total
direct cost, no more than a quarter could possibly represent a flow to fund
innovative activity.

26
References
Allison, John R., Mark A. Lemley and Joshua Walker, 2009. “Extreme Value or Trolls on Top? Evidence From the Most-Litigated Patents,” Univeristy of Pennsylvania Law Review, 158, pp. 101-37.
Allison, John R., Mark A. Lemley and Joshua Walker. 2010. “Patent Quality and Settlement Among Repeat Patent Litigants,” Georgetown Law Journal, 99, pp. 677-712
American Intellectual Property Law Association. 2011. “AIPLA Report of the Economic Survey.”
Bessen, James and Michael J. Meurer. 2008. Patent Failure: How judges, bureaucrats and lawyers put innovators at risk, Princeton, NJ: Princeton University Press.
Bessen, James, Jennifer Ford and Michael J. Meurer. 2011. “The Private and Social Costs of Patent Trolls,” Regulation, Winter 2011-2012, 26-35.
Bessen, James and Michael J. Meurer (2012), “The Private Costs of Patent Litigation,” Journal of Law, Economics & Policy, forthcoming.
Blaze, Douglas, A. 1990. “Presumed Frivolous: Application Of Stringent Pleading Requirements In Civil Rights Litigation,” William and Mary Law Review, 31, pp. 935-991.
Chien, Colleen, 2009. “Of Trolls, Davids, Goliaths, and Kings: Narratives and Evidence in the Litigation of High – Tech Patents,” North Carolina Law Review, 87, pp. 1571-1615
Federal Trade Commission, 2011. “The Evolving IP Marketplace: Aligning patent notice and remedies with competition.”
Feldman, Robin Cooper and Thomas Ewing, The Giants Among Us, Stanford Technology Law Review, Vol. 1, 2012
Fischer, Timo and Joachim Henkel. 2011. “Patent Trolls on Markets for Technology: An Empirical Analysis of Trolls’ Patent Acquisitions” working paper.
Geradin, Damien, Anne Layne-Farrar and A. Jorge Padilla, Elves or Trolls? The Role of Non-Practicing Patent Owners in the Innovation Economy, TILEC Discussion Paper No. 2008-018, May 23, 2008
Hosie, Spencer, 2008. “Patent Trolls and the New Tort Reform: A Practitioner's Perspective,” A Journal of Law & Policy for the Information Society, 4, pp. 75-87.
Kesan, Jay P. and Gwendolyn G. Ball. 2005. “How Are Patent Cases Resolved? An Empirical Examination of the Adjudication and Settlement of Patent Disputes,” U. Illinois Law & Economics Research Paper No. LE05-027.

27
Lemley, Mark A. and Carl Shapiro. 2007. “Patent Holdup and Royalty Stacking,” Texas Law Review, 85, pp. 1991-2049.
Love, Brian J., 2010. “An Empirical Study of Patent Litigation Timing: Could a Patent Term Reduction Decimate Trolls Without Harming Innovators?,” Working paper.
Magliocca, Gerard N. 2007. “Blackberries and Barnyards: Patent Trolls and the Perils of Innovation,” Notre Dame Law Review, 82(5), 1809-1838.
McDonough, James F. III, 2006. “The Myth of the Patent Troll: An Alternative View of the Function of Patent Dealers in an Idea Economy,” Emory Law Journal 56, pp189-211.
Merges, Robert P., The Trouble with Trolls: Innovation, Rent-Seeking and Patent Law Reform, November 18, 2011.
Morgan, Marc, 2008. “Stop Looking Under the Bridge for Imaginary Creatures: A Comment Examining Who Really Deserves The Title Patent Troll,” Federal Circuit Bar Journal, 17, pp. 165-80.
Myhrvold, Nathan, 2010. “The Big Idea,” Harvard Business Review, March 2010, pp. 40-50.
NSF, http://www.nsf.gov/statistics/seind12/c4/c4h.htm
Patent Freedom. 2012. “Litigations Over Time,” available at: https://www.patentfreedom.com/about-npes/litigations/.
A. Mitchell Polinsky and Steven Shavell, Costly Litigation and Optimal Damages, available at: http://ssrn.com/abstract=1990786 (2012).
Risch, Michael, 2012 forthcoming. “Patent Troll Myths,” Seton Hall Law Review, 42.
RPX. 2012. “US Litigations Involving NPEs,” available at: http://www.rpxcorp.com/index.cfm?pageid=45.
Schwartz, David L. 2012. “The Rise of Contingent Fee Representation in Patent Litigation,” Alabama Law Review, forthcoming.
Shrestha, Sannu K. 2011. “Trolls or Market-makers? An empirical analysis of nonpracticing entities,” Columbia Law Review, 110, pp. 114-60.
Tucker, Catherine, Patent Trolls and Technology Diffusion, December 24, 2011, available at: http://papers.ssrn.com/sol3/papers.cfm?abstract_id=1976593.

28
Tables and Figures
Notes: For 2005 – 2011. The left panel describes the sample used for this study. The right panel reports summary statistics from RPX’s database of all NPE lawsuits. In the sample, all companies report revenue. In the RPX database, only 74% of companies have reported revenue; we assume that companies without reported revenue are small/medium sized. The resolved lawsuits have been terminated due to settlement or adjudication. The number of resolved suits excludes those that were simple transfers, had zero litigation costs (e.g., for incorrect defendants), where the company was substantially indemnified, or where the costs born by the company do not reflect the total direct costs of litigation for other reasons. Revenues are for the most recent year. Small/medium companies are those with revenues less than or equal to $1 billion; large company revenues exceed this amount. Companies identified as “software” include companies whose main product is software, e-‐commerce, finance, or undefined. “Hardware” includes everything else.
Table 1. Summary Statistics of Sample
Sample All NPE lawsuits
Companies Lawsuit defenses
Lawsuits / company
Mean Revenue ($million) Companies
Lawsuit defenses
Lawsuits / company
Mean Revenue ($million)
Number 82 1,184 14.4 $12,474.7 9,385 20,565 2.2 $3,243.3 Resolved lawsuits 784 15,486 Percent resolved 66% 75% Company size Share Share Share Share Small/medium 44% 13% 2.7 $297.1 90% 59% 1.4 $82.6 Large 56% 88% 14.9 $22,005.0 10% 41% 9.0 $16,666.4 Company industry Software 37% 26% 6.7 $7,103.1 22% 31% 3.1 $3,654.8 Hardware 63% 74% 11.2 $15,573.7 78% 69% 1.9 $3,087.2 Public company 72% 14%
29
Table 2. Mean Litigation Costs per defense in million dollars
Direct legal costs Licensing costs Total cost Mean Median Mean Median Mean Median
All 1.38 (0.26) 0.20 6.53 (1.76) 0.22 7.91 (1.86) 0.56 Company size Small/medium 0.42 (0.12) 0.07 1.33 (0.42) 0.18 1.75 (0.49) 0.32 Large 1.52 (0.30) 0.23 7.27 (2.01) 0.23 8.79 (2.13) 0.65 Industry Software 1.50 (0.41) 0.17 1.82 (0.45) 0.30 3.32 (0.81) 0.55 Hardware 1.33 (0.33) 0.21 8.14 (2.35) 0.18 9.48 (2.48) 0.59 Addendum on legal costs AIPLA survey (2011) Cost through discovery 0.49 – 3.60 Cost through trial 0.92 – 6.00 Fee shift cases (Bessen and Meurer 2012) Summary judgments 0.84 Trial 3.64
Note: Standard errors in parentheses. The total number of cases is 666; sub-‐category shares are listed in Table 1. Fee shift data have been deflated to 2011 dollars.

30
Table 3. Costs for cases settled without litigation (per company in million dollars)
Mean cost by type
Total Cost per company,
non-‐litigated cases
Comparable Litigation Cost per
company Legal Licensing Other Mean Mean All 0.50 24.59 4.66 29.75 (13.89) 58.38 (19.18) Company size Small/medium 0.05 7.85 0.23 8.14 (7.68) 7.06 (3.15) Large 0.77 34.40 7.25 42.43 (21.22) 88.47 (28.95) Industry Software 0.38 11.83 4.14 16.35 (9.14) 38.34 (20.74) Hardware 0.56 30.76 4.91 36.24 (20.03) 68.08 (26.46) Note: Standard errors in parentheses. Results are for a sub-‐sample of 46 companies that reported full litigation and non-‐litigation costs. Figures are totals over 2005-‐11 per company, although not all companies reported all years.

31
Table 4. Aggregate Accrued Direct Costs of NPEs by Year
Number of Defenses Aggregate Direct Accrued Costs (millions) Year Small/medium Large Small/medium Large TOTAL 2005 919 482 $2,916 $3,657 $6,574 2006 899 530 $2,853 $4,021 $6,874 2007 1,238 976 $3,929 $7,406 $11,334 2008 1,571 1,004 $4,985 $7,618 $12,603 2009 1,461 1,198 $4,636 $9,090 $13,726 2010 2,588 1,857 $8,213 $14,090 $22,303 2011 3,424 2,418 $10,866 $18,347 $29,213
Size shares 59% 41% 37% 63% Note: Aggregate costs are calculated by the method described in the text. Aggregate costs include legal costs, settlement costs and other costs for resolved lawsuits, unresolved lawsuits and non-‐litigated assertions. These report accrued costs, that is, we include the full projected cost of currently unresolved lawsuits.

32
Table 5. Public NPEs: innovation investments relative to costs to defendants Millions (2011$) Revenues $5,782.9 Implied accrued direct costs $9,924.1 100% Net increase in intangibles $679.4 7% R&D spending $1,369.1 14% Note: For 12 publicly listed NPE firms. Assumes that all revenues are royalties from licensing patent assertions. The implied accrued direct costs are calculated by adding legal costs to defendants to the assumed licensing payments, using the ratio of legal to total costs in Table 2, and then dividing by the portion of lawsuits that have been resolved in the database (75%) to capture costs that have been accrued but not yet paid. All figures are in 2011 dollars.

33
Figure 1.
Source: RPX database
34
Figure 2. Cumulative Distribution of Total Direct Litigation Cost by Company Size
Note: Horizontal axis is logarithmically scaled. Distributions are fit with lognormal cumulative distribution functions. The distributions are for resolved lawsuits.

35
Appendix
Table A1. Log cost regressed against log company revenue
(1) (2) Coefficients Standard Error Coefficients Standard Error
Intercept 10.30 (0.85) 10.90 (0.91) Ln(Rev) 0.13 (0.04) 0.10 (0.04) Revenue < $100m -‐1.11 (0.63) Note: 784 observations.


![National Philosophy of Education [Npe]](https://img.pdfslide.us/doc/110x75/577cdec81a28ab9e78afd0f6/national-philosophy-of-education-npe.jpg)