Embed Size (px)
Citation preview
The Compulsory Breathalyzer .05% Legislation in VictoriaJ.H.W. Birrell1
The State of Victoria, Australia’s smallest mainland state, had in 1971 a population of 3.5 million people of whom 1.57 million had driving licences to drive some 1.358 million registered motor vehicles. In 1961 there were 773 persons killed and 16,757 injured whilst in 1971 there were 996 killed and 22,067 injured; over this period when deaths increased 28% and injuries increased 37% the number of motor vehicles registered increased more than 100%.
Over the years that I have been associated with the Victoria Police Force (since August 1957), the State has introduced a mix of countermeasures into the road traffic crash field, some perhaps being a little ahead of their time. Thus, compulsory wearing of crash helmets was first introduced in 1961, while compulsory wearing of seat belts became law in 1971. Our compulsory Breathalyzer legislation dates back to 1962.
My appointment as Police Surgeon in 1957 was primarily to take blood alcohols from suspect drunken drivers because very few doctors could be bothered, regarding the procedure as a waste of time. Further, drivers had the right at that time to be tried by judge and jury. This was a futile procedure as illustrated by the fact that in one large city one hundred drunken drivers were tried before the first one was convicted by the jury. The official figure linking alcohol and crashes was some 2 or 3%. This was not verified by my experience at the scene of serious crashes, particularly at night, where, if the driver was not frankly intoxicated, the pedestrian had serious buttock lacerations from the broken bottle in his hip pocket.
Thejaking of blood alcohols was regularized in 1958, but on a voluntary basis. The blood alcohollevel found on analysis was considered with other evidence. The uselessness of the so-called sobriety tests in diagnosing driving impairment soon became obvious because police only picked up and proceeded against those who were frankly and obviously drunk.
In 1961, as a result of Dr. Norman McCallum’s efforts, the Borkenstein Breathalyzer was quietly introduced in place of blood alcohols, again on a voluntary basis, but backed by a most competent scientific laboratory and after careful selection and training of police technicians. Experience has shown that this backing is vital to any breath test program.
In 1962, partly as a result of a political accident, the Breathalyzer test was made ‘compulsory’. Refusal to take the test was met by a small fine at first and then by
1 Victoria Police Surgeon, Victoria Police Department, Melbourne, Australia.
775
776 J.H. W. Birrell
cancellation of the driver’s licence for 3 months. Today refusal is a serious offence involving cancellation for 12 months, resulting in the present low refusal rate of about 2%.
In the early sixties the breath test result was only considered in conjunction with all the other evidence before the court. At that stage, some 2,000 arrests were being made per year, the courts virtually still demanding drunkenness as evidence of impairment of driving.
In 1963-64 however, we were fortunate in Victoria to have a Royal Commission study and report on the sale and social consequences of the consumption of liquor. This was conducted thoroughly and efficiently by the late Sir Phillip Phillips Q.C. (14). The report is now a sought after source document.
Phillips (14) made two important recommendations affecting road traffic behaviour. He recommended (a) a change in the closing time of licensed premises from 6 p.m. to 10 p.m. and (b) that a new offence be created involving driving a car with a blood alcohol level greater than .05%. Many of us thought .05% a little low from the political point of view but Sir Phillip was quite adamant that it was the correct level and that the politicians would buy it.
250
oUJ►—COUJ
15UJcrCDcozoCOa:UJQ.
u.oa:UJCD2
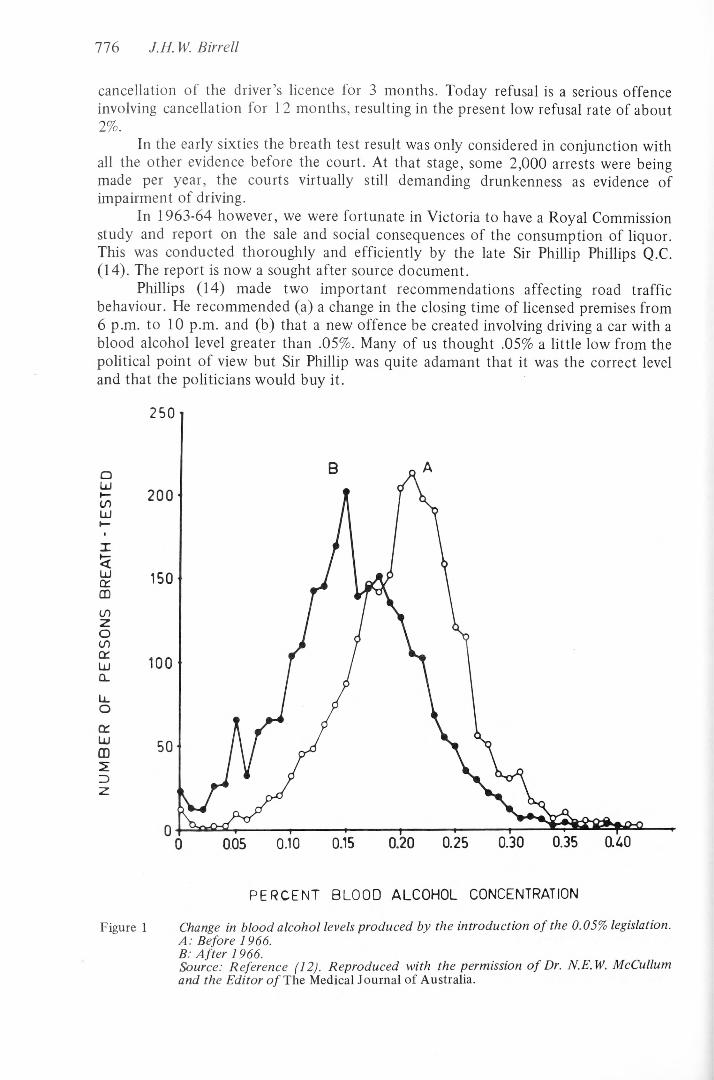
PERCENT BLOOD ALCOHOL CONCENTRATIONFigure 1 Change in blood alcohol levels produced by the introduction o f the 0.05% legislation.
A: Before 1966.B: A fter 1966.Source: Reference (12). Reproduced with the permission o f Dr. N.E. W. McCullum and the Editor o f The Medical Journal o f Australia.
Legislation in Victoria, Australia 111
The introduction of the .05% legislation has been, in fact, a master stroke. In one move it has done away with defining drunkenness, degrees of intoxication and impairment. If a level of over .05% is found in a driver within 2 hours of his apprehension then he is prima facie guilty.
To the scientific purist it was perhaps disappointing that both recommendations,i.e. , the change in licensing hours from 6 p.m. to 10 p.m. and the creation of a new offence, .05% legislation, became law simultaneously in February 1966. This negated any scientific assessment of the effect of the introduction of the .05% law. The .05% legislation received publicity but was not accorded any public educational program by the authorities.
In the event, there was a quite remarkable shift in the times of occurrence of serious traffic accidents but virtually no change in the total number of crashes and deaths. The arrest time pattern also changed, while the blood alcohol levels of those being apprehended began to include many between 0.1% and 0.2% (Figure 1). In fact, the numbers apprehended and breath tested increased from 1,218 in 1961 to 4,178 in 1967 and rose to 10,793 in 1972, which are the last figures available.
Police are continually being surprised, and educated, by the high levels found in such drivers in the presence of few signs or minor evidence of intoxication.
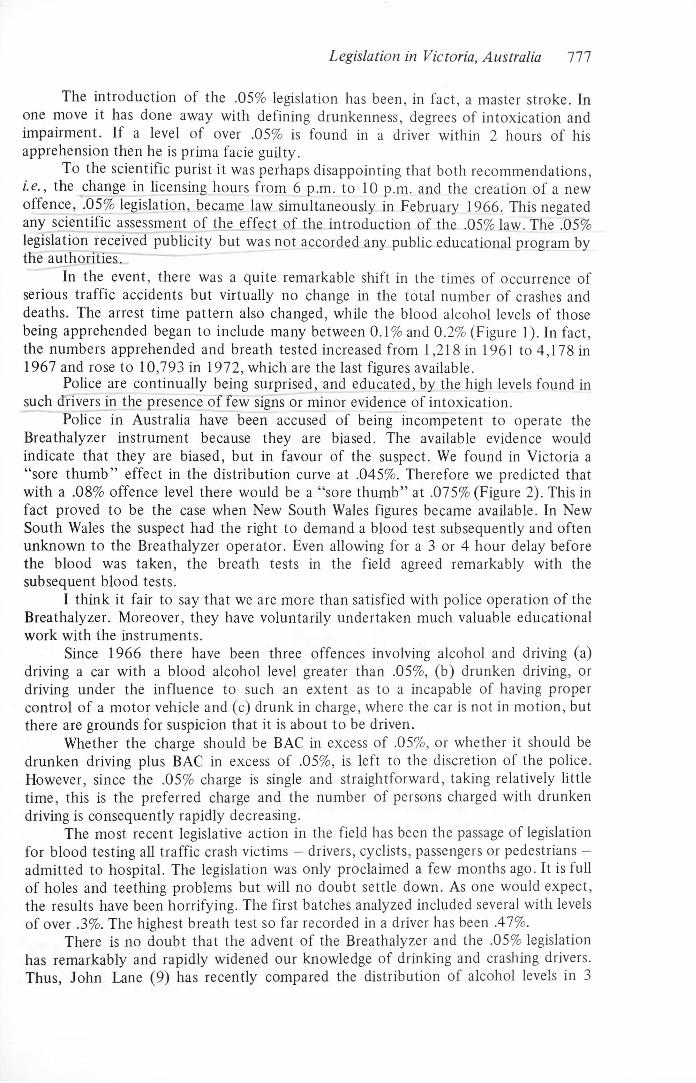
Police in Australia have been accused of being incompetent to operate the Breathalyzer instrument because they are biased. The available evidence would indicate that they are biased, but in favour of the suspect. We found in Victoria a “sore thum b” effect in the distribution curve at .045%. Therefore we predicted that with a .08% offence level there would be a “sore thumb” at .075% (Figure 2). This in fact proved to be the case when New South Wales figures became available. In New South Wales the suspect had the right to demand a blood test subsequently and often unknown to the Breathalyzer operator. Even allowing for a 3 or 4 hour delay before the blood was taken, the breath tests in the field agreed remarkably with the subsequent blood tests.
I think it fair to say that we are more than satisfied with police operation of the Breathalyzer. Moreover, they have voluntarily undertaken much valuable educational work with the instruments.
Since 1966 there have been three offences involving alcohol and driving (a) driving a car with a blood alcohol level greater than .05%, (b) drunken driving, or driving under the influence to such an extent as to a incapable of having proper control of a motor vehicle and (c) drunk in charge, where the car is not in motion, but there are grounds for suspicion that it is about to be driven.
Whether the charge should be BAC in excess of .05%, or whether it should be drunken driving plus BAC in excess of .05%, is left to the discretion of the police. However, since the .05% charge is single and straightforward, taking relatively little time, this is the preferred charge and the number of persons charged with drunken driving is consequently rapidly decreasing.
The most recent legislative action in the field has been the passage of legislation for blood testing all traffic crash victims — drivers, cyclists, passengers or pedestrians — admitted to hospital. The legislation was only proclaimed a few months ago. It is full of holes and teething problems but will no doubt settle down. As one would expect, the results have been horrifying. The first batches analyzed included several with levels of over .3%. The highest breath test so far recorded in a driver has been .47%.
There is no doubt that the advent of the Breathalyzer and the .05% legislation has remarkably and rapidly widened our knowledge of drinking and crashing drivers. Thus, John Lane (9) has recently compared the distribution of alcohol levels in 3
NO. O
F SU
BJECT
S NO
. OF
SUBJ
ECTS
778 J.H.Ml. Birr ell
0.08
500 -
400
300
200 -
100 -
BREATH ANALYSIS AFTER BEING FOUND "ALCOTEST POSITIVE"
0.10 0.15 0.20 0.25g. ALCOHOL PER 100ml BLOOD
0.30 0.35
10 -1
BLOOD ALCOHOL CONC. DETERMINED FROM BLOOD SPECIMEN
0.350.08 g. ALCOHOL PER 100 ml BLOOD
(PRESCRIBED CONCENTRATION OF ALCOHOL N.S.W.)
Figure 2 Concordance between BACs determined by blood specimens and breath analysis.Results o f breathalizers in N ew South Wales, Australia, showing a sore thumb effect a t 0.075%.Source: Reference (1 7). Reproduced with the permission o f Dr. R. Simson.
BLOOD ALCOHOL CONC. DETERMINED BY BREATH ANALYSIS
Legislation in Victoria, Australia 779
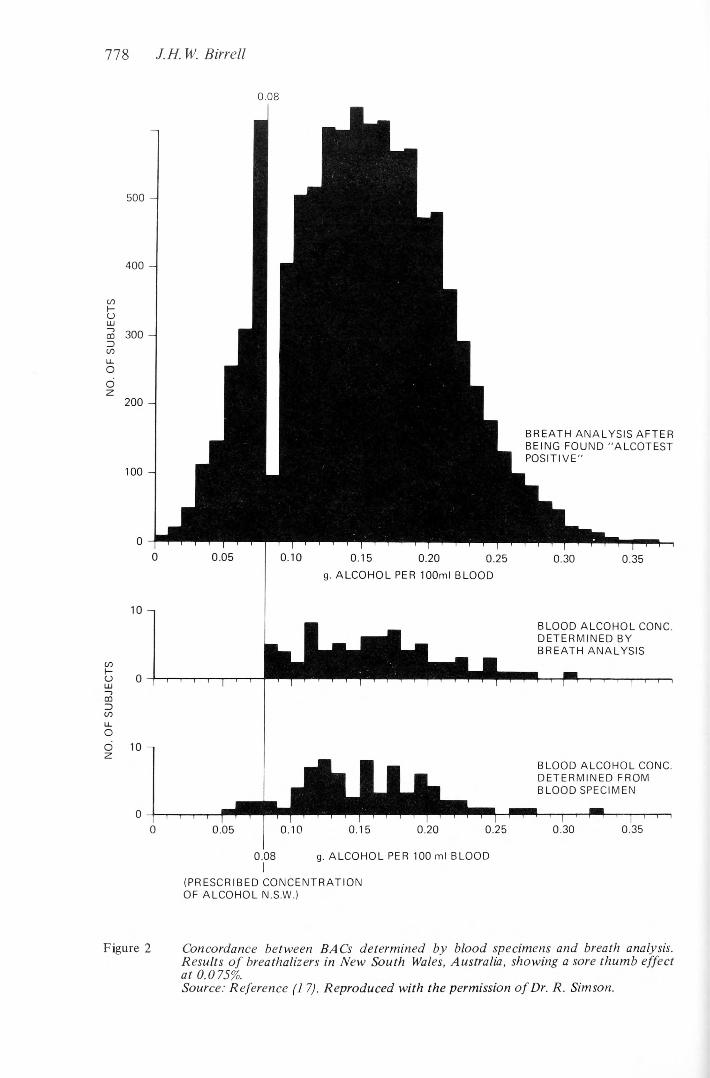
groups of drivers. First, fatally injured drivers, second, injured drivers taken to hospital and third, drivers who have been apprehended at the scene and are uninjured when breathalyzed (Figure 3). All three groups showed a similar distribution curve so that it is reasonable to assume they are different samples of the same population and it is a matter of chance into which group they fall.
B A C gm /100 ml
Figure 3 Comparison o f BACs o f fatally injured, hospitalized and breathalized drivers.Source: Reference (9). Reproduced with the permission o f Dr. J. Lane.The overall mean value of the drinking driver in hospital, mortuary, or
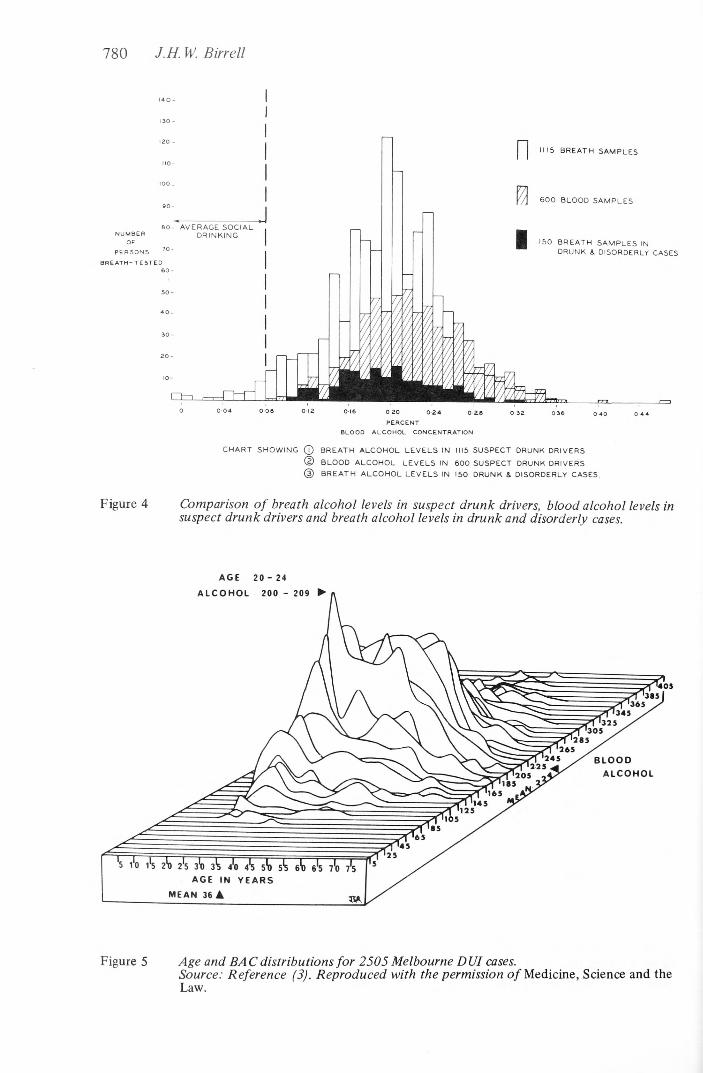
apprehended at the scene is around .15%, a percentage which requires the consumption of large, if not pathological, amounts of liquor. For example, such a BAC level may be reached by consumption of 15 ozs of spirits in one hour (3). This figure may be put into perspective by the fact that breath analysis of 250 drunk and disorderly cases within 2 hours of arrest produced an average of just under .2% (Figure4).
Anne Raymond (15) has investigated the drinking driver in greater detail, comparing a 10% sample of breathalyzed Victorian drivers with a control sample of male drivers. (It should be noted that the road crash problem and certainly the drinking driver problem is almost entirely a male problem.) She found that the breathalyzed drivers had more traffic convictions of any kind than the controls, 3 times as many traffic convictions for offences other than speeding, 10 times as many serious traffic offences, 3 times as many licence withdrawals, 10 times as many drink-driving convictions and 10 times as many convictions for unlicensed driving. Almost 40% of the breathalyzed drivers had criminal records for offences other than on the roads.
Eda Ots (13) recently followed up 300 drivers who had been convicted of drink-driving offences for some 2 ^ years. Forty per cent of the total 300 drivers had been reconvicted of either criminal or driving offences during the follow-up period and nearly half the subsequent offences were drink-driving offences. Ten per cent were
780 J.H. W. Birrell
PERSONS
BREATH-TESTED
016 0-20 0-24 0-2PERCENT
BLOOD ALCOHOL CONCENTRATION
1115 BREATH SAMPLES
6 0 0 BLOOD SAMPLES
150 BREATH SAMPLES INDRUNK & DISORDERLY CASES
CHART SHOW ING (T) BREATH ALCOHOL LE VELS IN 1115 SUSPECT DRUNK DRIVERS
© BLOOD ALCOHOL LEVELS IN 6 00 SUSPECT DRUNK DRIVERS
(D BREATH ALCO HO L LEVELS IN 150 DRUNK & DISORDERLY CASES,
Figure 4 Comparison o f breath alcohol levels in suspect drunk drivers, blood alcohol levels in suspect drunk drivers and breath alcohol levels in drunk and disorderly cases.
A G E 2 0 - 2 4
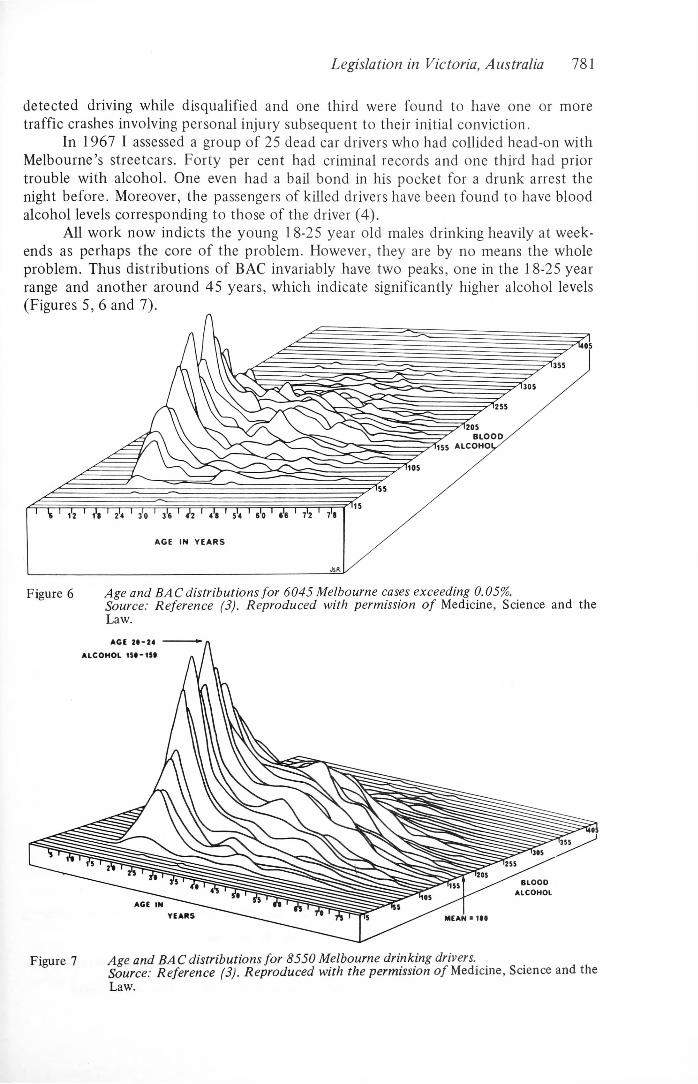
Figure 5 Age and BAC distributions fo r 2505 Melbourne DUI cases.Source: Reference (3). Reproduced with the permission o f Medicine, Science and the Law.
Legislation in Victoria, Australia 781
detected driving while disqualified and one third were found to have one or more traffic crashes involving personal injury subsequent to their initial conviction.
In 1967 I assessed a group of 25 dead car drivers who had collided head-on with Melbourne’s streetcars. Forty per cent had criminal records and one third had prior trouble with alcohol. One even had a bail bond in his pocket for a drunk arrest the night before. Moreover, the passengers of killed drivers have been found to have blood alcohol levels corresponding to those of the driver (4).
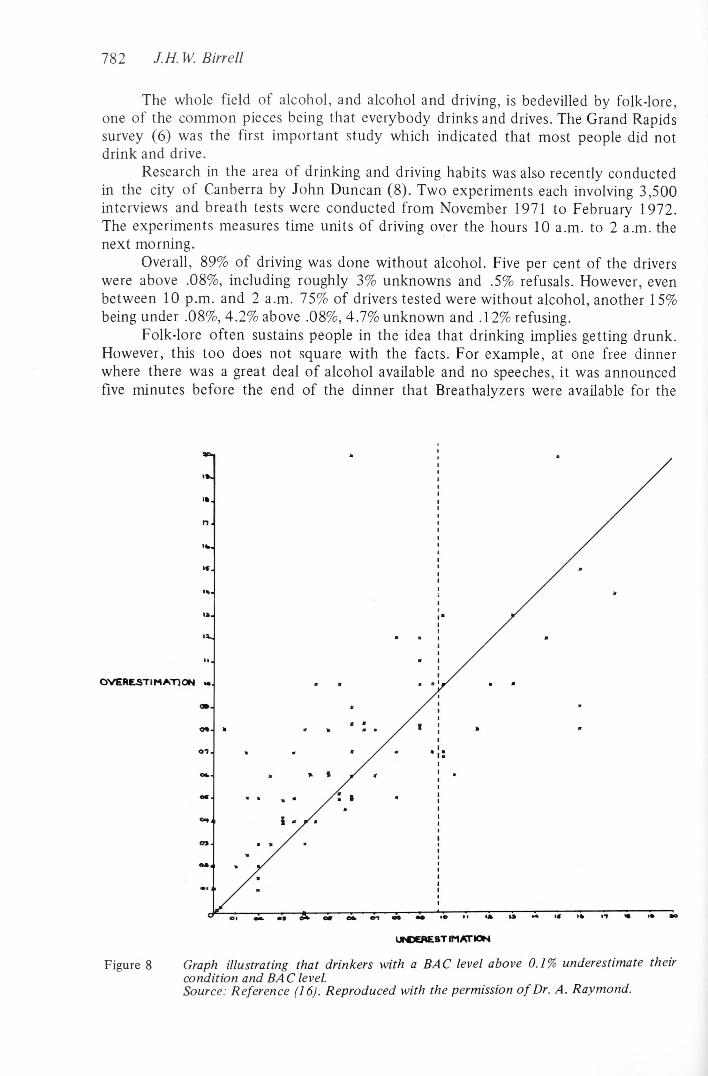
All work now indicts the young 18-25 year old males drinking heavily at weekends as perhaps the core of the problem. However, they are by no means the whole problem. Thus distributions of BAC invariably have two peaks, one in the 18-25 year range and another around 45 years, which indicate significantly higher alcohol levels (Figures 5, 6 and 7).
1 \ A l'« ' 2>4 j'o ' J» 1 4!2 ' 4*8 1 5*4 ' s'o ' 6!6 1 7*2 71
A G E IN Y E A R S
J S «
Figure 6 Age and BAC distributions fo r 6045 Melbourne cases exceeding 0.05%.Source: Reference (3). Reproduced with permission o f Medicine, Science and the Law.
Law.
782 J.H. W. Birrell
The whole field of alcohol, and alcohol and driving, is bedevilled by folk-lore, one of the common pieces being that everybody drinks and drives. The Grand Rapids survey (6) was the first important study which indicated that most people did not drink and drive.
Research in the area of drinking and driving habits was also recently conducted in the city of Canberra by John Duncan (8). Two experiments each involving 3,500 interviews and breath tests were conducted from November 1971 to February 1972. The experiments measures time units of driving over the hours 10 a.m. to 2 a.m. the next morning.
Overall, 89% of driving was done without alcohol. Five per cent of the drivers were above .08%, including roughly 3% unknowns and .5% refusals. However, even between 10 p.m. and 2 a.m. 75% of drivers tested were without alcohol, another 15% being under .08%, 4.2% above .08%, 4.7% unknown and .12% refusing.
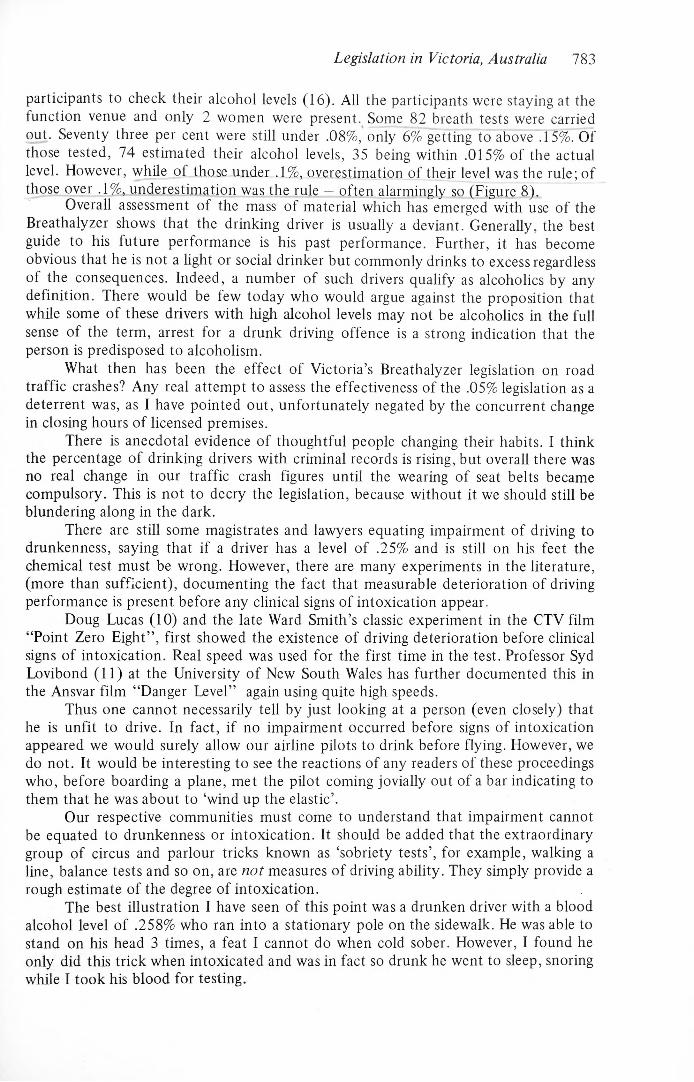
Folk-lore often sustains people in the idea that drinking implies getting drunk. However, this too does not square with the facts. For example, at one free dinner where there was a great deal o f alcohol available and no speeches, it was announced five minutes before the end of the dinner that Breathalyzers were available for the
UiGGAEST IM ATION
Figure 8 Graph illustrating that drinkers with a BAC level above 0.1% underestimate their condition and BAC level.Source: Reference (16). Reproduced with the permission o f Dr. A. Raymond.
Legislation in Victoria, Australia 783
participants to check their alcohol levels (16). All the participants were staying at the function venue and only 2 women were present^ Some_82 breath tests were carried out. Seventy three per cent were still under .08%,' only 6% getting to above .15%, Of those tested, 74 estimated their alcohol levels, 35 being within .015% of the actual level. However, while of those under. .1%., overestimation of their level was the rule; of those o y er. 1 %». underestimation was the rule — often alarmingly so (Figure 8).
Overall assessment of the mass of material which has emerged with use of the Breathalyzer shows that the drinking driver is usually a deviant. Generally, the best guide to his future performance is his past performance. Further, it has become obvious that he is not a light or social drinker but commonly drinks to excess regardless of the consequences. Indeed, a number of such drivers qualify as alcoholics by any definition. There would be few today who would argue against the proposition that while some of these drivers with high alcohol levels may not be alcoholics in the full sense of the term, arrest for a drunk driving offence is a strong indication that the person is predisposed to alcoholism.
What then has been the effect of Victoria’s Breathalyzer legislation on road traffic crashes? Any real attempt to assess the effectiveness of the .05% legislation as a deterrent was, as I have pointed out, unfortunately negated by the concurrent change in closing hours of licensed premises.
There is anecdotal evidence of thoughtful people changing their habits. I think the percentage of drinking drivers with criminal records is rising, but overall there was no real change in our traffic crash figures until the wearing of seat belts became compulsory. This is not to decry the legislation, because without it we should still be blundering along in the dark.
There are still some magistrates and lawyers equating impairment of driving to drunkenness, saying that if a driver has a level of .25% and is still on his feet the chemical test must be wrong. However, there are many experiments in the literature, (more than sufficient), documenting the fact that measurable deterioration of driving performance is present before any clinical signs of intoxication appear.
Doug Lucas (10) and the late Ward Smith’s classic experiment in the CTV film “Point Zero Eight” , first showed the existence of driving deterioration before clinical signs of intoxication. Real speed was used for the first time in the test. Professor Syd Lovibond (11) at the University of New South Wales has further documented this in the Ansvar film “Danger Level” again using quite high speeds.
Thus one cannot necessarily tell by just looking at a person (even closely) that he is unfit to drive. In fact, if no impairment occurred before signs of intoxication appeared we would surely allow our airline pilots to drink before flying. However, we do not. It would be interesting to see the reactions of any readers of these proceedings who, before boarding a plane, met the pilot coming jovially out of a bar indicating to them that he was about to ‘wind up the elastic’.
Our respective communities must come to understand that impairment cannot be equated to drunkenness or intoxication. It should be added that the extraordinary group of circus and parlour tricks known as ‘sobriety tests’, for example, walking a line, balance tests and so on, are not measures of driving ability. They simply provide a rough estimate of the degree of intoxication.
The best illustration I have seen of this point was a drunken driver with a blood alcohol level of .258% who ran into a stationary pole on the sidewalk. He was able to stand on his head 3 times, a feat I cannot do when cold sober. However, I found he only did this trick when intoxicated and was in fact so drunk he went to sleep, snoring while I took his blood for testing.
784 J.H W. Birrell
At the 4th International Conference on Alcohol, Drugs and Traffic Safety (7), nearly ten years ago, a working party on the role of the clinical examination of the drinking driver concluded with the statement that “it was unanimously agreed that clinical examination is of no practical value in detecting impairment of the ability to drive properly” (p. 324).
Other developments in fields relevant to drinking and driving have complicated the issues, for example, the high powered car, speed, advertising for petrol and tires, the image of drinking being “with it” aimed at youth, and the development of the outer suburban beer farm with acres of car park. Nevertheless, the Breathalyzer legislation together with some sociological research has thrown some targets into relief.
Thus, we in the traffic field are very similar to the chest and tuberculosis physicians who are having to learn about alcohol and alcoholism because the alcoholic in the Victorian community is becoming virtually the reservoir of T.B. We in the traffic field, who started off with drinking and driving, are now also in the middle of the alcoholism field. That is, many aspects of alcoholism have to be considered if we are to make any headway with the drinking-driving problem.
The probability that an arrested drinking driver has an alcohol problem tends to make it nonsensical to cancel his licence only to return it to him in 3 or even 2 months time, without any attempt at dealing with the original problem behaviour. Many of our magistrates are adjourning the case, allowing the driver to continue driving. To me this is like attending to a badly injured alcoholic pedestrian, fixing up his injuries over months, and sending him on his way with no attempt to diagnose and treat the alcohol problem that produced the fractures in the first place. One must not only take drinking drivers off the road but also deal with the early development of the dangerous drinking habits indicated by a high alcohol level, particularly in the 18-24 year old male.
From my experience in the field I feel that dealing with drinking habits will be a waste of time in about 40% of cases. However, I also feel that results with the remaining percentage will be very good.
What we specialists in the field know, discuss, and indeed live with in our day to day work, is a closed book to so many of the community. Perhaps the key word is ignorance — ignorance not only of the extent of the problem but often also ignorance of the fact that there is a problem. This indeed seems to be the theme that the young drinking driver comes up with if put into a therapeutic learning situation about alcohol, “we didn’t know, nobody told us” .
There is a big job ahead of us all in Victoria, and I suspect elsewhere in the motorized world, to end this ignorance once and for all. Once the public is educated there will be dividends in many fields other than those o f alcohol and the motor car.
REFERENCES1. Birrell, J.H.W., Blood Alcohol Levels in Drunk Drivers, Drunk and Disorderly Subjects and
Moderate Social Drinkers, Medical Journal o f Australia 2, 949 (1965).2. Birrell, J.H.W., A Note on Automobile — Tram (street car) Fatal Accidents and Alcohol in
City o f Melbourne, Medical Journal o f Australia 2, 1 (1967).3. Birrell, J.H.W., A Preliminary Note on the Drinking Driver in Victoria, Australia since 1966.
Medicine Science and the Law, January 1970, p. 38.4. Birrell, J.H.W., A Comparison o f the Post-Mortem Blood Alcohol Levels of Drivers andPassengers Compared with those o f Drinking Drivers who Kill Pedestrians. Medical Journal
o f Australia 2, 945 (1971).
Legislation in Victoria, Australia 7855. Birrell, J.H.W., Drinking Driving and You, Sun Books, Melbourne, 1974.6. Borkenstein, R. F., Crowther, R. F., Shumate, R. P., Ziel, W. B., and Zylman, R .,The Role
of the Drinking Driver in Traffic Accidents, Report of the Department of Police Administration, Indiana University, Bloomington, Indiana, 1964.7. Department o f Police Administration, Bloomington, Indiana, Alcohol and Traffic Safety: Proceedings o f the 4th International Conference, Indiana University, Bloomington, Indiana, 1966.8. Duncan, J., unpublished data, Canberra, 1974.9. Lane, J. C., Alcohol — The Search for a Counter Measure, unpublished paper, 1973.
10. Lucas, D. and Smith, W., Point Zero Eight, A CTV film, Toronto, 1966.11. Lovibond, S. H., Danger Level. The Warwick Farm Project on Alcoholism and Drug Dependence, Ansvar Insurance Company, Australia, 1971.12. McCallum, N.E.W., Chemical Testing for Alcohol and Road Accidents, Medical Journal o f Australia 1, 1025 (1971).13. Ots, E. Y., Drunken Drivers. A Follow-up Study o f 300 Drivers Convicted o f Drunk Driving Offences, unpublished paper, 1973.14. Phillips, Sir. P., R eport o f R oyal Commission into the Sale, Supply, Disposal and Consumption o f Liquor in the State o f Victoria. Victorian Government Printer, 1965.15. Raymond, A., A Comparison of Breathalyzed Drivers with the General Driving Population, Australian Road Research 4, 45 (1972).16. Raymond, A., Unpublished data, 1972.17. Simson, R., Unpublished data, 1972.