Embed Size (px)
Citation preview

1
THE CASE DATA BASE Version 1.1.0.0
For Windows 7 and Windows 10
for
Geotechnical Laboratory Testing
by
Adel S. Saada and Gary F. Bianchini
September 2018
The Case School of Engineering Case Western Reserve University
Cleveland, Ohio 44106

2
THE CASE DATA BASE PROGRAM
For
GEOTECHNICAL LABORATORY TESTING
A Project Sponsored and Supported by:
The National Science Foundation Geomechanical, Geotechnical and Geo_Environmental Systems
Dr.Mehmet T. Tumay, Program Director
The Frank H. Neff endowed chair in the Civil Engineering Department Case Western Reserve University
The Case Alumni Association, Administrator
Co-Principal Investigators: Dr. Adel S. Sadda, Frank H. Neff Professor Dr. Gary F. Bianchini, Research Engineer
Software Development by: DR. GARY F. BIANCHINI
SEPTEMBER 2018

3
DISCLAIMER
Although both Drs. Bianchini and Saada and some of their colleagues and students have tested the code, it is possible that it may not function properly in environments under which it has not been tested. The programs are provided "as is" and the authors disclaim any and all responsibility for damages resulting from their use or misuse. Sole responsibility for determining the suitability of the code rests with the users.
4
ACKNOWLEDGEMENTS
The co-principal investigators wish to thank two of their graduate students for their help during the development of this data base. Mr. Liqun Liang entered much of the needed data in the appropriate files. Mr. Adolfo Acosta designed the original opening logo and tested the programs for possible inconsistencies and weaknesses, and Mr. Mingjiang Tao helped in placing the data base on the website of the Department of Civil Engineering. For the new Windows 7 and 10 version, the authors were assisted by graduate student Xudong Zhao.
This project was sponsored and supported by the National Science Foundation. Substantial funding was also contributed by the Frank H. Neff Chair administered by the Case Alumni Association. The Co-Principal Investigators gratefully acknowledge the support extended to them by those two organizations.
Any opinions, findings, and conclusions or recommendations expressed in this material are those of the author(s) and do not necessarily reflect the views of the National Science Foundation.
5
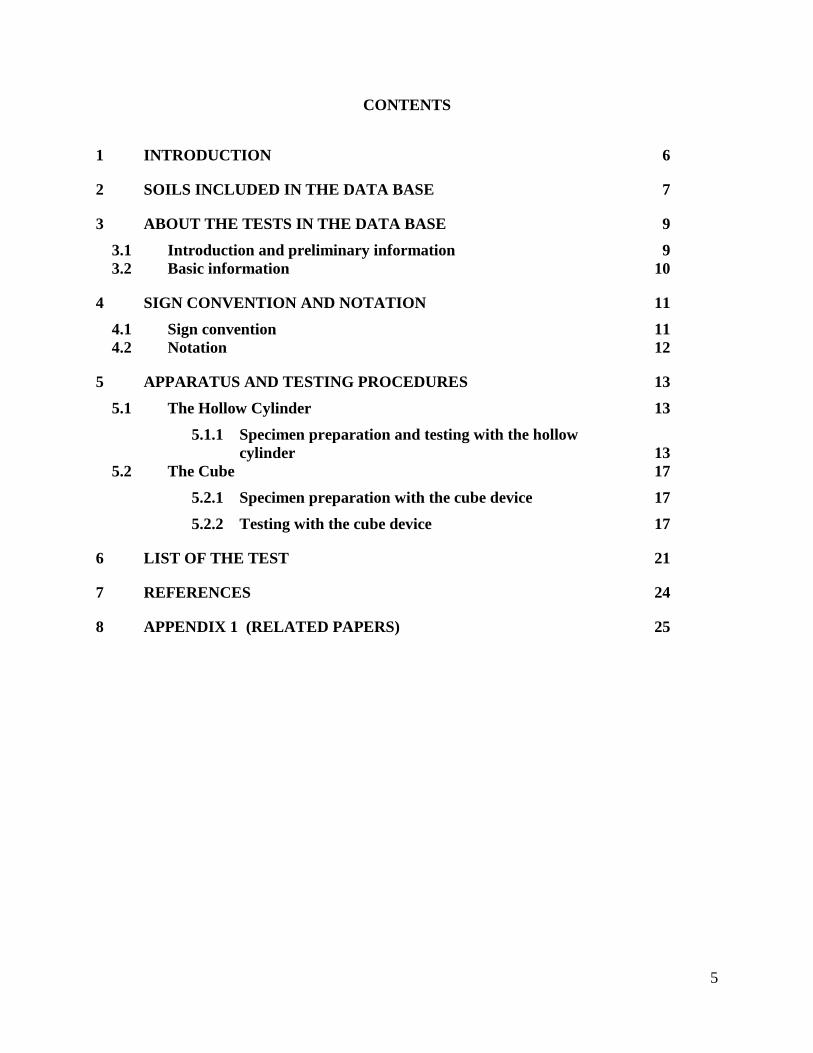
CONTENTS
1 INTRODUCTION 6
2 SOILS INCLUDED IN THE DATA BASE 7
3 ABOUT THE TESTS IN THE DATA BASE 9
3.1 Introduction and preliminary information 9 3.2 Basic information 10
4 SIGN CONVENTION AND NOTATION 11
4.1 Sign convention 11 4.2 Notation 12
5 APPARATUS AND TESTING PROCEDURES 13
5.1 The Hollow Cylinder 13
5.1.1 Specimen preparation and testing with the hollow cylinder 13
5.2 The Cube 17
5.2.1 Specimen preparation with the cube device 17
5.2.2 Testing with the cube device 17
6 LIST OF THE TEST 21
7 REFERENCES 24
8 APPENDIX 1 (RELATED PAPERS) 25

6
1 INTRODUCTION The idea of creating a Data Base for the validation of Dynamic and Static Constitutive
Relations for soils has been haunting the engineering and scientific communities for years. A succession of conferences and workshops held in the U.S. and Europe have emphasized the importance of having a trustworthy set of data to be used by civil engineers and researchers all over the world.
Over the years, research conducted at Case Western Reserve University on the mechanical behavior of soils under Dynamic and Static loading has resulted in a wealth of data. In the eighties a joint research program on constitutive equations supported by the National Science Foundation was started in cooperation with the University of Grenoble, France. The research resulted in substantial advances in the art of modeling, the techniques of testing and the intricacies of data acquisition and processing. It all led to the present data base which researchers can use to validate their constitutive relations. It contains over 234 tests conducted on three different sands with a wide variety of stress paths. More than half of the tests are on hollow cylinders, the rest on cubical samples. In addition the data base contains the results of 18 tests on Edga Plastic Kaolin clay and the results of 8 tests on Hydrite121 clay; both series conducted on thin hollow cylinders.
The hollow cylinder tests are all conducted with the same pressure inside and outside the cylinder. Axial and torsional stresses are applied such that the result is a radial path with different values of b = σ2-σ3/σ1-σ3 where σ1, σ2 and σ3 are the principal stresses. The same radial stress paths (i.e. the same b) were duplicated in the cube tests; in addition to others, such as circular path tests, that can only be conducted in the cube device.
The references and the four papers cited in Appendix 1 give complete information on the tests conducted as well as details on the sizes of the specimen and the testing equipment. Such information can also be found in the data base for each test. The references will help answer most of the questions about hollow cylinder and cube testing.
The data base package comprising the operating code, the test data and the user’s manual was completed in September of 2001, made available to all the participants of “The Workshop on Constitutive Euqations for Granular Non-Cohesice Soils”, and could be downloaded from the website of the Department of Civil Engineering of Case Western Reserve University. The governing software was based on the DOS operating system and tailored for PC users.
Advances in computer technology and software have necessitated the rewriting of programs and of the user’s manual.
7
2 SOILS INCLUDED IN THE DATA BASE The tests whose results are included in the data base were conducted on both clay and sand
materials. Two types of clays are involved, namely, Edgar Plastic Kaolin (EPK) and McGill clay(Hydrite121) which is also a Kaolinitic type of clay. Three types of sand are involved, namely, Reid Bedford sand, Hostun sand and LSI30 sand. The hollow cylinder configuration was used with both sands and clays. The cube configuration was used with sands alone. All the hollow cylinder data was generated at Case Western Reserve; all the cube data was generated at the University of Grenoble.
SI units are used all the way through: centimeter, Newton, kilopascal, Newton meter, degree (angle) and second (time) are the basic units for the raw data. The processed data which is primarily made of stresses, strains and energies uses similar units. Compression is positive.
The notation is as close as possible to the conventional one, while avoiding Greek letters. The letters used in the tables of raw as well as processed data will be defined within the User's Manual which forms a part of this report.
It is appropriate at this stage to give a brief description of the soils used in the data base. However, more complete details are given when one brings up to the screen a particular test.
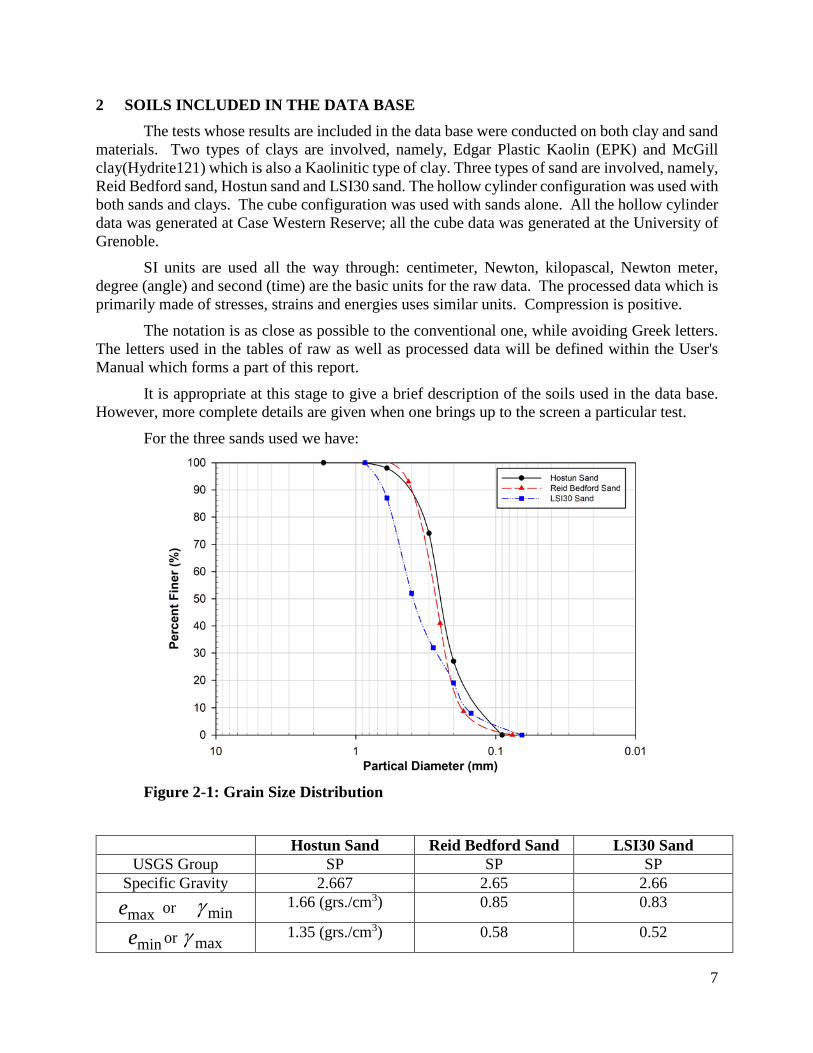
For the three sands used we have:
Figure 2-1: Grain Size Distribution
Hostun Sand Reid Bedford Sand LSI30 Sand
USGS Group SP SP SP Specific Gravity 2.667 2.65 2.66
maxe or minγ 1.66 (grs./cm3) 0.85 0.83
mine or maxγ 1.35 (grs./cm3) 0.58 0.52
8
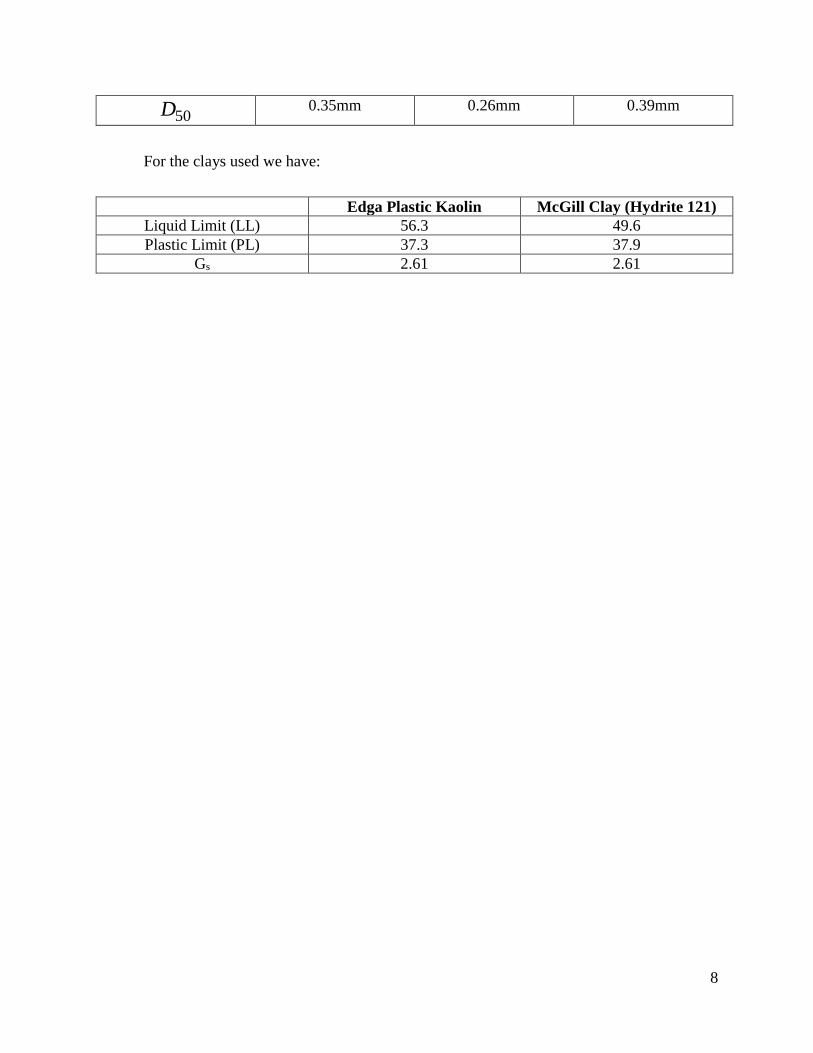
50D 0.35mm 0.26mm 0.39mm
For the clays used we have:
Edga Plastic Kaolin McGill Clay (Hydrite 121)
Liquid Limit (LL) 56.3 49.6 Plastic Limit (PL) 37.3 37.9
Gs 2.61 2.61

9
3 ABOUT THE TESTS IN THE DATA BASE
3.1 Introduction and preliminary information This data base has at present 260 tests conducted at Case Western Reserve University and
the University of Grenoble. Those tests were conducted on hollow cylinders and cubes; using both sands and clays. The information in this chapter will help the reader familiarize himself rapidly with the content of this data base so that it can be put to use without undue effort. Figure 3-1 is just a reminder. The notation is familiar to all workers in soil mechanics.
3
2
X
Y
Z
0
0
Figure 3-1
10
3.2 Basic information All the tests conducted on sands were:
1. Normally consolidated hydrostatically, with no rebound (OCR=1.0); 2. Drained; 3. Slowly loaded; 4. Described as anisotropic because of the deposition process during the specimen's
preparation All the tests conducted on clays (EPK and McGill) were:
1. On hollow cylinders; 2. One dimensionally consolidated (This was followed by a release of the axial load
and a period of equilibrium at the cell pressure. The result is a mean overconsolidation ratio of 1.3 making the specimen "nearly" normally consolidated but anisotropic);
3. Undrained with pore pressure measurements; 4. Slowly loaded; 5. Described as anisotropic because of the preparation and consolidation process.
All the tests in the cubical device were conducted on dry sands. All the tests in the hollow cylinder device were conducted on saturated sands and clays.
This, allowed for the measurement of the volume change when testing sands and the measurement of the developed pore water pressure where testing clay. To ensure saturation, back pressure was used with all the tests in the hollow cylinder device.
An important feature of this work is that the results are stored in a raw format and not in a processed one. Whenever a user wishes to examine or plot the results of a test, the variables that are needed are instantaneously calculated and displayed.

11
4 SIGN CONVENTION AND NOTATION Throughout, the notations of soil mechanics and engineering mechanics are used to
describe many of the variables; so are the traditional letters of the Greek alphabet. When they are not, as is often the case when dealing with graphs coordinates, the names are fully spelled. The international system of units is used with the American equivalent often appearing in between brackets.
4.1 Sign convention Stress kPa (Kilopascal) Length and Deformation cm & mm (centimeter and millimeter) Strain In Decimals (Not Percent) In all tests and predictions, compression is positive and extension (as well as expansion) is
negative. The following sketches illustrate the convention:
Figure 4-1 Sign convention
(+ve) Direction of Axis
(+ve) Normal & Shear Stresses
(+ve) Direction of Axis
Deformed Shape
(+ve) Direction of Axis
(+ve) Normal Strain & Volume Change
(+ve) Shear Strain

12
4.2 Notation σ1 = major principal stress σ2 = intermediate principal stress σ3 = minor principal stress q = (σ1 - σ2)/2 p = (σ1 + σ2)/2 σr = radial stress in the hollow cylinder σθ = circumferential stress in the hollow cylinder σθz = applied shear stress in the hollow cylinder σc = confining cell pressure in hollow cylinder σz = axial stress in the hollow cylinder. Vertical stress in the cube configuration σy = lateral stress in the cube configuration σx = lateral stress in the cube configuration σm = mean effective stress τoct = octahedral shear stress τθz = shear stress in the hollow cylinder SD2 = function of second invariant of the stress tensor ε1 = major principal strain ε2 = intermediate principal strain ε3 = minor principal strain γθz = Shear strain in the hollow cylinder γoct = octahedral shear strain εv = volumetric strain εr = radial strain in the hollow cylinder = ε2 εθ = circumferential strain in the hollow cylinder = ε3 εz = vertical strain εx = lateral strain in the cube εy = lateral strain in the cube ϕσ = stress phase angle in the π·plane ϕε = strain phase angle in the π plane ID2 = function of the second invariant of the strain tensor b = (σ2 - σ3) / (σ1 - σ3) = sin2β β = inclination of the principal stresses
13
5 APPARATUS AND TESTING PROCEDURES
5.1 The Hollow Cylinder The hollow cylinder apparatus used at CASE is a triaxial cell apparatus that can apply axial,
torsional, internal and external pressures on thin hollow cylindrical specimens. The device allows the control of internal and external poressures independently; also the axial and torsional stresses can be varied at will. For all the test conducted for this data base, the inner and outer pressures were equal. The stress paths were controlled so as to induce a condition of proportional loading between the axial and the torsional stress; thus keeping the inclination of the principal stress constant with respect to the axis of symmetry of the specmen (See Figure 5-2, Figure 5-3, and Figure 5-1).
The parameter b which locates the position of the intermediate principal stress is given by:
𝑏𝑏 =(σ2 − σ3)(σ1 − σ3)
= sin2 𝛽𝛽
Where β is this inclination. Ref: A. Saada and P. Puccini 1989 “ The development of a data base using the Case Hollow
Cylinder Apparatus”, Constitutive Equations for Granular Non-Cohesive Soils, A.A. Balkema, 1988.
5.1.1 Specimen preparation and testing with the hollow cylinder Special moulds hold the inner and outer membranes (thickness 0.28 mm) in place while
the sand is dry-pluviated in successive layers. Vibration or tamping are applied after each layer has been placed, to reach a desired density. Hostun sand samples were always tamped. Reid Bedford sand samples were always vibrated.
With a small vacuum applied, the moulds were removed, the sample placed dry in the cell and subjected to a small hydrostatic pressure. It was then saturated using the CO technique and left to reach equilibrium overnight under its final cell pressure and backpressure.
The membranes have an average thickness of 0.28 mm and a Young’s modulus of about 1800 kpa.
The preparation of the clay soils, namely Edgar Plastic Kaolin (EPK) and McGill Clay (Hydrite 121) was more complex: Slurries of clay were mixed under vacuum and one dimensionally consolidated in a large consolidometer. From the resulting large blocks, 7.1 cm (2.8 in) cylinders were wire cut. A core of 5.18 cm (2.0 in) was removed from the center of each cylinder as illustrated in published references. With the membranes on, the hollow cylinders were one dimensionally consolidated in a large triaxial cell, then tested under axial, torsional stresses. Both sand and clay specimens had nominal sizes of 7.1 cm (2.8 in.) O.D., 5.08 cm (2.0 in) I.D. and a length of 12.7 cm (5 in.).
In all the tests the same pressure acts on the inner and outer surfaces of the hollow cylinder. This means that the cell pressure is always equal to the inner pressure Pi and to the outer pressure P0. (See Figure 5-1, Figure 5-2, and Figure 5-3)
If a test starts from a spherical state of stress, one has at the beginning

14
σ𝑐𝑐 = p𝑖𝑖 = p0 = σ𝑟𝑟 = σ𝜃𝜃 = σ𝑧𝑧 During the test, σr is always the intermediate principal stress. σr is always equal to σθ and
both are equal to the pressure in the cell. If there is backpressure, which is the case in all our tests, this backpressure must be subtracted from all the normal stresses to give the effective values. For example, the effective cell pressure σ′c is the applied cell pressure σc minus the backpressure; the same applies to σr, σθ and σz. The backpressure never changes during a test. All the tests start from a fixed cell pressure; i.e. a fixed spherical state of stress.
Starting from a spherical state of stress, the axial and torsional stresses can be increased or decreased keeping a constant ratio. In such a case the inclination of the major principal stress β remains constant and is given by the formula:
tan2𝛽𝛽 =2𝜏𝜏𝜃𝜃𝑧𝑧
𝛥𝛥𝛥𝛥𝑧𝑧 − 𝛥𝛥𝛥𝛥𝜃𝜃
and
b = sin2 𝛽𝛽
Notice that if the cell pressure remains constant, 𝛥𝛥𝛥𝛥𝜃𝜃 = 0 and
tan2𝛽𝛽 =2𝜏𝜏𝜃𝜃𝑧𝑧𝛥𝛥𝛥𝛥𝑧𝑧
Δσz, under those circumstances is the additional axial stress produced by the piston, beyond the value due to the cell pressure.
If Δσz and the cell pressure are changed such that the sum of the 3 normal stresses σr, σθ, σz remains constant and equal to three times the initial value of the spherical stress (i.e. the initial cell pressure), the test is called a generalized test. In this case the stress path remains on the octahedral or Π plane.
If the cell pressure remains constant and only the axial and torsional stresses are changed, the test is referred to as a direct test.
The shearing stress τθz is given by
𝜏𝜏𝜃𝜃𝑧𝑧 =3𝑀𝑀𝑡𝑡
2𝜋𝜋(𝑅𝑅03 − 𝑅𝑅𝑖𝑖3)
Where Ri and R0 are the inner and outer radii. The axial strains εz and shearing strains γθz are incremental or logarithmic. The volumetric strain is:
𝜀𝜀 = 𝜀𝜀𝑟𝑟 + 𝜀𝜀𝜃𝜃 + 𝜀𝜀𝑧𝑧 = 𝜀𝜀1 + 𝜀𝜀2 + 𝜀𝜀3 The shearing strain is computed from
𝛾𝛾𝜃𝜃𝑧𝑧 = 2𝜀𝜀𝜃𝜃𝑧𝑧 =𝑅𝑅𝑚𝑚𝜃𝜃𝐿𝐿
Where θ is the angle of rotation, L the instantaneous length and Rm is the mean radius given by

15
𝑅𝑅𝑚𝑚 =2(𝑅𝑅03 − 𝑅𝑅𝑖𝑖3)3(𝑅𝑅02 − 𝑅𝑅𝑖𝑖2)
The principal stresses and strains are computed by the usual formulas. The parameter b is given by (σ2- σ3)/(σ1 - σ3) = sin2β.
- In a compression test the vertical stress is increased and the lateral stresses (effective cell pressure) are kept consant.
- In an extension test the vertical stress is decreased and the lateral stresses are kept constant.
- In a hydrostatic compressive test the effective cel1 pressure σ`c is increased then decreased and the volume change measured.
It is to be noticed that extension tests fail through a necking instability and that the shear strength at failure is not a re1iab1e quantity.
The known equations for membrane corrections were applied and indicated a negligible effect of the membrane. Therefore no membrane effects were introduced in the data.

16
Figure 5-3
Figure 5-1
Figure 5-2
𝑏𝑏 = (σ2−σ3)(σ1−σ3)
= sin2 𝛽𝛽
17
5.2 The Cube The Grenoble True Triaxial Apparatus (TTA) is an apparatus with rigid boundaries. The
measurements consist of 3 principal stresses and 3 principal strains. The kinetic controls are performed by 6 electrics motors synchronized 2 by 2. The dimension of testing box can vary from 5 cm to 15 cm with maximum speed of 5 mm/min. The applied stresses can go up to 10 MPa. During a test the box is completely closed through the use of hydraulic jacks. There are no gaps between the loading plates.
The strains are calculated from the displacements which are measured by 3 LVDT’s with an accuracy better than 0.05 mm. The stresses are directly measured by 3 pressure cells embedded in the pates and insensitive to tangential stress.
Ref: J. Lanier & Z. Zitouni, Development of a data base sing the Grenoble true triaxial apparatus’, Constitutive Equations for Granular Non-Cohesive Soils.
5.2.1 Specimen preparation with the cube device A plastic mould holds the membrane to the nominal dimensions of the sample. The sand is
first pluviated in layers, then either vibrated vertically or tamped to reach its desired density. Hostun sand samples were always tamped. Reid Bedford sand samples were always vibrated.
With a small vacuum applied, the mould was removed and the sample placed in the middle of six compressive plates properly greased to minimize friction. The membrane was punctured to allow for drainage and the initial hydrostatic pressure was applied to the sample. The membrane has an average thickness of 0.3mm. All the cube tests were conducted on dry specimens. (See Figure 5-4, Figure 5-5, Figure 5-6 and Figure 5-7)
5.2.2 Testing with the cube device The specimen is deformed between 6 rigid platens. The nominal size of the cube is 10 cm
x 10 cm x 10 cm. The dimensions of the sides can change from 5 cm to 15 cm. The 3 nominal stresses are measured with 3 pressure cells embedded in the plattens. The 3 normal deformations are measured with 3 LVDT's. Feedback allows one to control stresses or strains in a totally automated way.
Referring to the figures at the end of this section the following notations and definitions will be used:
1. For the Stresses (see Figure 5-6) In the cube OZ is always the vertical direction. The three directions OX, OY and OZ are
associated with 01, 02 and 03. This means that σ1 = σx, σ2 = σy and σ3 = σz; and σ1 is not necessarily the major principal stress.
- The components of the stress tensor are
𝛥𝛥𝑖𝑖(𝛥𝛥1,𝛥𝛥2,𝛥𝛥3) 𝑜𝑜𝑜𝑜 (𝛥𝛥𝑥𝑥,𝛥𝛥𝑦𝑦,𝛥𝛥𝑧𝑧)
- The mean pressure is σm with
3𝛥𝛥𝑚𝑚 = 𝑆𝑆1 = 𝛥𝛥1 + 𝛥𝛥2 + 𝛥𝛥3 = 3𝑃𝑃

18
- In the Octahedral or Π plane the intensity of the deviator ρσ= OM= SD2, is given by (Figure 5-6).
SD2 = OM = 𝜌𝜌𝜎𝜎 = �13
[(𝛥𝛥1 − 𝛥𝛥2)2 + (𝛥𝛥2 − 𝛥𝛥3)2 + (𝛥𝛥3 − 𝛥𝛥1)2]
ϕσ = phase angle for stress - In a compression test σz is the major principal stress and σx = σy are the intermediate and
minor principal stresses. - With the previous notation
𝛥𝛥1 =𝑆𝑆13
+ �23𝑆𝑆𝑆𝑆2 cos𝜙𝜙𝜎𝜎
𝛥𝛥2 =𝑆𝑆13
+ �23𝑆𝑆𝑆𝑆2 cos(𝜙𝜙𝜎𝜎 − 120°)
𝛥𝛥3 =𝑆𝑆13
+ �23𝑆𝑆𝑆𝑆2 cos(𝜙𝜙𝜎𝜎 + 120°)
2. For the Strains (see Figure 5-7)
Here too the directions 1, 2 and 3 are associated with OX, OY and OZ respectively. - The components of the strain tensor
𝜀𝜀𝑖𝑖(𝜀𝜀1, 𝜀𝜀2, 𝜀𝜀3) 𝑜𝑜𝑜𝑜 (𝜀𝜀𝑥𝑥, 𝜀𝜀𝑦𝑦, 𝜀𝜀𝑧𝑧)
are computed incrementally or logarithmically. - The volumetric strain
𝜀𝜀𝑣𝑣 = 𝜀𝜀1 + 𝜀𝜀2 + 𝜀𝜀3 = −𝐿𝐿𝐿𝐿𝐿𝐿(𝑉𝑉/𝑉𝑉0) is computed incrementally or logarithmically. - In the octahedral or the Π plane the intensity of the deviator ρε =OM= ID2 is given by
(Figure 5-7)
ID2 = OM = 𝜌𝜌𝜀𝜀 = �13
[(𝜀𝜀1 − 𝜀𝜀2)2 + (𝜀𝜀2 − 𝜀𝜀3)2 + (𝜀𝜀3 − 𝜀𝜀1)2]
ϕϵ = phase angle for strain - In a compression test the vertical stress is increased and the lateral stresses are kept
constant. - In an extension test the vertical stress is decreased and the lateral stresses are kept
constant.
19
- In a hydrostatic compression test the effective spherical stress is increased then decreased and the volume changes measured.
Bifurcation phenomena are quite visible beyond the peak. A constant b is obtained by varying σ1 and σ3 while σ2 = σy is kept constant and equal to
the initial spherical effective stress. In the circular type test the loading starts from a spherical state of stress and during the
whole test this mean stress remains constant; in other words we stay on the octahedral or Π plane. Referring to Fig. 3.4.3, the loading path begins at 0 then proceeds along OA by increasing the vertical stress and decreasing the lateral ones. This corresponds to a phase angle ϕσ of -120°=. Then two cycles ABCABCA are performed.

20
Figure 5-4 Figure 5-5
Figure 5-6 Figure 5-7

21
6 LIST OF THE TEST At the end of this section we give a printout of the listing of all the tests in the data base.
The files are grouped in directories based on the type of testing device, and the name of the material tested. The legend for the letters at the top of the list is as follows:
Symbol Definition N Index Number File_Name File Name Format File Format Soil_Name Soil Name Type File Type GS Group Symbol RD Relative Density L => Loose N => Dense U => Undefine VR Void Ratio ECP Effective Cell Pressure (kpa) b b MS Mean stress C => Constant V => Variable LP Loading Path 1- Proportional Loading 2- Proportional Loading with unloading 3- Cyclic 4- Complex
In the listing notice that the files for a particular device and a particular material have been
grouped according to the effective cell pressure ECP; which is also most of the time, the consolidation pressure. In every grouping various values of b are covered.
When one is conducting a hollow cylinder test in which axial and torsional stresses are varied while keeping a constant ratio, the stress path is radial; and the inclination of the major principal stress on the axis of symmetry β is connected to β by
b = sin2β In an attempt to include as much information as possible in the name of a file, the following
numbering convention is used for the effective cell pressure and the value of b. Nomenclature β b Nomenclature ECP (psi,bar) ECP (kPa) 0: 0 0 1: 30 psi (206.85 kPA) 1: 15 0.067 2: 50 psi (344.75 kPA) 2: 31.75 0.277 3: 70 psi (482.65 kPa)

22
3: 32.33 0.286 4: 2 bar (200.00 kPa) 4: 45 0.5 5: 5 bar (500.00 kPa) 5: 54.69 0.666 6: 3.5 bar (350.00 kPa) 6: 58.25 0.723 7: 75 0.933 8: 90 1
Also, for the relative density of the material, three letters L, M and N are used for loose, medium and dense respectively.
The letter D is used for tests in which the mean stress varies. In a hollow cylinder test this involves increasing the axial load while the cell pressure is kept constant. The letter G is used for what is referred to as a generalized test. This is a test in which the mean stress remains constant. In the hollow cylinder this is done by increasing or decreasing the axial load while decreasing or increasing the cell pressure. Different combinations can be used to obtain this result in the case of a cube.
The letter U means that the test involves unloading. The letter T refers to a specimen that has been trimmed to a dogbone shape to avoid end
effects. The letter H refers to a test in which the specimen has been subjected to a hydrostatic stress
alone. Those tests usually involve a loading and unloading sequence. The letter C refers to a complex stress path. Thus as listed in the table at the end of this document,
Test 83: CASE_DB|CUBE|SPEC|DL36U Cube special test using Reid Bedford Sand. All SPEC tests were performed on Reid Bedford Sand unless noted otherwise. DL36U D L 3 4 U Mean Stress =
Direct Test Relative Density = Loose
ECP = 483 kPa
b = 0.72
Loading = Unloading
Test 171:
CASE_DB|HC|MCGILL|DN22T
Hollow Cylinder test using McGill Hydrite Clay. DN22T D N 2 2 T Mean Stress =
Direct Test Relative Density = Dense
ECP = 345 kPa
b = 0.25
Trimmed to a dog bone shape
There is a test conducted on McGill clay whose file name is DN2F4T (Test No. 176). This is a test in which the height was kept constant during pure torsion causing the axial load to vary slightly and with it the value of b.
There are two collections of tests which are special, namely, ‘CASE_DB|CUBE|SPEC’ and ‘CASE_DB|HC|SPEC’.

23
Consider the first case CASE_DB|CUBE|SPEC whose files extend from No. 76 to No. 90 in the list:
1. Tests 76 and 77 have the word circular in their name and a three letter extension indicating the type of sand used. In those tests, the stress path is circular in the PI plane.
2. In Test 78 (DL24U) there are three cycles of loading and unloading with a constant mean stress and b = 0.5:
a. σz ↗, σx ↘, σy = const; and the reverse
b. σz ↗, σx ↘, σy = const; and the reverse
c. σz = const, σx ↗, σy ↘; and the reverse
3. Tests 79, 80 and 81 have A, B and C in their name. They have been grouped because this is really one test in which loading was applied first in the Z direction and reversed; then applied in the X direction and reversed; then applied in the Y direction and reversed.
4. In test 82(DL30U), 83(DL36U) and 84(DL38U) b remains constant during the loading and the unloading phases. Examine those tests and note the pattern of changes in σx, σy, and σz.
5. Tests 85 to 88 have stress reversals, such that upon reversal the value of b jumps between two values; 0 and 1, 0.27 and 0.73, 0.73 and 0.27, and 1 and 0 respectively.
6. Please examine the pattern of changes in σx, σy, and σz.
7. Tests 89 and 90 were loaded and unloaded hydrostatically. Consider the second directory CASE_DB|HC|SPEC with two files, namely 259 and 260.
In those two tests the hollow cylinders were axially loaded to a given level then subjected to five cycles of torsion; at the end of which they were loaded in torsion to failure. Those two tests were used during the Case workshop to validate some of the proposed models.
Please examine now the following listing and the various groupings. To validate a given model pick the group of tests that corresponds to your own conditions, (or is close to it) pick the basic tests needed to obtain your constants and try to predict the results of more complicated tests
24
7 REFERENCES 1. Saada, A. and Bianchini (Editors): Constitutive Equations for Granular Non-Cohesive
Soils, 733 pp., Balkema, Rotterdam, 1988.
2. Saada, A. and Townsend, F., "Strength Laboratory Testing of Soils," A State of the Art paper presented at the ASTM Symposium on the Shear Strength of Soils, Chicago, Illinois, ASTM, STP 740, 1981, pp. 7-77.
3. Saada, A., "Hollow Cylinder Torsional Devices, Their Advantages and Limitations," A State of the Art Paper presented at the ASTM Symposium on Advanced Triaxial Testing of Soil and Rock, Louisville, Kentucky, ASTM, STP 977, pp. 766-795.
25
8 APPENDIX 1 (RELATED PAPERS) 1. A. Saada & P. Puccini, The Development of a Data Base Using the Case Hollow Cylinder
Apparatus, Constitutive Equations for Granular Non-Cohesive Soils, A. Saada and G. Bianchinin, Editors, 1988 Balkema, Rotterdam, ISBN 90 6191 7891.
2. J. Lanier & Z. Zitouni, Development of a Data Base Using the Grenoble True Triaxial Apparatus, Constitutive Equations for Granular Non-Cohesive Soils, A. Saada and G. Bianchinin, Editors, 1988 Balkema, Rotterdam, ISBN 90 6191 7891.
3. J. Lanier, Z. Zitouni, A. Saada, P. Puccini, G. Bianchini, Comportement tridimensionnel des sables: comparaison d’essais véritablement triaxiaux et d’essais sur cylinder creux. Revue Francaise de Géotechnique, No. 49, Octobre 1989, pp. 67-76.
4. G. Banchini, A. Saada, P. Puccini, J. Lanier, Z. Zitouni, Complex Stress Paths and Validation of Constitutive Models. Geotechnical Testing Journal, ASTM, Vol. 14, No. 1, March 1991, pp. 13-25.