Embed Size (px)
Citation preview

1
LARGE-SCALE BIOLOGY
The Biotrophic Development of Ustilago maydis Studied by RNAseq Analysis
Daniel Lanver1a*, André N. Müller1b*, Petra Happel1, Gabriel Schweizer1, Fabian B. Haas2,Marek Franitza3, Clément Pellegrin1, Stefanie Reissmann1, Janine Altmüller3,4, Stefan A. Rensing2,5 and Regine Kahmann1Ɨ
1Max-Planck-Institut für Terrestrische Mikrobiologie, Abt. Organismische Interaktionen, Karl-von-Frisch Straße 10, 35043 Marburg, Germany 2Philipps Universität Marburg, Fb17 Biologie, AG Zellbiologie der Pflanzen, Karl-von-Frisch-Straße 8, 35043 Marburg, Germany 3 Cologne Center for Genomics (CCG), University of Cologne, Weyertal 115b, 50931 Cologne, Germany. 4 Center for Molecular Medicine Cologne (CMMC), University of Cologne, 50931 Cologne, Germany. 5 BIOSS Centre for Biological Signalling Studies, University of Freiburg, Freiburg, Germany a Present address: Bayer CropScience Biologics GmbH, Metkenberg 6, 23970 Wismar, Germany b Present address: RWTH Aachen University, BIO3: Plant Physiology, Plant Biochemistry and Molecular Biology, Worringer Weg 1, 52074 Aachen, Germany * These authors contributed equally to this work
Ɨ Address correspondence to [email protected] Dr. Regine Kahmann Max-Planck-Institut für terrestrische Mikrobiologie, Abt. Organismische Interaktionen Karl-von-Frisch-Straße 10 35043 Marburg, Germany Phone: +49-6421-178501 Fax: +49-6421-178509 Email: [email protected]
Short title: U. maydis biotrophic transcriptome
One-sentence summary: A study of U. maydis gene expression provides unexpected new leads concerning fungal nutrition, defense suppression and tumor induction during plant colonization.
The author responsible for distribution of materials integral to the findings presented in this article in accordance with the policy described in the Instructions for Authors (www.plantcell.org) is: Regine Kahmann ([email protected]).
Plant Cell Advance Publication. Published on January 25, 2018, doi:10.1105/tpc.17.00764
©2018 American Society of Plant Biologists. All Rights Reserved

2
Abstract
The corn smut fungus Ustilago maydis is a model organism for elucidating host colonization strategies of biotrophic fungi. Here we performed an in depth transcriptional profiling of the entire plant-associated development of U. maydis wild-type strains. In our analysis we focused on fungal metabolism, nutritional strategies, secreted effectors and regulatory networks. Secreted proteins were enriched in three distinct expression modules corresponding to stages on the plant surface, establishment of biotrophy and induction of tumors. These modules are likely the key determinants for U. maydis virulence. With respect to nutrient utilization, we observed that expression of several nutrient transporters was tied to these virulence modules rather than being controlled by nutrient availability. We show that oligopeptide transporters likely involved in nitrogen assimilation are important virulence factors. By measuring the intramodular connectivity of transcription factors, we identified the potential drivers for the virulence modules. While known components of the b-mating type cascade emerged as inducers for the plant surface and biotrophy module, we identified a set of yet uncharacterized transcription factors as likely responsible for expression of the tumor module. We demonstrate a crucial role for leaf tumor formation and effector gene expression for one of these transcription factors.
Key words
RNA-seq, plant pathogen, fungi, virulence, effectors, nutrient utilization, transcriptional regulation

3
Introduction
Plant pathogenic fungi have adopted discrete lifestyles in interaction with their hosts ranging
from biotrophy, where the plant needs to be kept alive to sustain fungal growth, to necrotrophy,
where infected plant tissue is actively killed and the fungus feeds on the dead material. In
between these extremes are hemibiotrophs, which initially establish a biotrophic phase and then
at some point switch to necrotrophic development. To promote the respective colonization
strategy pathogens secrete a large arsenal of effector proteins. In recent years the study of life-
style transitions in plant pathogenic fungi by time resolved transcriptome analyses through
RNAseq provided deep insights into the processes associated with stages of fungal
development on and inside the host (Kawahara et al., 2012; O'Connell et al., 2012; Hacquard et
al., 2013; Jupe et al., 2013; Dong et al., 2015; Fondevilla et al., 2015; Kong et al., 2015; Rudd et
al., 2015; Dobon et al., 2016; Thatcher et al., 2016; Copley et al., 2017; Wang et al., 2017; Zeng
et al., 2017; Massonnet et al., 2018). These and other studies (Toruno et al., 2016) have shown
that different sets of effectors are synthesized and presumably needed during discrete
developmental stages in fungal pathogens.
The biotrophic fungus Ustilago maydis causes smut disease in maize (Zea mays). This system
has advanced to a model for biotrophic pathogens mainly because of the ease by which fungal
genes can be manipulated through reverse genetic techniques (Kamper, 2004; Dean et al.,
2012; Schuster et al., 2016). In U. maydis and related smut fungi the process of plant
colonization is intimately coupled with sexual development. Plant colonization is initiated when
haploid cells of a compatible mating type recognize each other on the leaf surface via a
pheromone-receptor system (Bolker et al., 1992), fuse and develop a dikaryotic filament.
Filament formation and subsequent pathogenic development are controlled by the heterodimeric
bE/bW (bEast/bWest) homeodomain transcription factor, which is formed after cells with different
alleles of the b locus have fused (Gillissen et al., 1992). The dikaryon is cell cycle arrested
(Castanheira et al., 2014) and is able to invade the plant via a specialized infection structure, the
appressorium. Appressoria allow direct invasion of epidermal plant cells in a process which is
likely aided by plant cell wall degrading enzymes and plant cell wall loosening. During this stage
the fungus remains intracellular and becomes completely encased by the plasma membrane of
the host, forming a tight and extended interaction zone. After penetration, the cell cycle block is
released and mitotic growth of the dikaryotic form is observed, using characteristic clamp-like
4
structures for sorting the nuclei (Scherer et al., 2006). After reaching the mesophyll layer and the
veins, U. maydis cells grow along and inside of the veins, presumably to forage nutrients. During
this stage discrete plant cell types enlarge and resume mitotic divisions (Matei, 2016), leading to
the formation of tumors, the most conspicuous signs of corn smut disease. In these tumors
extracellular hyphae form large aggregates in cavities between plant tumor cells, their dikaryotic
nuclei fuse and massive proliferation ensues followed by hyphal fragmentation and spore
formation (Vollmeister et al., 2012; Matei and Doehlemann, 2016; Tollot et al., 2016; Lanver et
al., 2017; Redkar et al., 2017; Snetselaar and McCann, 2017). This entire developmental cycle
strictly depends on the plant and remains biotrophic throughout.
U. maydis is predicted to encode 476 secreted proteins of which 215 lack any known structural
or functional domains, preventing conclusions to be drawn about their molecular functions
(Schuster et al., 2017). Many of these potential effector genes reside in clusters in the genome
(Kamper et al., 2006; Schirawski et al., 2010), are expressed specifically in tumor tissue
compared to axenic culture conditions (Kamper et al., 2006) and contribute to virulence (Kamper
et al., 2006; Muller et al., 2008; Schirawski et al., 2010; Schilling et al., 2014; Stirnberg and
Djamei, 2016). So far the molecular function of only five U. maydis effectors has been elucidated
(Djamei et al., 2011; Hemetsberger et al., 2012; Mueller et al., 2013; Tanaka et al., 2014; Redkar
et al., 2015).
The bE/bW transcription factor triggers a regulatory cascade including several transcription
factor genes as well as 38 potential effector genes (Heimel et al., 2010a; Heimel et al., 2010b).
The expression of the majority of these genes further requires the bE/bW-regulated transcription
factor rbf1 (regulator of b-filament; Heimel et al., 2010b). Early infection-related development of
U. maydis up to the stage of appressorium formation can be mimicked by stimulation with
hydroxy fatty acids and exposing cells to a hydrophobic surface (Mendoza-Mendoza et al.,
2009). An array study of these stages revealed that two transmembrane proteins, the U. maydis
homologs of Sho1p (psynthetic high osmolarity sensitive) and Msb2p (multicopy suppressor of a
budding defect) from Saccharomyces cerevisiae, are specifically responsible for plant surface
cue-induced expression of 41 potential effectors (Lanver et al., 2014). In addition, two
transcription factors, hdp2 (homeodomain transcription factor 2) and biz1(b-dependent zinc
finger protein), which belong to the rbf1-induced genes (Heimel et al., 2010b) and have critical
roles in virulence (Flor-Parra et al., 2006; Lanver et al., 2014), are transcriptionally induced by
Sho1 and Msb2 providing indirect evidence that these transcription factors may induce the
expression of early effectors. After induction of tumors, the WOPR transcription factor Ros1

5
(regulator of sporogenesis 1) induces nuclear fusion, subsequent proliferation and initiates spore
production (Tollot et al., 2016). Ros1 also emerged as an important regulator of effector gene
expression. Seventy genes encoding secreted proteins require Ros1 for full expression and 128
genes encoding secreted proteins are downregulated by Ros1. It is speculated that U. maydis
can afford the downregulation of so many effectors, including some of the essential effectors
expressed early during pathogenic development because Ros1 is also required for the
generation of a mucilaginous matrix which may shield hyphae from plant defense molecules
(Tollot et al., 2016).
The transcriptional response of maize plants during infection with U. maydis has been studied in
detail using genome-wide array analysis. These studies have revealed that U. maydis triggers
early plant defense responses when on the leaf surface, presumably through the perception of
microbe-associated molecular patterns (MAMPs). These responses are subsequently
suppressed during the early colonization stages, likely through the action of early effectors
(Doehlemann et al., 2008b). U. maydis also induces transcription of plant cell death suppressors
like cystatins and Bax-inhibitor 1, induces jasmonate signaling and prevents the transition from
sink to source leaves (Doehlemann et al., 2008b). All these studies were performed with the
engineered solopathogenic haploid strain SG200 (Kamper et al., 2006) that can infect plants
without a mating partner. The transcriptome of the U. maydis SG200 strain as well as of SG200
mutants during pathogenic development has been investigated in several studies using array
technology (Kamper et al., 2006; Zheng et al., 2008; Skibbe et al., 2010; Gao et al., 2013;
Schuler et al., 2015; Rabe et al., 2016). A few studies also analyzed the transcriptome of
compatible wild-type strains at discrete stages after infection (Wahl et al., 2010; Zahiri et al.,
2010; Tollot et al., 2016). However, most global analyses of the U. maydis transcriptome during
colonization were so far restricted to stages of biotrophic development where significant
amounts of fungal biomass have accumulated. A comprehensive, time-resolved transcriptional
profiling of the plant-associated stages of the U. maydis life cycle was lacking so far. We have
recently noted that SG200 behaves differently from compatible haploid strains during the late
stages of pathogenic development. While fungal biomass significantly increases after karyogamy
in infections with compatible wild-type strains (Tollot et al., 2016), fungal biomass of SG200
decreased at the corresponding time points (S. Tanaka, P. Erchinger, S. Krombach and R. K.,
personal communication). In this study we have therefore performed an RNAseq analysis of
compatible haploid U. maydis strains starting at 12 h after infection of Z. mays seedlings, i.e.
when cells have mated, switched to filamentous growth and begun to form appressoria, to 12
days post infection (dpi) when tumors contain mature spores. This offered an unprecedented

6
view of the changes in the fungal transcriptome associated with the passage through the
biotrophic life cycle. Deep sequencing enabled us to resolve also the very early stages of
infection where fungal biomass is low and fungal transcripts are heavily under-represented. We
focus our attention on fungal metabolism, nutritional strategies, secreted effectors and regulatory
networks. Based on uncovering discrete gene expression waves successively following the
developmental stages of U. maydis, we expect this data set to become a highly valuable
resource for future studies in this biotrophic fungal model as well as related host–pathogen
systems.
Results and Discussion
To analyze the transcriptional changes during plant-associated stages of U. maydis, maize
seedlings of the variety Early Golden Bantam were infected with the compatible U. maydis wild-
type strains FB1 and FB2 (Banuett and Herskowitz, 1989), and infected tissue was collected
over a period of 12 days (Figure 1A). The samples represented the following developmental
stages of U. maydis: filaments and appressoria in the pre-penetration phase (0.5 days post
infection, dpi), penetrating appressoria (1 dpi), dikaryotic biotrophic hyphae with clamp
connections (2 dpi), proliferating hyphae and aggregated hyphae (4 dpi and 6 dpi), fragmented
hyphae (8 dpi) and mature spores (12 dpi; Figure 1A). For each time point, three biological
replicates were generated. As an additional reference, we included FB1 and FB2 grown
exponentially in YEPSL medium.
By Illumina sequencing of mRNA libraries, we created in total more than two billion paired end
reads from all samples (Supplemental Data Set 1). Prior to mapping them to the U. maydis
genome, reads mapping to the maize genome were filtered. These data are not discussed here
but have been deposited in the NCBI Gene Expression Omnibus (Edgar et al., 2002) and are
accessible through GEO Series accession number GSE103876. For the early time points of 0.5
dpi and 1 dpi in particular, reads mapping to the fungal genome amounted to <0.5%, i.e. were
heavily under-represented (Figure 1B and Supplemental Data Set 1). In the total paired-end
reads from all samples, the sequencing depths of the 0.5 and 1 dpi samples has been adjusted
to reach about 500 thousand-read counts that mapped to the fungal genome and in the
remaining samples to reach about one million or more fungal read counts (Supplemental Data
Set 1). In each sample >75% of the 6766 U. maydis genes were represented with more than 10
fragments per kilobase of exon per million (FPKM) fungal reads, indicating that we have

7
efficiently detected fungal gene expression across all time points. Correlated with the increasing
fungal biomass, the fungal reads steadily increased during later time points and reached
approximately 10% at 12 dpi (Figure 1B and 1C). We observed a linear correlation between the
number of fungal transcripts and increase in fungal biomass (Supplemental Figure 1). However,
the steep increase in fungal transcripts from 1 dpi to 2 dpi (Figure 1B), that is statistically
significant (Supplemental Data Set 2), was not accompanied by a comparable change in fungal
biomass (Figure 1C). This suggests that the transcriptional activity of U. maydis cells after
recovery from cell cycle arrest (2 dpi) is higher than at the stage before penetration or during
later biotrophic development.
To enable comparisons between samples, all read counts were normalized by DESeq2
(differential expression analysis for sequence count data 2) (Love et al., 2014) (Supplemental
Data Set 3). To assess variability among the samples we performed a principal component
(PCA) analysis (Figure 2A). The three biological replicates formed distinct clusters, indicating
time point-specific expression patterns and an acceptable variation between replicates at any of
the chosen time points. To analyze differential gene expression, we compared expression in all
28 possible pairs of the 8 different time points. This analysis revealed that in total 5759 genes
(85% of all U. maydis genes) were differentially expressed (log2 fold change > 0.5 and adjusted
pvalue < 0.01) in at least one of the 28 comparisons (Figure 2B, Supplemental Data Set 4). To
validate the expression data, we randomly picked nine genes expressed at different levels and
performed RT-qPCR (reverse transcription quantitative PCR) using all 24 generated RNA
samples. We observed a strong linear correlation (r = 0.90) between the RT-qPCR and RNAseq
data (Supplemental Figure 2). To further strengthen the bioinformatics analysis, EdgeR was
used as an alternative tool to normalize the data and to identify differentially expressed genes.
This analysis yielded results comparable to the DESeq2 analysis (Supplemental Data Set 5). In
the following analyses, we refer to the DESeq2 results.
The most dramatic changes in gene expression were observed in pairwise comparisons
including axenic culture conditions (Figure 2B). However, even if comparisons with the axenic
culture sample, which may be unrelated to the conditions on or inside the plant with respect to
nutrient availability, were excluded from the analysis, 4586 genes (68% of the U. maydis genes)
remained differentially expressed (Figure 2B). Such a high proportion of genes showing
differential expression during the plant-associated developmental stages distinguishes U.
maydis from other pathogenic fungi where similar RNAseq studies have been performed. In
Zymoseptoria tritici, Colletotrichum higginsianum and Puccinia striiformis f. sp. tritici 28%, 44%

8
and 50% of the genes were differentially expressed, respectively (O'Connell et al., 2012; Rudd
et al., 2015; Dobon et al., 2016). We consider it likely that the coupling between pathogenic and
sexual development in U. maydis and the associated morphological changes contribute to this
high percentage of differentially expressed U. maydis genes. For the other three examples
given, asexual reproduction cycles were studied. However, rather than assuming that the
discretely different life styles of these pathogens contribute to the percentage in differentially
expressed genes, variation in sequencing depth and numbers of analyzed samples in the
different studies cannot be excluded as cause. Overall, the large number of differentially
expressed U. maydis genes underscores the comprehensiveness of our analysis and indicates a
complex transcriptional regulation during all stages of biotrophic development.
In the next step of the analysis, we used the expression data of all stages to perform a weighted
gene co-expression network analysis (WGCNA; Supplemental Figure 3). This analysis identifies
modules of co-expressed genes and represents the modules by their centrally located genes,
referred to as module eigengenes (Zhang and Horvath, 2005; Langfelder and Horvath, 2008).
We identified 14 modules which were color-coded and ranged in size from 36 genes (blue
module) to 1231 genes (yellow module; Supplemental Data Set 6). The expression profiles of
the respective module eigengenes are depicted in Figure 2C. Some of the modules reflect
distinct stages during fungal development. The red module was expressed solely on the plant
surface (0.5–1 dpi). The light-green module was expressed during penetration and early
biotrophic development (1–2 dpi) and ceased afterwards. The magenta module was strongly
induced from 0.5–2 dpi and expression was largely maintained up to 12 dpi. This module
therefore correlated with the establishment and maintenance of biotrophy. The cyan module was
induced after establishment of biotrophy just at the onset of tumor induction (2–4 dpi), and
expression stayed high also at later time points. Thus, the cyan module represented a tumor
module. The blue module was specific for spore development (8–12 dpi).
To confirm that the observed expression patterns are not a product of the specific bioinformatics
tool, we performed k-mean clustering of the gene expression data, sorting the genes into six
clusters. Five of these clusters were highly correlated (> 0.9) with a distinct module of the co-
expression obtained by WGCNA (Supplemental Data Set 7). These included the three virulence
modules red, magenta and cyan, as well as the yellow and lightcyan module. One k-mean
cluster correlated with two, the darkgreen and the burlywood module, which are highly correlated
modules (Supplemental Figure 3B). There was thus a substantial overlap between the
respective gene sets obtained by WGCNA and k-mean clustering with overlap coefficients

9
ranging from 0.7 to 1.0 (Supplemental Data Set 7). All subsequent analysis refer to the modules
obtained by WGCNA.
To generate a concise picture of the biological processes (BP) associated with pathogenic
development, each module was subjected to an enrichment analysis for gene ontology (GO)
terms (Supplemental Data Set 8) (Ashburner et al., 2000; The Gene Ontology, 2017). We
visualized the respective enriched gene sets in a weighted similarity network, which facilitated
the identification of the predominant processes in any given module (Figure 3 and Supplemental
Figure 4). In the sections that follow, we make use of these functionally annotated modules to
gain a better understanding of the virulence strategies adopted by U. maydis.
General changes in fungal metabolism throughout the infection cycle
Looking for modules which reflect high metabolic and cellular activity identified the yellow
module (Figure 3A, Supplemental Data Set 9). This module is enriched for genes involved in
translation, ribosome biogenesis, amino acid and nucleic acid biosynthesis, cell division, primary
metabolism and respiration. The highest expression level of the yellow module was observed
during U. maydis growth in axenic culture (Figure 2C), a condition in which the doubling time of a
cell was around two hours, which likely exceeds the growth rate in all plant-associated stages.
The yellow module shows lowest expression at 0.5 and 1dpi, i.e., the stages where mating
occurs and the cell cycle-arrested dikaryon is formed. At 2 dpi the module displays a second
expression peak, likely reflecting the release of the cell cycle block after penetration and early
biotrophic growth. This expression pattern resembles the response of starving cells to nutrient
repletion (Conway et al., 2012). From 2 dpi until 12 dpi, genes of the yellow module were
progressively downregulated (Figure 2C) and instead genes involved in protein catabolism and
autophagy were induced. Such genes are located in the light-cyan module (Figure 3B,
Supplemental Data Set 10), which is almost perfectly negatively correlated with the yellow
module (r = -0.99, Pearson correlation; Figure 2C). Autophagy is an important mechanism by
which eukaryotic cells degrade cytosolic macromolecules and recycle them for the synthesis of
new macromolecules or use them as energy source. In addition to induction of autophagy,
expression of genes involved in lipid transport and lipid metabolism increased after 2 dpi. The
respective genes are located in the dark-green module (Figure 3C, Supplemental Data Sets 8
and 9). These findings suggest that autophagy-mediated cellular recycling as well as
degradation of fatty acids become important during the later biotrophic interaction. Increased

10
fatty acid metabolism has also been associated with the biotrophic growth of Z. tritici (Rudd et
al., 2015) and arbuscular mycorrhizal fungi. The latter were recently shown to take up lipids from
their host to sustain colonization (Rudd et al., 2015; Jiang et al., 2017; Keymer et al., 2017). The
synchronous upregulation of autophagy and lipid metabolism genes and downregulation of
ribosome biogenesis genes are typical expression patterns during slowed growth and during
starvation (Gasch et al., 2000). We also observed that nit2 (nitrogen catabolic enzyme regulatory
protein) and snf1 (sucrose nonfermenting 1), the nitrogen and carbon catabolite de-repressors
(Nadal et al., 2010; Horst et al., 2012), have increased transcript levels during tumor formation
compared to early biotrophic growth (Supplemental Data Sets 3 and 4), indicating that carbon
and nitrogen sources may be limiting. Previous studies indicated that tumor tissue is a strong
sink tissue with an efficient supply of organic nutrients from systemic source leaves (Billet and
Burnett, 1978; Doehlemann et al., 2008b; Horst et al., 2008; Horst et al., 2010). Metabolome
profiling of U. maydis infected tissue revealed that free hexoses and amino acids are highly
abundant in tumor tissue, and even reach the levels of juvenile sink tissue (Horst et al., 2010).
This latter finding seems to contradict our RNAseq-based assessment that U. maydis may be
starved for carbon and nitrogen in tumor tissue. However, the metabolome analysis (Horst et al.,
2010) was conducted with SG200, a haploid solopathogenic U. maydis strain. In contrast to
infections with compatible wild-type strains in which fungal biomass continuously increases
within tumor tissue (Figure 1C) (Tollot et al., 2016), SG200 does not increase its biomass late
during infection (S. Tanaka, P. Erchinger, S. Krombach and R. K., personal communication). We
speculate that the free hexoses and amino acids detected in SG200-induced tumor tissue (Horst
et al., 2010) may not accumulate to the same extent in tumors induced by wild-type strains
because they may be take up to support the continuous fungal proliferation (Billet and Burnett,
1978; Doehlemann et al., 2008b; Horst et al., 2008; Horst et al., 2010). The proliferation within
tumors of U. maydis wild-type strains, that are most likely diploid at that stage (Tollot et al.,
2016), may therefore resemble chemostat growth, in which cells grow slowly due to nutrient
limitation but, due to a constant nutrient flow towards tumor tissue, are not starving for essential
nutrients. A detailed metabolic profiling of tumors induced by a mixture of compatible U. maydis
wild-type strains will have to be done to monitor the dynamics of the available nutrients. It will be
interesting to see how this can then be linked to the transcriptome data presented here which
indicate nutrient-limited fungal growth within tumors. We consider it likely that nutrient limitation
could also contribute to the induction of the developmental program for aggregate formation and
teliospore formation inside the tumors.

11
Nitrogen Transporters
The utilization of complex nitrogen sources in fungi is regulated by specific transcription factors,
which de-repress the expression of genes needed for the degradation and uptake of various
nitrogen compounds in situations where the most favourable nitrogen sources ammonia and
glutamine are scarce (Marzluf, 1997). In many plant pathogenic fungi, including U. maydis,
mutants of the nitrogen catabolite de-repressors (nit2 in U. maydis) show reduced virulence
(Pellier et al., 2003; Divon et al., 2006; Thomma et al., 2006; Divon and Fluhr, 2007; Kim and
Woloshuk, 2008; Horst et al., 2012). The importance of nitrogen availability in biotrophic
associations is further corroborated by the observation that nitrogen fertilizers generally increase
the susceptibility of plants to biotrophs, whereas they decrease the susceptibility of plants to
necrotrophs (Snoeijers et al., 2000; Dordas, 2008; Ballini et al., 2013). Indeed, U. maydis is
known to grow on various nitrogen sources and has the ability to generate all proteinogenic
amino acids (Holliday, 1961; McCann and Snetselaar, 2008).
To obtain more insights into nutrient assimilation during biotrophic growth, we searched for
transporters that are highly induced in the plant environment compared to growth in YEPSL
medium (2 dpi vs axenic). The top five induced transporters were two putative urea permeases
dur3-1 (UMAG_02625) and dur3-2 (UMAG_06253), two putative oligopeptide transporters (OPT)
opt2 (UMAG_11057) and opt4 (UMAG_02387), and the candidate methylammonium permease
(MEP) ump2 (UMAG_05889) (Supplemental Data Set 11, Figures 4A and 4D). In fungi, related
transporter families are required for nitrogen utilization from peptides, urea and ammonium,
respectively (ElBerry et al., 1993; Lorenz and Heitman, 1998; Hauser et al., 2001; Abreu et al.,
2010; Hartmann et al., 2011; Navarathna et al., 2011; Dunkel et al., 2013), while OPTs can also
mediate sulfur utilization by taking up glutathione (Bourbouloux et al., 2000). All five transporters
are located in the magenta expression module (Figure 2C), and are thus linked to biotrophy
(Supplemental Data Set 11).
Besides the two urea permeases dur3-1 and dur3-2, which are highly induced during biotrophic
development, U. maydis possesses dur3-3 (UMAG_04577), a likely third urea permease. While
dur3-1 and dur3-2 are not induced under nitrogen depletion (Horst et al., 2012; Sanchez-
Arreguin et al., 2017), dur3-3 expression depends on nit2 under nitrogen starvation conditions
(Horst et al., 2012). In line with this observation, our expression analysis placed both dur3-3 and
nit2 into the light-cyan expression module likely involved in the response to limiting nutrients
(Figure 2C).

12
To study the contribution of all three urea transporters to virulence and to exclude redundancy,
we made use of the recently established CRISPR-Cas9 system in U. maydis (Schuster et al.,
2016; Schuster et al., 2017) and generated frame shift mutations near the 5´ends of the
respective three genes in haploid FB1 and FB2 strains. The resulting dur3-1,2,3 triple mutants
were affected during growth on medium with urea as sole nitrogen source (Figure 4B), but they
were not affected in virulence (Figure 4C), suggesting that urea uptake is not important for
biotrophic development. However, we did not investigate the effects on virulence when plants
are grown on nitrogen-poor soil and we therefore cannot exclude that the urea transporters
become virulence factors when the overall nitrogen supply of the plant is lower.
The high affinity ammonium transporter Ump2 has been characterized previously (Smith et al.,
2003). Besides mediating ammonium acquisition, this transporter has a signaling function and
initiates filamentous growth under nitrogen starvation (Smith et al., 2003). The ump2 gene is
partially subject to nitrogen catabolite repression, i.e., is regulated by Nit2 (Horst et al., 2012).
The high expression of ump2 during early biotrophic growth, which we observed here
(Supplemental Data Set 11), suggests additional regulation by plant signals. While ump2
mutants were unaffected in virulence (Smith et al., 2003), an ump1 (with a defect in the gene
encoding a low affinity ammonium transporter) ump2 double mutant was severely reduced in
virulence (M. Perlin, personal communication). Our expression analysis thus reinforces the
importance of ammonium uptake and its regulation for biotrophic development of U. maydis.
From the seven U. maydis peptide transporters, none was demonstrated to be regulated by Nit2
in response to nitrogen starvation (Horst et al., 2012). According to our transcriptional profiling,
three oligopeptide transporters (OPTs), opt2, opt4, and opt3 (UMAG_05968), were highly
induced during biotrophic development (Figure 4D). opt5 (UMAG_10896) and opt6
(UMAG_04347) are placed in the dark-green module (Figure 2C) based on their expression
pattern (Figure 4D), and may therefore be coupled to nutritional regulation (see previous
section), while opt1 (UMAG_10908) was constitutively expressed (Figure 4D). U. maydis
possesses only one member of the dipeptide/tripeptide transporter (PTR) family, ptr2
(UMAG_06138), and this gene also showed little variation in expression during fungal
development (Figure 4D). To study whether the biotrophy-coupled induction of OPT transporters
is important for virulence, we introduced frame-shift mutations by CRISPR-Cas9 in the 5´
regions of opt2, opt3 and opt4 genes in the FB1 and FB2 strain backgrounds. Plant infections
with compatible mixtures of the respective triple mutants revealed that these transporters are
important for virulence. While mating and filament formation were not affected (Figure 4E),

13
severe disease symptoms such as heavy tumors and plant death were drastically reduced in
infections with these mutants (Figure 4F). The virulence defect of the triple mutant could be
completely restored by introducing single copies of all three opt genes into the ip locus of the
triple mutant strains (Figure 4F). Full complementation makes it unlikely that truncated gene
products were produced due to the CRISPR-Cas9-induced frame-shifts, which could cause the
attenuated virulence in the triple mutant. The full restoration of virulence by complementation
also makes off-target mutations of Cas9 with unwanted side effects highly unlikely. The virulence
function of the oligopeptide transporters suggests that peptides produced from extracellular
proteins are important nutrient sources for U. maydis during biotrophic growth. It has been
previously demonstrated in the yeast Candida albicans that synchronous production of aspartic
proteases and OPTs enables growth on proteins as sole nitrogen source (Martinez and
Ljungdahl, 2005). Interestingly, two secreted aspartic proteases from U. maydis (UMAG_05097
and UMAG_12330) are located in the magenta module (Figure 2C) and are thus co-expressed
with the highly induced OPTs. Given the specific expression pattern of the described subset of
OPTs and aspartic proteases, we propose that extracellular proteolysis and subsequent uptake
of peptides may be intrinsically tied to the plant-associated developmental program of U. maydis.
With respect to utilization of carbohydrates, the uptake of sucrose follows a similar scheme
(Wahl et al., 2010): The high-affinity sucrose transporter srt1 (UMAG_02374), an important
virulence factor of U. maydis, is transcriptionally induced specifically during pathogenic
development, but not by the presence of sucrose under axenic culture conditions or under
carbon starvation (Wahl et al., 2010). The trigger for induction during the biotrophic phase is
unknown, but srt1 as well as the nitrogen-related transporters opt2, opt4, dur3-1, dur3-2 and
ump2, are all induced by the plant surface cues hydrophobicity and 16-hydroxy hexadecanoic
acid (Lanver et al., 2014). This corroborates that the early developmental stages like
filamentation and appressorium formation on the plant surface prepare U. maydis not only with
respect to effectors that can suppress plant defenses, but also with respect to nutrient utilization
systems important for growth inside the plant environment. In the wheat stripe rust fungus, OPT
transporters have been shown to be highly expressed in haustoria, the biotrophic fungal feeding
structures (Garnica et al., 2013). Interestingly, an OPT of the hemibiotroph C. gloeosporioides
was identified as an auxin-induced gene (Chague et al., 2009). In the U. maydis-maize system,
auxin levels are highly induced during infection (Turian and Hamilton, 1960; Basse et al., 1996;
Reineke et al., 2008) and it will be interesting to test whether auxin controls opt expression also
in U. maydis.

14
Overall, our data suggest that nitrogen utilization in U. maydis has a high level of complexity
involving nutrient level dependent as well as independent regulation. Both utilization modes
contribute to virulence and it may be this two-pronged strategy that allows U. maydis to
proliferate efficiently inside the infected plant tissue.
The machinery for protein secretion
From the GO-enrichment analysis (Figure 3) we found the light-green module (Figure 2C)
enriched in various processes related to protein secretion, e.g. ER to Golgi trafficking, vesicular
transport, and N-glycosylation (Figure 3; Supplemental Data Set 8 and 10). Genes of the
unfolded protein response (UPR) also mainly reside in the light-green module (Supplemental
Data Set 10). The light-green secretion machinery module is induced during penetration of the
plant surface (1 dpi) and peaks at 2 dpi (Figure 2C). A similar expression pattern was observed
for many genes encoding secreted proteins (discussed below), and in all likelihood this reflects
the high demand for the secretion machinery during plant colonization. The observed strong
increase in expression of the light-green module from 1 dpi to 2 dpi is challenging to interpret.
Since the 1 dpi time point represents a mixture of mostly filamentous hyphae on the leaf surface
and only a small percentage of hyphae that have developed appressoria and have penetrated
(Figure 1A), it is conceivable that the actual expression levels of the secretion machinery and the
secretome components in the few penetrated hyphae are as high as the levels observed in
branching mycelium at 2 dpi. The lower overall expression values at 1 dpi might thus simply
reflect that only a small percentage of the inoculum has mated and penetrated. This
interpretation is in line with previous studies showing that penetrated hyphae activate the
unfolded protein response (UPR) through the Cib1 (Clp1 interacting bZip1) transcription factor
(Heimel et al., 2013). The UPR affects secretion as well as expression of effectors (Heimel et al.,
2013; Hampel et al., 2016; Lo Presti et al., 2016).
In contrast to N-glycosylation, components of the O-glycosylation pathway are most strongly
expressed in axenic culture as well as on the plant surface (yellow and burlywood module,
Figure 2C and Supplemental Data Set 10). Both processes, O-mannosylation and N-
glycosylation, are necessary for virulence of U. maydis (Fernandez-Alvarez et al., 2009;
Fernandez-Alvarez et al., 2013). Previous studies could trace back the virulence defect of
mutants in the O-mannosylation pathway to a failure in appressoria formation, mainly explained
by the reduced glycosylation of the plant surface cue sensing receptor Msb2 (Fernandez-Alvarez

15
et al., 2012). By contrast, mutants defective in components of the N-glycosylation pathway are
able to penetrate the plant, but induce strong defense responses, e.g. an oxidative burst,
indicative of a malfunction of effectors (Schirawski et al., 2005; Fernandez-Alvarez et al., 2013).
Our expression data strongly support the model that O-mannosylation is particularly important
for early fungal development on the plant surface, while N-glycosylation is mainly necessary
inside the plant tissue to produce functional effectors. For M. oryzae it has been demonstrated
that N-glycosylation of an effector is necessary for its virulence promoting function (Chen et al.,
2014). For U. maydis effectors this has yet to be demonstrated.
Development-associated changes of the secretome
The U. maydis genome contains 467 genes encoding putatively secreted proteins (Schuster et
al., 2017). 215 of the predicted secreted proteins are lacking any predicted structural or
functional domain (Schuster et al., 2017) and some of those proteins have been previously
found to act as important virulence effectors (Lanver et al., 2017). Secreted proteins are
distributed over 12 of the 14 expression modules (Figure 5, Supplemental Data Set 12), i.e.,
their expression occurs in waves following the characteristic expression profile of the respective
module during the course of an infection.This suggests that certain groups of secreted proteins
are only needed during specific periods of an infection cycle. A search for modules in which
secreted proteins are significantly overrepresented identified only three modules: the red module
(p-value 5.71E-5, Fisher exact test), the magenta module (p-value 8.46E-23, Fisher exact test)
and the cyan module (p-value 3.42E-10, Fisher exact test; Figure 2C and Supplemental Data
Set 13), i.e. the modules specific for the plant surface, biotrophic development and tumor
formation, respectively. These three modules have in common that they are almost completely
off during the axenic culture condition (Figure 5). Thus, they likely represent specific virulence
modules.
The secreted proteins of the red module (Figure 2C) predominantly have predicted hydrolytic
functions (Figure 5; Supplemental Data Set 12) and contain amongst others cutinases, lipases,
and peptidases (Supplemental Data Set 12). Thus, the red module harbors key enzymes
potentially involved in the degradation of the cuticle. It is conceivable that some of the secreted
hydrolases also have antimicrobial activity like a putative lysozyme (UMAG_06218). In this
context it may thus not be a coincidence that this module also contains genes from secondary
metabolite clusters like mannosylerythritol lipid (MEL) and ustilagic acid (UA) biosynthesis

16
(Supplemental Data Set 14) (Teichmann et al., 2007). MELs are highly potent surface-active
substances (Fluharty and O'Brien, 1969) while UA has broad antimicrobial activity (Haskins and
Thorn, 1951) and was shown to aid against microbial competitors like the necrotrophic fungus
Botrytis cinerea in co-infection experiments (Teichmann et al., 2007).
After penetrating the cuticle, the fungal hyphae need to breach the polysaccharide plant cell wall,
and most likely this is accomplished by the secretion of plant cell wall degrading enzymes
(PCWDEs) (Schirawski et al., 2005; Lanver et al., 2014) of which U. maydis is predicted to
encode 40 (Figure 5; Supplemental Data Set 12) (Lo Presti et al., 2015). Notably, PCWDEs
were not enriched in the red module but in the light-cyan module (Figure 2C), a module which is
otherwise rather scarce in secreted proteins (Figure 5; Supplemental Data Set 12). We
implicated the light-cyan module in the response to nutrient limitation during growth on the leaf
surface as well as during late biotrophic interaction (see previous sections), suggesting that most
PCWDEs mediate utilization of carbon from plant cell walls at these stages. The expression
pattern of the PCWDEs also correlated with the colonization strategy of U. maydis, in which
plant cell walls must be penetrated at the beginning of the infection to enable initial intracellular
growth, and plant cell walls must be loosened again later during infection to allow enlargement of
cells during tumor formation. The expression data do not allow discrimination between a role for
these enzymes in nutrition and/or breaching plant cell walls. Previous studies in other plant
pathogenic fungi suggest a direct link between carbon utilization and plant cell wall penetration
(Tonukari et al., 2000; Ospina-Giraldo et al., 2003). In U. maydis this needs to be followed up by
functional studies of candidate genes.
Interestingly, our expression data show that few PCWDEs are uncoupled from nutritional
regulation and are instead tied to biotrophic development (i.e., they are found in the magenta
module). In this group of PCWDEs are all three U. maydis GH45 cellulases, five potential
hemicellulases, including two arabinofuranosidases, and the sole predicted pectin lyase
(Supplemental Data Set 12). While virulence functions of the GH45 family and the pectin lyase
were so far not demonstrated (Schauwecker et al., 1995; Doehlemann et al., 2008a; Lanver et
al., 2014), the arabinofuranosidase UMAG_01829 contributes to virulence (Lanver et al., 2014;
Schilling et al., 2014). Our expression data therefore suggest that also carbon supply from
complex sources, e.g., plant cell walls, might be ensured via a two-pronged strategy consisting
of nutrient level-dependent and independent regulation.

17
The magenta module (Figure 2C) predominantly contains genes encoding secreted proteins
lacking known functional domains (p-value 2.79E-8, Fisher exact test; Supplemental Data Sets
12 and 13) (Schuster et al., 2017).This module is the only module overrepresented for core
effectors lacking known domains which are conserved in five sequenced smut fungi (Schuster et
al., 2017) (Supplemental Data Sets 12 and 13): of the 24 core effector families (plus 30
putatively paralogous genes in U. maydis), the magenta module harbours 28 genes including
pep1(protein essential during penetration 1),pit2 (protein important for tumor 2) and stp1 (stop
after penetration 1), the three effectors known to be essential for establishing biotrophy
(Supplemental Data Set 12 and 13) (Doehlemann et al., 2009; Schipper, 2009; Doehlemann et
al., 2011; Mueller et al., 2013). We therefore speculate that these core effectors, which represent
14 different effector families (Schuster et al., 2017), may contain the key determinants for
establishing biotrophy in smut fungi. Another effector found in the magenta module but not
belonging to the core effectors is see1 (seedling efficient effector 1). This effector has been
shown to contribute to the reactivation of plant DNA synthesis in leaves, which is crucial for
tumor formation (Redkar et al., 2015). The early expression peak of see1 observed at 2 dpi
(Supplemental Data Set 12) suggests that this activation of plant DNA synthesis either has to
happen only in a narrow time window or that maintaining replication within tumors is controlled
also by other factors. The fact that expression of genes encoding secreted proteins in the
magenta module is decreasing during later stages of infection (Figure 5) is puzzling, given the
immunity suppressing function of several of these effectors (Doehlemann et al., 2009; Schipper,
2009; Mueller et al., 2013). To shed light on the underlying mechanism, we have generated two
haploid U. maydis strains in which promoters from two of the effectors from the magenta
module, pep1 and stp1, were fused to gfp. In addition, these strains expressed cytoplasmic
mCherry constitutively under the control of the actin promoter. These strains were crossed with
untagged compatible haploid strains and the developmental stage was analyzed when
downregulation of the module takes place. At this time point, fungal aggregates are the
predominant structures in the infected tissue (Tollot et al., 2016). While mCherry was rather
evenly distributed in cells forming the aggregate, pep1 and stp1 promoter activity was mainly
restricted to cells at the surface of the aggregates (Figure 6). To exclude that this spatial
expression pattern is specific for the gfp reporter, we also placed gfp under the control of the
actin promoter, and found the signal rather evenly distributed within the aggregates
(Supplemental Figure 5). This illustrates that while the majority of cells in the aggregates have
ceased to express pep1 and stp1, fungal cells that are in direct contact with the infected plant
tissue maintain high expression levels of these genes, which in all likelihood is sufficient to
18
downregulate plant defenses. How this heterogeneity in effector gene expression is achieved
and to which extent the production of matrix provides additional protection is currently unknown.
The cyan module is induced after establishment of biotrophy (2 dpi) which coincides with the
development of tumors and fungal aggregates. Like the magenta module, the cyan module is
enriched for secreted proteins lacking functional annotation (p-value 1.92E-7, Fisher exact test;
Supplemental Data Set 13).The cyan and magenta modules together contain 153 of the 215
secreted proteins lacking functional signatures (Figure 5 and Supplemental Data Set 12). None
of the candidate effector proteins belonging to the cyan module have been characterized so far.
Due to their tumor-specific expression profile, we hypothesize that effectors in the cyan module
might directly be involved in inducing the plant cell developmental switch to tumor cells. It is
interesting that the cyan module also contains a non-ribosomal peptide synthase
(UMAG_10543), as well as three of the six U. maydis polyketide synthases (UMAG_10532,
UMAG_06414, UMAG_06418; Supplemental Data Set 14). While UMAG_06414 is involved in
spore melanin biosynthesis (Islamovic et al., 2015), the functions of the other polyketide
synthases remain to be elucidated. The third wave of secreted proteins is thus accompanied by
active secondary metabolism. It is not clear whether the yet unknown secondary metabolites
produced are used for communication with the plant or represent molecules needed for
development of U. maydis.
Taken together, the transcriptome reveals the modular expression of putatively secreted proteins
while U. maydis is on the plant surface, during biotrophic development and during tumor
formation. Consecutive waves of effector gene expression linked to the transition from the
biotrophic lifestyle to necrotrophy have also been observed in the hemibiotrophic fungi C.
higgensianum, Colletotrichum graminicola, Z. tritici and Leptosphaeria maculans (Kleemann et
al., 2012; O'Connell et al., 2012; Mirzadi Gohari et al., 2015; Gervais et al., 2016). In C.
higgensianum the induced transcriptome of early infection stages is dominated by genes for
secondary metabolism, leading to the speculation also here that they may actually function in
host manipulation (O'Connell et al., 2012). In the biotrophic fungi Blumeria graminis f. sp. hordei,
Blumeria graminis f. sp. tritici and P. striiformis f. sp. tritici effector expression waves have also
been described (Hacquard et al., 2013; Dobon et al., 2016; Zeng et al., 2017), reinforcing the
idea that the need for certain effectors changes during host colonization and that this is a
conserved feature of different pathosystems.

19
Identification of potential transcriptional regulators of effector waves
To shed more light into the regulation of genes encoding secreted proteins, we visualized a
weighted co-expression network of all differentially regulated genes encoding secreted proteins
and all differentially regulated predicted transcription factors which are connected to at least one
of these (Figure 7A and 7B). We then looked for transcription factors which have strongest
connectivity to the respective modules in which secreted proteins reside. Such intramodular hub
genes are likely the key drivers of a given module (Mason et al., 2009). Through this analysis we
detected three transcription factor genes with strong connectivity (> 0.9) to the red module: the
homeodomain protein UMAG_10544, the TEA/ATTS transcription factor UMAG_02835 and the
bHLH transcription factor UMAG_11235 (Figure 7B and 7C; Supplemental Data Set 15). We
also detected rbf1 (UMAG_03172), the central transcriptional regulator downstream of the
bE/bW complex (Heimel et al., 2010b), with a high intramodular connectivity of 0.9 (Figure 7B
and 7C). Rbf1 is responsible for the bE/bW-induced filamentation and cell cycle arrest (Scherer
et al., 2006; Heimel et al., 2010b). The previously observed downregulation of rbf1 after
penetration has been suggested to be a prerequisite to resume the cell cycle after entering the
plant (Heimel et al., 2010a). In line with our prediction of rbf1 as potential driver of the red
module, the previously identified rbf1-induced genes (Heimel et al., 2010b) are highly
overrepresented in the red module (Supplemental Data Set 13). To what extent the other three
transcription factors (UMAG_10544, UMAG_02835 and UMAG_11235, Figure 7C) detected
here drive expression of the red module needs to be investigated.
By the same type of analysis we found hdp2 (UMAG_04928) (Heimel et al., 2010b), biz1
(UMAG_02549) (Flor-Parra et al., 2006) and the two mating type genes bE (UMAG_12052) and
bW (UMAG_00578) (Gillissen et al., 1992) to be the transcription factors with strongest
connectivity to the magenta module, i.e., the second wave of effectors (Figure 7B and
Supplemental Data Set 15). Those transcription factors have previously been suggested to be
the main inducers of early effectors (Heimel et al., 2010b; Lanver et al., 2014). Furthermore, our
analysis suggests UMAG_11658, UMAG_00501, mzr1 (mig2-5 zinc finger regulator1,
UMAG_05804) (Zheng et al., 2008) and UMAG_02104 (Figure 7C) as being involved in early
effector gene expression. They all have a reasonably strong connectivity to the magenta module
of > 0.9 (Figure 7C). Consistently, mzr1 has been demonstrated to be involved in the expression
of several effector genes (Zheng et al., 2008), which we now place in the magenta module
(Supplemental Data Sets 12). However, in contrast to hdp2 and biz1 (Flor-Parra et al., 2006;
20
Heimel et al., 2010b; Lanver et al., 2014), mzr1 is not a major virulence factor (Zheng et al.,
2008), most likely because biz1 and hdp2 can compensate for the lack of mzr1 during infection.
Genes for which induced expression has been observed after artificial overexpression of rbf1
(Heimel et al., 2010b) are not only found in the red module as discussed above, but also in the
magenta module. The latter group includes hdp2, biz1 and 11 potential effectors (Supplemental
Data Sets 6 and 12). In our analysis of intramodular connectivity, which relies solely on the co-
expression of transcription factors and their targets under natural expression conditions, we
were thus unable to identify the contribution of rbf1 to expression of the magenta module.
Overall our analysis delivered those transcription factors which were expected to control early
effectors, and this made us confident that the analysis would also yield promising candidate
transcriptional regulators for the third expression wave of effectors, i.e. the cyan module.
For the cyan module, three potential drivers were identified, UMAG_05601, UMAG_02765 and
UMAG_04778, which have intramodular connectivities of 0.98, 0.97 and 0.96, respectively
(Figure 7B and 7C and Supplemental Data Set 15). In addition, several other transcription
factors (UMAG_05721, UMAG_11138, fox1 (forkhead box 1, UMAG_01523) (Zahiri et al., 2010),
UMAG_06257, UMAG_06308, UMAG_01456) showed intramodular connectivity at slightly lower
values of between 0.9 and 0.93 (Figure 7B and 7C and Supplemental Data Set 15) and were
thus also candidates for transcriptional regulators of the cyan module. Except for fox1 (Zahiri et
al., 2010), none of these transcription factors had so far been functionally analyzed. fox1
mutants displayed reduced virulence, and transcriptional profiling of this mutant revealed a set of
29 potential effector genes which required fox1 for full expression (Zahiri et al., 2010). These
putative fox1 target genes are significantly overrepresented in the cyan module (Supplemental
Data Set 13). This shows that fox1 contributes to the regulation of the cyan module, but
according to our data and the intramodular connectivity analysis (Figure 7B and 7C) fox1 may
not be the main driver of the third wave of effector gene expression.
To analyze a possible contribution of the yet un-characterized potential regulators of the cyan
module to virulence and tumor formation, we picked the APSES type transcription factor gene
UMAG_04778 (Figure 7C and 8A) and generated a targeted knock-out mutant in the compatible
FB1 and FB2 strains. Interestingly, the introduced frame-shift mutation in UMAG_04778 caused
a strong reduction of virulence, with tumor formation in leaves being completely abolished
(Figure 8B). We therefore named the gene nlt1 (no leaf tumors 1). The virulence defect of the
mutants was almost fully complemented by introduction of a single copy of nlt1 into the ip locus

21
of the respective mutant strains (Figure 8B). This links the mutant phenotype to the inactivation
of the nlt1 gene and makes additional off-target effects of Cas9 unlikely. While chlorotic spots
observed at 4 dpi were comparable after infections with nlt1 mutants, wild-type and
complemented strains, the latter two had induced leaf tumors at 8 dpi, while the nlt1 mutant
failed to do so (Figure 8C). Even at 12 dpi when tumors induced by wild-type and complemented
strains had reached their maximum size and started to turn black due to spore formation, no leaf
tumors were detected in infections with the nlt1 mutants (Figure 8B; Supplemental Figure 6A).
Strong anthocyanin formation in leaves infected with nlt1 mutants (Figure 8C) showed that the
mutants were able to successfully establish a biotrophic interaction. Anthocyanin induction
requires expression of the tin2 (tumor inducing 2) effector gene (Tanaka et al., 2014), a gene
placed in the magenta module (Supplemental Data Set 12). nlt1 mutants displayed two
additional phenotypes rarely seen in wild-type infections: death of the 4th or 5th leaf only in
otherwise viable plants in about 25% of the cases (Figure 8B, Supplemental Figure 6A) and late
spore-filled tumors (detected later than 8 dpi) restricted to the base of the stem in about 8% of
the infected plants (Figure 8B; Supplemental Figure 6B), sometimes associated with death of the
4th or 5th leaf. The presence of basal stem tumors in nlt1 mutant infections indicates that the
ability to induce tumors is not completely abolished and can occur in meristematic stem tissue.
We speculate that the dead leaf phenotype and the appearance of late stem tumors may be
connected, i.e., formation of the basal stem tumors may affect the nutrient supply to the 4th or 5th
leaf.
The ability of the nlt1 mutants to establish a biotrophic interaction is in line with our expectations,
i.e., the third effector wave, which we consider being controlled by nlt1, temporally follows the
establishment of biotrophy mediated by the second effector wave. To verify that nlt1 contributes
to the induction of the third wave of effectors, we measured expression of six potential effectors
of the cyan module during plant colonization (2 and 4 dpi) in the nlt1 mutants and compared this
with the expression in wild-type infections. We found that of 4 of the 6 cyan genes chosen were
highly dependent on nlt1 for induction (Figure 9). As a negative control, we included in this
analysis also six effectors of the magenta module, and none of these genes required nlt1 for
expression (Figure 9). These data demonstrate that nlt1 is indeed a driver of the cyan module.
The observation that two of the tested effectors of the cyan module did not show any
dependence of nlt1 suggests a sharp division of labor between nlt1 and the other transcription
factors in the cyan module. Thus, nlt1 likely drives the expression of a specific subset of
effectors in this module. The two Zn2Cys6 proteins UMAG_05601 and UMAG_02765, which are
highly connected to the cyan module (Figure 7C), are interesting candidates for the expression

22
of other subsets of genes of the cyan module. Such a proposed division of labor may also hold
true for transcription factors of the magenta module and this requires experimental clarification.
Recently, the central regulator of spore formation in U. maydis, ros1 (UMAG_05853), has been
identified (Tollot et al., 2016). Ros1 not only induces spore formation but also regulates many
effector genes (Tollot et al., 2016). We identified Ros1 as being part of the cyan module with a
medium high intramodular connectivity of 0.82 (Supplemetal Table 15). Indeed, Ros1-induced
genes are significantly over-represented in the cyan module (p-value = 3.83E-21, Fisher exact
test; Supplemental Data Set 13). However, a substantial number of genes of the cyan module
are also repressed by Ros1 (Supplemental Data Sets 12 and 13). We therefore conclude that
Ros1 may to some extent contribute to the expression of the third wave of effectors, but is
clearly not a driver of this module. We also searched for modules in which Ros1-repressed
genes were significantly over-represented and Ros1-induced genes were significantly under-
represented. Two modules, red and magenta, fulfilled these criteria (p-value < 0.001, Fisher
exact test; Supplemental Data Set 13). Both modules have in common that they are expressed
early upon contact with the plant, corroborating the previous finding that Ros1 is a repressor of
effector genes required early during pathogenic development (Tollot et al., 2016).
Our approach of using intramodular connectivity to identify regulators of effector gene
expression has identified three sets of transcription factors likely responsible for the plant-
associated expression of the secretome. The first and second sets of transcription factors largely
consist of components of the b-cascade. This corroborates previous studies that emphasized the
impact of the b-cascade for early pathogenic development and the establishment of biotrophy
(Brachmann et al., 2001; Heimel et al., 2010b; Lanver et al., 2014). The third set of transcription
factors that we identified here consists mainly of yet un-characterized genes. It will be an
interesting future task to study the contribution of these transcription factors to the expression of
the third wave of effectors, which is expected to fulfill virulence functions after the early
biotrophic phases have been established. Studying in detail which effector groups are regulated
by these transcription factors and linking this information with the physiology of plants infected
by the respective transcription factor mutants could be a key to identifying novel, host-
manipulating fungal strategies that go beyond suppression of the plant immune system.
This large-scale transcriptome analysis has provided a detailed temporal view of gene
expression in U. maydis throughout its biotrophic life cycle. The analysis has allowed us to
formulate novel hypotheses concerning fungal nutrition in the plant environment, and to visualize
the deployment of certain groups of secreted effectors as well as connected transcription factors

23
during discrete stages of colonization. This is expected to fuel, stimulate and direct future
functional studies of the identified U. maydis genes, as well as provide a new resource for
comparative studies in related fungal pathogens.

24
Methods
Bacterial and fungal strains and growth conditions
The Escherichia coli strain Top10 (Life technologies) was used for cloning purposes. U. maydis
strains used in this study are listed in Supplemental Data Set 16. They are derived from haploid
strains FB1 and FB2 (Banuett and Herskowitz, 1989). DNA from the solopathogenic strain
SG200, which was derived from FB1 (Kamper et al., 2006) was used for gene ampflications. U.
maydis strains were grown in liquid YEPSL (0.4% yeast extract, 0.4% peptone, 2% sucrose) at
28°C on a rotary shaker at 200 rpm. To assess the ability of compatible strains to mate and form
dikaryotic hyphae, FB1 and FB2 wild-type strains and the respective mutants were grown in
YEPSL to an OD600 of approximately 1, harvested by centrifugation (1700g, 10 min at room
temperature), and resuspended in water to an OD600 of 1. Compatible strains were mixed in a
1:1 ratio and 4 µl of this mixture was spotted on potato dextrose plates containing 1% (w/v)
activated charcoal. The plates were incubated at room temperature for 48 hours. Strains which
have mated produce dikaryotic hyphae, visible as white mycelium against the black background.
To test growth of haploid U. maydis strains on different nitrogen sources, FB1 and FB2 wild-type
strains and the respective dur3-1,2,3 triple mutants were grown in YEPSL to an OD600 of
approximately 1, harvested by centrifugation (1700g, 10 min at room temperature), washed two
times with water and resuspended in water to an OD600 = 1. Serial dilutions (OD600=1 to 10-4)
were prepared in water and 2.5 µl of each dilution was spotted on minimal medium plates
(Holliday, 1961), supplemented with 2% glucose and either 10 mM ammonium or 10 mM or 1
mM urea. The plates were incubated for three days at 28°C.
Plasmid and strain construction
All strains generated in this study, plasmids, primers and double stranded DNA fragments are
listed in Supplemental Data Sets 16 to 19. To generate U. maydis mutants, the recently
established CRISPR-Cas9 multiplex system was used (Schuster et al., 2017). The non-
integrative, self-replicating backbone plasmids of this system, pDL272 and pMS73, contain cas9
either under the control of the strong constitutive otef promoter (pDL272) or under control of the
even stronger hsp70 promoter (pMS73). All target sequences for the guideRNA constructs were

25
designed using the E-CRISP tool (www.e-crisp.org) (Heigwer et al., 2014) with medium
stringency settings. pDL272 and pMS73 contain one copy of the U6 promoter for fusion with the
first guide RNA construct. Additional guide RNA constructs are then fused to distinct tRNA
promoters, and all components are finally cloned into one single plasmid (Schuster et al.,
2017).This yielded the plasmids described below.
To generate the plasmid pDL286 for inactivation of the three opt genes, UMAG_11057,
UMAG_05968 and UMAG_02387, the respective double stranded DNA fragments fDL12, fDL13
and fDL14 listed in Supplemental Data Set 18 were synthesized (gBLOCKs from IDT; Coralville,
USA) and cloned into Acc65I-linearized pDL272 using isothermal assembly (Gibson et al.,
2009). To generate the plasmid pDL287 for inactivation of the three urea transporters
UMAG_02625, UMAG_04577 and UMAG_06253, the respective double stranded DNA
fragments fDL15, fDL16 and fDL17 were synthesized and cloned into Acc65I-linearized pMS73.
As the resulting plasmid proved inefficient for inactivation of all three genes except in strain
PH72, a second plasmid, pPH22 was generated which is identical to pDL287 but contains new
target sequences for the inactivation of UMAG_02625 and UMAG_06253. To this end fPH1 and
fPH2 were generated by PCR using oPH163 and oPH160 as primers on gBLOCK fDL15, and
oPH161 and oPH162 as primers on gBLOCK fDL16 (Supplemental Data Sets 17 and 18).
pPH22 was then assembled by Gibson cloning using fPH1, fPH2 , fDL17 and Acc65I-linearized
pMS73. To generate the plasmid pPH20 for inactivation of the transcription factor gene
UMAG_04778, the double stranded fragment fPH3 listed in Supplemental Data Set 18 was
generated by PCR with primers oPH137 and oPH138 using gBLOCK fDL17 as template. This
fragment was cloned via Gibson assembly into Acc65I-linearized pMS73 to yield the final
plasmid.
For complementation analysis we made use of the genome integrative p123 plasmid (Aichinger
et al., 2003). To generate the plasmid for complementation of the opt triple mutant, plasmid
pPH19 was constructed. UMAG_11057 was amplified from genomic DNA of SG200 using
primers oPH131 and oPH132, UMAG_02387 was amplified using primers oPH133 and oPH134,
and UMAG_05968 was amplified using primers oPH135 and oPH136. The three fragments were
inserted into the backbone of p123 cleaved with Acc65I and EcoRV. In pPH19 all three genes
carry their native promoters and termination regions. The plasmid was linearized with SspI prior
to transformation in U. maydis.

26
To generate the plasmid for complementation of the nlt1 mutant, pPH23 was generated. To this
end the nlt1gene was amplified from SG200 DNA with primers oPH164 and oPH165. The
amplified fragment was Gibson assembled into the backbone of p123 cleaved with Acc65I and
EcoRV. In pPH23, nlt1 is driven by its native promoter and termination region. The plasmid was
linearized with PsrI prior to transformation.
For the generation of U. maydis strains carrying fluorescence reporter constructs we constructed
the following integrative plasmids based on the backbone of p123. To place mcherry under the
control of the actin promoter we amplified 2.0 kb of the promoter of the U. maydis actin gene
(UMAG_11232) using primers oDL575 and oDL576. The product was digested with HindIII and
NcoI and subjected to a three fragment ligation with a 0.9 kb NcoI/NsiI mcherry fragment from
pMF5-15g (plasmid collection of M. Feldbrügge; www.mikrobiologie.hhu.de/ustilago-community)
and the HindIII/NsiI digested p123 plasmid backbone yielding pPact-mcherry (pDL252). The
mcherry fragment of pPact-mcherry was replaced with a 0.9 kb NcoI/NsiI gfp fragment from
p123 to generate pPact-gfp (pDL289). To place gfp under the control of effector promoters, we
amplified 1.5 kb of the promoter of pep1 (UMAG_01987), and 0.6 kb of the promoter of stp1
(UMAG_02475) using primer pairs oDL746/oDL747 and oDL744/oDL745, respectively. In
addition, we amplified a gfp-Tnos fragment with the primers oDL742 and oDL743 using p123 as
template. The gfp-Tnos fragment, the respective effector promoter fragment, and the HindIII
linearized pPact-mcherry plasmid were Gibson assembled to yield pPact-mcherry-Ppep1-gfp
(pDL281) and pPact-mcherry-Pstp1-gfp (pDL290). The plasmids containing fluorescence
reporter constructs were linearized with AgeI prior to transformation.
Transformation of U. maydis was performed as described previously (Schulz et al., 1990), and
the transformants were selected on carboxin containing media (2 µg / ml). To identify strains
carrying Cas9-induced mutations, we followed the established screening protocol (Schuster et
al., 2017). The respective loci were amplified and sequenced with gene-specific primers
(Supplementary Table 14). The stable integration of p123-based plasmids was verified by
Southern blot as described previously (Loubradou et al., 2001). All complementation plasmids
were integrated in single copy into the U. maydis ip locus. Fluorescence reporter constructs
were integrated in multiple copies (> 3) into the ip locus.
Plant infections and collection of samples
For the transcriptional profiling, the compatible haploid strains FB1 and FB2 were grown
separately in YEPSL to an OD600 of 1.0. Cells were collected by centrifugation (5 min at 1250g at
27
room temperature) and resuspended in the original volume of sterile water. Compatible strains
were mixed in equal amounts prior to injection into six-day-old maize seedlings of the variety
Early Golden Bantam (UrbanFarmers, New York City, USA) as described previously (Tollot et
al., 2016). The plants were kept in growth chambers (Percival AR95-HIL) with a 16 h light (30
kLux) / 8 h dark cycle, with 28°C / 20°C and 40% / 60% humidity. To generate biological
replicates three plant infections were performed with independently cultivated fungal strains on
different days. For each replicate more than 100 plants were infected with a mixture of
compatible wild-type strains and the same number of plants was mock infected with water.
Samples of ten infected maize seedlings were collected at 0.5, 1, 2, 4, 6, 8, 10 and 12 days post
infection (dpi). For early time points, where symptoms are not yet visible (0.5, 1 and 2 dpi) 2 cm
sections of leaf blade of the 2nd and 3rd leaf were excised 0.5 cm below the infection holes.
These areas were shown by microscopy to be colonized at these time points. At later time points
(4, 6, 8 and 12 dpi) all visibly infected areas, including the leaf blades to approx. 1 cm below the
injection holes on the 2nd, 3rd and 4th leaf and the attached leaf sheets were harvested. At each
time point comparable parts of seedlings were harvested for the mock infected control plants.
For each sample the collected material from ten different plants was pooled, immediately frozen
in liquid nitrogen and stored at -80°C. For the axenic culture samples, FB1 and FB2 cells
separately grown in YEPSL to an OD600 of 1.0 in three independent biological replicates were
harvested by centrifugation (5 min at 3000 g), directly frozen in liquid nitrogen and stored at -
80°C until RNA extraction.
All virulence assays were performed in the greenhouse under controlled conditions with a light-
dark cycle of 28 °C for 14 hours and 20 °C for 10 hours. During the day phase, the illumination
intensity was at least 25 kLux - 30 kLux (with additional sunlight up to 90 kLux). U. maydis was
grown and injected into 6-day-old maize plants as described above. Except for nlt1 mutants the
OD600 of the injected suspension for virulence assays was adjusted to 1.0. To assess virulence
of nlt1 mutants and respective wild-type strains the OD600 was adjusted to 0.2. Virulence
symptoms were scored 12 days post infection using the disease rating scheme developed
previously (Kamper et al., 2006). When scoring disease symptoms of infections with nlt1
mutants, two new disease categories were introduced. Hatched was a category where plants
developed late tumors at the base of the stem only, sometimes associated with death of the 4th
or 5th leaf, as well as a category where only the 4th or 5th leaf died in otherwise healthy maize
seedlings (see Supplemental Figure 6 for examples).

28
RNA extraction and sequencing
Pooled plant material corresponding to individual samples was ground to a fine powder in liquid
nitrogen using a Retsch CryoMill (Retsch GmbH, Haan, Germany) with a 50 ml grinding beaker
and a 20 mm grinding ball. For each sample, the machine was precooled for 30 s followed by 60
s of grinding at 20 Hz. Approx. 500 mg of powder was resuspended in 1 ml TRIzol reagent (Life
Technologies) and total RNA was extracted according to the manufacturer’s recommendation.
For RNA extraction from U. maydis derived from axenic culture, glass beads (0.4–0.6 mm)
together with 1 ml of TRIzol reagent (Life Technologies) were added to the frozen cell pellet
followed by vigorous shaking (IKA Vibrax VXR, 2000 rpm, 10 min) and further processing. To
eliminate genomic DNA contamination, the Ambion Turbo DNA-free Kit (Life Technologies) was
used. The total RNA was further purified using the RNeasy Mini Kit (Qiagen, Hilden, Germany)
and subjected to quality control with an Agilent 2100 Bioanalyzer according to the instructions of
the Agilent RNA 6000 Nano Assay Protocol. Libraries were prepared using the Illumina®
TruSeq® stranded RNA sample preparation Kit and 1 µg of total RNA as input. After poly-A
selection (using poly-T oligo-attached magnetic beads), mRNA was purified and fragmented
using divalent cations under elevated temperature. The RNA fragments underwent reverse
transcription using random primers. This was followed by second strand cDNA synthesis with
DNA Polymerase I and RNase H. After end repair and A-tailing, indexing adapters were ligated.
The products were then purified and amplified (14 PCR cycles, 10 µl template) to create the final
cDNA libraries. After library validation and quantification (Agilent 2100 Bioanalyzer), up to 6
libraries were pooled. Pools were quantified using the Peqlab KAPA Library Quantification Kit
and the Applied Biosystems 7900HT Sequence Detection System. One pool per lane was
sequenced using an Illumina TruSeq PE Cluster Kit v3 and an Illumina TruSeq SBS Kit v3-HS
on an Illumina HiSeq 2000 sequencer with a paired- end (101x7x101 cycles) protocol. The raw
data have been deposited in the NCBI Gene Expression Omnibus (Edgar et al., 2002) and are
accessible through GEO Series accession number GSE103876
(https://www.ncbi.nlm.nih.gov/geo/query/acc.cgi?acc=GSE103876).
Read mapping, normalization and statistical analysis of differential gene expression
All reads were imported into CLC genomics workbench (v8.5) and quality-filtered to keep only
sequences with PhredScores higher than 20 (quality limit 0.01). The reads were trimmed for the
presence of TruSeq adapters and, according to a FastQC quality control, 12 nucleotides at the 5’

29
end were statically removed. Reads smaller than 50 nucleotides were discarded. The paired end
reads were merged to single reads, if the overlap was more than 10 nucleotides. Depending on
the sample, reads from different sequencing runs (but from the same Truseq libraries) were
pooled. For the axenic culture samples, the separately generated reads from FB1 and FB2
strains were pooled and analyzed in one batch. All reads were filtered against the annotated
maize genes (90% identity over 80% of the sequence) and all un-mapped reads were then
mapped against the annotated U. maydis genes (80% identity over 60% of the sequence). For
expression analysis, only uniquely mapping exon read counts were considered. Since highly
expressed genes make up a substantial fraction of the total library, causing the remaining genes
to be under-sampled and possibly making them falsely appear to be down-regulated in that
sample, it is important to normalize for the library composition. We chose to normalize our data
set using the relative log expression (RLE) method implemented in the DESeq2 package (v1.10)
(Love et al., 2014) in R (www.r-project.org). Alternatively we used the trimmed mean of M-values
(TMM) method implemented in the EdgeR package (v3.12) (Robinson et al., 2010; Robinson
and Oshlack, 2010). Both methods are very efficient in normalizing for library composition effects
(Dillies et al., 2013). Pairwise comparisons were made with EdgeR and DESeq2 using the
conditional maximum likelihood (qCML) method and the Cox-Reid profile-adjusted likelihood
(CR) method, respectively. In both analyses, genes with a log2 fold change > 0.5 and Benjamini
and Hochberg-adjusted pvalue < 0.01 were considered differentially expressed (Eisen et al.,
1998). All count data have been deposited in NCBI's Gene Expression Omnibus (Edgar et al.,
2002) and are accessible through GEO Series accession number GSE103876
(https://www.ncbi.nlm.nih.gov/geo/query/acc.cgi?acc=GSE103876). This also includes all count
data mapped to the Z. mays genome, which are not discussed here.
Co-expression analysis
For the unsupervised weighted gene co-expression analysis (WGCNA) analysis, only genes that
have at least for one time point over all three replicates a DESeq2-normalized read count of at
least 10 were considered. 6421 genes passed these filtering criteria. Log2-transformed DESeq2-
normalized counts then served as input for the network analysis. We used the function
blockwiseModules, implementetd in the R (www.r-project.org) WGCNA package (v1.51)
(Langfelder and Horvath, 2008), to create a signed network of a Pearson correlated matrix. All
genes were treated in a single block. The signed network ensured that only positive correlations
were considered. We have chosen a soft power threshold of 7 because this was the lowest
30
power needed to reach scale-free topology (R2 of = 0.92). Module detection was performed with
default settings (mergeCutHeight of 0.15 and enabled PAMstage). The minimal module size was
set to 25 genes. After module detection, highly correlated modules were merged using a
cutheight of 0.3. This step reduced the number of modules from 22 to 14 (Supplemental Figure
4). For each module, the expression profile of the module eigengene was calculated, which is
defined as the first principal component of the module’s expression data. For each gene, the
intramodular connectivity (kME) was calculated, which represents Pearson correlation of the
individual gene with the respective module eigengenes. To visualize weighted co-expression
networks, the topological overlap matrix was exported to Cytoscape (v3.3) (Shannon et al.,
2003) with an adjacency cutoff of < 0.2. k-mean clustering was carried out in MeV (v4.9)
(http://mev.tm4.org) using the same DESeq2 normalized and log2 transformed expression data
set that was used for the WGCNA analysis (see above). To determine a suitable number of
clusters we used the Figure of Merit (FOM) analysis, and chose to cluster the genes into six
clusters. The k-mean clusters were completed after 20 iterations using Pearson correlation as
distance measure. Average linkage hierarchical clustering of individual modules and gene sets
was performed with Cluster (v3.0) (Eisen et al., 1998) and heatmaps were visualized with Java
Treeview (v1.1.6).
Gene ontology term enrichment analysis
GO term enrichment analysis (Ashburner et al., 2000; The Gene Ontology, 2017) was performed
with the GOseq package (v1.22) (Young et al., 2010) in R (www.r-project.org) using
hypergeometric testing and an over-represented p-value cutoff of < 0.005. For the enrichment
analysis of the individual modules only genes were considered which had an intramodular
connectivity (kME) of greater than 0.5. Visualization of GO term networks was performed with
the Cytoscape Enrichment Map plugin (v2.1; www.baderlab.org/Software/EnrichmentMap)
(Merico et al., 2010) using a Jaccard coefficient cutoff of > 0.2. Clusters of gene sets were
manually marked and named according to their GO annotation using the Cytoscape Word Cloud
plugin (v3.1).
Reverse transcription quantitative PCR and quantitative real-time PCR

31
For gene expression analysis via RT-qPCR, plants were infected with the indicated strains
adjusted to a cell density at OD600 of 1.0. Then, 1–2 µg of isolated total RNA was reverse-
transcribed with oligo dT primers using First-Strand Super Script III cDNA Synthesis Kit (Life
Technologies). Per RT-qPCR reaction, cDNA derived from 10–50 ng RNA was deployed. The RT-
qPCR was performed in a Bio-Rad iCycler using SYBR Green RT-qPCR SuperMix-UDG (Life
Technologies). Cycling conditions were 1 min 30 s at 95°C, followed by 45 cycles of 15 s at 95°C,
30 s at 60°C and 30 s at 72°C. Primers are listed in Supplemental Data Set 17. Two control genes
were used: the previously established peptidylprolyl isomerase (ppi) UMAG_03726 plus the rab7
GTPase UMAG_05511, which was according to the dataset created here one of the most
constantly expressed genes (coefficient of variation of 14.2). The arithmetic mean of the two
reference Ct values served as normalization. For the expression of fold changes of RT-qPCR
data, the 2-DDCt method was used (Livak and Schmittgen, 2001).
To determine fungal biomass, the same plant material that was used for the RNAseq analysis was
utilized. DNA was extracted from the ground powder using a phenol-based protocol (Hoffman and
Winston, 1987). Then, 150 ng total DNA was subjected to qPCR (quantitative real-time PCR)
analysis with plant-specific GAPDH (oDL833/oDL834) and fungal specific ppi primer pairs
(oPH231/oPH232) Supplemental Data Set 14), and the ratios of fungal DNA to plant DNA (2-ΔCt)
were calculated for each sample. This analysis allowed us to relate for each sample the number
of fungal transcripts to the amount of fungal DNA.
Microscopy
To visualize fungal aggregates in tumor tissue, 7 dpi tumors were collected and thin slices of the
tumors were prepared using a razor blade. The slices were analyzed by a TCS-SP5 confocal
microscope (Leica Microsystems). GFP was excited at 488 nm and emitted fluorescence was
detected at 495–530 nm. mCherry was excited at 561 nm and emission was detected at 580–
630 nm. Images were processed using LAS-AF software (Leica Microsystems).
Accession numbers, genome references and annotations
The Z. mays reference genome was downloaded from Ensembl
(http://plants.ensembl.org/info/website/ftp/index.html, Zea_mays.AGPv3.28.dna.toplevel). The U.
maydis reference genome was downloaded from NCBI
(www.ncbi.nlm.nih.gov/www.ncbi.nlm.nih.gov, accession numbers NC_026478.1 -
NC_026500.1, NW_011929455.1 - NW_011929458.1, NC_008368.1). Gene ontology categories
32
and InterPro motifs of U. maydis genes were extracted from the pedant database
(http://pedant.helmholtz-muenchen.de/). Membrane transport proteins were defined by filtering
the InterPro annotation of U. maydis for any of the following keywords: porter, porting, P-type
ATPase, facilitator, permease, channel, aquaporin. Secreted hydrolases were classified by
searching the InterPro descriptions of the 467 secreted proteins for the key words hydrolase,
protease, peptidase, nuclease, lipase, esterase, lyase, hydrolysis, glucanase and lytic.
Carbohydrate active enzymes (CAZymes) were categorized according to the CAZy database
(http://www.cazy.org/www.cazy.org). CAZymes potentially affecting the plant cell wall were
defined previously (Lo Presti et al., 2015). To identify and classify U. maydis transcription factors
we used a previously defined list of 82 InterPro signatures known to be involved in fungal
transcriptional regulation (Park et al., 2008), and supplemented this list with the InterPro
signatures IPR001092, IPR011598 representing bHLH and IPR018608 representing WOPR
transcription factors, respectively. The InterPro annotation of U. maydis was then filtered for the
presence of any of those 85 signatures. The RNA-sequencing data are available in the Gene
Expression Omnibus (GEO) database under the accession number GSE103876.

33
Supplemental Data
Supplemental Figure 1. Correlation between amount of fungal transcripts and fungal biomass
Supplemental Figure 2. Correlation between RNAseq and RT-qPCR derived expression data
Supplemental Figure 3. Detection of gene co-expression modules of U. maydis during pathogenic development
Supplemental Figure 4. Enriched biological processes in co-expression modules
Supplemental Figure 5. Expression of GFP under control of the actin promoter in fungal aggregates
Supplemental Figure 6. Disease categories specific to infections with nlt1 mutants
Supplemental Data Set 1: Overview of read counts mapping to U. maydis and Z. mays
Supplemental Data Set 2: Statistics of changes of fungal biomass based on DNA and
transcripts
Supplemental Data Set 3: DESeq2-normalized U. maydis read counts
Supplemental Data Set 4: Differentially expressed U. maydis genes throughout the infection
Supplemental Data Set 5: Overlap between differentially expressed gene sets identified by
DESeq2 and EdgeR
Supplemental Data Set 6: Gene co-expression modules of U. maydis and intramodular
connectivies of the genes
Supplemental Data Set 7: Overlap between modules detected by WGCNA and clusters
detected by k-mean clustering
Supplemental Data Set 8: GO-term enrichment analysis of co-expression modules
Supplemental Data Set 9: Expression of primary metabolism pathways

34
Supplemental Data Set 10: Expression of autophagy, glycosylation and ER-quality control
pathways
Supplemental Data Set 11: Expression of membrane transporters
Supplemental Data Set 12: Expression of the secretome
Supplemental Data Set 13: Enrichment of diverse gene sets in co-expression modules
Supplemental Data Set 14: Expression of secondary metabolism pathways
Supplemental Data Set 15: Intramodular connectivities of transcription factors with co-
expression modules
Supplemental Data Set 16: U. maydis strains used in this study
Supplemental Data Set 17: Oligonucleotides used in this study
Supplemental Data Set 18: Double stranded DNA fragments used in this study
Supplemental Data Set 19: Plasmids used in this study
Acknowledgements
We are grateful to Armin Djamei and Florian Raths for providing preliminary results on U. maydis
oligopeptide transporters. We thank Michael Bölker for sharing his interpretation of fungal growth
within tumors. We acknowledge Nicole Ludwig for helping with sampling of infected plant
material. We thank Kai Heimel for listing U. maydis UPR components and Gertrud Mannhaupt
and Ulrich Güldener for providing gene annotations. We enjoyed helpful discussions with Frank
Hochholdinger and Kristian K. Ullrich and all members of the Kahmann group. This work was
supported by generous funds from the Max Planck Society.

35
Author Contributions
R.K. conceived the project; A.M. planned and conducted plant infections and generated samples
for RNAseq analysis; M.F. and J.A. performed RNA sequencing; D.L. and G.S. performed data
analysis; F.B.H. and S.A.R. provided critical input in data analysis and quality control; P.H. and
D.L. generated mutants; P.H. performed RT-qPCR analyses and virulence assays; A.M. and
C.P. contributed to the finalization of the dataset; D.L. and R.K. led the study and wrote the
manuscript with help from S.R.

36
References
Abreu, C., Sanguinetti, M., Amillis, S., and Ramon, A. (2010). UreA, the major urea/H+ symporter in Aspergillus nidulans. Fungal genetics and biology : FG & B 47, 1023-1033.
Aichinger, C., Hansson, K., Eichhorn, H., Lessing, F., Mannhaupt, G., Mewes, W., and Kahmann, R. (2003). Identification of plant-regulated genes in Ustilago maydis by enhancer-trapping mutagenesis. Molecular genetics and genomics : MGG 270, 303-314.
Ashburner, M., Ball, C., Blake, J., Botstein, D., Butler, H., Cherry, M., Davis, A., Dolinski, K., Dwight, S., Eppig, J., Harris, M., Hill, D., Issel-Tarver, L., Kasarskis, A., Lewis, S., Matese, J., Richardson, J., Ringwald, M., Rubin, G., and Sherclock, G. (2000). Gene Ontology: tool for the unification of biology. Nature Genetics 25, 25-29.
Ballini, E., Nguyen, T.T., and Morel, J.B. (2013). Diversity and genetics of nitrogen-induced susceptibility to the blast fungus in rice and wheat. Rice (N Y) 6, 32.
Banuett, F., and Herskowitz, I. (1989). Different a alleles of Ustilago maydis are necessary for maintenance of filamentous growth but not for meiosis. Proceedings of the National Academy of Sciences of the United States of America 86, 5878-5882.
Basse, C., Lottspeich, F., Steglich, W., and Kahmann, R. (1996). Two potential indole-3-acetaldehyde dehydrogenases in the phytopathogenic fungus Ustilago maydis. The FEBS Journal 242, 648-656.
Billet, E.E., and Burnett, J.H. (1978). The host-parasite physiology of the maize smut fungus Ustilago maydis. 11. Translocation of 14C-labelled assimilates in smutted maize plants. Plant Pathol. 12, 102-112.
Bolker, M., Urban, M., and Kahmann, R. (1992). The a mating type locus of U. maydis specifies cell signaling components. Cell 68, 441-450.
Bourbouloux, A., Shahi, P., Chakladar, A., Delrot, S., and Bachhawat, A. (2000). Hgt1p, a high affinity glutathione transporter from the yeast Saccharomyces cerevisiae. The Journal of Biological Chemistry 275, 13259-13265.
Brachmann, A., Weinzierl, G., Kamper, J., and Kahmann, R. (2001). Identification of genes in the bW/bE regulatory cascade in Ustilago maydis. Molecular microbiology 42, 1047-1063.
Castanheira, S., Mielnichuk, N., and Perez-Martin, J. (2014). Programmed cell cycle arrest is required for infection of corn plants by the fungus Ustilago maydis. Development 141, 4817-4826.
Chague, V., Maor, R., and Sharon, A. (2009). CgOpt1, a putative oligopeptide transporter from Colletotrichum gloeosporioides that is involved in responses to auxin and pathogenicity. BMC microbiology 9, 173.
Chen, X.L., Shi, T., Yang, J., Shi, W., Gao, X., Chen, D., Xu, X., Xu, J.R., Talbot, N.J., and Peng, Y.L. (2014). N-glycosylation of effector proteins by an alpha-1,3-mannosyltransferase is required for the riceblast fungus to evade host innate immunity. The Plant cell 26, 1360-1376.
Conway, M.K., Grunwald, D., and Heideman, W. (2012). Glucose, nitrogen, and phosphate repletion in Saccharomyces cerevisiae: common transcriptional responses to different nutrient signals. G3 2, 1003-1017.
Copley, T.R., Duggavathi, R., and Jabaji, S. (2017). The transcriptional landscape of Rhizoctonia solani AG1-IA during infection of soybean as defined by RNA-seq. PloS one 12, e0184095.
Dean, R., Van Kan, J.A., Pretorius, Z.A., Hammond-Kosack, K.E., Di Pietro, A., Spanu, P.D., Rudd, J.J., Dickman, M., Kahmann, R., Ellis, J., and Foster, G.D. (2012). The Top 10 fungal pathogens in molecular plant pathology. Molecular plant pathology 13, 414-430.
Dillies, M.A., Rau, A., Aubert, J., Hennequet-Antier, C., Jeanmougin, M., Servant, N., Keime, C., Marot, G., Castel, D., Estelle, J., Guernec, G., Jagla, B., Jouneau, L., Laloe, D., Le Gall, C., Schaeffer, B., Le Crom, S., Guedj, M., Jaffrezic, F., and French StatOmique, C. (2013). A comprehensive

37
evaluation of normalization methods for Illumina high-throughput RNA sequencing data analysis. Briefings in bioinformatics 14, 671-683.
Divon, H.H., and Fluhr, R. (2007). Nutrition acquisition strategies during fungal infection of plants. FEMS Microbiol Lett 266, 65-74.
Divon, H.H., Ziv, C., Davydov, O., Yarden, O., and Fluhr, R. (2006). The global nitrogen regulator, FNR1, regulates fungal nutrition-genes and fitness during Fusarium oxysporum pathogenesis. Molecular plant pathology 7, 485-497.
Djamei, A., Schipper, K., Rabe, F., Ghosh, A., Vincon, V., Kahnt, J., Osorio, S., Tohge, T., Fernie, A.R., Feussner, I., Feussner, K., Meinicke, P., Stierhof, Y.D., Schwarz, H., Macek, B., Mann, M., and Kahmann, R. (2011). Metabolic priming by a secreted fungal effector. Nature 478, 395-398.
Dobon, A., Bunting, D.C., Cabrera-Quio, L.E., Uauy, C., and Saunders, D.G. (2016). The host-pathogen interaction between wheat and yellow rust induces temporally coordinated waves of gene expression. BMC genomics 17, 380.
Doehlemann, G., Reissmann, S., Assmann, D., Fleckenstein, M., and Kahmann, R. (2011). Two linked genes encoding a secreted effector and a membrane protein are essential for Ustilago maydis-induced tumour formation. Molecular microbiology 81, 751-766.
Doehlemann, G., Wahl, R., Vranes, M., de Vries, R.P., Kamper, J., and Kahmann, R. (2008a). Establishment of compatibility in the Ustilago maydis/maize pathosystem. J Plant Physiol 165, 29-40.
Doehlemann, G., van der Linde, K., Assmann, D., Schwammbach, D., Hof, A., Mohanty, A., Jackson, D., and Kahmann, R. (2009). Pep1, a secreted effector protein of Ustilago maydis, is required for successful invasion of plant cells. PLoS pathogens 5, e1000290.
Doehlemann, G., Wahl, R., Horst, R.J., Voll, L.M., Usadel, B., Poree, F., Stitt, M., Pons-Kuhnemann, J., Sonnewald, U., Kahmann, R., and Kamper, J. (2008b). Reprogramming a maize plant: transcriptional and metabolic changes induced by the fungal biotroph Ustilago maydis. The Plant journal : for cell and molecular biology 56, 181-195.
Dong, Y., Li, Y., Zhao, M., Jing, M., Liu, X., Liu, M., Guo, X., Zhang, X., Chen, Y., Liu, Y., Ye, W., Zhang, H., Wang, Y., Zheng, X., Wang, P., and Zhang, Z. (2015). Global genome and transcriptome analyses of Magnaporthe oryzae epidemic isolate 98-06 uncover novel effectors and pathogenicity-related genes, revealing gene gain and lose dynamics in genome evolution. PLoS pathogens 11, e1004801.
Dordas, C. (2008). Role of nutrients in controlling plant diseases in sustainable agriculture. Agronomy for Sustainable Development 28, 33-46.
Dunkel, N., Hertlein, T., Franz, R., Reuss, O., Sasse, C., Schäfer, T., Ohlsen, K., and Morschhäuser, J. (2013). Roles of Different Peptide Transporters in Nutrient Acquisition in Candida albicans. Eukaryotic cell 12, 520-528.
Edgar, R., Domrachev, M., and Lash, A.E. (2002). Gene Expression Omnibus: NCBI gene expression and hybridization array data repository. Nucleic acids research 30, 207-210.
Eisen, M.B., Spellman, P.T., Brown, P.O., and Botstein, D. (1998). Cluster analysis and display of genome-wide expression patterns. Proceedings of the National Academy of Sciences of the United States of America 95, 14863-14868.
ElBerry, H.M., Majumdar, M.L., Cunningham, T.S., Sumrada, R.A., and Cooper, T.G. (1993). Regulation of the urea active transporter gene (DUR3) in Saccharomyces cerevisiae. Journal of Bacteriology 175, 4688-4698.
Fernandez-Alvarez, A., Elias-Villalobos, A., and Ibeas, J.I. (2009). The O-mannosyltransferase PMT4 is essential for normal appressorium formation and penetration in Ustilago maydis. The Plant cell 21, 3397-3412.

38
Fernandez-Alvarez, A., Elias-Villalobos, A., Jimenez-Martin, A., Marin-Menguiano, M., and Ibeas, J.I. (2013). Endoplasmic reticulum glucosidases and protein quality control factors cooperate to establish biotrophy in Ustilago maydis. The Plant cell 25, 4676-4690.
Fernandez-Alvarez, A., Marin-Menguiano, M., Lanver, D., Jimenez-Martin, A., Elias-Villalobos, A., Perez-Pulido, A.J., Kahmann, R., and Ibeas, J.I. (2012). Identification of O-mannosylated virulence factors in Ustilago maydis. PLoS pathogens 8, e1002563.
Flor-Parra, I., Vranes, M., Kamper, J., and Perez-Martin, J. (2006). Biz1, a zinc finger protein required for plant invasion by Ustilago maydis, regulates the levels of a mitotic cyclin. The Plant cell 18, 2369-2387.
Fluharty, A.L., and O'Brien, J.S. (1969). A mannose- and erythritol-containing glycolipid from Ustilago maydis. Biochemistry 8, 2627-2632.
Fondevilla, S., Krezdorn, N., Rotter, B., Kahl, G., and Winter, P. (2015). In planta Identification of Putative Pathogenicity Factors from the Chickpea Pathogen Ascochyta rabiei by De novo Transcriptome Sequencing Using RNA-Seq and Massive Analysis of cDNA Ends. Frontiers in microbiology 6, 1329.
Gao, L., Kelliher, T., Nguyen, L., and Walbot, V. (2013). Ustilago maydis reprograms cell proliferation in maize anthers. The Plant journal : for cell and molecular biology 75, 903-914.
Garnica, D.P., Upadhyaya, N.M., Dodds, P.N., and Rathjen, J.P. (2013). Strategies for Wheat Stripe Rust Pathogenicity Identified by Transcriptome Sequencing. PloS one 8, e67150.
Gasch, A.P., Spellman, P.T., Kao, C.M., Carmel-Harel, O., Eisen, M.B., Storz, G., Botstein, D., and Brown, P.O. (2000). Genomic expression programs in the response of yeast cells to environmental changes. Mol Biol Cell 11, 4241-4257.
Gervais, J., Plissonneau, C., Linglin, J., Meyer, M., Labadie, K., Cruaud, C., Fudal, I., Rouxel, T., and Balesdent, M.H. (2016). Different waves of effector genes with contrasted genomic location are expressed by Leptosphaeria maculans during cotyledon and stem colonization of oilseed rape. Molecular plant pathology.
Gibson, D.G., Young, L., Chuang, R.Y., Venter, J.C., Hutchison, C.A., 3rd, and Smith, H.O. (2009). Enzymatic assembly of DNA molecules up to several hundred kilobases. Nature methods 6, 343-345.
Gillissen, B., Bergemann, J., Sandmann, C., Schroeer, B., Bolker, M., and Kahmann, R. (1992). A two-component regulatory system for self/non-self recognition in Ustilago maydis. Cell 68, 647-657.
Hacquard, S., Kracher, B., Maekawa, T., Vernaldi, S., Schulze-Lefert, P., and Ver Loren van Themaat, E. (2013). Mosaic genome structure of the barley powdery mildew pathogen and conservation of transcriptional programs in divergent hosts. Proceedings of the National Academy of Sciences of the United States of America 110, E2219-2228.
Hampel, M., Jakobi, M., Schmitz, L., Meyer, U., Finkernagel, F., Doehlemann, G., and Heimel, K. (2016). Unfolded Protein Response (UPR) Regulator Cib1 Controls Expression of Genes Encoding Secreted Virulence Factors in Ustilago maydis. PloS one 11, e0153861.
Hartmann, T., Cairns, T.C., Olbermann, P., Morschhauser, J., Bignell, E.M., and Krappmann, S. (2011). Oligopeptide transport and regulation of extracellular proteolysis are required for growth of Aspergillus fumigatus on complex substrates but not for virulence. Molecular microbiology 82, 917-935.
Haskins, R.H., and Thorn, J.A. (1951). Biochemistry of the Ustilaginales: VII. Antibiotic activity of ustilagic acid. Canadian Journal of Botany 29, 585-592.
Hauser, N.C., Fellenberg, K., Gil, R., Bastuck, S., Hoheisel, J.D., and Perez-Ortin, J.E. (2001). Whole genome analysis of a wine yeast strain. Comparative and functional genomics 2, 69-79.
Heigwer, F., Kerr, G., and Boutros, M. (2014). E-CRISP: fast CRISPR target site identification. Nature methods 11, 122-123.

39
Heimel, K., Scherer, M., Schuler, D., and Kamper, J. (2010a). The Ustilago maydis Clp1 protein orchestrates pheromone and b-dependent signaling pathways to coordinate the cell cycle and pathogenic development. The Plant cell 22, 2908-2922.
Heimel, K., Freitag, J., Hampel, M., Ast, J., Bolker, M., and Kamper, J. (2013). Crosstalk between the unfolded protein response and pathways that regulate pathogenic development in Ustilago maydis. The Plant cell 25, 4262-4277.
Heimel, K., Scherer, M., Vranes, M., Wahl, R., Pothiratana, C., Schuler, D., Vincon, V., Finkernagel, F., Flor-Parra, I., and Kamper, J. (2010b). The transcription factor Rbf1 is the master regulator for b-mating type controlled pathogenic development in Ustilago maydis. PLoS pathogens 6, e1001035.
Hemetsberger, C., Herrberger, C., Zechmann, B., Hillmer, M., and Doehlemann, G. (2012). The Ustilago maydis effector Pep1 suppresses plant immunity by inhibition of host peroxidase activity. PLoS pathogens 8, e1002684.
Hoffman, C.S., and Winston, F. (1987). A ten-minute DNA preparation from yeast efficiently releases autonomous plasmids for transformation of Escherichia coli. Gene 57, 267-272.
Holliday, R. (1961). Induced mitotic crossing-over in Ustilago maydis. Genetics Research 2, 231-248. Horst, R.J., Engelsdorf, T., Sonnewald, U., and Voll, L.M. (2008). Infection of maize leaves with Ustilago
maydis prevents establishment of C4 photosynthesis. J Plant Physiol 165, 19-28. Horst, R.J., Zeh, C., Saur, A., Sonnewald, S., Sonnewald, U., and Voll, L.M. (2012). The Ustilago maydis
Nit2 homolog regulates nitrogen utilization and is required for efficient induction of filamentous growth. Eukaryot Cell 11, 368-380.
Horst, R.J., Doehlemann, G., Wahl, R., Hofmann, J., Schmiedl, A., Kahmann, R., Kamper, J., Sonnewald, U., and Voll, L.M. (2010). Ustilago maydis infection strongly alters organic nitrogen allocation in maize and stimulates productivity of systemic source leaves. Plant Physiol 152, 293-308.
Islamovic, E., Garcia-Pedrajas, M.D., Chacko, N., Andrews, D.L., Covert, S.F., and Gold, S.E. (2015). Transcriptome analysis of a Ustilago maydis ust1 deletion mutant uncovers involvement of laccase and polyketide synthase genes in spore development. Molecular plant-microbe interactions : MPMI 28, 42-54.
Jiang, Y., Wang, W., Xie, Q., Liu, N., Liu, L., Wang, D., Zhang, X., Yang, C., Chen, X., Tang, D., and Wang, E. (2017). Plants transfer lipids to sustain colonization by mutualistic mycorrhizal and parasitic fungi. Science 356, 1172-1175.
Jupe, J., Stam, R., Howden, A.J., Morris, J.A., Zhang, R., Hedley, P.E., and Huitema, E. (2013). Phytophthora capsici-tomato interaction features dramatic shifts in gene expression associated with a hemi-biotrophic lifestyle. Genome Biol 14, R63.
Kamper, J. (2004). A PCR-based system for highly efficient generation of gene replacement mutants in Ustilago maydis. Molecular genetics and genomics : MGG 271, 103-110.
Kamper, J., Kahmann, R., Bolker, M., Ma, L.J., Brefort, T., Saville, B.J., Banuett, F., Kronstad, J.W., Gold, S.E., Muller, O., Perlin, M.H., Wosten, H.A., de Vries, R., Ruiz-Herrera, J., Reynaga-Pena, C.G., Snetselaar, K., McCann, M., Perez-Martin, J., Feldbrugge, M., Basse, C.W., Steinberg, G., Ibeas, J.I., Holloman, W., Guzman, P., Farman, M., Stajich, J.E., Sentandreu, R., Gonzalez-Prieto, J.M., Kennell, J.C., Molina, L., Schirawski, J., Mendoza-Mendoza, A., Greilinger, D., Munch, K., Rossel, N., Scherer, M., Vranes, M., Ladendorf, O., Vincon, V., Fuchs, U., Sandrock, B., Meng, S., Ho, E.C., Cahill, M.J., Boyce, K.J., Klose, J., Klosterman, S.J., Deelstra, H.J., Ortiz-Castellanos, L., Li, W., Sanchez-Alonso, P., Schreier, P.H., Hauser-Hahn, I., Vaupel, M., Koopmann, E., Friedrich, G., Voss, H., Schluter, T., Margolis, J., Platt, D., Swimmer, C., Gnirke, A., Chen, F., Vysotskaia, V., Mannhaupt, G., Guldener, U., Munsterkotter, M., Haase, D., Oesterheld, M., Mewes, H.W., Mauceli, E.W., DeCaprio, D., Wade, C.M., Butler, J., Young, S., Jaffe, D.B., Calvo, S., Nusbaum, C., Galagan, J., and Birren, B.W. (2006). Insights from the genome of the biotrophic fungal plant pathogen Ustilago maydis. Nature 444, 97-101.

40
Kawahara, Y., Oono, Y., Kanamori, H., Matsumoto, T., Itoh, T., and Minami, E. (2012). Simultaneous RNA-seq analysis of a mixed transcriptome of rice and blast fungus interaction. PloS one 7, e49423.
Keymer, A., Pimprikar, P., Wewer, V., Huber, C., Brands, M., Bucerius, S.L., Delaux, P.M., Klingl, V., Ropenack-Lahaye, E.V., Wang, T.L., Eisenreich, W., Dormann, P., Parniske, M., and Gutjahr, C. (2017). Lipid transfer from plants to arbuscular mycorrhiza fungi. eLife 6.
Kim, H., and Woloshuk, C.P. (2008). Role of AREA, a regulator of nitrogen metabolism, during colonization of maize kernels and fumonisin biosynthesis in Fusarium verticillioides. Fungal genetics and biology : FG & B 45, 947-953.
Kleemann, J., Rincon-Rivera, L.J., Takahara, H., Neumann, U., Ver Loren van Themaat, E., van der Does, H.C., Hacquard, S., Stuber, K., Will, I., Schmalenbach, W., Schmelzer, E., and O'Connell, R.J.(2012). Sequential delivery of host-induced virulence effectors by appressoria and intracellularhyphae of the phytopathogen Colletotrichum higginsianum. PLoS pathogens 8, e1002643.
Kong, W., Chen, N., Liu, T., Zhu, J., Wang, J., He, X., and Jin, Y. (2015). Large-Scale Transcriptome Analysis of Cucumber and Botrytis cinerea during Infection. PloS one 10, e0142221.
Langfelder, P., and Horvath, S. (2008). WGCNA: an R package for weighted correlation network analysis. BMC Bioinformatics 9, 559.
Lanver, D., Berndt, P., Tollot, M., Naik, V., Vranes, M., Warmann, T., Munch, K., Rossel, N., and Kahmann, R. (2014). Plant surface cues prime Ustilago maydis for biotrophic development. PLoS pathogens 10, e1004272.
Lanver, D., Tollot, M., Schweizer, G., Lo Presti, L., Reissmann, S., Ma, L.S., Schuster, M., Tanaka, S., Liang, L., Ludwig, N., and Kahmann, R. (2017). Ustilago maydis effectors and their impact on virulence. Nature reviews. Microbiology 15, 409-421.
Livak, K.J., and Schmittgen, T.D. (2001). Analysis of relative gene expression data using real-time quantitative PCR and the 2(-Delta Delta C(T)) Method. Methods 25, 402-408.
Lo Presti, L., Lopez Diaz, C., Turra, D., Di Pietro, A., Hampel, M., Heimel, K., and Kahmann, R. (2016). A conserved co-chaperone is required for virulence in fungal plant pathogens. The New phytologist 209, 1135-1148.
Lo Presti, L., Lanver, D., Schweizer, G., Tanaka, S., Liang, L., Tollot, M., Zuccaro, A., Reissmann, S., and Kahmann, R. (2015). Fungal effectors and plant susceptibility. Annu Rev Plant Biol 66, 513-545.
Lorenz, M.C., and Heitman, J. (1998). The MEP2 ammonium permease regulates pseudohyphal differentiation in Saccharomyces cerevisiae. EMBO J 17, 1236-1247.
Loubradou, G., Brachmann, A., Feldbrugge, M., and Kahmann, R. (2001). A homologue of the transcriptional repressor Ssn6p antagonizes cAMP signalling in Ustilago maydis. Molecular microbiology 40, 719-730.
Love, M.I., Huber, W., and Anders, S. (2014). Moderated estimation of fold change and dispersion for RNA-seq data with DESeq2. Genome Biol 15, 550.
Martinez, P., and Ljungdahl, P.O. (2005). Divergence of Stp1 and Stp2 transcription factors in Candida albicans places virulence factors required for proper nutrient acquisition under amino acid control. Molecular and cellular biology 25, 9435-9446.
Marzluf, G.A. (1997). Genetic regulation of nitrogen metabolism in the fungi. Microbiol Mol Biol Rev 61, 17-32.
Mason, M.J., Fan, G., Plath, K., Zhou, Q., and Horvath, S. (2009). Signed weighted gene co-expression network analysis of transcriptional regulation in murine embryonic stem cells. BMC genomics 10, 327.
Massonnet, M., Morales-Cruz, A., Figueroa-Balderas, R., Lawrence, D.P., Baumgartner, K., and Cantu, D. (2018). Condition-dependent co-regulation of genomic clusters of virulence factors in thegrapevine trunk pathogen Neofusicoccum parvum. Molecular plant pathology 19, 21-34.

41
Matei, A. (2016). Identification of seedling-specific effectors in Ustilago maydis - maize interaction: From organ to cell type specificity. In Faculty of Biology (Philipps University).
Matei, A., and Doehlemann, G. (2016). Cell biology of corn smut disease-Ustilago maydis as a model for biotrophic interactions. Current opinion in microbiology 34, 60-66.
McCann, M.P., and Snetselaar, K.M. (2008). A genome-based analysis of amino acid metabolism in the biotrophic plant pathogen Ustilago maydis. Fungal genetics and biology : FG & B 45 Suppl 1, S77-87.
Mendoza-Mendoza, A., Berndt, P., Djamei, A., Weise, C., Linne, U., Marahiel, M., Vranes, M., Kämper, J., and Kahmann, R. (2009). Physical-chemical plant-derived signals induce differentiation in Ustilago maydis. Molecular microbiology 71, 895-911.
Merico, D., Isserlin, R., Stueker, O., Emili, A., and Bader, G.D. (2010). Enrichment map: a network-based method for gene-set enrichment visualization and interpretation. PloS one 5, e13984.
Mirzadi Gohari, A., Ware, S.B., Wittenberg, A.H., Mehrabi, R., Ben M'Barek, S., Verstappen, E.C., van der Lee, T.A., Robert, O., Schouten, H.J., de Wit, P.P., and Kema, G.H. (2015). Effector discovery in the fungal wheat pathogen Zymoseptoria tritici. Molecular plant pathology 16, 931-945.
Mueller, A.N., Ziemann, S., Treitschke, S., Assmann, D., and Doehlemann, G. (2013). Compatibility in the Ustilago maydis-maize interaction requires inhibition of host cysteine proteases by the fungal effector Pit2. PLoS pathogens 9, e1003177.
Muller, O., Schreier, P.H., and Uhrig, J.F. (2008). Identification and characterization of secreted and pathogenesis-related proteins in Ustilago maydis. Molecular genetics and genomics : MGG 279, 27-39.
Nadal, M., Garcia-Pedrajas, M.D., and Gold, S.E. (2010). The snf1 gene of Ustilago maydis acts as a dual regulator of cell wall degrading enzymes. Phytopathology 100, 1364-1372.
Navarathna, D.H., Das, A., Morschhauser, J., Nickerson, K.W., and Roberts, D.D. (2011). Dur3 is the major urea transporter in Candida albicans and is co-regulated with the urea amidolyase Dur1,2. Microbiology 157, 270-279.
O'Connell, R.J., Thon, M.R., Hacquard, S., Amyotte, S.G., Kleemann, J., Torres, M.F., Damm, U., Buiate, E.A., Epstein, L., Alkan, N., Altmuller, J., Alvarado-Balderrama, L., Bauser, C.A., Becker, C., Birren, B.W., Chen, Z., Choi, J., Crouch, J.A., Duvick, J.P., Farman, M.A., Gan, P., Heiman, D., Henrissat, B., Howard, R.J., Kabbage, M., Koch, C., Kracher, B., Kubo, Y., Law, A.D., Lebrun, M.H., Lee, Y.H., Miyara, I., Moore, N., Neumann, U., Nordstrom, K., Panaccione, D.G., Panstruga, R., Place, M., Proctor, R.H., Prusky, D., Rech, G., Reinhardt, R., Rollins, J.A., Rounsley, S., Schardl, C.L., Schwartz, D.C., Shenoy, N., Shirasu, K., Sikhakolli, U.R., Stuber, K., Sukno, S.A., Sweigard, J.A., Takano, Y., Takahara, H., Trail, F., van der Does, H.C., Voll, L.M., Will, I., Young, S., Zeng, Q., Zhang, J., Zhou, S., Dickman, M.B., Schulze-Lefert, P., Ver Loren van Themaat, E., Ma, L.J., and Vaillancourt, L.J. (2012). Lifestyle transitions in plant pathogenic Colletotrichum fungi deciphered by genome and transcriptome analyses. Nat Genet 44, 1060-1065.
Ospina-Giraldo, M.D., Mullins, E., and Kang, S. (2003). Loss of function of the Fusarium oxysporum SNF1 gene reduces virulence on cabbage and Arabidopsis. Curr Genet 44, 49-57.
Park, J., Park, J., Jang, S., Kim, S., Kong, S., Choi, J., Ahn, K., Kim, J., Lee, S., Kim, S., Park, B., Jung, K., Kim, S., Kang, S., and Lee, Y.H. (2008). FTFD: an informatics pipeline supporting phylogenomic analysis of fungal transcription factors. Bioinformatics 24, 1024-1025.
Pellier, A.L., Lauge, R., Veneault-Fourrey, C., and Langin, T. (2003). CLNR1, the AREA/NIT2-like global nitrogen regulator of the plant fungal pathogen Colletotrichum lindemuthianum is required for the infection cycle. Molecular microbiology 48, 639-655.
Rabe, F., Seitner, D., Bauer, L., Navarrete, F., Czedik-Eysenberg, A., Rabanal, F.A., and Djamei, A. (2016). Phytohormone sensing in the biotrophic fungus Ustilago maydis - the dual role of the transcription factor Rss1. Molecular microbiology 102, 290-305.

42
Redkar, A., Matei, A., and Doehlemann, G. (2017). Insights into Host Cell Modulation and Induction of New Cells by the Corn Smut Ustilago maydis. Frontiers in plant science 8, 899.
Redkar, A., Hoser, R., Schilling, L., Zechmann, B., Krzymowska, M., Walbot, V., and Doehlemann, G. (2015). A Secreted Effector Protein of Ustilago maydis Guides Maize Leaf Cells to Form Tumors. The Plant cell 27, 1332-1351.
Reineke, G., Heinze, B., Schirawski, J., Buettner, H., Kahmann, R., and Basse, C.W. (2008). Indole-3-acetic acid (IAA) biosynthesis in the smut fungus Ustilago maydis and its relevance for increased IAA levels in infected tissue and host tumour formation. Molecular plant pathology 9, 339-355.
Robinson, M.D., and Oshlack, A. (2010). A scaling normalization method for differential expression analysis of RNA-seq data. Genome Biol 11, R25.
Robinson, M.D., McCarthy, D.J., and Smyth, G.K. (2010). edgeR: a Bioconductor package for differential expression analysis of digital gene expression data. Bioinformatics 26, 139-140.
Rudd, J.J., Kanyuka, K., Hassani-Pak, K., Derbyshire, M., Andongabo, A., Devonshire, J., Lysenko, A., Saqi, M., Desai, N.M., Powers, S.J., Hooper, J., Ambroso, L., Bharti, A., Farmer, A., Hammond-Kosack, K.E., Dietrich, R.A., and Courbot, M. (2015). Transcriptome and metabolite profiling of the infection cycle of Zymoseptoria tritici on wheat reveals a biphasic interaction with plant immunity involving differential pathogen chromosomal contributions and a variation on the hemibiotrophic lifestyle definition. Plant Physiol 167, 1158-1185.
Sanchez-Arreguin, J.A., Hernandez-Onate, M.A., Leon-Ramirez, C.G., and Ruiz-Herrera, J. (2017). Transcriptional analysis of the adaptation of Ustilago maydis during growth under nitrogen fixation conditions. Journal of basic microbiology 57, 597-604.
Schauwecker , F., Wanner, G., and Kahmann, R. (1995). Filament-Specific Expression of a Cellulase Gene in the Dimorphic Fungus Ustilago maydis Biological Chemistry Hoppe-Seyler 376.
Scherer, M., Heimel, K., Starke, V., and Kamper, J. (2006). The Clp1 protein is required for clamp formation and pathogenic development of Ustilago maydis. The Plant cell 18, 2388-2401.
Schilling, L., Matei, A., Redkar, A., V., W., and Dohlemann, G. (2014). Virulence of the maize smut Ustilago maydis is shaped by organ-specific effectors. Molecular plant pathology 15, 780-789.
Schipper, K. (2009). Charakterisierung eines Ustilago maydis Genclusters, das für drei neuartige sekretierte Effektoren kodiert P.-U.M. Biologie, ed.
Schirawski, J., Bohnert, H.U., Steinberg, G., Snetselaar, K., Adamikowa, L., and Kahmann, R. (2005). Endoplasmic reticulum glucosidase II is required for pathogenicity of Ustilago maydis. The Plant cell 17, 3532-3543.
Schirawski, J., Mannhaupt, G., Münch, K., Brefort, T., Schipper, K., Doehlemann, G., Di Stasio, M., Rössel, N., Mendoza-Mendoza, A., Pester, D., Müller, O., Winterberg, B., Meyer, E., Ghareeb, H., Wollenberg, T., Münsterkötter, M., Wong, P., Walter, M., Stukenbrock, E., Güldener, U., and Kahmann, R. (2010). Pathogenicity determinants in smut fungi revealed by genome comparison. Science 330, 1546-1548.
Schuler, D., Wahl, R., Wippel, K., Vranes, M., Munsterkotter, M., Sauer, N., and Kamper, J. (2015). Hxt1, a monosaccharide transporter and sensor required for virulence of the maize pathogen Ustilago maydis. The New phytologist 206, 1086-1100.
Schulz, B., Banuett, F., Dahl, M., Schlesinger, R., Schafer, W., Martin, T., Herskowitz, I., and Kahmann, R. (1990). The b alleles of U. maydis, whose combinations program pathogenic development,code for polypeptides containing a homeodomain-related motif. Cell 60, 295-306.
Schuster, M., Schweizer, G., and Kahmann, R. (2017). Comparative analyses of secreted proteins in plant pathogenic smut fungi and related basidiomycetes. Fungal genetics and biology : FG & B.
Schuster, M., Schweizer, G., Reissmann, S., and Kahmann, R. (2016). Genome editing in Ustilago maydis using the CRISPR-Cas system. Fungal genetics and biology : FG & B 89, 3-9.

43
Shannon, P., Markiel, A., Ozier, O., Baliga, N.S., Wang, J.T., Ramage, D., Amin, N., Schwikowski, B., and Ideker, T. (2003). Cytoscape: a software environment for integrated models of biomolecular interaction networks. Genome Res 13, 2498-2504.
Skibbe, D., Doehlemann, G., Fernandes, J., and Walbot, V. (2010). Maize tumors caused by Ustilago maydis require organ-specific genes in host and pathogen. Science 328, 89-92.
Smith, D., Garcia-Pedrajas, M.D., Gold, S.E., and Perlin, M. (2003). Isolation and characterization from pathogenic fungi of genes encoding ammonium permeases and their roles in dimorphism. Molecular microbiology 50, 259-275.
Snetselaar, K., and McCann, M. (2017). Ustilago maydis, the corn smut fungus, has an unusual diploid mitotic stage. Mycologia 109, 140-152.
Snoeijers, S.S., Pérez-García, A., Joosten, M.H.A.J., and De Wit, P.J.G.M. (2000). The effect of nitrogen on disease development and gene expression in bacterial and fungal plant pathogens. European Journal of Plant Pathology 106, 493-506.
Stirnberg, A., and Djamei, A. (2016). Characterization of ApB73, a virulence factor important for colonization of Zea mays by the smut Ustilago maydis. Molecular plant pathology 17, 1467-1479.
Tanaka, S., Brefort, T., Neidig, N., Djamei, A., Kahnt, J., Vermerris, W., Koenig, S., Feussner, K., Feussner, I., and Kahmann, R. (2014). A secreted Ustilago maydis effector promotes virulence by targeting anthocyanin biosynthesis in maize. eLife 3, e01355.
Teichmann, B., Linne, U., Hewald, S., Marahiel, M.A., and Bolker, M. (2007). A biosynthetic gene cluster for a secreted cellobiose lipid with antifungal activity from Ustilago maydis. Molecular microbiology 66, 525-533.
Thatcher, L.F., Williams, A.H., Garg, G., Buck, S.G., and Singh, K.B. (2016). Transcriptome analysis of the fungal pathogen Fusarium oxysporum f. sp. medicaginis during colonisation of resistant and susceptible Medicago truncatula hosts identifies differential pathogenicity profiles and novel candidate effectors. BMC genomics 17, 860.
The Gene Ontology, C. (2017). Expansion of the Gene Ontology knowledgebase and resources. Nucleic acids research 45, D331-D338.
Thomma, B.P., Bolton, M.D., Clergeot, P.H., and PJ, D.E.W. (2006). Nitrogen controls in planta expression of Cladosporium fulvum Avr9 but no other effector genes. Molecular plant pathology 7, 125-130.
Tollot, M., Assmann, D., Becker, C., Altmuller, J., Dutheil, J.Y., Wegner, C.E., and Kahmann, R. (2016). The WOPR protein Ros1 is a master regulator of sporogenesis and late effector gene expression in the maize pathogen Ustilago maydis. PLoS pathogens 12, e1005697.
Tonukari, N.J., Scott-Craig, J.S., and Walton, J.D. (2000). The Cochliobolus carbonum SNF1 gene is required for cell wall-degrading enzyme expression and virulence on maize. The Plant cell 12, 237-248.
Toruno, T.Y., Stergiopoulos, I., and Coaker, G. (2016). Plant-pathogen effectors: cellular probes interfering with plant defenses in spatial and temporal manners. Annual review of phytopathology 54, 419-441.
Turian, G., and Hamilton, R.H. (1960). Chemical detection of 3-indolylacetic acid in Ustilago zeae tumors. Biochimica et Biophysica Acta 41, 148-150.
Vollmeister, E., Schipper, K., Baumann, S., Haag, C., Pohlmann, T., Stock, J., and Feldbrugge, M. (2012). Fungal development of the plant pathogen Ustilago maydis. FEMS microbiology reviews 36, 59-77.
Wahl, R., Wippel, K., Goos, S., Kamper, J., and Sauer, N. (2010). A novel high-affinity sucrose transporter is required for virulence of the plant pathogen Ustilago maydis. PLoS biology 8, e1000303.
Wang, Z.D., Yan, N., Wang, Z.H., Zhang, X.H., Zhang, J.Z., Xue, H.M., Wang, L.X., Zhan, Q., Xu, Y.P., and Guo, D.P. (2017). RNA-seq analysis provides insight into reprogramming of culm development in Zizania latifolia induced by Ustilago esculenta. Plant molecular biology 95, 533-547.

44
Young, M.D., Wakefield, M.J., Smyth, G.K., and Oshlack, A. (2010). Gene ontology analysis for RNA-seq: accounting for selection bias. Genome Biology 11.
Zahiri, A., Heimel, K., Wahl, R., Rath, M., and Kamper, J. (2010). The Ustilago maydis forkhead transcription factor Fox1 is involved in the regulation of genes required for the attenuation of plant defenses during pathogenic development. Molecular plant-microbe interactions : MPMI 23, 1118-1129.
Zeng, F.S., Menardo, F., Xue, M.F., Zhang, X.J., Gong, S.J., Yang, L.J., Shi, W.Q., and Yu, D.Z. (2017). Transcriptome Analyses Shed New Insights into Primary Metabolism and Regulation of Blumeria graminis f. sp. tritici during Conidiation. Frontiers in plant science 8, 1146.
Zhang, B., and Horvath, S. (2005). A general framework for weighted gene co-expression network analysis. Stat Appl Genet Mol Biol. 4():Article17.
Zheng, Y., Kief, J., Auffarth, K., Farfsing, J.W., Mahlert, M., Nieto, F., and Basse, C.W. (2008). The Ustilago maydis Cys2His2-type zinc finger transcription factor Mzr1 regulates fungal gene expression during the biotrophic growth stage. Molecular microbiology 68, 1450-1470.

A
time (dpi)
B C
0.5 dpi 1 dpi 2 dpi 4 dpi
6 dpi 8 dpi 12 dpi
biotrophicdevelopment in
tumor tissue
biotrophicdevelopment
Figure 1. Changes in the amount of fungal transcripts and fungal biomass during infection(A) Schematic view of cross-sections of U. maydis infected maize leaves illustrating the stages of fungal development aswell as plant tumor formation at the time points analyzed by RNAseq-based transcriptional profiling. U. maydis infection isnot synchronized, and each sample thus contains fungal transcripts from different developmental stages. dpi: days postinfection; plant leaf tissue: green; vascular tissue: brown; fungal cytoplasm: orange; empty fungal hyphae separated bysepta: grey; plant tumor cells: beige; matrix: rose; fungal spores: ornamented in black. (B) Amount of fungal transcriptsbased on the RNAseq analysis. For each time point (0.5, 1, 2, 4, 6, 8 and 12 dpi) the ratio of reads uniquely mapped to theU. maydis genome relative to the total number of uniquely mapped reads (U. maydis and Z. mays) was determined. Errorbars denote standard deviation of three biological replicates. (C) Fungal biomass determination based on the amount ofgenomic DNA. A qPCR with plant-specific (GAPDH) and fungus-specific (ppi) primers was performed using the sameinfected plant material that was used for the RNAseq analysis. Data points give mean ratios of fungal DNA to plant DNA(2-ΔCt). Error bars denote standard deviation of three biological replicates.
0
1
2
3
4
5
6
0 2 4 6 8 10 12
rela
tive
fung
alD
NA
time (dpi)
biotrophicdevelopment in
tumor tissue
biotrophicdevelopment
rela
tive
fung
altra
nscr
ipts
0 2 4 6 8 10 12
0.16
0
0.1
0.06
0.02
0.04
0.08
0.14
0.12

-0,6
-0,3
0,0
0,3
0,6
ax 0.5 1 2 4 6 8 12
light-cyan (699)
-0,6
-0,3
0,0
0,3
0,6
ax 0.5 1 2 4 6 8 12
red (398)
-0,6
-0,3
0,0
0,3
0,6ax 0.5 1 2 4 6 8 12
burlywood (459)
-0,6
-0,3
0,0
0,3
0,6
ax 0.5 1 2 4 6 8 12
dark-green (561)
-0,6
-0,3
0,0
0,3
0,6
ax 0.5 1 2 4 6 8 12
beige (413)
-0,6
-0,3
0,0
0,3
0,6
ax 0.5 1 2 4 6 8 12
blue (36)
-0,6
-0,3
0,0
0,3
0,6
ax 0.5 1 2 4 6 8 12
pink (302)
-0,6
-0,3
0,0
0,3
0,6
ax 0.5 1 2 4 6 8 12
yellow (1231)
-0,6
-0,3
0,0
0,3
0,6
ax 0.5 1 2 4 6 8 12
light-green (297)
-0,6
-0,3
0,0
0,3
0,6
ax 0.5 1 2 4 6 8 12
cyan (795)
-0,6
-0,3
0,0
0,3
0,6
ax 0.5 1 2 4 6 8 12
magenta (771)
-0,6
-0,3
0,0
0,3
0,6
ax 0.5 1 2 4 6 8 12
green (196)
-0,6
-0,3
0,0
0,3
0,6
ax 0.5 1 2 4 6 8 12
green-yellow (144)
-0,6
-0,3
0,0
0,3
0,6
ax 0.5 1 2 4 6 8 12
salmon (119)
PC1: 53% variance
PC
2: 2
2% v
aria
nce
0.5 1 2 4 86 12
dpi
axenic
0.5
1
2
4
8
6
dpi
A B
C
1930 1750 1711 1970 2008 2070 1543
934
708
224 1272 1020 988
900 817 786 840 654
899 1153 1504
76 334 681
108 511
369
7801359 1262 1621 1662 1672
63 1511 1070 1050 1012 710
1093 813 848 929 678
749 1109 1325
67 375 681
59 401
213
1585 1704
450
-40
-30
-20
-10
0
10
20
30
-60 -40 -20 0 20 40
axenic0.5 dpi1 dpi2 dpi4 dpi6 dpi8 dpi12 dpi

Figure 2. Quality assessment of the RNAseq dataset of U. maydis during infection(A) Principal component analysis (PCA) of RNAseq data. The replicates of each developmental stage of U. maydis (axenic, 0.5, 1, 2, 4, 6, 8 and 12 dpi) form distinct clusters. (B) The expression data of the eight analyzed developmental stages of U. maydis (axenic, 0.5, 1, 2, 4, 6, 8 and 12 dpi) was the basis to extract all 28 possible contrasts. Genes with a log2 fold change > 0.5 and adjusted p-value < 0.01 were considered differentially expressed. Grey triangles depict the number of genes expressed at higher levels at the stages denoted by the horizontal labels, and yellow triangles depict the number of genes expressed at higher levels at the vertically labeled stages. In total, 5759 of the 6766 U. maydis genes were differentially expressed. (C) Modules of co-expressed genes during pathogenic development of U. maydis. The RNAseq expression dataset was subjected to a weighted gene co-expression analysis (WGCNA) to detect modules of co-expressed genes. Each graph shows the expression of the module eigengene, which can be considered as the representative gene of the respective co-expression module. The vertical axes indicate log2 expression values relative to the mean expression across all stages. The horizontal axes indicate the stages, i.e. axenic (ax), 0.5, 1, 2, 4, 6, 8 and 12 dpi. Error bars indicate standard deviation of three biological replicates. The modules are named according to their color, and the number of genes residing in each module is given in parentheses.

chromosomesegregation
mitoticcheckpoint
proteasome
translation
protein complexdisassembly
chromosomecondensation
nucleartransport
ribosomebiogenesis
organelletargeting
mitochondrialimport
mitoticspindle
tRNAaminoacylation
amino acidbiosynthesis
purine & pyrimidinemetabolism
protontransport
aerobicrespiration
glucosemetabolism
DNA replication
telomereelongation
primarymetabolism
lipidtransport
alcoholmetabolism
acetatemetabolism
transcriptionalregulation
lipidmetabolism
signaltransduction
proteincatabolism
vesiculartransport
amino acidbiosynthesis
ER to golgi traffick
clathrin-mediated
endocytosis
ER import
N-linkedglycosylation
proteinprenylation
actinpolymerization
signaltransduction
phosphatidylinositolmetabolism
transmembranetransport
response tonitrogen levels unfolded protein
response
secondarymetabolism
polysaccharidecatabolism
gene set size
>500300-500200-300100-20050-100<50
A B
autophagy
C
D E F
N-linkedglycosylation
endosometransport
amino acid catabolism
ion transport
nitrateassimilation
lipidbiosynthesis
positive regulation ofcellular process
regulation ofacetylation
H
secondary metabolism
G

Figure 3. Biological processes enriched in selected co-expression modulesGene ontology enrichment analysis for the yellow (A), light-cyan (B), dark-green (C), red (D), magenta (E), cyan (F), light-green (G), and blue (H) module. Only biological process (BP) terms were considered in the analysis. Each significantly enriched gene set (hypergeometric p-value < 0.005) is represented by a node. Node sizes are proportional to the number of genes within the respective gene set, and the edges indicate overlapping member genes. Highly similar gene sets tend to form clusters, which were manually circled and labeled with appropriate summarizing terms. Gene sets that have no overlap with other enriched GO terms are shown in the rightmost corner and are not labeled despite two exceptions, one in D (secondary metabolism) and one in F (N-linked glycosylation). See Supplemental Data Set 8 to retrieve all GO terms of the enriched gene sets.
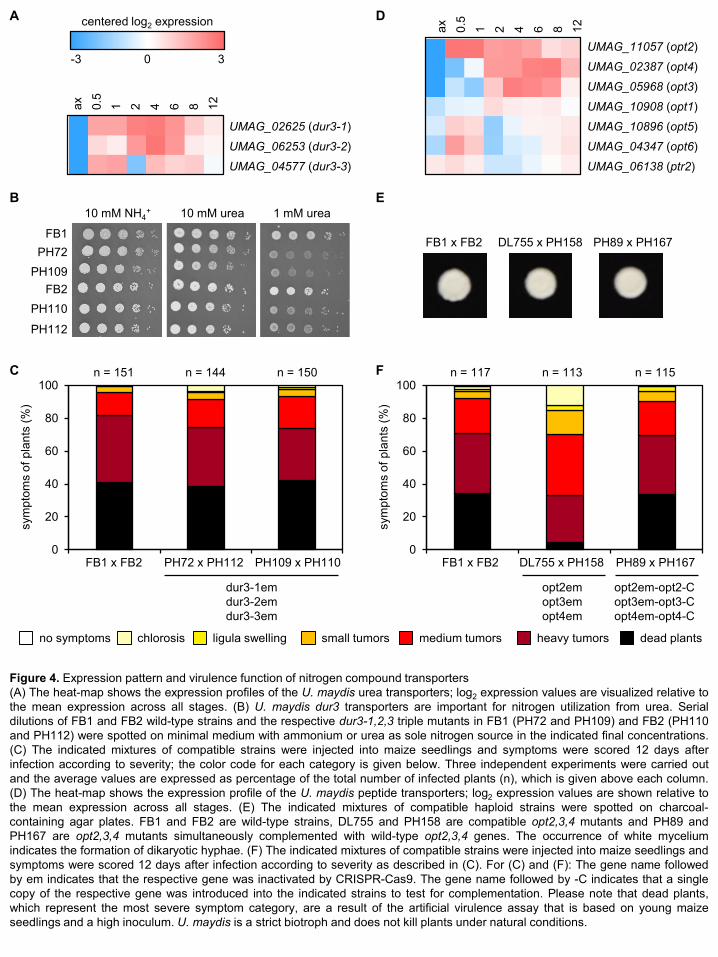
0
20
40
60
80
100
FB1 x FB2 PH72 x 112 PH109 x 1100
20
40
60
80
100
FB1xFB2 DL755 x PH158 PH89 x PH167
UMAG_02625 (dur3-1)
UMAG_06253 (dur3-2)
UMAG_04577 (dur3-3)
UMAG_11057 (opt2)
UMAG_02387 (opt4)
UMAG_05968 (opt3)
UMAG_10908 (opt1)
UMAG_10896 (opt5)
UMAG_04347 (opt6)
UMAG_06138 (ptr2)
-3 30
0.5
1 2 4 6 8 12axcentered log2 expression
0.5
1 2 4 6 8 12ax
sym
ptom
sof
plan
ts(%
)
sym
ptom
sof
plan
ts(%
)
B E
A D
FB1 x FB2
dur3-1emdur3-2emdur3-3em
PH109 x PH110PH72 x PH112 FB1 x FB2
opt2emopt3emopt4em
opt2em-opt2-Copt3em-opt3-Copt4em-opt4-C
n = 151 n = 144 n = 150 n = 117 n = 113 n = 115
DL755 x PH158 PH89 x PH167
no symptoms medium tumorschlorosis heavy tumors dead plantsligula swelling small tumors
FC
10 mM urea 1 mM urea
FB1 x FB2 DL755 x PH158 PH89 x PH167FB1
FB2PH110
PH112
PH72PH109
10 mM NH4+
Figure 4. Expression pattern and virulence function of nitrogen compound transporters(A) The heat-map shows the expression profiles of the U. maydis urea transporters; log2 expression values are visualized relative tothe mean expression across all stages. (B) U. maydis dur3 transporters are important for nitrogen utilization from urea. Serialdilutions of FB1 and FB2 wild-type strains and the respective dur3-1,2,3 triple mutants in FB1 (PH72 and PH109) and FB2 (PH110and PH112) were spotted on minimal medium with ammonium or urea as sole nitrogen source in the indicated final concentrations.(C) The indicated mixtures of compatible strains were injected into maize seedlings and symptoms were scored 12 days afterinfection according to severity; the color code for each category is given below. Three independent experiments were carried outand the average values are expressed as percentage of the total number of infected plants (n), which is given above each column.(D) The heat-map shows the expression profile of the U. maydis peptide transporters; log2 expression values are shown relative tothe mean expression across all stages. (E) The indicated mixtures of compatible haploid strains were spotted on charcoal-containing agar plates. FB1 and FB2 are wild-type strains, DL755 and PH158 are compatible opt2,3,4 mutants and PH89 andPH167 are opt2,3,4 mutants simultaneously complemented with wild-type opt2,3,4 genes. The occurrence of white myceliumindicates the formation of dikaryotic hyphae. (F) The indicated mixtures of compatible strains were injected into maize seedlings andsymptoms were scored 12 days after infection according to severity as described in (C). For (C) and (F): The gene name followedby em indicates that the respective gene was inactivated by CRISPR-Cas9. The gene name followed by -C indicates that a singlecopy of the respective gene was introduced into the indicated strains to test for complementation. Please note that dead plants,which represent the most severe symptom category, are a result of the artificial virulence assay that is based on young maizeseedlings and a high inoculum. U. maydis is a strict biotroph and does not kill plants under natural conditions.

mag
enta
axen
ic0.
51 2 4 6 8 12 si
gnat
ure
PC
WD
E
cyan
light
-gre
en
red
light
-cya
nda
rk-g
reen
axen
ic0.
51 2 4 6 8 12 si
gnat
ure
PC
WD
E
hydr
olas
e
hydr
olas
e
centered log2 expression
-3 30
mod
ule
mod
ule dpi
dpi
blue
beig
eye
llow
burly
woo
dpi
nk
Figure 5. Expression of the U. maydis secretomeThe heat-map shows expression of differentially expressed genes encoding putative secreted proteins. For each module indicatedon the left, genes were hierarchically clustered, and log2 expression values are visualized relative to the mean expression across allstages. Modules are colored according to Figure 2C. Black bars on the right indicate for each gene the presence of knownsignatures (based on InterPro scan), the predicted hydrolytic capabilities and more specifically the predicted ability to degrade theplant cell wall (PCWDE).
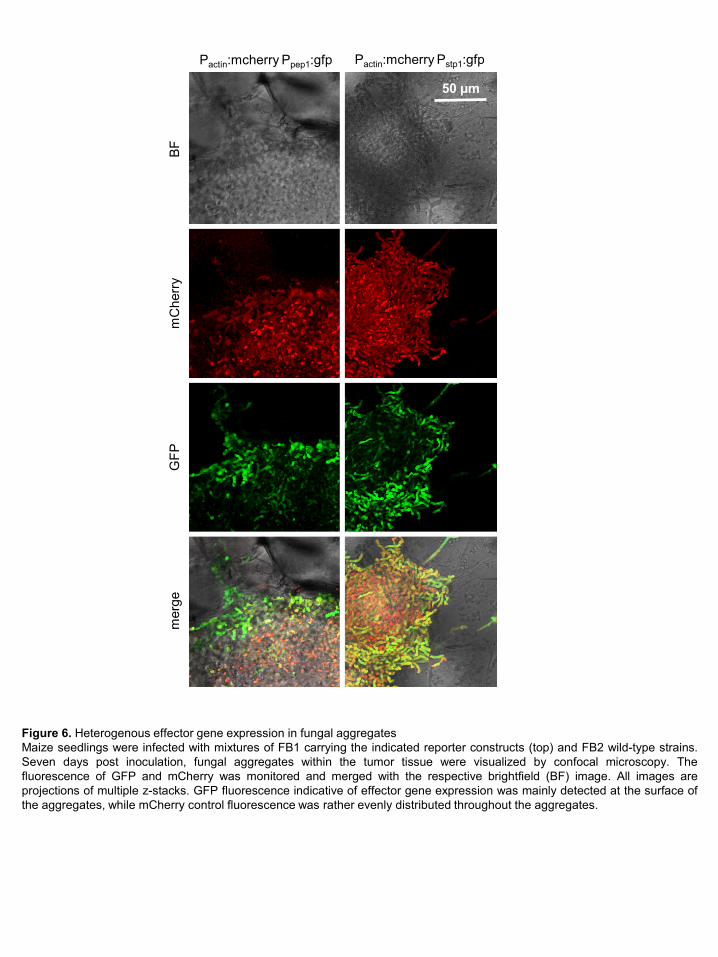
50 µm
Pactin:mcherry Ppep1:gfp Pactin:mcherry Pstp1:gfp
BFm
Che
rry
GFP
mer
ge
Figure 6. Heterogenous effector gene expression in fungal aggregatesMaize seedlings were infected with mixtures of FB1 carrying the indicated reporter constructs (top) and FB2 wild-type strains.Seven days post inoculation, fungal aggregates within the tumor tissue were visualized by confocal microscopy. Thefluorescence of GFP and mCherry was monitored and merged with the respective brightfield (BF) image. All images areprojections of multiple z-stacks. GFP fluorescence indicative of effector gene expression was mainly detected at the surface ofthe aggregates, while mCherry control fluorescence was rather evenly distributed throughout the aggregates.

A C
ID Name Type
0.93 0.30 -0.39 UMAG_10544 Homeobox0.92 0.41 -0.12 UMAG_02835 TEA/ATTS0.92 0.46 -0.11 UMAG_11235 bHLH 0.90 0.05 -0.61 UMAG_03172 rbf1 C2H20.90 0.38 -0.34 UMAG_04581 bHLH 0.34 0.98 0.74 UMAG_04928 hdp2 Homeobox0.47 0.98 0.57 UMAG_02549 biz1 C2H20.53 0.97 0.57 UMAG_12052 bE Homeobox0.45 0.97 0.65 UMAG_00578 bW Homeobox0.27 0.95 0.63 UMAG_11658 HMG0.32 0.95 0.63 UMAG_00501 CCHC0.07 0.94 0.86 UMAG_05804 mzr1 C2H20.58 0.92 0.47 UMAG_02104 Winged helix-0.37 0.64 0.98 UMAG_05601 Zn2Cys6-0.20 0.69 0.97 UMAG_02765 Zn2Cys6-0.29 0.72 0.96 UMAG_04778 nlt1 APSES-0.35 0.65 0.94 UMAG_05721 bHLH-0.24 0.69 0.93 UMAG_11138 C2H2-0.27 0.78 0.92 UMAG_01523 fox1 Forkhead-0.46 0.43 0.92 UMAG_06257 Zn2Cys6-0.15 0.71 0.92 UMAG_06308 Winged helix-0.09 0.78 0.91 UMAG_01456 Zn2Cys6
rbf1hdp2
biz1bEbW
mzr1
fox1
nlt1
B
Figure 7. Association of transcription factors with modules containing secreted proteins(A) and (B) Network of gene expression profiles of differentially regulated genes encoding secreted proteins (A) and differentiallyregulated transcription factors (B) belonging to the respective modules in which the secreted proteins reside. The weighted networkis based on the topological overlap matrix of the expression data, edges were included when the pairwise overlap was greater than0.2, and genes are colored according to their modular membership. Selected transcription factors are labeled with their respectivenames. (C) Connectivity of transcription factors to the red (left panel), magenta (middle panel) and cyan module (right panel).Depicted are all transcription factors having an intramodular connectivity of greater than 0.9 to any of the three modules. Colorintensity indicates connectivity strength.

0
20
40
60
80
100
FB1xFB2 DL755 x PH158 PH89 x PH167
-3 30
centered log2 expression
BA
C
0.5 1 2 4 6 8 12ax
sym
ptom
sof
plan
tsFB1 x FB2 PH133 x PH139PH75 x PH86
nlt1em nlt1em-nlt1-C
n = 138 n = 140 n = 136 no symptoms
medium tumors
heavy tumors
ligula swelling
small tumors
death of 4th - 5th leaf
chlorosis
tumors at baseof stem only
4 dp
i8
dpi
FB1 x FB2 PH133 x PH139PH75 x PH86
UMAG_4778 (nlt1)
dead plants
Figure 8. Role of U. maydis nlt1 in virulence(A) The heat-map shows the expression profile of the U. maydis nlt1 gene; log2 expression values are visualized relative to themean expression across all stages. (B) The indicated mixtures of strains were injected into maize seedlings and symptoms werescored 12 days after infection according to severity; the color code for each category is given on the right. The nlt1 mutants wereunable to induce tumors in leaves. nlt1em indicates that the nlt1 gene was inactivated by CRISPR-Cas9. nlt1-C indicates that asingle copy of nlt1 was introduced into the indicated strains to test for complementation. Three independent experiments werecarried out and the average values are expressed as a percentage of the total number of infected plants (n), which is given aboveeach column. Please note that dead plants, which represent the most severe symptom category, are the result of the virulenceassay that is based on young maize seedlings and high cell density of the inoculum. U. maydis is a strict biotroph and does not killplant tissue under natural conditions. (C) Representative leaves of infections with wild-type strains, nlt1 mutants, and thecomplemented strains at 4 and 8 dpi are shown. Examples of stem tumors and dead leaves observed in infections with nlt1 mutantsare depicted in Supplemental Figure 6.

02468
10
2dpi 4dpi
UMAG_02297
02468
10
2dpi 4dpi
UMAG_11415
0
4
8
12
16
2dpi 4dpi
UMAG_05929
02468
10
2dpi 4dpi
UMAG_05312
02468
10
2dpi 4dpi
UMAG_10555
02468
10
2dpi 4dpi
UMAG_06128
0
1
2
3
2dpi 4dpi
pit2
0
1
2
3
2dpi 4dpi
cmu1
0
1
2
3
2dpi 4dpi
eff1-4
0
1
2
3
2dpi 4dpi
egl2
0
1
2
3
2dpi 4dpi
pep1
0
1
2
3
2dpi 4dpi
stp1
wtnlt1em
**
**
Figure 9. Regulation of effector gene expression by nlt1The expression of selected effector genes during pathogenic development in crosses of FB1 and FB2 wild-type strains (circles)as well as in crosses of compatible nlt1 mutants (triangles) was measured via RT-qPCR. Six effector genes of the magentamodule (leftmost two panels) and six potential effectors of the cyan module (rightmost two panels) were tested. In each graph,the expression of the respective gene in the wild-type 2 dpi samples was set to 1 and relative expression is depicted. Significantexpression differences (p-value < 0.01, Student’s t-test) between nlt1 mutants and wild-type strains are indicated with anasterisk if applicable. Error bars denote standard deviation of three biological replicates. Four of six genes of the cyan modulerequired nlt1 for expression while none of the six effector genes of the magenta module was regulated by nlt1.

DOI 10.1105/tpc.17.00764; originally published online January 25, 2018;Plant Cell
Clément Pellegrin, Stefanie Reissmann, Janine Altmüller, Stefan A Rensing and Regine KahmannDaniel Lanver, André N. Müller, Petra Happel, Gabriel Schweizer, Fabian B. Haas, Marek Franitza,
The biotrophic development of Ustilago maydis studied by RNAseq analysis
This information is current as of July 6, 2018
Supplemental Data
/content/suppl/2018/02/06/tpc.17.00764.DC3.html /content/suppl/2018/02/05/tpc.17.00764.DC2.html /content/suppl/2018/01/25/tpc.17.00764.DC1.html
Permissions https://www.copyright.com/ccc/openurl.do?sid=pd_hw1532298X&issn=1532298X&WT.mc_id=pd_hw1532298X
eTOCs http://www.plantcell.org/cgi/alerts/ctmain
Sign up for eTOCs at:
CiteTrack Alerts http://www.plantcell.org/cgi/alerts/ctmain
Sign up for CiteTrack Alerts at:
Subscription Information http://www.aspb.org/publications/subscriptions.cfm
is available at:Plant Physiology and The Plant CellSubscription Information for
ADVANCING THE SCIENCE OF PLANT BIOLOGY © American Society of Plant Biologists