Embed Size (px)
Citation preview
1
Supplementary Information
A heterodimeric Fc-based bispecific antibody simultaneously targeting VEGFR-2 and Met
exhibits potent anti-tumor activity
Hye-Ji Choi, Ye-Jin Kim, Sangho Lee, and Yong-Sung Kim
Inventory of Supplementary Information
Supplementary Data :
5 supplementary figures
4 supplementary tables
Supplementary Materials and Methods
Supplementary References
2
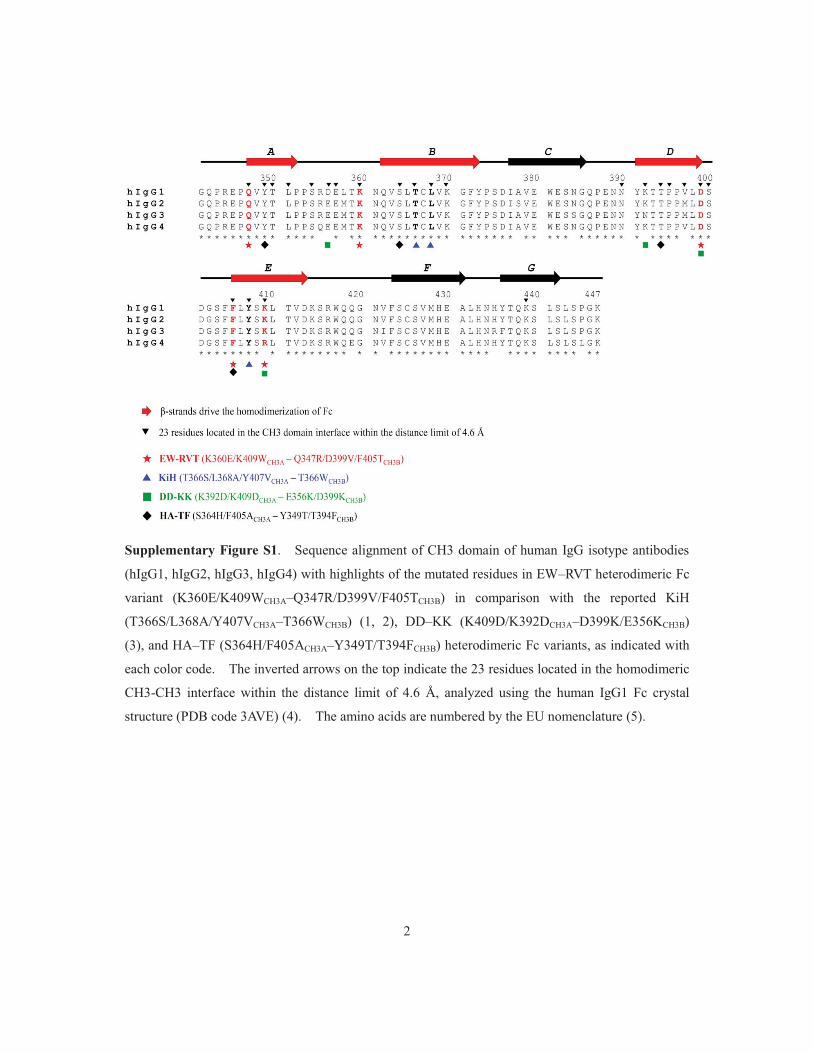
Supplementary Figure S1. Sequence alignment of CH3 domain of human IgG isotype antibodies
(hIgG1, hIgG2, hIgG3, hIgG4) with highlights of the mutated residues in EW–RVT heterodimeric Fc
variant (K360E/K409WCH3A–Q347R/D399V/F405TCH3B) in comparison with the reported KiH
(T366S/L368A/Y407VCH3A–T366WCH3B) (1, 2), DD–KK (K409D/K392DCH3A–D399K/E356KCH3B)
(3), and HA–TF (S364H/F405ACH3A–Y349T/T394FCH3B) heterodimeric Fc variants, as indicated with
each color code. The inverted arrows on the top indicate the 23 residues located in the homodimeric
CH3-CH3 interface within the distance limit of 4.6 Å, analyzed using the human IgG1 Fc crystal
structure (PDB code 3AVE) (4). The amino acids are numbered by the EU nomenclature (5).
3
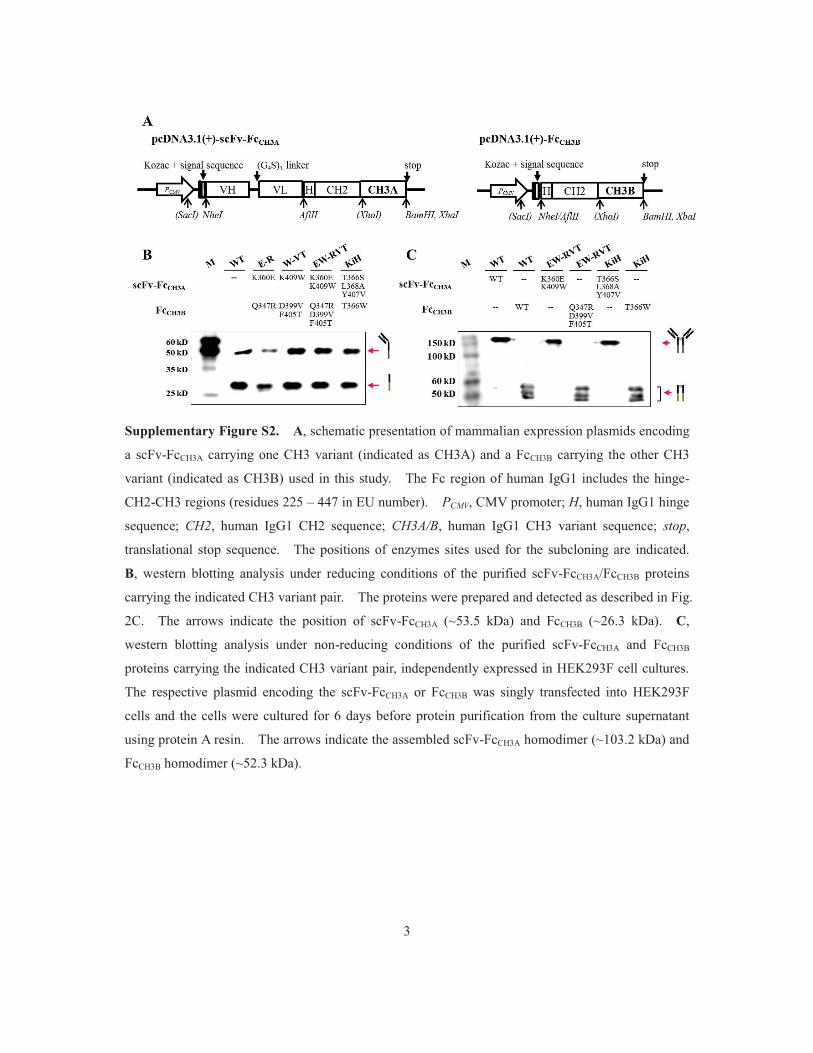
Supplementary Figure S2. A, schematic presentation of mammalian expression plasmids encoding
a scFv-FcCH3A carrying one CH3 variant (indicated as CH3A) and a FcCH3B carrying the other CH3
variant (indicated as CH3B) used in this study. The Fc region of human IgG1 includes the hinge-
CH2-CH3 regions (residues 225 – 447 in EU number). PCMV, CMV promoter; H, human IgG1 hinge
sequence; CH2, human IgG1 CH2 sequence; CH3A/B, human IgG1 CH3 variant sequence; stop,
translational stop sequence. The positions of enzymes sites used for the subcloning are indicated.
B, western blotting analysis under reducing conditions of the purified scFv-FcCH3A/FcCH3B proteins
carrying the indicated CH3 variant pair. The proteins were prepared and detected as described in Fig.
2C. The arrows indicate the position of scFv-FcCH3A (~53.5 kDa) and FcCH3B (~26.3 kDa). C,
western blotting analysis under non-reducing conditions of the purified scFv-FcCH3A and FcCH3B
proteins carrying the indicated CH3 variant pair, independently expressed in HEK293F cell cultures.
The respective plasmid encoding the scFv-FcCH3A or FcCH3B was singly transfected into HEK293F
cells and the cells were cultured for 6 days before protein purification from the culture supernatant
using protein A resin. The arrows indicate the assembled scFv-FcCH3A homodimer (~103.2 kDa) and
FcCH3B homodimer (~52.3 kDa).
4
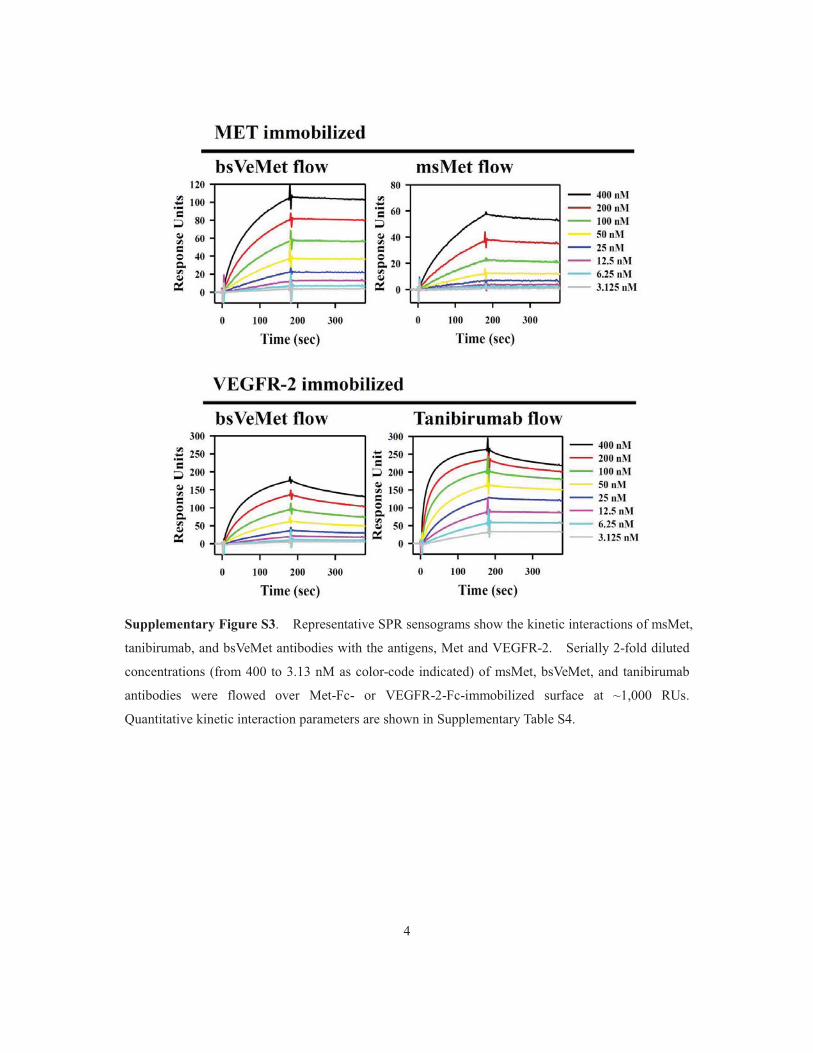
Supplementary Figure S3. Representative SPR sensograms show the kinetic interactions of msMet,
tanibirumab, and bsVeMet antibodies with the antigens, Met and VEGFR-2. Serially 2-fold diluted
concentrations (from 400 to 3.13 nM as color-code indicated) of msMet, bsVeMet, and tanibirumab
antibodies were flowed over Met-Fc- or VEGFR-2-Fc-immobilized surface at ~1,000 RUs.
Quantitative kinetic interaction parameters are shown in Supplementary Table S4.
5
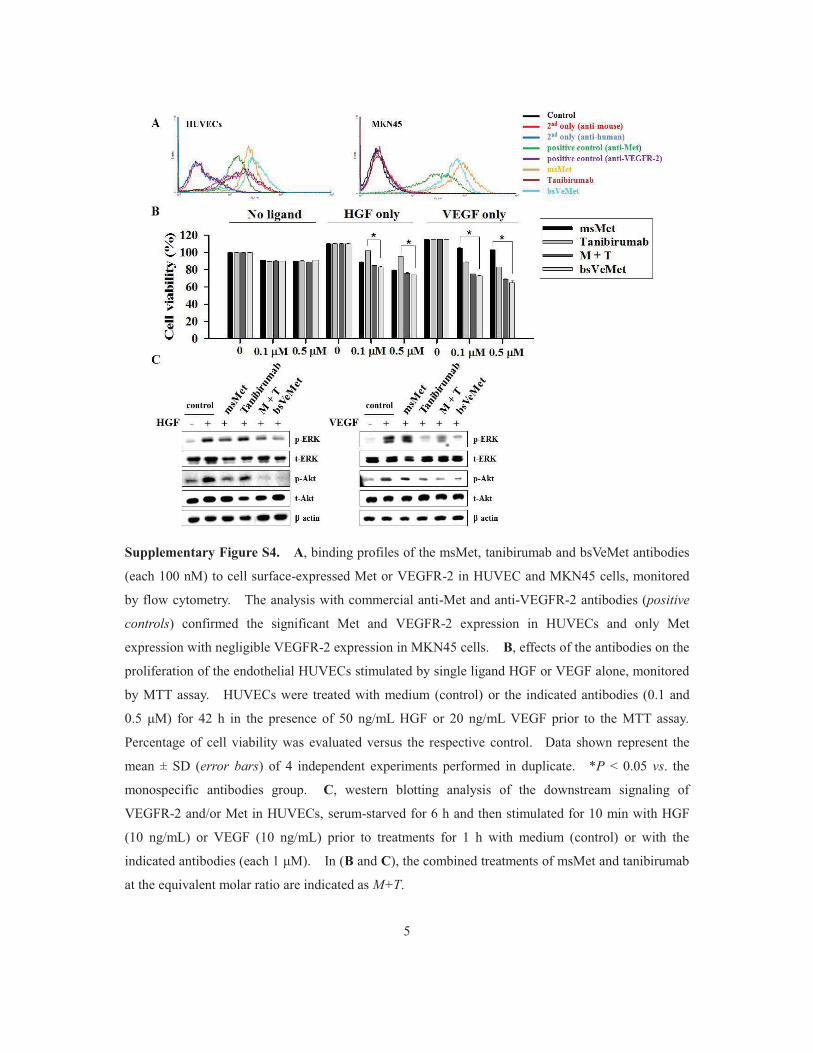
Supplementary Figure S4. A, binding profiles of the msMet, tanibirumab and bsVeMet antibodies
(each 100 nM) to cell surface-expressed Met or VEGFR-2 in HUVEC and MKN45 cells, monitored
by flow cytometry. The analysis with commercial anti-Met and anti-VEGFR-2 antibodies (positive
controls) confirmed the significant Met and VEGFR-2 expression in HUVECs and only Met
expression with negligible VEGFR-2 expression in MKN45 cells. B, effects of the antibodies on the
proliferation of the endothelial HUVECs stimulated by single ligand HGF or VEGF alone, monitored
by MTT assay. HUVECs were treated with medium (control) or the indicated antibodies (0.1 and
0.5 μM) for 42 h in the presence of 50 ng/mL HGF or 20 ng/mL VEGF prior to the MTT assay.
Percentage of cell viability was evaluated versus the respective control. Data shown represent the
mean ± SD (error bars) of 4 independent experiments performed in duplicate. *P < 0.05 vs. the
monospecific antibodies group. C, western blotting analysis of the downstream signaling of
VEGFR-2 and/or Met in HUVECs, serum-starved for 6 h and then stimulated for 10 min with HGF
(10 ng/mL) or VEGF (10 ng/mL) prior to treatments for 1 h with medium (control) or with the
indicated antibodies (each 1 μM). In (B and C), the combined treatments of msMet and tanibirumab
at the equivalent molar ratio are indicated as M+T.
6
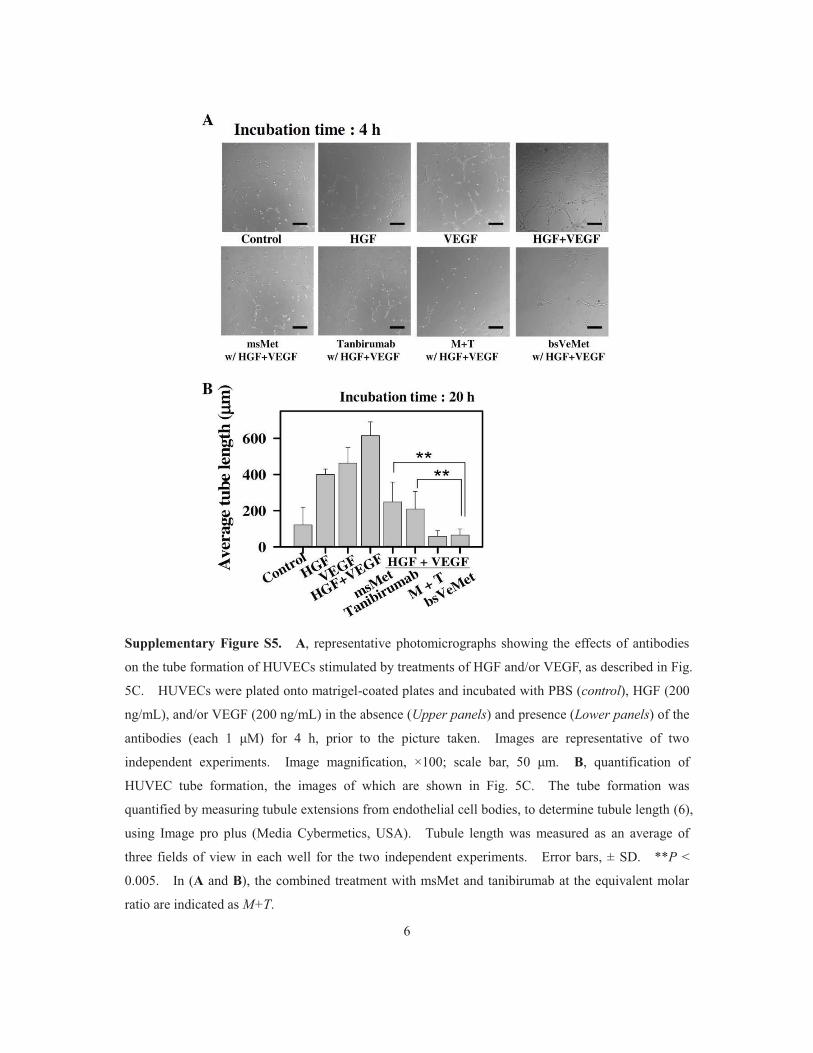
Supplementary Figure S5. A, representative photomicrographs showing the effects of antibodies
on the tube formation of HUVECs stimulated by treatments of HGF and/or VEGF, as described in Fig.
5C. HUVECs were plated onto matrigel-coated plates and incubated with PBS (control), HGF (200
ng/mL), and/or VEGF (200 ng/mL) in the absence (Upper panels) and presence (Lower panels) of the
antibodies (each 1 μM) for 4 h, prior to the picture taken. Images are representative of two
independent experiments. Image magnification, ×100; scale bar, 50 μm. B, quantification of
HUVEC tube formation, the images of which are shown in Fig. 5C. The tube formation was
quantified by measuring tubule extensions from endothelial cell bodies, to determine tubule length (6),
using Image pro plus (Media Cybermetics, USA). Tubule length was measured as an average of
three fields of view in each well for the two independent experiments. Error bars, ± SD. **P <
0.005. In (A and B), the combined treatment with msMet and tanibirumab at the equivalent molar
ratio are indicated as M+T.
7
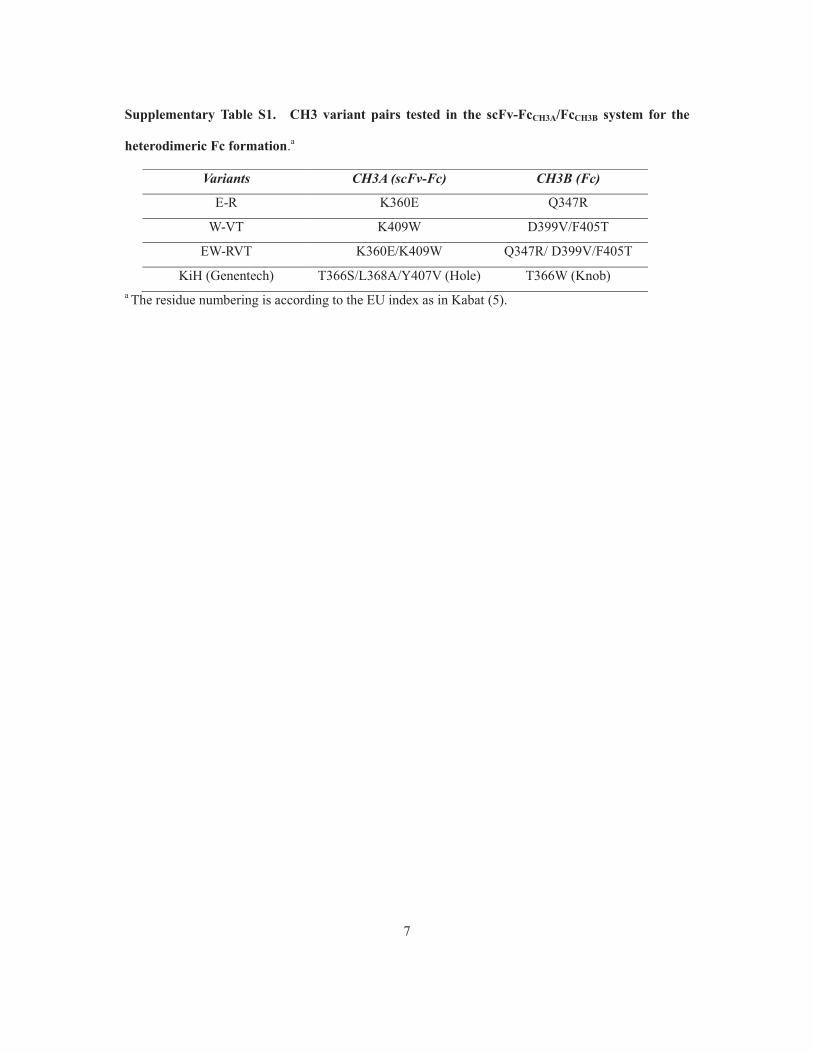
Supplementary Table S1. CH3 variant pairs tested in the scFv-FcCH3A/FcCH3B system for the
heterodimeric Fc formation.a
Variants CH3A (scFv-Fc) CH3B (Fc)
E-R K360E Q347R
W-VT K409W D399V/F405T
EW-RVT K360E/K409W Q347R/ D399V/F405T
KiH (Genentech) T366S/L368A/Y407V (Hole) T366W (Knob) a The residue numbering is according to the EU index as in Kabat (5).
8
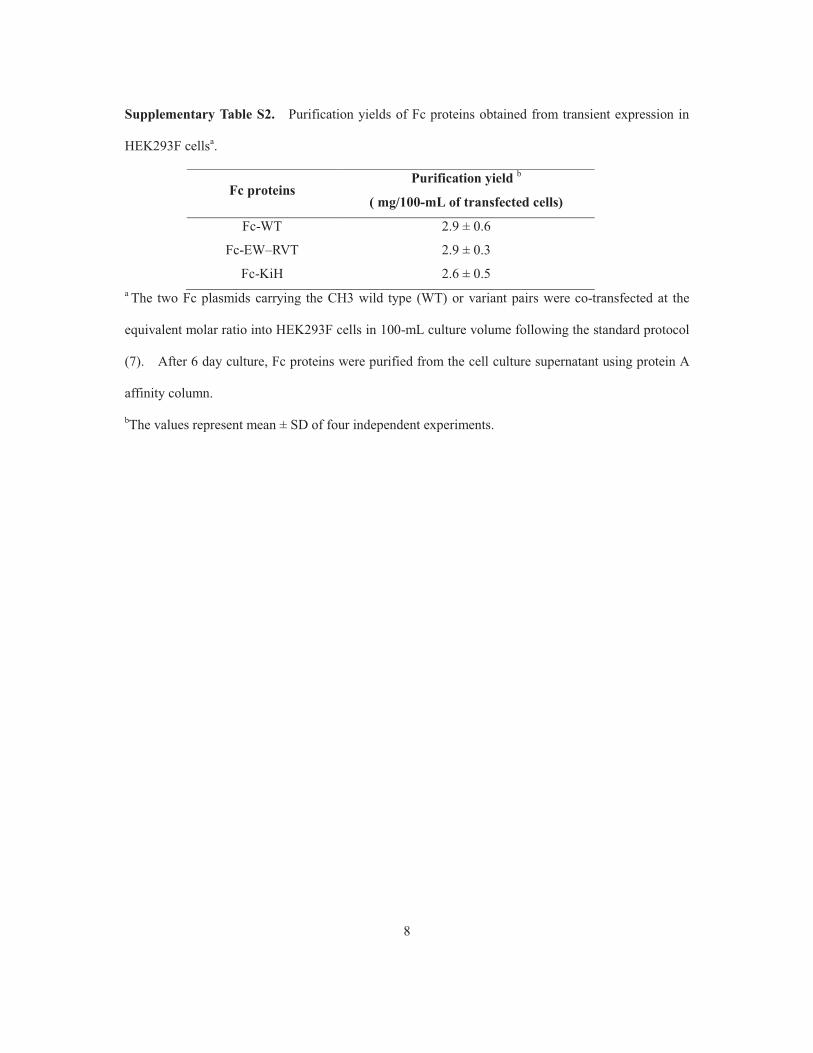
Supplementary Table S2. Purification yields of Fc proteins obtained from transient expression in
HEK293F cellsa.
Fc proteins Purification yield b
( mg/100-mL of transfected cells)
Fc-WT 2.9 ± 0.6
Fc-EW–RVT 2.9 ± 0.3
Fc-KiH 2.6 ± 0.5 a The two Fc plasmids carrying the CH3 wild type (WT) or variant pairs were co-transfected at the
equivalent molar ratio into HEK293F cells in 100-mL culture volume following the standard protocol
(7). After 6 day culture, Fc proteins were purified from the cell culture supernatant using protein A
affinity column.
bThe values represent mean ± SD of four independent experiments.
9
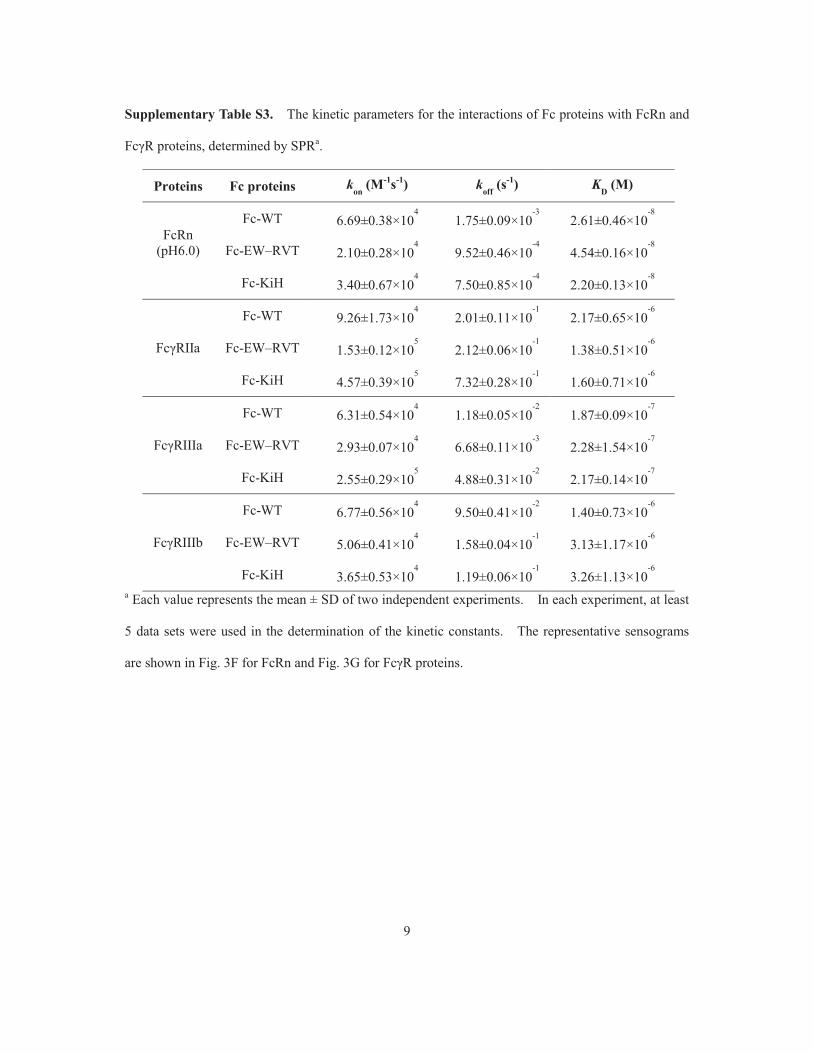
Supplementary Table S3. The kinetic parameters for the interactions of Fc proteins with FcRn and
FcγR proteins, determined by SPRa.
Proteins Fc proteins kon (M-1s-1) koff (s
-1) KD (M)
FcRn (pH6.0)
Fc-WT 6.69±0.38×10⁴ 1.75±0.09×10
-3 2.61±0.46×10
-8
Fc-EW–RVT 2.10±0.28×10⁴ 9.52±0.46×10
-4 4.54±0.16×10
-8
Fc-KiH 3.40±0.67×10⁴ 7.50±0.85×10
-4 2.20±0.13×10
-8
FcγRIIa
Fc-WT 9.26±1.73×10⁴ 2.01±0.11×10
-1 2.17±0.65×10
-6
Fc-EW–RVT 1.53±0.12×10⁵ 2.12±0.06×10
-1 1.38±0.51×10
-6
Fc-KiH 4.57±0.39×10⁵ 7.32±0.28×10
-1 1.60±0.71×10
-6
FcγRIIIa
Fc-WT 6.31±0.54×10⁴ 1.18±0.05×10
-2 1.87±0.09×10
-7
Fc-EW–RVT 2.93±0.07×10⁴ 6.68±0.11×10
-3 2.28±1.54×10
-7
Fc-KiH 2.55±0.29×10⁵ 4.88±0.31×10
-2 2.17±0.14×10
-7
FcγRIIIb
Fc-WT 6.77±0.56×10⁴ 9.50±0.41×10
-2 1.40±0.73×10
-6
Fc-EW–RVT 5.06±0.41×10⁴ 1.58±0.04×10
-1 3.13±1.17×10
-6
Fc-KiH 3.65±0.53×10⁴ 1.19±0.06×10
-1 3.26±1.13×10
-6
a Each value represents the mean ± SD of two independent experiments. In each experiment, at least
5 data sets were used in the determination of the kinetic constants. The representative sensograms
are shown in Fig. 3F for FcRn and Fig. 3G for FcγR proteins.
10
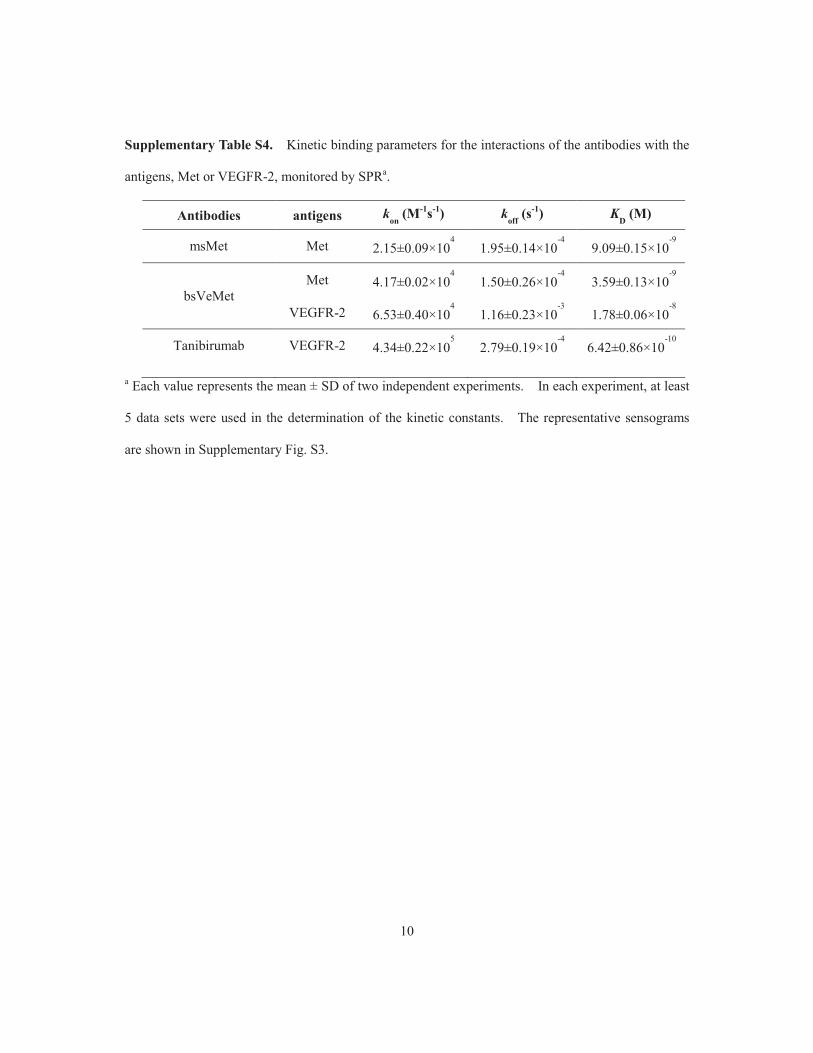
Supplementary Table S4. Kinetic binding parameters for the interactions of the antibodies with the
antigens, Met or VEGFR-2, monitored by SPRa.
Antibodies antigens kon (M-1s-1) koff (s
-1) KD (M)
msMet Met 2.15±0.09×10⁴ 1.95±0.14×10
-4 9.09±0.15×10
-9
bsVeMet Met 4.17±0.02×10
4 1.50±0.26×10
-4 3.59±0.13×10
-9
VEGFR-2 6.53±0.40×10⁴ 1.16±0.23×10
-3 1.78±0.06×10
-8
Tanibirumab VEGFR-2 4.34±0.22×10⁵ 2.79±0.19×10
-4 6.42±0.86×10
-10
a Each value represents the mean ± SD of two independent experiments. In each experiment, at least
5 data sets were used in the determination of the kinetic constants. The representative sensograms
are shown in Supplementary Fig. S3.
11
Supplementary Materials and Methods
Reagents
Recombinant human proteins of FcγRIIa, FcγRIIIa, FcγRIIIb, and human IgG1 Fc-fused extracellular
domain of Met (Met-Fc) were purchased from R&D Systems. Human FcRn protein was purchased
from Sino Biological Inc. Recombinant VEGF165 and HGF proteins were from Promokine
(Heidelberg, Germany). Anti-VEGFR-2 mAb tanibirumab (8) and human IgG1 Fc-fused
extracellular domain of VEGFR-2 (VEGFR-2-Fc) were provided from PharmAbcine (Daejoen,
Korea). Mouse anti-Met, rabbit anti-phospho Met (Tyr1234/1235), rabbit VEGFR-2, rabbit anti-
phospho VEGFR-2 (Tyr1059), rabbit anti-MAPK, rabbit anti-phospho-p44/42 MAPK
(Thr202/Tyr204), rabbit anti-Akt and rabbit anti-phospho-Akt (Ser473) antibodies were from Cell
signaling Technology (Danvers, MA). Rabbit anti-β actin antibody was from Santa Cruz
Biotechnology (Santa Cruz, CA). Other reagents were analytical grade.
Design and evaluation of heterodimeric Fc
We identified candidate mutation pairs at the CH3-CH3 interface (3) and evaluated for the feasibility
to stabilize Fc heterodimerization and destabilize Fc homodimerization based on the structural
analysis of the 2 Å human IgG1 Fc crystal structure (PDB code 3AVE) (4). Each substitution was
modeled in the 3AVE structure by optimizing side-chain conformations of the mutated residue and its
surrounding residues in PyMol software (DeLano Scientific LLC).
Fc heterodimerization was screened using the scFv-FcCH3A/FcCH3B expression system (Fig.
2A) (3). The human IgG1 Fc containing the hinge-CH2-CH3 (residues 225 - 447 in EU numbering
(5)) was subcloned into the mammalian expression vector pcDNA 3.1 (Invitrogen), generating a
FcCH3B expression plasmid (Supplementary Fig. S2A). The human AY4 scFv specifically
recognizing human death receptor 4 (9) was in frame subcloned into the N-terminus of human IgG1
Fc, generating scFv-FcCH3A expression plasmid (Supplementary Fig. S2A). DNAs encoding the
designed CH3 variant pair of CH3A and CH3B were synthesized (Bioneer, Korea) and subcloned into
12
XhoI/BamHI sites of the scFv-FcCH3A (hAY4 scFv-hinge-CH2-CH3A) and FcCH3B (hinge-CH2-CH3B)
plasmids (Fig. 2B and Supplementary S2A).
Construction, expression, and purification of antibodies
For the expression in FcCH3A/FcCH3B heterodimer, EW–RVT and KiH CH3 variant pair was subcloned
using XhoI/BamHI into the corresponding CH3 region of Fc in pcDNA3.1 plasmid (Supplementary
Fig. S2A), generating two plasmids encoding Fc-EW–RVT proteins (hinge-CH2-CH3A (EW) ×
hinge-CH2-CH3B (RVT)) (Fig. 3A).
For the construction of the msMet antibody in the format of Fv-Fc (VH-hinge-CH2-CH3A
(EW) × VL-hinge-CH2-CH3B (RVT)), the variable heavy (VH) and light (VL) sequence from
MetMab (OA5D5, Genentech) (10, 11) was synthesized and subcloned into the N-terminus of Fc
heterodimer (Fig. 4A). For the generation of anti-Met × VEGFR-2 bsVeMet antibody in the format
of scFv-Fc (anti-Met scFv-hinge-CH2-CH3A (EW) × anti-VEGFR-2 scFv-hinge-CH2-CH3B (RVT)),
the anti-Met and VEGFR-2 scFv antibodies, generated by linking VH and VL sequences derived from
the anti-Met OA-5D5 (10, 11) and anti-VEGFR-2 tanibirumab (8), respectively, with a (G4S)3 peptide
linker, were subcloned into the N-terminus of Fc heterodimer (Fig. 4A).
Each pair of the two plasmids encoding Fc heterodimer, msMet and bsVeMet antibodies was
transiently co-transfected at the equivalent molar ratio into HEK293F cells in FreeStyle 293 media,
ranged from 100-ml to 400-ml liter culture volume, following the standard protocol (7). After 6
days of cultures, the antibodies were purified from the culture supernatants as described above and
extensively dialyzed to resuspend in PBSG buffer (PBS plus 10% glycerol, pH 7.4). The antibodies
concentrations were determined using a BCA protein assay (Pierce).
SEC analysis
SEC analysis was performed on the Agilent 1100 high performance liquid chromatography system
using a SuperdexTM 200 10/300 GL (10 mm × 300 mm; GE Healthcare) size exclusion column with a
13
mobile phase of PBS buffer (pH 7.4) at a flow rate 0.5 mL/min, as described previously (9). All
antibodies were analyzed at a concentration of 0.5 mg/mL in a sample volume of 100 μL.
Chromatograms were obtained by monitoring the absorbance at 280 nm. The apparent molecular
mass of samples was estimated by fitting the elution volume into the calibration curve obtained from
running of molecular mass standard markers (alcohol dehydrogenase, 150 kDa; bovine serum albumin,
66 kDa; carbonic anhydrase, 29 kDa) (Sigma-Aldrich).
Far-UV CD spectroscopy
Far-UV CD spectra (195-260 nm) of the purified Fc proteins (0.1 mg/mL in PBS buffer, pH 7.4) were
analyzed on a Chirascan plus (AppliedPhotophysics, UK) at 25°C, in a 0.05 cm path length quartz
cuvette with a step size of 1 nm. Averaged spectra of three scans were corrected for buffer blank
(PBS buffer, pH 7.4) and expressed as mean residue ellipticity [Θ] (deg∙cm2∙dmol-1) (12).
Differential scanning calorimetry (DSC)
DSC was performed using a MicroCal VP-DSC Microcalorimeter (GE Healthcare). Fc proteins (2.5
mg/mL (~50 μM) in 10 mM Tris, 10 mM NaCl buffer (pH 8.0)) were heated from 25°C to 95°C at a
heating rate of 1.5°C/min. After subtraction of the buffer reference scan, sample thermogram was
fitted into a two-state transition model to capture the melting temperatures (Tm) of CH2 and CH3
domains in the Origin 7.0 graphing software supplied by MicroCal.
SPR analysis
Kinetic binding interactions of antibodies or Fc proteins to target proteins (Met-Fc, VEGFR-2-Fc,
FcγRs, and FcRn) were determined at 25°C by a Biacore 2000 SPR biosensor (GE Healthcare), as
described before (13). The target proteins at a concentration of 20 μg/mL in sodium-acetate buffer
(pH 4.0) was immobilized onto the CM5 chip at a level of about 1,000 response units (RUs). Before
loading the analytes, the chip was equilibrated with HBS-EP buffer (10 mM HEPES, 150 mM NaCl,
14
0.005% v/v surfactant P20, pH 7.4). Antibodies or Fc proteins in HBS-EP buffer was injected into
flow cell at a flow rate of 30 μL/min for 3 min, which was followed by the dissociation phase by
injection of HBS-EP buffer at 30 μL/min for 3 min. Between cycles, flow cell were regenerated
with 1 M NaCl, 20 mM NaOH buffer (Met-Fc, VEGFR-2-Fc binding assay), 100 mM NaCl, 2 mM
NaOH buffer (FcγRs binding assay), or pH 8.0 HBS-EP buffer (FcRn binding assay) at 30 μL/min for
1 min. Association (kon) and dissociation (koff) rate constants were determined by the 1:1 binding
model using the BIAevaluation software (13).
In the assay monitoring the simultaneous binding interactions, bsVeMet (100 nM) was first
flowed over VEGFR-2-Fc-immobilized surface (~1000 RU) at 30 μL/min for 3 min and then, without
the dissociation phase, a second protein (Met-Fc or VEGFR-2-Fc at 100 nM) in HBS-EP buffer was
immediately injected at 30 μL/min for 3 min (13).
Sandwich ELISA
The indicated antibodies (3 μM) were first incubated for 1 h with plate-coated VEGR2-Fc (1
μg/well) in 96-well plates (SPL, Korea). After washing with PBST (PBS plus 0.1% Tween-20),
serially diluted 6×His-tagged human Met-Fc (0.16 – 100 nM) was added and incubated at room
temperature for 1 h. Bound Met-Fc protein was detected using mouse anti-His tag antibody (IG
Therapy, Korea) and alkaline phosphatase conjugated goat anti-mouse antibody with the substrate of
p-nitrophenyl phosphate (Sigma-Aldrich) (13). Absorbance at 405 nm was read with a VersaMax
microplate reader (Molecular Devices, Crawley, UK).
Flow cytometry
Cell surface expression levels of Met and VEGFR-2 were determined by flow cytometry after indirect
immunofluorescent labeling using mouse anti-Met (Cell Signaling) and anti-VEGFR-2 antibody
(Abcam), respectively, followed by FITC-conjugated anti-mouse IgG (PIERCE) (14). Binding of
msMet, tanibirumab, and bsVeMet antibodies to HUVEC and MKN45 cells were determined by
15
labeling cells with 100 nM antibodies for 1 h and then secondary labeling with FITC-conjugated anti-
human IgG Fc antibody (Sigma) before flow cytometric analysis.
Cell proliferation assay
HUVECs, seeded at a density of 0.4 × 10⁴ cells/well in 96-well plates, were incubated at 37°C in
complete media for 24 h. Then, cells were starved using EBM-2 medium for 4 h prior to treatments
of HGF (50 ng/mL), VEGF (20 ng/mL), and/or the antibodies, as specified in the figure legend.
MKN45 cells, seeded at a density of 0.6 ×10⁴ cells/well in 96-well plates, were incubated at 37 °C in
complete media for 24 h. Then, cells were serum-starved using free FBS RPMI1640 for 6 h before
treatments of HGF (50 ng/mL) and/or the antibodies, as specified in the figure legend. Cell viability
was analyzed using the MTT assay kit (Sigma-Aldrich) and the results are presented as the percentage
of viable cells versus the medium-treated control or the corresponding control (12, 14).
Western blots
HUVECs were cultured for 6 h in serum-free medium, then pretreated with antibodies (0.3 μM) at
37°C for 1 h, and then with or without HGF (10 or 20 ng/mL) and/or VEGF (10 or 20 ng/mL) at the
indicated concentrations for 10 min (15). MKN45 cells were cultured overnight in serum-free
medium, then pretreated with antibodies (0.3 μM) at 37°C for 2 h, and then treated with or without
HGF (20 ng/mL) for 10 min. Whole cell lysates were extracted using RIPA buffer (Biosesang), and
protein concentrations were determined using Bicinchoninic Acid (BCA) Kit (Sigma). Western
blotting for cell lysates treated as specified in figure legends was performed following the standard
procedure (14). Proteins were visualized using a PowerOpti-ECL western blotting detection reagent
(Animal Genetics, Inc. Korea) and an ImageQuant LAS 4000 mini (GE Healthcare, Piscataway, NJ)
(16). Equal amount of cell lysates were analyzed by western blotting with β-actin as a loading
control.
16
Animal experiments
All animal experiments were evaluated and approved by the Animal and Ethics Review
Committee of Ajou University and performed according to the guidelines established by the
Institutional Animal Care and Use Committee. Female BALB/c athymic nude mice, aged 4 weeks
and weighed between 15-20 g, were purchase from NARA bio (Korea). MKN45 cells (5 × 10⁶ cells
per mouse) were inoculated subcutaneously in the right thigh of nude mice. When the mean tumor
size reached about ~100 mm3 (after 7 day growth), mice were randomized into each groups (n = 8 per
group) and administered intravenously via the tail vein with antibodies at the equivalent molar amount
(200 μL of 6.25 μM per injection) as specified in the figure legends. Control mice were given equal
volume of PBS. The tumor size and body weight were measured thrice per week using calipers, and
tumor volumes were calculated by the formula ½ × length × width2 (12). Animals were sacrificed if
tumor size exceeded 2,000 mm3. The statistical significance was evaluated by one-way analysis
followed by two-tailed student t tests on Excel Software (Microsoft Inc.).
Immunofluorescence of tumor tissues
A single, equivalent molar dose of antibodies (200 μL of 3.1 μM per injection) was intravenously
injected into mice carrying MKN45 xenografted tumors with an average size of ~7-8 mm in diameter.
Tumor tissues were harvested 5 or 24 h postinjection. Tumor preparation and staining of the
cryosections were performed as described before (17, 18). Briefly, the excised tumors from mice
were fixed in 4% Paraformaldehyde (PFA) overnight at 4°C, cryo-protected in 30% sucrose for 10 h
and then frozen in Tissue-Tek OCT (Optimal Cutting Temperature) embedding medium. For
immunofluorescence staining, cryosections were prepared at 10 μm thickness and incubated with
blocking solution (2% BSA in PBS) for 1 h at 25°C. Tissue sections were stained with rat anti-
mouse CD31 mAb (BD Biosciences) at 4°C overnight, washed 2× with PBST (PBS containing 0.1%
Tween20) and then stained with goat anti-rat TRITC-conjugated antibodies (Millipore) and FITC-
conjugated anti-human IgG Fc antibody (Sigma) at 25°C for 1.5 h. Slides were then washed 3× with
17
PBST and then mounted in Vectashield (mounting medium with DAPI, Vector Laboratories,
Burlingame, CA). Tissue sections were examined by Ziess LSM710 systems with ZEN software
(Carl Zeiss). Fluorescence in each tissue was quantified with Image J (National Institutes of Health,
USA).
Supplementary References
1. Atwell S, Ridgway JB, Wells JA, Carter P. Stable heterodimers from remodeling the domain
interface of a homodimer using a phage display library. Journal of molecular biology. 1997;270:26-35.
2. Ridgway JB, Presta LG, Carter P. 'Knobs-into-holes' engineering of antibody CH3 domains
for heavy chain heterodimerization. Protein Eng. 1996;9:617-21.
3. Gunasekaran K, Pentony M, Shen M, Garrett L, Forte C, Woodward A, et al. Enhancing
antibody Fc heterodimer formation through electrostatic steering effects: applications to bispecific
molecules and monovalent IgG. J Biol Chem. 2010;285:19637-46.
4. Matsumiya S, Yamaguchi Y, Saito J, Nagano M, Sasakawa H, Otaki S, et al. Structural
comparison of fucosylated and nonfucosylated Fc fragments of human immunoglobulin G1. Journal
of molecular biology. 2007;368:767-79.
5. Edelman GM, Cunningham BA, Gall WE, Gottlieb PD, Rutishauser U, Waxdal MJ. The
covalent structure of an entire gammaG immunoglobulin molecule. Proceedings of the National
Academy of Sciences of the United States of America. 1969;63:78-85.
6. Xin X, Yang S, Ingle G, Zlot C, Rangell L, Kowalski J, et al. Hepatocyte growth factor
enhances vascular endothelial growth factor-induced angiogenesis in vitro and in vivo. Am J Pathol.
2001;158:1111-20.
7. Backliwal G, Hildinger M, Chenuet S, Wulhfard S, De Jesus M, Wurm FM. Rational vector
design and multi-pathway modulation of HEK 293E cells yield recombinant antibody titers exceeding
1 g/l by transient transfection under serum-free conditions. Nucleic acids research. 2008;36:e96.
8. Lee SH. Tanibirumab (TTAC-0001): a fully human monoclonal antibody targets vascular
endothelial growth factor receptor 2 (VEGFR-2). Arch Pharm Res. 2011;34:1223-6.
9. Lee SH, Park DW, Sung ES, Park HR, Kim JK, Kim YS. Humanization of an agonistic anti-
death receptor 4 single chain variable fragment antibody and avidity-mediated enhancement of its cell
death-inducing activity. Mol Immunol. 2010;47:816-24.
10. Martens T, Schmidt NO, Eckerich C, Fillbrandt R, Merchant M, Schwall R, et al. A novel
one-armed anti-c-Met antibody inhibits glioblastoma growth in vivo. Clinical cancer research : an
18
official journal of the American Association for Cancer Research. 2006;12:6144-52.
11. Jin H, Yang R, Zheng Z, Romero M, Ross J, Bou-Reslan H, et al. MetMAb, the one-armed
5D5 anti-c-Met antibody, inhibits orthotopic pancreatic tumor growth and improves survival. Cancer
Res. 2008;68:4360-8.
12. Lee CH, Park KJ, Sung ES, Kim A, Choi JD, Kim JS, et al. Engineering of a human kringle
domain into agonistic and antagonistic binding proteins functioning in vitro and in vivo. Proceedings
of the National Academy of Sciences of the United States of America. 2010;107:9567-71.
13. Lee CH, Park KJ, Kim SJ, Kwon O, Jeong KJ, Kim A, et al. Generation of bivalent and
bispecific kringle single domains by loop grafting as potent agonists against death receptors 4 and 5.
Journal of molecular biology. 2011;411:201-19.
14. Sung ES, Park KJ, Choi HJ, Kim CH, Kim YS. The proteasome inhibitor MG132 potentiates
TRAIL receptor agonist-induced apoptosis by stabilizing tBid and Bik in human head and neck
squamous cell carcinoma cells. Exp Cell Res. 2012;318:1564-76.
15. Lu KV, Chang JP, Parachoniak CA, Pandika MM, Aghi MK, Meyronet D, et al. VEGF
inhibits tumor cell invasion and mesenchymal transition through a MET/VEGFR2 complex. Cancer
Cell. 2012;22:21-35.
16. Kim A, Shin TH, Shin SM, Pham CD, Choi DK, Kwon MH, et al. Cellular internalization
mechanism and intracellular trafficking of filamentous M13 phages displaying a cell-penetrating
transbody and TAT peptide. PloS one. 2012;7:e51813.
17. Lee CM, Tannock IF. The distribution of the therapeutic monoclonal antibodies cetuximab
and trastuzumab within solid tumors. BMC cancer. 2010;10:255.
18. Rhoden JJ, Wittrup KD. Dose dependence of intratumoral perivascular distribution of
monoclonal antibodies. Journal of pharmaceutical sciences. 2012;101:860-7.