Embed Size (px)
Citation preview

The Biodiesel Industry: Feedstocks, Capacity, and Subsidies
Chelsea Ruth Conover
April 25, 2008
Master of Environmental Management
Lincoln Pratson, Advisor
Masters project submitted in partial fulfillment of the requirements for the Master of
Environmental Management degree in the Nicholas School of the Environment and Earth
Sciences of Duke University
2008

ii
Acknowledgments
Many thanks are due to my family, friends and mentors who have helped me develop my
passion for the environment and who have made the completion of my education possible.
Special thanks to my advisor Lincoln Pratson for all of his support, patience and ideas through
the process of this study. Additional thanks goes to the Climate Change Policy Partnership for
providing financial support, and especially to Christopher Galik for helping me to focus my ideas
and remain mentally stable. Lastly, thanks to Bill Somerlot for teaching me the most important
lesson of all: how to survive in the absence of the bliss of ignorance by maintaining a sense of
humor and a focus on what matters most.

iii
Abstract
Concerns over global climate change, national security and limited petroleum resources
have heightened US interest in renewable fuels in recent years. Biodiesel made from plant oils
and animal fats is one such alternative. In 2007, the United States passed the Energy
Independence and Security Act, setting new goals for the production of biofuels. In order to
analyze the ability of the biodiesel infrastructure to meet the Renewable Fuel Standards outlined
in the recently-passed Energy legislation and to determine the importance of current government
subsidies in meeting these standards, I examined current and potential demand for biodiesel,
possible feedstocks, and capital costs. Current US biodiesel refinery capacity exceeds the amount
of production mandated, but production has only reached approximately one fourth of this
capacity. With future capacity expected to double by 2009, biodiesel refineries will be able to
produce the required biodiesel by 2012 at prices that are competitive with conventional diesel
assuming subsidies remain above $0.72. The importance of the subsidy and the potential of the
biodiesel industry are both based on assumptions about two volatile prices: the price of vegetable
oils and the price of diesel. These prices are the key factors in determining the success of the
industry and the public and private costs of meeting the Renewable Fuel Standard.

iv
Table of Contents
Acknowledgements ………………………………………………………………………...……..ii
Abstract.………………………………………………………………….……………………….iii
List of Tables.……………………………………………………………….…………………….v
List of Figures.……………………….……………………………………………………………v
Introduction.…………………………………………………………………………..…………...1
Biodiesel Background.…………………………………………………………………………….1
Current Biodiesel Market.……………………………………………………..…………………..2
Current Diesel Market……………………………………………………………………………..5
Diesel Production………………………………………………………………………….5
Diesel Consumption……………………………………………………………………….9
Diesel Uses……………………………………………………………………………….13
Prices…………………………………………………………………………………………......15
Feedstock Analysis………………………………………………………………………………17
Soybeans…………………………………………………………………………………18
Canola……………………………………………………………………………………25
Palm……………………………………………………………………………………...27
Sunflower Seed…………………………………………………………………………..27
Cottonseed………………………………………………………………………………..29
Coconut…………………………………………………………………………………..30
Corn………………………………………………………………………………………31
Peanut…………………………………………………………………………………….31
Animal Fats………………………………………………………………………………33
Prices……………………………………………………………………………………..36
Supply Curve Factors…………………………………………………………………………….37
Capacity Supply Models…………………………………………………………………………43
Conclusions………………………………………………………………………………………49
References………………………………………………………………………………………..51
Appendix…………………………………………………………………………………………53

v
List of Tables
Table 1: Biodiesel feedstocks, production and targets for selected countries………………….....5
Table 2: Amount of biodiesel produced from different feedstock in 2007………………………39
List of Figures
Figure 1: European biodiesel consumption………………………………………………………..4
Figure 2: Biodiesel production in the United States………………………………………………4
Figure 3: Diesel production by top country/region 2005………………………………………….6
Figure 4: Average percent change in diesel production since 2000………………………………7
Figure 5: Diesel as a percent motor fuel produced………………………………………………..8
Figure 6: Diesel demand by top country region 2005……………………………………………..9
Figure 7: Average percent change in diesel demand since 2000………………………………...11
Figure 8: Diesel as percentage of motor oil used………………………………………………...12
Figure 9: US diesel end uses……………………………………………………………………..14
Figure 10: Nominal price of diesel fuels…………………………………………………………16
Figure 11: Real prices of diesel fuels…………………………………………………………….16
Figure 12: Breakdown of the cost of one gallon of biodiesel……………………………………18
Figure 13: World soybean production and contribution by nation………………………………19

vi
Figure 14: Top soybean import/export nations…………………………………………………..20
Figure 15: World production of the soybean oil…………………………………………………21
Figure 16: World imports and exports of soybean oil…………………………………………...22
Figure 17: Domestic uses of soybean oil………………………………………………………...23
Figure 18: US Bioenergy Program: Reported gallons produced (log scale)…………………….24
Figure 19: US Bioenergy Program: Reported biodiesel production from top feedstocks………25
Figure 20: World canola production……………………………………………………………..26
Figure 21: Top sunflower seed importing nations……………………………………………….29
Figure 22: Top world producer of cottonseed……………………………………………………30
Figure 23: US supply and disappearance of peanuts…………………………………………….33
Figure 24: World production of lard (excluding China)…………………………………………35
Figure 25: US consumption of lard (edible and inedible)……………………………………..…35
Figure 26: Production and distribution of lard in the US………………………………………...36
Figure 27: Price of feedstocks……………………………………………………………………37
Figure 28: 2007 production stack………………………………………………………………..40
Figure 29: Biodiesel refinery cost by plant capacity…………………………………………….41
Figure 30: Capital cost of biodiesel per gallon of capacity……………………………………...42

vii
Figure 31: Current biodiesel capacity……………………………………………………………44
Figure 32: Minimum and maximum production costs for multi-feed plants…………………….45
Figure 33: Current and future capacity, 2007 prices……………………………………………..46
Figure 34: Current and future capacity, 2008 prices……………………………………………..47
Figure 35: Forecasted subsidy requirements……………………………………………………..48
Appendix Figure 1: 2005 biodiesel production by country……………………………………...53
Appendix Figure 2: Top biodiesel producing countries in 2005………………………………...53
Appendix Figure 3: Largest diesel suppliers by country/region…………………………………54
Appendix Figure 4: Diesel demand by highest demanding countries/regions…………………..55
Appendix Figure 5: Diesel percent share of passenger vehicle market………………………….56
Appendix Figure 6: Diesel passenger vehicle registration by type………………………………56
Appendix Figure 7: US diesel consumption by end use………………………………………..57
Appendix Figure 8: United States domestic consumption and crush……………………………57
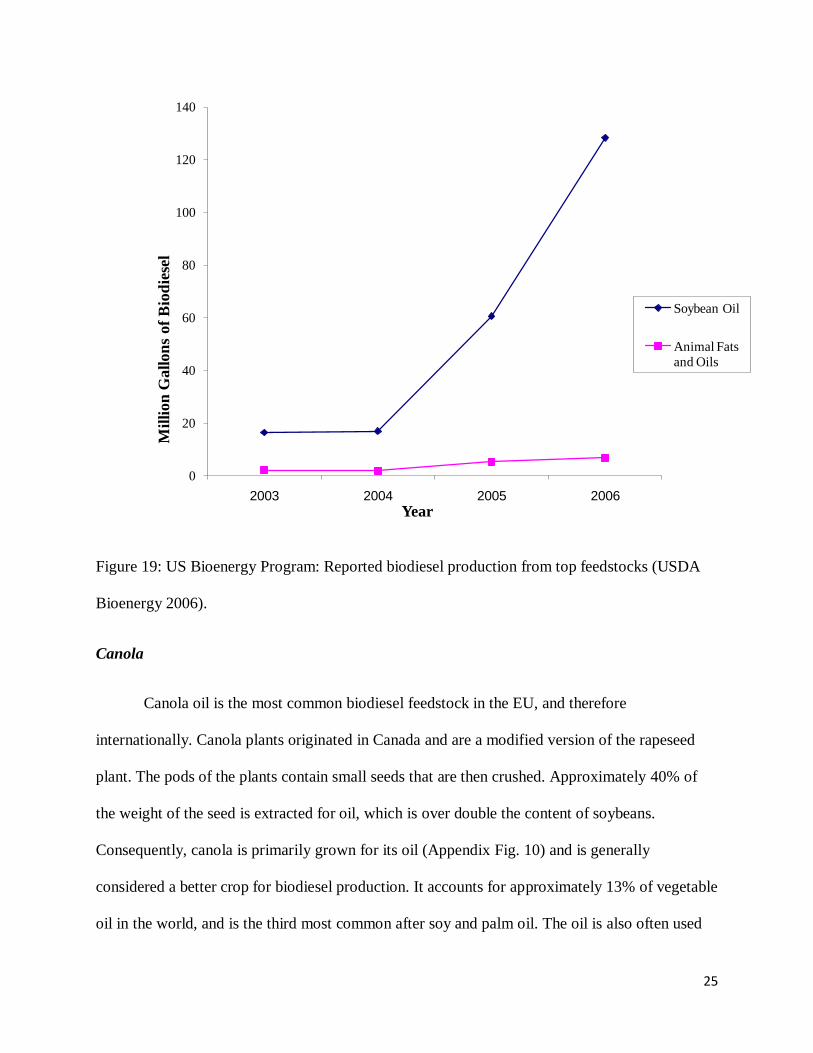
Appendix Figure 9: Destinations of US exports of soybean oil…………………………………58
Appendix Figure 10: World production and crush of canola……………………………………59
Appendix Figure 11: US Acquisition and disappearance of canola……………………………..59
Appendix Figure 12: World production of palm oil……………………………………………..60

viii
Appendix Figure 13: Major palm oil exporting nations…………………………………………61
Appendix Figure 14: World production of sunflower oil………………………………………..62
Appendix Figure 15: Top world producers of sunflower seed…………………………………..63
Appendix Figure 16: US Sunflower seed oil…………………………………………………….64
Appendix Figure 17: United States crush of sunflower seed…………………………………….64
Appendix Figure 18: Top coconut oil producers………………………………………………...65
Appendix Figure 19: Top coconut oil consumers………………………………………………..65
Appendix Figure 20: Supply and disappearance of coconut oil in the US………………………66
Appendix Figure 21: US corn oil supply and disappearance…………………………………….67
Appendix Figure 22: Top producers of peanuts (in the shell)…………………………………...68
Appendix Figure 23: World production of tallow and grease…………………………………...68
Appendix Figure 24: 2005 top producers of lard………………………………………………...69

1
Introduction
Biodiesel is an increasingly popular fuel associated with environmental and international
security benefits. The objectives of this project were to determine the current and potential
demand for biodiesel in the United States and to examine the factors that impact price and
supply. These objectives required an in-depth analysis of potential feedstocks. Using this data, a
supply curve was created in order for two additional objectives. The supply curve was used to
analyze the ability of the biodiesel infrastructure to meet Renewable Fuel Standards set by the
United States government and to determine the importance of current government subsidies in
meeting these standards. The capacity of the biodiesel industry is large enough to supply the
mandated amounts of biodiesel; however, under most price scenarios, government subsidies
must remain in order to creative a competitive market for biodiesel.
Biodiesel Background
Petroleum is the largest energy source in the United States, accounting for 39.8% of
primary energy consumption, 69% of which goes to transportation. The transportation sector is
completely dependent on petroleum products, at 98% of transportation fuels directly produced
from petroleum (EIA 2006). Recent growing concern over global climate change, national
security and limited petroleum resources has made the need for alternative transportation fuels
obvious, drawing public attention to biofuels. The most recent energy bill in the United States,
The Energy Independence and Security Act, has mandated certain quantities of various biofuels
to be produced within the United States. Biodiesel is arguably the most attractive biofuel option,
because it can be used directly in diesel engines and other existing diesel infrastructure such as

2
pipelines and distribution trucks. Diesel engines use 20-40% less fuel per mile traveled than
similar gasoline engines (EERE 2007), and using biodiesel does not compromise this efficiency
since B100 (or 100% biodiesel) has only 8.65% less energy content than conventional diesel.
B20 (20% biodiesel) or B2 is often used instead of B100, and these fuels have even higher
energy contents, at only 1.73% and 0.17% less than conventional diesel, respectively (NBB
2005).
Though biodiesel can be used in existing infrastructure, like any fuel, it must meet certain
standards in order to avoid damage to equipment. ASTM International, a technical standards
development organization (ASTM 2008), has set fuel quality specifications for biodiesel and all
biodiesel blends. Biodiesel blends of less than 5% are incorporated into regular diesel standards
under ASTM D975 specifications, and all other blends must meet ASTM D6751 specifications
(NBB Aggressive 2007). In addition to these standards, BQ-9000 is a quality assurance program
for biodiesel that began accrediting producers in 2004. BQ-9000 is a combination of
International Organization for Standardization documentation requirements and testing protocols
that are required under ASTM D6751 (Jessen 2006). Initial accreditation costs over $3000, and
as of April 2008 there were nine accredited biodiesel marketers and twenty accredited biodiesel
refiners (BQ-9000 2008). Fuel standards are important because biodiesel is in direct competition
with conventional diesel, and if low quality fuel is causing maintenance problems with vehicles,
then biodiesel is less cost competitive with diesel.

3
Current Biodiesel Market
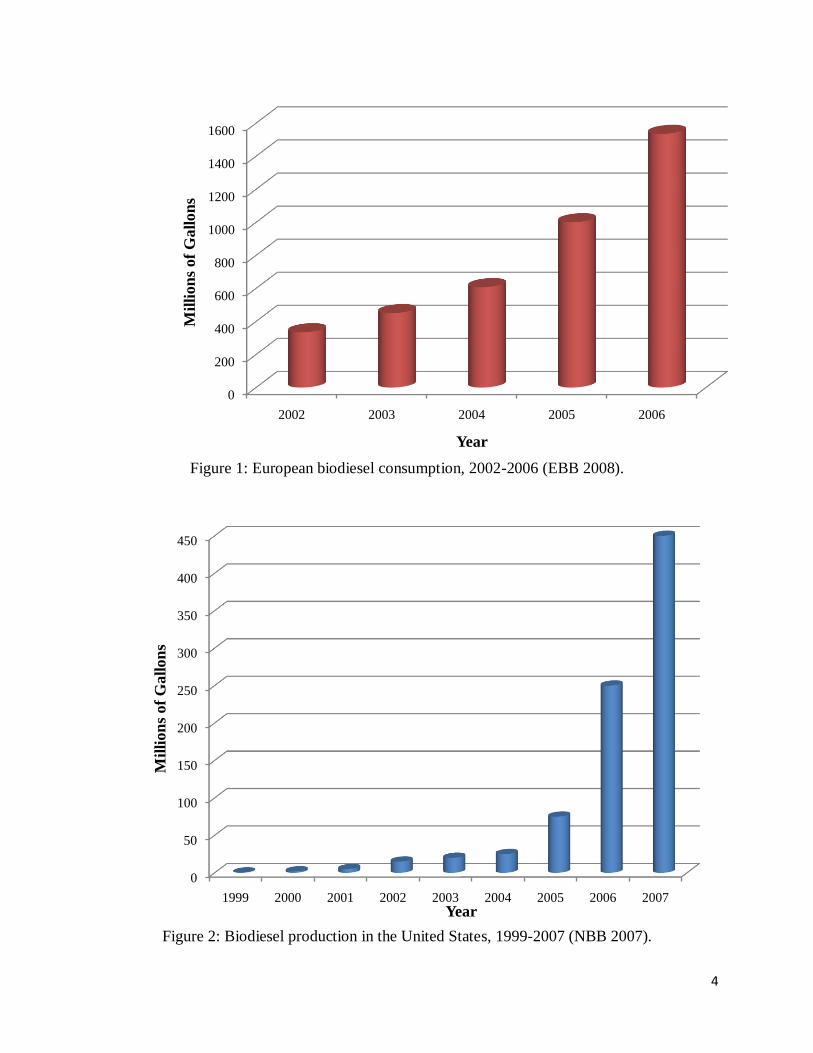
The European Union has been leading the world in biodiesel production, reaching over
1.5 billion gallons in 2006 (Fig. 1), whereas in the United States, biodiesel has only very recently
made an appearance in the market. In 2005, US production jumped to 75 million gallons of
production, up from 25 million in the previous year. This quantity has continued to rise, with
biodiesel estimated at 450 million gallons of production in the United States alone in 2007 (Fig.
2). Despite the fast growth the industry has been experiencing, biodiesel is still concentrated in
only a few regions of the world. EU nations produce and consume the largest portion in the
world at about 85% in 2005. Of this production, Germany refines the most at approximately 53%
(Appendix Fig. 1). The industry is much more concentrated than the diesel industry, with four
nations producing 75% of the biodiesel in 2005. The top producing countries in order are
Germany, France, Italy, and the United States (Appendix Fig. 2), though Brazil is expected to
reach these levels of production in the next few years (Thurmond 2007). Each country uses
different feedstocks depending on what is available and cost efficient in that region. EU nations
use mostly canola oil, along with small amounts of sunflower seed oil and soybean oil. The
United States uses soybean oil as its main feedstock but also uses waste vegetable oil, animal
fats, canola oil, and small amounts of other vegetable oils. Table 1 below shows the primary
feedstocks and production goals of major biodiesel producing countries.
4
Figure 1: European biodiesel consumption, 2002-2006 (EBB 2008).
Figure 2: Biodiesel production in the United States, 1999-2007 (NBB 2007).
0
200
400
600
800
1000
1200
1400
1600
2002 2003 2004 2005 2006
Mil
lio
ns
of
Ga
llo
ns
Year
0
50
100
150
200
250
300
350
400
450
1999 2000 2001 2002 2003 2004 2005 2006 2007
Mil
lion
s of
Gall
on
s
Year

5
Table 1: Biodiesel feedstocks, production, and targets for selected countries (Coyle 2007)
Country/Region Feedstock(s) 2007 Estimated
Production (MMg)
Blending Targets
Brazil Castor Seed 64.1 2% blend of
biodiesel in early
2008; 5 % by 2013
EU Rapeseed (Canola,
Sunflower, Soybean
1,731.9 5.75% biofuel share
of transportation
fuel by 2010; 10%
by 2020
Indonesia Palm Oil, Jatropha 107.7 10% biofuel by
2010
Malaysia Palm Oil 86.8 5% biodiesel blend
used in public
vehicles
Thailand Palm Oil, Recycled
Vegetable Oil
68.8 Palm biodiesel to
replace 10% of
diesel demand by
2012
United States Soybeans, Other
Oilseeds, Animal
Fats, Recycled Fats
and Oils
444.5 1 billion gallons of
biodiesel by 2012
Current Diesel Market
Diesel Production
Because biodiesel is a replacement fuel for fossil fuel diesel, the most appropriate way to
analyze the market potential for biodiesel is to examine the diesel market. Diesel is produced
from crude oil at refineries around the world, reaching over 1 billion tonnes or 364 billion
gallons in 2005. Seventy-five percent of this diesel is produced in only 10 countries/regions.
OECD European nations lead the world in production, representing almost 24% of the world

6
total (OECD 2007). Other top diesel refining countries in order include China, Russia, Japan,
India, Brazil, Saudi Arabia, Korea, and Canada (Fig. 3).
Figure 3: Diesel production by top country/region, 2005 (OECD 2007).
On average, world production of diesel has been increasing in recent years, and this is
also true for most of the top diesel refining nations. Korea, Japan, and Canada have all stayed at
about the same production levels (Appendix Fig. 3). The 5-year running average of all nations
shows that the world has been increasing production at about 2.6% each year (Fig. 4). While
most countries have been increasing their diesel production at a relatively steady rate, China’s
production has increased noticeably starting in 2003. They have been well above the 2.6% level,
0 1000 2000 3000 4000 5000 6000
OECD Europe
Canada
Japan
Korea
United States
Brazil
People's Republic of China
India
Russia
Saudi Arabia
Thousands of Barrels/Day

7
increasing at an average of 9.4% each year since 2000. Brazil, Russia, Saudi Arabia and India
have also been increasing production at rates higher than the world average. Japan is the only
nation out of the top producers that has actually decreased their production, though this has only
been a 0.7% decrease.
Figure 4: Average percent change in diesel production since 2000 (OECD 2007).
Diesel and gasoline are the two main petroleum products that can be used for
transportation in common personal and road vehicles. In the US, gasoline is overwhelmingly the
most important of these transportation fuels, account for over 60% of fuel consumption (EIA
-2
0
2
4
6
8
10
OE
CD
Eu
rop
e
Can
ada
Jap
an
Kore
a
Un
ited
Sta
tes
Bra
zil
Peo
ple
's R
epu
bli
c of
Ch
ina
Ind
ia
Ru
ssia
Sau
di A
rabia
Worl
d
Per
cen
t C
han
ge

8
2001). Conversely, in most other major diesel-producing areas, diesel dominates the motor fuel
production. India produces the highest percentage of diesel fuel for transportation, producing just
above 80%. The world percentage production has been at about 55% diesel for transportation
fuels, with only the United States and Canada producing at a lower percentage; however Canada
has been increasing their percentage of diesel production since 2000, as has China, OECD
Europe, Korea and Brazil (Fig. 5). This signifies an increased use of diesel engines as compared
to use of gasoline engines in these regions.
Figure 5: Diesel as percent motor fuel produced (OECD 2007).
30
40
50
60
70
80
90
2000 2001 2002 2003 2004 2005
% D
iese
l
Year
OECD Europe
Japan
United States
Brazil
People's Republic
of ChinaIndia
Russia
World

9
Diesel Consumption
The top producing regions of fossil fuel diesel are, in large part, the same regions that
consume the diesel fuel. In 2005, the world consumed over 94 billion gallons of diesel per day,
with 75% of this consumption coming from 12 nations. Leading these in demand are OECD
European countries with 6.1 million barrels of consumption per day. Other top diesel consuming
countries in order include the United States, China, Japan, India, Brazil, Indonesia, Canada,
Russia, Saudi Arabia and Korea (Fig. 6). The similarity between the top refining and top
demanding areas demonstrates the fact that most countries import their oil as crude oil and refine
it domestically. For example, in 2006 the United States imported 66% of its crude oil but only
5.7% of its diesel (Durbin 2006).
Figure 6: Diesel demand by top country/region, 2005 (OECD 2007).
0 1000 2000 3000 4000 5000 6000 7000 8000
Canada
United States
OECD Europe
Japan
Korea
Brazil
Russia
Iran Islamic Republic
Saudi Arabia
India
Indonesia
China People's Republic
Thousands of Barrels/Day

10
Total world demand for diesel has been increasing steadily since 2001, which has also
been the case for most of the top demanding countries (Appendix Fig. 4). The exception to this is
Japan and India, both of which have begun to decrease their demand. OECD European countries
experienced a sharp increase in demand in 2004, and then demand decreased again in 2005. On
average, international diesel demand has been increasing at 2.8% for the past 5 years. China’s
demand is increasing at an alarmingly faster rate of 10.25% per year since 2000, while Indonesia,
Saudi Arabia, and Iran have also been increasing their demand at rates higher than the
international average (Fig. 7). Alastair Bedwall, senior manager for J.D. Power Automotive
Forecasting, states that the reason for the overall increase in demand for diesel fuel and engines
revolves around rising energy prices and new environmental regulations. Daily notes “As a
proven, cost-effective and off-the-shelf solution, diesel has a head start over other emerging fuel-
efficient technologies… With energy prices at elevated levels and new regulatory pressure to
improve light-truck fuel efficiency, a range of fuel-efficient alternatives to the conventional
gasoline engine will be required (Daily 2006).”

11
Figure 7: Average percent change in diesel demand since 2000 (OECD 2007).
Demand for specific fuels is directly related to the demand for related types of vehicles.
Virtually all semi-trucks and other delivery vehicles, buses, trains, boats, ships, and farm,
construction, and military equipment have diesel engines, but the personal vehicle market is still
dominated by gasoline-powered engines (EIA Diesel 2007). In 2005, there were about 44,000
diesel light-duty vehicles, 478,000 medium-duty trucks, and 22,000 other diesel vehicles
registered in the United States. In total, these vehicles accounted for only 3.6% of the passenger
vehicle market (Polk 2005). Volkswagen is the largest global supplier of diesel-fueled passenger
vehicles, followed by Ford Motor Company. Toyota is expected to begin penetrating a
significant share of the market as well. Western European countries have been driving the recent
increase in diesel demand, and are predicted to continue doing so. The market is expected to
-4
-2
0
2
4
6
8
10
12
Can
ada
Un
ited
Sta
tes
OE
CD
Eu
rop
e
Jap
an
Kore
a
Bra
zil
Ru
ssia
Iran
Isl
amic
Rep
ubli
c
Sau
di A
rabia
Ind
ia
Ind
on
esia
Ch
ina
Peo
ple
's R
epu
bli
c
Worl
d
% C
han
ge

12
reach 29 million vehicles by 2015 (Daily 2006). The top diesel demanding regions tend to use
higher percentages of diesel fuel than gasoline, and use higher percentages than the world
average of about 50% diesel, 50% gasoline (Fig. 8). India uses the highest percentage of diesel as
transportation fuel, though this percentage has been decreasing as gasoline vehicles have become
more common. Korea also uses a high percentage of diesel fuel, and the percentage for OECD
Europe has been rising near Korea’s levels.
Figure 8: Diesel as a percentage of motor oil used (OECD 2007).
Of the top consuming countries, the United States uses the lowest percentage of diesel
fuel for transportation, which is a result of even higher gasoline demand. Demand for gasoline
vehicles in the US has been rising at much faster rates than for diesel vehicles. This is largely
25
35
45
55
65
75
85
2000 2001 2002 2003 2004 2005
% D
iese
l
Year
Canada
United States
OECD Europe
Japan
Korea
Brazil
Russia
Iran Islamic
RepublicSaudi Arabia
India
Indonesia
China People's
RepublicWorld

13
due to hesitation by consumers to buy diesel vehicles; the public still considers diesel engines to
be major polluters. However, recent EPA standards have required No. 2 distillate fuel (diesel) to
meet lower sulfur standards. By June of 2006, 80% of all highway diesel fuel had to be less than
15 ppm sulfur fuel, or Ultra-Low Sulfur Diesel. By December of 2010, all highway diesel fuel
must meet this standard (EIA Diesel 2007). As a result of these standards and also increasing
fuel prices, consumers are beginning to look towards diesel cars, which are about 30% more
efficient than gasoline cars (Durbin 2006). According to J.D. Power Automotive Forecasting, the
United States, as well as Canada, has an “enormous potential” for diesel passenger vehicle sales
(Daily 2006). By their estimations, the U.S. was at about 3.2% of the light-vehicle sales in 2005.
Polk Automotive Intelligence estimates a slightly higher percentage (Appendix Fig. 5). Medium-
duty trucks account for the majority of the diesel passenger vehicles sales (Appendix Fig. 6). J.D.
Power predicts an increase in the diesel market share to about 10% by 2015 (Daily 2006).
Automakers have a reason to expand their diesel production, because certain low NOx-emitting
vehicles now qualify for up to $3400 in tax credits though 2010. The market is still somewhat
limited, however, due to regulations in California, Massachusetts, Maine, New York, and
Vermont that prevent the sale of diesel vehicles. Diesel is also only sold at about 42% of fuel
stations throughout the United States (Durbin 2006).
Diesel Uses
The main use of diesel fuel in the United States is on-highway transportation, accounting
for approximately 60% of diesel consumption (Fig. 9). On-highway transportation includes
automobiles, trucks and buses, as well as the vehicles that are used to transport petroleum
products. Other uses include off-highway, military, vessel bunkering, railroads, electric utilities,
farms, oil companies, industrial, commercial, and residential consumption. Off-highway

14
consumption consists of construction facilities and equipment, logging, junkyards and
refrigeration units on trucks. Vessel bunkering is defined as any commercial or private boat,
including those operated by oil companies but excluding those operated by the U.S. Armed
Forces. All purchases made by the U.S. Armed Forces, Defense Energy Support Center and
Department of Defense are accounted for under military uses. In terms of diesel used for non-
transportation uses, farms use diesel for tractors, irrigation pumps, crop dryers, smudge pots and
milking machines. Oil companies themselves consume a portion of diesel during operations for
drilling equipment, refining operations and space heating. In the industrial sector, diesel fuel is
used mostly for powering machinery, but is also used for heating, air conditioning and lighting.
Some diesel fuel is also used as an input for various manufactured products. Commercial and
residential uses of diesel mainly include space and water heating, cooking, air conditioning,
refrigeration and lighting.
Figure 9: US Diesel end uses (EIA 2005).
0%
10%
20%
30%
40%
50%
60%
70%
80%
90%
100%
2000 2001 2002 2003 2004 2005
Per
cen
t
Year
Off-
HighwayMilitary
On-Highway
Vessel
BunkeringRailroads
Electric
UtilitiesFarms
Oil
CompaniesIndustrial
Commercial
Residential
15
The amount of diesel used for on- and off-highway transportation has been increasing
steadily since 2000, while many other end uses of diesel have actually decreased (Appendix Fig.
7). Residential and commercial uses have both decreased, while industrial use decreased slightly
in 2002 but has since risen. Oil companies, farms, military and electric utilities have also been
decreasing their consumption of diesel while vessel bunkering and railroads have stayed
relatively stable. Railroad use of diesel fuel tends to fluctuate year to year.
Prices
The cost of biodiesel as compared to fossil fuel diesel is a key factor in its future market
penetration. Historically, B99 or B100 has been significantly more expensive than regular diesel.
As the percentage of biodiesel in the diesel mix decreases, the price decreases as well (Fig. 10).
Nominal prices are shown below and taken from the EIA as available; biodiesel costs vary
greatly by region and feedstock and therefore data is only available twice a year and is based on
limited sampling. The graphs below represent retail fuel costs at private and public costs and
therefore include taxes and subsidies. Prices of B99-B100 have stayed around $3.30 with the
exception of June 2006, when prices spiked to $3.76. The price of B2-B5 stays very close to the
price of diesel, while the price of B20 is always slightly higher than diesel, with the exception of
May of 2007. When comparing prices, it is important to take into account the slightly lower
energy content of biodiesel compared to fossil fuel diesel. In order to compare prices over time
and between types of fuel, Figure 11 shows the price in real dollars per gallon of diesel
equivalent. This depiction does not significantly change the shape of the curves; however, it
demonstrates the higher cost of B100 due to its lower energy content.

16
Figure 10: Nominal price of diesel fuels (EIA 2007, EERE 2005-2007).
Figure 11: Real prices of diesel fuels (EIA 2007; EERE 2005-2007).
175
225
275
325
375
425
Cen
ts/G
all
on
Month
Diesel Nominal Price
B20 Nominal Price
B2-B5 Nominal Price
B99-B100 Nominal Price
175.0
225.0
275.0
325.0
375.0
425.0
475.0
Cen
ts/G
all
on
Die
sel
Eq
uiv
.
Month
Diesel Real Price
B20 Real Price,
Diesel Equiv.
B2-B5 Real Price,
Diesel Equiv.
B99-B100 Real
Price, Diesel
Equiv.

17
Feedstock Analysis
The major determinant of the cost of biodiesel is the feedstock from which it is produced.
In order to determine the market potential of biodiesel, it is necessary to analyze the costs of each
feedstock, as well as their different characteristics and availability. According to the EIA, for
fuel produced from virgin vegetables oils, feedstocks can account for 70-78% of the production
cost. For non-virgin oils, this percentage can be anywhere from 0-70% (Howell 2005). Soybeans
were used as an example feedstock to further breakdown of the cost of a gallon of biodiesel.
Analysis of a 2005 gallon of biodiesel produced from soybeans (Fig. 12) shows that the soybeans
account about 30% or $1.01 of a $3.40 gallon of biodiesel, and the transport of the soybeans to
the soybean crushing facilities costs only 1% or $0.03. Crushing the soybeans is the most
expensive part of the process, accounting for 35% ($1.21) of the cost of production. Transporting
the oil to the biodiesel refinery costs approximately $0.13, and the refining of the soybean oil to
produce biodiesel costs only slightly more than the soybeans themselves, at about $1.02.

18
Figure 12: Breakdown of cost of one gallon of biodiesel (EERE 2005; CRB 2006).
Soybeans
As previously mentioned, the United States uses soybean oil as its primary feedstock
source for biodiesel. The United States is the highest producing nation of soybeans (Fig. 13),
dedicating an average of 72 million acres of land to the crop. This area represents 17% of all the
cropland in the lower 48 states. Each acre of land yields 43 bushels of soybeans, which has risen
from 28.9 bushels per acre in 1975. Yield is expected to increase by approximately 0.5 bushels
per year (EIA 2007). South America also grows significant amounts of soybeans, with Brazil
and Argentina as the second and third largest producers in the world. The US produces a
relatively consistent amount of soybeans each year, though there was a noticeable decline in the
2003-04 season. Brazil, Argentina, Bolivia, and Russia are all increasing their production. The
35%
30%
30%
4% 1%
Soybean Processing
Oil Processing
Soybeans
Oil Transport
Soybean Transport

19
EU was the major importer of soybeans until the 2002-03 agricultural year, when China
surpassed the EU (Fig. 14). China has remained the top importer of soybeans since that time,
despite also being the fifth largest producer in the world. Other nations that import significant
amounts of soybeans include Japan, Mexico, Taiwan and Korea. The three top producers, the
US, Brazil and Argentina, are also the top exporting countries, followed by Paraguay and
Canada.
Figure 13: World soybean production and contribution by nation (CRB 2006).
0
50000
100000
150000
200000
250000
1996-
97
1997-
98
1998-
99
1999-
00
2000-
01
2001-
02
2002-
03
2003-
04
2004-
05
2005-
06
Th
ou
san
ds
of
Met
ric
Ton
s
Year
Other Nations
Russia
United States
Thailand
Paraguay
Mexico
Indonesia
India
China
Canada
Brazil
Bolivia
Argentina

20
Figure 14: Top soybean import/export nations (CRB 2006).
The vast majority of soybeans is crushed and used for meal and oil, and the remainder is
used in whole bean form for food (Appendix Fig. 8). About 19% of the weight of a soybean is
extracted as oil, though this amount varies with the temperature and amount of sun during the
growth period. Similar to soybeans, the United States is the top producer of soybean oil in the
international market. Along with Brazil and the EU, the US accounted for the majority of the
soybean oil production until the most recent decade, at which point other countries began
significantly increasing their production (Fig. 15). While the US and Brazil are the two top
exporters of soybean oil, US exports have decreased slightly and Brazil’s have increased
significantly since the turn of the century (Fig. 16). These trends demonstrate the interaction of
the US’s constraints on soybean oil exports with growing world demand. India is the major
-31000
-21000
-11000
-1000
9000
19000
19
96-9
7
19
97-9
8
19
98-9
9
19
99-0
0
2000-0
1
2001-0
2
20
02-0
3
20
03-0
4
20
04-0
5
20
05-0
6T
hou
san
ds
of
Met
ric
To
ns
Imp
ort
ed
Agricultural Year
China
EU
Japan
Korea
Mexico
Taiwan
Argentina
Brazil
Canada
Paraguay
US

21
importer of soybean oil; however, it is not receiving significant amounts from the United States.
The US exports primarily to Canada and Mexico, and has decreased export amounts to further
countries such as Pakistan, Morocco, India, and Peru (Appendix Fig. 9). Oil that is not exported
is used mostly for shortening and cooking and salad oils (Fig. 17). This has not always been the
case as soybean oil was used mostly for resins and plastics until the last decade before it began to
replace lard in shortening because of rising health concerns in the United States. Another recent
change in use has been an increase use for biodiesel, which absorbed approximately 15% of
available soybean oil in 2007.
Figure 15: World production of soybean oil (CRB 2006).
0
2000
4000
6000
8000
10000
12000
14000
16000
18000
1996-9
7
1997
-98
1998
-99
1999
-00
2000
-01
2001
-02
2002
-03
2003-0
4
2004
-05
2005
-06
Th
ou
san
ds
of
Met
ric
Ton
s
Agricultural Year
Brazil
EU
United
States
Other
Nations

22
Figure 16: World imports and exports of soybean oil (CRB 2006).
-3000
-2000
-1000
0
1000
2000
3000
1996-97 1997-98 1998-99 1999-00 2000-01 2001-02 2002-03 2003-04 2004-05 2005-06
Th
ou
san
ds
of
Met
ric
To
ns
Agricultural Year
Brazil
US
India

23
Figure 17: Domestic uses of soybean oil (CRB 2006).
The widespread use of soybean oil as a feedstock for biodiesel in the United States has
resulted from a number of different factors. First, because the US is the largest producer of
soybeans and soybean oil in the world, soybeans are commonly available in almost all regions of
the country. Soybean oil is the most common vegetable oil produced in the US, accounting for
60% of the total fats and oils produced domestically. These factors contribute to a relatively low
price of soybeans compared to most other plant oils. The national soybean associations have
effectively promoted the product as a biodiesel feedstock, and biodiesel producers have been
loyal customers because of its reasonably constant chemical composition (Stroup 2004). The
USDA voluntary Bioenergy Reporting program provided information on the amount of different
0
20
40
60
80
100
120
140
0
1000
2000
3000
4000
5000
6000
7000
8000
9000
19
96-9
7
19
97-9
8
19
98-9
9
19
99-0
0
2000-0
1
20
01-0
2
20
02-0
3
20
03-0
4
20
04-0
5
Mil
lion
s of
Pou
nd
s -
Ined
ible
Use
s
Mil
lion
s of
Pou
nd
s -
Ed
ible
Use
s
Agricultural Year
Shortening
Margarine
Cooking &
Salad Oils
Other
Edible
Paint &
Varnish
Resins &
Plastics

24
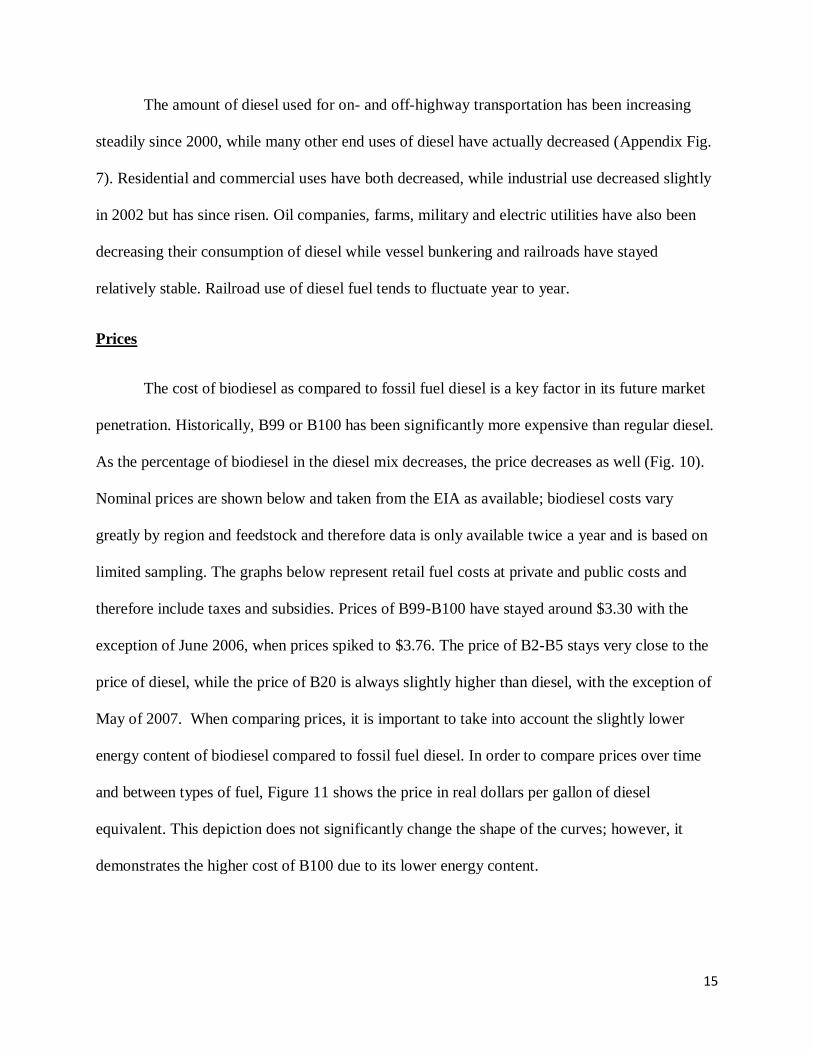
feedstocks used to produce biodiesel through 2006, when the program lost funding. The results
of the reports are important in demonstrating the dominance of soybean oil as a feedstock (Fig.
18). Various animal fats and oils were reported as a distant second most commonly used
feedstock (Fig. 19). Though the findings from the Bioenergy Reporting program are not a
complete picture of the entire biodiesel industry, the results are consistent with the refinery
capacity in the United States.
Figure 18: US Bioenergy Program: Reported gallons produced (log scale) (USDA Bioenergy
2006).
1
10
100
1000
10000
100000
1000000
10000000
100000000
1E+09
2003 2004 2005 2006
Gall
on
s P
rod
uce
d (
Log S
cale
)
Year
Soybean
Oil
Animal
Fats and
OilsCottonseed
Oil
Corn Oil
25
Figure 19: US Bioenergy Program: Reported biodiesel production from top feedstocks (USDA
Bioenergy 2006).
Canola
Canola oil is the most common biodiesel feedstock in the EU, and therefore
internationally. Canola plants originated in Canada and are a modified version of the rapeseed
plant. The pods of the plants contain small seeds that are then crushed. Approximately 40% of
the weight of the seed is extracted for oil, which is over double the content of soybeans.
Consequently, canola is primarily grown for its oil (Appendix Fig. 10) and is generally
considered a better crop for biodiesel production. It accounts for approximately 13% of vegetable
oil in the world, and is the third most common after soy and palm oil. The oil is also often used
0
20
40
60
80
100
120
140
2003 2004 2005 2006
Mil
lion
Gall
on
s of
Bio
die
sel
Year
Soybean Oil
Animal Fats
and Oils

26
for salad and cooking oils, margarine, ink manufacturing, greases, cosmetics, medicines and
soap. Seeds that are not crushed are sometimes used in birdfeed, and the meal from the crush is
used in high-protein livestock feed. Though Canada originated the crop, China was the highest
producing country until 2000-01. During the 2000-01 growing season Germany took over most
of the EU’s canola production and surpassed China’s production levels (CRB 2006) (Fig. 20).
China and the EU consume their domestically produced canola, leaving Canada as the top
exporter of canola oil worldwide. Canada dedicates 13 million acres of land to canola production
and produces only 15% of the total world crop, but export 75% of the world’s imports (Canola
2007). Seventy-five percent of those exports go directly to the United States (CRB 2006). The
United States acquires most of its canola already crushed as opposed to importing the seed and
crushing it domestically (Appendix Fig. 11).
Figure 20: World canola production (CRB 2006).
0
5000
10000
15000
20000
25000
30000
35000
40000
45000
50000
0
2000
4000
6000
8000
10000
12000
14000
16000
18000
1995
-96
1996
-97
1997
-98
1998
-99
1999
-00
2000
-01
2001
-02
2002-0
3
2003
-04
2004
-05
2005
-06
Th
ou
san
ds
of
Met
ric
Ton
s (W
orl
d T
ota
l)
Th
ou
san
d M
etri
c T
on
s
Agricultural Year
Australia
Canada
China
France
Germany
India
United
KingdomWorld
Total

27
Palm
Unlike most other vegetable oils, palm oil is actually produced from the flesh of the fruit
of the palm tree. Oil can be extracted from the seed similarly to other plants, but this process
produces a much lighter oil. Oil from the seed is called palm kernel oil and is generally used for
food, while palm oil is used more often for soap, ointments, cosmetics, detergents, and
machinery lubricants. Ten times the amount of as oil is extracted from the fruit than as the seed.
Malaysia is the top producer of palm oil, followed closely by Indonesia. Nations near the equator
produce more palm oil, with Nigeria, Thailand and Colombia as major producers as well
(Appendix Fig. 12). Malaysia and Indonesia are also the top palm oil exporting nations, with
exports increasing significantly every year. Nigeria, Thailand, and Colombia consume their palm
oil domestically and therefore do not export, leaving Hong Kong, Paupa New Guinea and
Singapore as other leading palm exporters (Appendix Fig. 13). India and China are the world’s
largest importers of palm oil. India experienced a major increase in demand in the mid 1990’s,
and China began to experience a similar increase starting in 2000. China has now surpassed India
in palm oil demand. The United States’ growth in demand for palm oil imports has been
increasing similarly to China and India, with imports reaching 315,000 metric tonnes in 2005.
Other major importing countries, including Germany, the Netherlands, Pakistan, and the UK,
have maintained a relatively constant demand for palm oil imports.
Sunflower Seed
Sunflower seeds are commonly grown and used for oil worldwide. The weight of the
seed is 39-49% oil, which accounts for about 80% of the value of the seed. One acre of
sunflower seed crop yields approximately 50 bushels of seed per acre which can be made into 50

28
gallons of oil. This high oil content and the high energy content of the oil (93% of the energy
content of fossil fuel diesel) makes sunflower seed oil a good candidate for biodiesel production.
However, high prices and variable acreage and crush of the seeds have been major barriers to its
use. Sunflower seeds are used often for food for people, livestock, and birds, and the oil is used
mainly for soaps, candles, varnish and detergents. Argentina and the Former USSR are the two
top producers of sunflower seeds. Argentina, however, began to decrease its production at the
beginning of the 21st century and fluctuate sunflower seed exports on a yearly basis. The Former
USSR began to increase, now dominating world production (Appendix Fig. 14). This is also the
case for sunflower seed oil, because most seeds are crushed in the country in which they were
grown (Appendix Fig. 15). China, France, India, Romania, Hungary and the United States also
grow large amounts of sunflowers seeds. The Former USSR and even Uruguay have thus
recently been major players in the international market. Turkey, the Netherlands, Spain,
Germany and France are the highest importing countries in the world, though overall imports
have been decreasing in recent years (Fig. 21). Turkey, France and Spain import their seeds and
produce the oil domestically, making them the top sunflower seed oil producing nations after
Argentina and the Former USSR. In the past decade, the United States has been decreasing its
production of sunflower oil. Domestic consumption has remained steady thus the US has
decreased its exports in response to decreased production (Appendix Fig. 16). The decreased
production in the United States is partially due to a decrease in sunflower seed supply but is also
a result of decreased crush. The US crushed approximately half of its sunflower seed until 2002,
at which point sunflower seed crush decreased (Appendix Fig. 17).

29
Figure 21: Top sunflower seed importing nations (CRB 2006).
Cottonseed
Cottonseed is a less common feedstock for biodiesel, though it is a common crop in all
regions of the world. Approximately 16% of the weight of the seed is extracted as oil (NCPA
2002), and is used most often for cooking oil. The seeds of the cotton plant provide 18% of a
cotton producer’s income. China is the world’s most prevalent producer of cottonseed, with 24%
of the world’s total production. The US, India, and Pakistan are also major producers at 17%,
16% and 10% respectively. These countries have all been increasing their production in recent
years (Fig. 22).
0
100
200
300
400
500
600
700
800
900
1995/96 1996/97 1997/98 1998/99 1999/00 2000/01 2001/02 2002/03 2003/04 2004/05
Th
ou
san
ds
of
Met
ric
To
ns
Agricultural Year
France
Germany
Netherlands
Spain
Turkey

30
Figure 22: Top world producers of cottonseed (CRB 2006).
Coconut
Another less common feedstock for biodiesel is coconut oil, though coconut oil itself has
been a common cooking oil for thousands of years. It is mainly produced in tropical areas and is
a staple of most diets in those areas. The US imported and used coconut oil as a major cooking
oil until WWII when there were shortages of imported oil. Coconut oil that is fit for human
consumption must go through an extended refining process. Expeller press and solvent extraction
methods are used to remove the oil from the copra, and then the oil must be neutralized,
bleached, and deodorized at high heat and with a vacuum. The byproduct of this refined oil is
0
2,000
4,000
6,000
8,000
10,000
12,000
1998-99 1999-00 2000-01 2001-02 2002-03 2003-04 2004-05
Th
ou
san
ds
of
Met
ric
Ton
s
Agricultural Year
Australia
Brazil
China
India
Pakistan
Turkey
US
Former
USSR

31
used for livestock feed, and the refined oil is used mostly for margarine, shortening, salad oils,
confections, and energy or sports drinks, as well as soaps, detergents, shampoos, cosmetics,
candles, glycerin and synthetic rubber. Coconut oil is produced in the nations that grow coconut
palms. The Philippines produce 41% of the world’s palm oil, and other top producers include
Indonesia, India, and Mexico (Appendix Fig. 18). Europe is the top consumer of coconut oil,
consuming nearly as much as Indonesia produces on a yearly basis. India and the United States
are also large consumers of coconut oil that must import their supplies (Appendix Fig.19). In the
past decade, the US has been gradually decreasing its use of coconut oil for inedible
consumption and increasing its edible consumption (Appendix Fig. 20).
Corn
The United States dominates the world market for corn, at 41% of production, and corn
dominates US agricultural acreage. It is grown primarily for its use as livestock feed, and is not
traditionally grown as an oilseed crop because it contains only 4% oil content. Oil from “high-
oil” corn can account for up to 7% of the corn weight (CRB 2006). Though corn is not grown as
a biodiesel feedstocks, some refiners have begun using the oil byproduct from ethanol production
to produce small amounts of biodiesel (GSCT 2007). Alternatively, corn oil is also used for
cooking oil, margarine, mayonnaise, soaps, paints, inks, varnishes, and cosmetics (CRB 2006)
(Appendix Fig. 21).
Peanuts
Peanut oil can also be used for biodiesel production, but like many other possible
feedstocks, it is not widely available and is even more expensive than sunflower seed oil. When

32
peanuts were originally brought to the United States, they were used primarily for pig feed, but
now there are over 300 uses for peanuts including shaving cream, leather dye, coffee, ink, cheese
and shampoo. There are four basic types of peanuts in the US: Runner, Spanish, Valencia and
Virginia. Peanut oils are produced primarily from Spanish peanuts. It is extracted from shelled
and crushed peanuts through hydraulic pressing, solvent extraction or expelled pressing. The
refined oils, which must be bleached and deodorized, are used for cooking, margarine and
shortening. Press cake, the byproduct from crushing, and the tops of peanut plants are used as
cattle feed. In addition to refining the oil for biodiesel, energy can also be produced from peanuts
by burning the dry shells for electricity. China is the leading producer of peanuts in the world,
followed by India, the US, Nigeria and Indonesia (Appendix Fig. 22). China’s production
increased significantly at the end of the 20th century, while India’s decreased. Other top
producing countries have stayed relatively steady in their production. The United States uses the
vast majority of its peanut stocks directly for food, only crushing a small percentage for oil (Fig.
23).

33
Figure 23: US Supply and disappearance of peanuts (CRB 2006).
Animal Fats
Animal fat products are, like plant oils, composed of triglycerides. They have been
proven to emit less NOx than plant oils when burned as fuel and are generally less expensive
despite requiring more pretreatment. Biodiesel produced from animal fats is generally considered
a more environmentally-friendly product than biodiesel from other feedstocks because it is made
from a waste product and solves the problem of grease and fat disposal (Stroup 2004). The
American Fats and Oils Association provides specifications such as color, melting point, density,
moisture content and insoluble impurities to characterize different types of fats, including edible
tallow, edible lard, top white tallow, all beef packer tallow, extra fancy tallow, fancy tallow, and
yellow grease. Lard and tallow are the two animal fat commodities traded in the United States.
-4000
-3000
-2000
-1000
0
1000
2000
3000
4000
5000
1996
/97
1997
/98
1998
/99
19
99
/00
2000
/01
2001
/02
2002
/03
20
03
/04
2004
/05
Mil
lion
s of
Pou
nd
s
Agricultural Year
Production
Imports
Exports
Crushed
Food

34
Lard is the fat layer removed from pigs, and thus its supply is directly related to the
supply of pigs raised for livestock. It is a preferred cooking oil because it produces very little
smoke when heated. Lard is also used for medicinal purposes such as in ointments, plasters,
liniments and laxatives. China is by far the largest producer of lard in the world due to the
common consumption of pork (Appendix Fig. 23), and only continues to grow. The United
States is the next highest producer of lard, followed by Germany, Brazil, the Former USSR,
Spain, Poland, Italy, France and Canada. Brazil experienced a drastic increase in lard production
in 2000 (Fig. 24), related to an increase in all Brazilian agricultural production but especially hog
production. Lard production in the US has been increasing steadily, but consumption has been
decreasing significantly due to health concerns (Fig. 25). This has lead to a large increase in lard
exports (Fig. 26).
Tallow and grease, similar to lard, are the fat collected from the production of cattle for
food. It is used for margarine, cooking oil, baking products, soap, candles and lubricants.
Because the production of tallow and grease is directly related to the production of cattle, those
countries that raise large numbers of cattle are large producers of tallow and grease. The US
dominates the world market for tallow and grease, followed by Australia, Argentina and Canada
(Appendix Fig. 24).

35
Figure 24: World production of lard (excluding China) (CRB 2006).
Figure 25: US consumption of lard (edible and inedible) (CRB 2006).
0
100
200
300
400
500
600
1996 1997 1998 1999 2000 2001 2002 2003 2004 2005
Th
ou
san
ds
of
Met
ric
Ton
s
Year
Brazil
Canada
France
Germany
0
50
100
150
200
250
300
350
400
450
500
1996 1997 1998 1999 2000 2001 2002 2003 2004 2005 2006
Mil
lion
s of
Pou
nd
s
Year

36
Figure 26: Production and distribution of lard in the US (CRB 2006)
*Baking/frying fats info withheld after 2000
Prices
The main factor in determining which feedstock is used for biodiesel is price. In general,
animal fats are less expensive than vegetable oils (Fig. 27). Tallow, grease and lard have been
less than $0.20 per pound, though lard has risen above $0.20 in the past few years. One gallon of
biodiesel can be produced from approximately 7 to 7.6 pounds of fat or oil according to the
National Biodiesel Board; 7.5 pounds was assumed for this analysis. Soybean oil and corn oil are
the least expensive plant seed oils in the US, usually below $0.30 a pound. Sunflower seed oil
and peanut oil can be up to twice as expensive.
0
200
400
600
800
1000
1200
1996 1997 1998 1999 2000 2001 2002 2003 2004 2005
Mil
lion
s of
Pou
nd
s
Production
Baking/Frying Fats
Margarine
Exports
Direct Use

37
Figure 27: Prices of feedstocks (CRB 2006).
Supply Curve Factors
In order to understand the interaction between the price of feedstocks and the amount of
biodiesel produced and supplied to the market, series of supply stacks and supply curves were
constructed based on EIA data and commodity prices. The EIA equation was adopted from the
NEMS model for the biodiesel supply curve in the Annual Energy Outlook publication for 2007.
5
15
25
35
45
55
65
75
85
1998-99 1999-00 2000-01 2001-02 2002-03 2003-04 2004-05 2005-06 2006-07
Cen
ts/l
b
Year
Canola Oil
Coconut
Oil
Lard
Palm Oil
Peanut Oil
Soybean
Oil
Sunflower
Oil
Cottonseed
OilTallow/Gre
ase
Corn Oil

38
The equation for calculating the cost of production for one gallon of biodiesel is
CG=FC+CAP+OPER-GLYC-SUBSID
Where CG is the cost of production per gallon of biodiesel, FC is the cost of the feedstock used
to produce one gallon of biodiesel, CAP is the capital cost per gallon of production capacity per
year, OPER is the operation cost per gallon, GLYC is the value of the glycerin byproduct, and
SUBSID is the amount of the subsidy received from the United States government per gallon of
biodiesel.
For the 2007 production models, the quantities of biodiesel from different feedstocks
listed below were estimated using 2007 production estimates as well as estimated assumptions of
feedstock percentages. These percentages are based on numbers reported to the USDA
Bioenergy Reporting program, which lost funding in 2006, as well as capacity estimates from the
Biodiesel Magazine and the National Biodiesel Board (Table 2).

39
Table 2: Amount of Biodiesel Produced from Different Feedstocks in 2007
Feedstock Gallons of Biodiesel Produced
Soybean Oil 409,500,000
Waste Vegetable Oil 13,500,000
Animal Fats (Lard, Tallow, Grease) 13,500,000
Canola Oil 9,000,000
Other (Cottonseed Oil, Sunflower Seed Oil, Palm Oil, Corn
Oil)
450,000
All prices are adjusted from EIA inputs and use USDA feedstock prices in 2007 dollar
values. The operation cost value of $0.58 per gallon was adopted from the original EIA model.
The EIA assumes $0.21 ($2007) value of glycerin; however, recent surplus in the glycerin
market due to increased supplies from biodiesel producers has caused crude glycerin prices to
fall as low as $0.02 per pound. Most refineries are able to receive between $0.06 and $0.10 per
pound (Kotrba 2007); $0.08 was assumed for all scenarios. For all scenarios, the EIA value of
$0.18 per gallon was adopted for capital cost. The figure for 2007 Production Stack shows the
quantity of biodiesel produced from each feedstock and the cost of producing one gallon of
biodiesel from that particular feedstock (Fig. 28).

40
Figure 28: 2007 production stack.
One basic assumption made in the EIA model is that capital cost is linear – each gallon of
capacity costs the producer the same amount per year no matter the size of the plant. Accounting
for economies of scale in refineries shows that capital costs decrease as the plant size increases.
In order to generate an equation for this trend, capital costs were used from a study from the
National Renewable Energy Laboratory (Howell 2005).
0
0.5
1
1.5
2
2.5
35
0,0
00
13
,70
0,0
00
27
,35
0,0
00
41
,00
0,0
00
54
,65
0,0
00
68
,30
0,0
00
81
,95
0,0
00
95
,60
0,0
00
10
9,2
50
,00
01
22
,90
0,0
00
13
6,5
50
,00
01
50
,20
0,0
00
16
3,8
50
,00
01
77
,50
0,0
00
19
1,1
50
,00
02
04
,80
0,0
00
21
8,4
50
,00
02
32
,10
0,0
00
24
5,7
50
,00
02
59,4
00,0
00
27
3,0
50
,00
02
86,7
00,0
00
30
0,3
50
,00
03
14,0
00,0
00
32
7,6
50
,00
03
41
,30
0,0
00
35
4,9
50
,00
03
68
,60
0,0
00
38
2,2
50
,00
03
95
,90
0,0
00
40
9,5
50
,00
04
23
,20
0,0
00
43
6,8
50
,00
0
Pro
du
ctio
n C
ost
in
Doll
ars
/Ga
llon
Gallons of Biodiesel
WVO
Fats
Soybean
Canola
Other

41
Using the average cost of the plants, cost of a biodiesel plant can be calculated as (Fig. 29)
C = 2.4904g0.6021
where C is the total capital cost of the refinery and g is the capacity of the refinery. For example,
a 10 million gallon plant would cost 2.4904*10,000,0000.6021
, or $40,829.03. A simple
correlation gives an R2 value of 0.99 when compared to actual average cost per plant.
Figure 29: Biodiesel refinery cost by plant capacity (Howell 2005).
y = -0.0055x2 + 0.743x + 2.5471
R² = 0.9964
0
5
10
15
20
25
30
35
0 10 20 30 40 50 60
Cost
of
Pla
nt
in M
illi
on
s of
Doll
ars
Size of Plant in Millions of Gallons
Low
High
Average
Poly. (Average)

42
In order to determine capital cost per gallon, the equation needs to be rearranged. When
calculating this equation per gallon of biodiesel, the result is the equation (Fig. 30)
Cg = 2.4904g-.398
where Cg is the capital cost per gallon. The simple correlation for this equation gives an R2 value
of 0.9999.
Figure 30: Capital cost of biodiesel per gallon of capacity (Howell 2005).
y = -0.491ln(x) + 2.2535
R² = 0.9461
0
0.5
1
1.5
2
2.5
3
3.5
0 10 20 30 40 50 60
Cost
in
Doll
ars/
Ga
llon
Millions of Gallons of Capacity
Low
High
Average
Log. (Average)

43
Capacity Supply Models
The potential of the biodiesel industry was examined by creating capacity supply curves
from data about size and feedstock choice compiled from the Biodiesel Magazine refinery
database and the National Biodiesel Board. The supply curves show how much biodiesel could
be produced at what cost per gallon, and the curves were reconstructed based on varying
assumptions and compared to biodiesel mandates set by the Renewable Fuel Standard.
The first model (Fig. 31) shows the cost of production based on the refinery capacity in
August of 2007 and 2007 feedstock prices. This basic model also assumes that all multi-
feedstock plants are using soybean oil, because this is the most common feedstock. This
assumption is consistent with the results of the USDA Bioenergy Reporting program. The supply
curve shows that the refinery infrastructure has the capacity to produce over 1.4 billion gallons of
biodiesel at a price of less than $2.00. Small amounts of biodiesel can be produced at prices not
much higher than a dollar, but production costs level off after $1.83, and the majority of the
capacity can produce biodiesel between $1.83 and $2.00.

44
Figure 31: Current biodiesel capacity
In the next model (Fig. 32), the multi-feedstock plant assumption was tested and
production costs were recalculated with low- and high-priced feedstocks. This is an important
assumption to examine because 1 billion of biodiesel made entirely from soybean oil would
require 40% of 2007 soybean oil production. Such unprecedented strain would likely alter the
price conditions. Canola oil was used as the high-price feedstock and waste vegetable oil as the
low-cost feedstock. Subsidies were adjusted for the multi-feedstock plants in the low-price
scenario to account for the lower subsidy amount received when using recycled feedstocks.
Under the high-price scenario, only about 900 million gallons of biodiesel can be produced at a
price less than $2.00. However, with the low-cost scenario, nearly the entire capacity potential
0
0.5
1
1.5
2
2.5
3
0 200 400 600 800 1,000 1,200 1,400 1,600 1,800
Cost
of
Pro
du
ctio
n P
er G
all
on
(D
oll
ars
)
Capacity in Millions of Gallons

45
could produce biodiesel at a price less than $2.00, and over 600 million gallons could actually be
produced at a cost of less than $1.00. These assumptions are not realistic in either case, because
these quantities of waste vegetable oil and canola oil are not available in the United States;
however, this result demonstrates the range of possible production costs.
Figure 32: Minimum and maximum production costs for multi-feed plants.
This next scenario (Fig. 33) shows a comparison of the amount of biodiesel produced in
2007, the refinery capacity in 2007, and what the refinery capacity will be by the end of 2008.
US production of 450 million gallons was about 26% of the total available refinery capacity in
2007, and this production will double by the end of 2008. Comparing the capacity to the goals
0.00
0.50
1.00
1.50
2.00
2.50
3.00
0 200 400 600 800 1,000 1,200 1,400 1,600 1,800
Pro
du
ctio
n C
ost
Millions of Gallons
CG(High)
CG(Low)

46
set by the renewable fuel standards, more than enough capacity to produce the 1 billion gallons
mandated already exists. Biodiesel refiners can produce more than 1 billion gallons at a price that
is competitive with the 2007 price of conventional diesel ($2.88, or $2.63 biodiesel equivalent).
Figure 33: Current and future capacity, 2007 prices.
Because of recent jumps in feedstock and diesel prices, the conclusions of the above
scenario are not highly likely. For the next model, average feedstock and diesel prices for
January-April 2008 were used in order to determine the supply curve of the additional capacity
by the end of 2008 (Fig. 34). This result shows that biodiesel is not nearly as competitive with
conventional diesel as in recent years. The least expensive billion gallons of biodiesel that can
0
1
2
3
4
5
6
0 500 1,000 1,500 2,000 2,500 3,000 3,500 4,000
Doll
ars
/Gall
on
s
Millions of Gallons
Capacity by
2009, 2007
Feedstock
Costs
Current
Capacity
2007 Diesel
Price,
Biodiesel
Equiv.
2012 RFS
Production
Goal

47
be produced can still be sold at a price that is slightly less than that of conventional oil, but the
market competition is much tighter.
Figure 34: Current and future capacity, 2008 prices.
Because the Renewable Fuel Standard mandates that the US must be producing 1 billion
gallons of biodiesel per year by 2012, price predictions were examined out to this point (Fig. 35).
If current subsidies are maintained, the industry will be able to produce 1 billion gallons at a
price well below the predicted 2012 price of diesel. But without the subsidy, conventional diesel
is much less expensive than biodiesel. In order for biodiesel to break even with diesel at the 1
0
1
2
3
4
5
6
0 500 1,000 1,500 2,000 2,500 3,000 3,500 4,000
Doll
ars
/Gall
on
Million Gallons
Capacity
by 2009
Current
Capacity
2008 Diesel
Price,
Biodiesel
Equiv.
2012 RFS
Production
Goal

48
billion gallon mark, biodiesel requires at least a $0.72 subsidy. However, considering the high
diesel prices in recent years, biodiesel may not need a subsidy at all. The US can produce over 3
billion gallons of biodiesel at a price that is less than the 2008 price of diesel without any subsidy
at all. However, because vegetable oil prices tend to rise and fall with crude oil prices, it is likely
that if 2012 diesel prices are relatively high, feedstock prices will also be high. Biodiesel
production will most likely always require government subsidies unless there are drastic
advancements made in feedstock oil contents, acreage yield, or production efficiency.
Figure 35: Forecasted subsidy requirements.
0
0.5
1
1.5
2
2.5
3
3.5
4
0 1,000 2,000 3,000 4,000
Doll
ars
/Gall
on
Millions of Gallons
Subsidized
Biodiesel
Unsubsidized
Biodiesel
2012 RFS
Production
Goal
2012 Price of
Diesel, Biodiesel
Equiv.
2008 Price of
Diesel, Biodiesel
Equiv.

49
Conclusions
Because biodiesel must fit into the diesel infrastructure, the future growth of biodiesel is
entirely dependent on the persistence and growth of diesel demand. This dependence is likely to
benefit rather than hinder the future of biodiesel because diesel is becoming a more popular fuel
in the United States and other regions as well. Demand for diesel and biodiesel fuel is directly
related to the use of diesel engines, and because diesel engines are more efficient and diesel fuel
is becoming more clean, the use of diesel engines is projected to increase. Considering the
strength of diesel forecasts, biodiesel refiners and marketers will benefit from blending their
product with diesel and emphasizing the ability of biodiesel to function in diesel infrastructure.
The success of the biodiesel industry is highly dependent on the price and availability of
feedstocks. Soybean oil has been the primary source for biodiesel production in the United
States, accounting for over 90% of biodiesel production. This has required only up to 15% of the
available soybean stock in the United States, but as production mandates increase, biodiesel may
require up to 40% of soybean oil stocks at current production levels. Animal fats and waste
vegetable oil remain good economic choices for feedstocks, but are not as widely available as
vegetable oils. In addition, animal fat production is driven by demand for livestock, so increasing
demand of the oil byproduct will not encourage the market to produce more animal fats.
Another production cost component that biodiesel refiners have some control over is
capital costs. Capital costs vary greatly with the size of the plant; larger plants cost increasingly
and significantly less per gallon that smaller plants. Thus, it is more economic for producers to
build larger plants. Larger plants require feedstocks to be transported in from further distances,
but because transportation of feedstocks is such a small percentage of production costs, larger
plants are a better choice for most producers.

50
With current subsidies and refinery capacity, it is likely that the biodiesel industry will be
able to produce the amount of biodiesel mandated by the Renewable Fuel Standard at a price that
is competitive with conventional diesel fuel. The United States biodiesel industry only operated
at about 26.4% of the available capacity in 2007, and this capacity is expected to double by the
end of 2008. Meeting RFS 2012 mandates will only require 28.8% of the refining capacity that
will be online by 2009. In order for this to be possible, however, the biodiesel subsidies need to
remain above at least $.72 through 2012 for virgin feedstocks. Waste oils would not require a
subsidy, however, because they are less expensive to produce than conventional diesel under all
scenarios considered. The importance of the subsidy and the potential of the biodiesel industry
are both based on assumptions about the price and availability of two volatile prices: the price of
vegetable oils and the price of diesel. These prices are the key factors in determining the success
of the industry and the public and private costs of meeting the Renewable Fuel Standard.

51
References
ASTM International. 16 April 2008. http://www.astm.org/cgi- bin/SoftCart.exe
/ABOUT/index.html?L+googleorgstore+upfz9233+1208425800.
BQ-9000 Quality Management Program. 7 April 2008. http://www.bq-9000.org.
Canola Council of Canada. “Canola Facts: An Industry that Depends on Trade.” 3 April
2006. 2 December 2007. www.canola-council.org/facts_trade.html.
The CRM Commodity Yearbook 2006. Commodity Research Bureau. 2006. John Wiley
& Sons, Inc.
Coyle, William. “The Future of Biofuels: A Global Perspective.” 2007. Economic
Reserve Service. United States Department of Agriculture. 26 November 2007.
http://www.ers.usda.gov/AmberWaves/November07/PDF/Biofuels.pdf.
Daily Auto Insider “World Demand for Diesel-Powered Cars Seen Doubling.” 17 April
2006. 21 September 2007. www.caranddriver.com/dailyautoinsider.
Durbin, Dee-Ann. “Automakers predict diesel sales will grow in U.S. market as gas
prices rise.” 2006. 21 September 2007. www.autonews24h.com.
European Biodiesel Board. “Statistics: The EU Biodiesel Industry.” 20 February 2008.
http://www.ebb-eu.org/stats.php#.
Energy Efficiency and Renewable Energy. Department of Energy. 20 November 2007. “Ultra-
Low Sulfur Diesel Benefits.” http://www.eere.energy.gov/afdc/fuels/emerging_
sulfur_diesel_benefits.html.
Energy Efficiency and Renewable Energy. Department of Energy. “Clean Cities Alternative Fuel
Price Report.” 2005-2007.
Energy Information Administration. “Sales of Distillate Fuel Oil by End Use.”
Department of Energy. 2005. 11 November 2007.
http://tonto.eia.doe.gov/dnav/pet/pet_cons_821dst_dcu_nus_a.htm.
Energy Information Administration. Department of Energy. “The Transition to Ultra-Low-Sulfur
Diesel Fuel: Effects on Prices and Supply.” 2001. 12 September 2007.
http://www.eia.doe.gov/.
Energy Information Administration. Department of Energy. 2006. “U.S. Primary Energy
Consumption by Source and Sector, 2006.”
http://www.eia.doe.gov/emeu/aer/pdf/pecss_diagram.pdf.

52
Energy Information Administration. Department of Energy. “Diesel Fuel Prices: What
Consumers Should Know.” 24 May 2007. 21 September 2007. http://www.eia.doe.gov/.
GS Clean Tech. 2007. “GS Clean Tech’s Patent Pending Corn Oil Extraction System.”
http://www.gs-cleantech.com/pdf/Coes_Data_Sheet.pdf.
Howell, Steve. “Time to Take the Biodiesel Plunge?” Render Magazine. February 2005.
23 October 2007. www.rendermagazine.com.
Jessen, Holly. “BQ-9000: Gaining Momentum.” Biodiesel Magazine. May 2006. 2
August 2007. www.biodieselmagazine.com.
Kotrba, Ron. “The Glycerin Spread.” Biodiesel Magazine. September 2007. 10 April 2008.
www.biodieselmagazine.com.
National Biodiesel Board. 2005. “Energy Content.”
http://www.biodiesel.org/pdf_files/fuelfactsheets/BTU_Content_Final_Oct2005.pdf.
National Cottonseed Products Association. 2002. “Cottonseed and its Products.” 18 April 2008.
http://www.cottonseed.com/publications/cottonseedanditsproducts.asp.
“NBB aggressive in finalizing B5 and B20 specs.” Biodiesel Magazine. July 2007.
2 August 2007. www.biodieselmagazine.com.
Oranisation for Economic Co-operation and Development. “IEA Oil Information.”
v. 2007, release 01. 10 November 2007. http://masetto.sourceoecd.org.
Polk Automotive Intelligence. “Diesel Technology Form Report.” R.L. Polk & Company.
2005.
Stroup, Robert L. “Feedstock Considers for Future U.S. Producers.” Biodiesel Magazine.
Jan/Feb 2004. 2 August 2007. www.biodieselmagazine.com.
Thurmond, Will. “Biodiesel’s Bright Future.” World Future Society. The Futurist. July-August
2007. pp. 27-30.
2006. United States Department of Agriculture. “Bioenergy.” 2006.
http://www.fsa.usda.gov/Internet/FSA_File/bioenergy.pdf.

53
Appendix
Figure 1: 2005 biodiesel production by country (World Future Society).
Figure 2: Top biodiesel producing countries in 2005 (World Future Society 2007).
US
Other Non-EU
Countries
Germany
France
Italy
Czech Republic
Poland
Slovakia
Other EU Countries
266000
1711900
516800
387600
0
200000
400000
600000
800000
1000000
1200000
1400000
1600000
1800000
US Germany France Italy
Ton
s of
Bio
die
sel
Country

54
Figure 3: Largest diesel suppliers by country/region (OECD 2007).
16000
66000
116000
166000
216000
266000
2000 2001 2002 2003 2004 2005
Th
ou
san
ds
of
Ton
nes
Year
OECD Europe
Canada
Japan
Korea
United States
Brazil
People's Republic of
China
India
Russia
Saudi Arabia

55
Figure 4: Diesel demand by highest demanding countries/regions (OECD 2007).
100
1100
2100
3100
4100
5100
6100
7100
8100
2001 2002 2003 2004 2005
Th
ou
san
ds
of
Barr
els
per
Day
(L
og
Sca
le)
Year
Canada
United States
OECD Europe
Japan
Korea
Brazil
Russia
Iran Islamic
Republic
Saudi Arabia
India
Indonesia
China People's
Republic

56
Figure 5: Diesel percent share of passenger vehicle market (Polk 2005).
Figure 6: Diesel passenger vehicle registration by type (Polk 2005).
0.00%
0.50%
1.00%
1.50%
2.00%
2.50%
3.00%
3.50%
4.00%
2000 2001 2002 2003 2004 2005Year
0
50000
100000
150000
200000
250000
300000
350000
400000
450000
500000
2000 2001 2002 2003 2004 2005
Nu
mb
er o
f R
egis
trati
on
s
Year
Medium-Duty
TrucksLight-Duty Vehicles
Other Diesel
Passenger Vehicles

57
Figure 7: US diesel consumption by end use (Polk 2005).
Figure 8: United States domestic consumption and crush (CRB 2006).
100000
1000000
10000000
100000000
2000 2001 2002 2003 2004 2005
Th
ou
san
ds
of
Gall
on
s p
er Y
ear
(Log S
cale
)
Year
Residential
Commercial
Industrial
Oil
CompaniesFarms
Electric
UtilitiesRailroads
Vessel
BunkeringOn-Highway
0
10000
20000
30000
40000
50000
60000
1996-97 1997-98 1998-99 1999-00 2000-01 2001-02 2002-03 2003-04 2004-05 2005-06
Th
ou
san
ds
of
Met
ric
Ton
s
Agricultural Year
Domestic
UseCrush
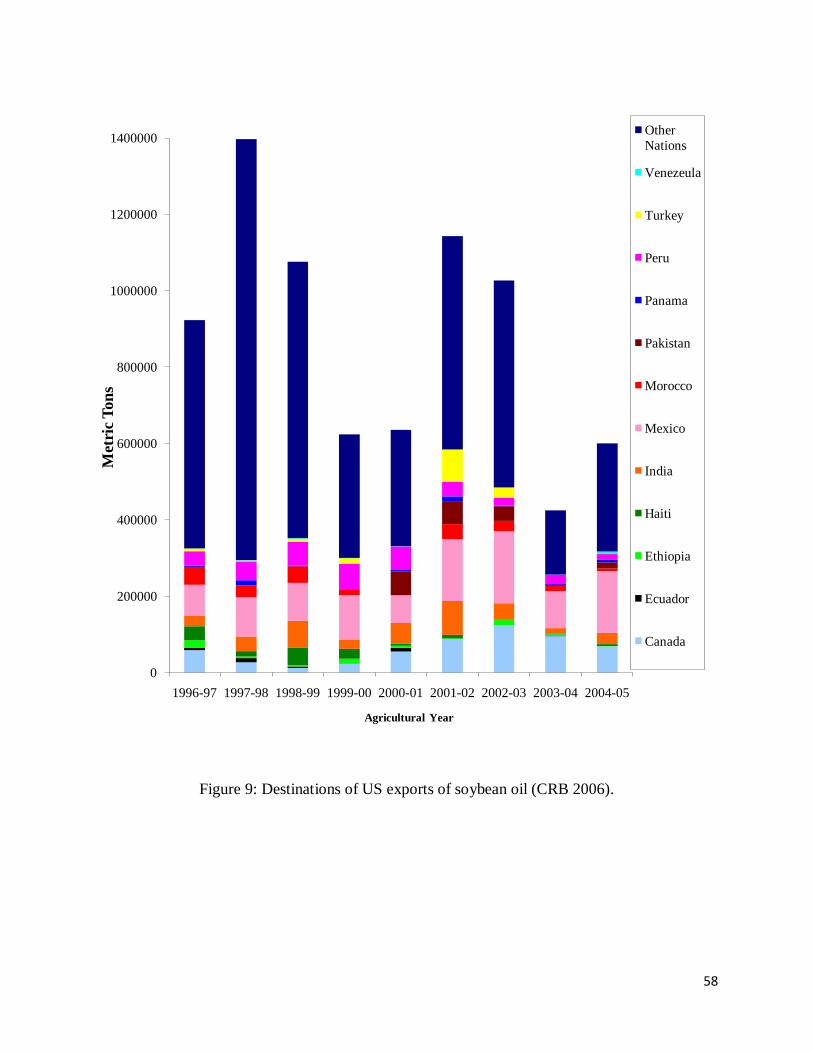
58
Figure 9: Destinations of US exports of soybean oil (CRB 2006).
0
200000
400000
600000
800000
1000000
1200000
1400000
1996-97 1997-98 1998-99 1999-00 2000-01 2001-02 2002-03 2003-04 2004-05
Met
ric
Ton
s
Agricultural Year
Other
Nations
Venezeula
Turkey
Peru
Panama
Pakistan
Morocco
Mexico
India
Haiti
Ethiopia
Ecuador
Canada

59
Figure 10: World production and crush of canola (CRB 2006).
Figure 11: US Acquisition and disappearance of canola oil (CRB 2006).
0
5000
10000
15000
20000
25000
30000
35000
40000
45000
50000
1998-99 1999-00 2000-01 2001-02 2002-03 2003-04 2004-05 2005-06
Th
ou
san
ds
of
Met
ric
Ton
s
Agricultural Year
World
Production
World
Crush
0
100
200
300
400
500
600
700
800
900
1998-99 1999-00 2000-01 2001-02 2002-03 2003-04 2004-05 2005-06
Th
ou
san
ds
of
Met
ric
Ton
s
Agricultural Year
Oil
Production
Oil Imports
Oil Domestic
Use
Oil Exports

60
Figure 12: World production of palm oil (CRB 2006).
10
100
1000
10000
100000
1995/961996/971997/981998/991999/002000/012001/022002/032003/042004/05
Th
ou
san
ds
of
Met
ric
Ton
s (L
og S
cale
)
Year
Brazil
Cameroon
Colombia
Costa Rica
Ecuador
Ghana
Indonesia
Ivory Coast
Malaysia
Nigeria
Papua New
GuineaThailand

61
Figure 13: Major palm oil exporting nations (CRB 2006).
0
2000
4000
6000
8000
10000
12000
14000
1995/96 1996/97 1997/98 1998/99 1999/00 2000/01 2001/02 2002/03 2003/04 2004/05
Th
ou
san
ds
of
Met
ric
Ton
s
Agricultural Year
Hong Kong
Indonesia
Malaysia
Papua New Guinea
Singapore

62
Figure 14: World production of sunflower seed oil (CRB 2006).
200
700
1200
1700
2200
2700
3200
1995/96 1996/97 1997/98 1998/99 1999/00 2000/01 2001/02 2002/03 2003/04 2004/05
Th
ou
san
ds
of
Met
ric
Ton
s
Year
Argentina
France
Spain
Turkey
Former
USSR

63
Figure 15: Top world producers of sunflower seed (CRB 2006).
0
2000
4000
6000
8000
10000
1995/9
6
1996/9
7
1997/9
8
1998/9
9
1999/0
0
2000/0
1
2001/0
2
2002/0
3
20
03
/04
2004/0
5
Th
ou
san
ds
of
Met
ric
Ton
s
Agricultural Year
Argentina
China
France
Hungary
India
Romania
United States
Former USSR

64
Figure 16: US sunflower seed oil (CRB 2006).
Figure 17: United States crush of sunflower seed (CRB 2006).
0
100
200
300
400
500
600
1996/97 1997/98 1998/99 1999/00 2000/01 2001/02 2002/03 2003/04 2004/05 2005/06
Th
ou
san
ds
of
Met
ric
Ton
s
Year
Production
Imports
Exports
Domestic Use
0
500
1000
1500
2000
2500
1998/99 1999/00 2000/01 2001/02 2002/03 2003/04 2004/05 2005/06
Th
ou
san
ds
of
Metr
ic T
on
s
Agricultural Year
Total
Supply
Crush

65
Figure 18: Top coconut oil producers (CRB 2006).
Figure 19: Top coconut oil consumers (CRB 2006).
0
200
400
600
800
1,000
1,200
1,400
1,600
1,800
2,000
1998-99 1999-00 2000-01 2001-02 2002-03 2003-04 2004-05
Th
ou
san
ds
of
Met
ric
Ton
s
Agricultural Year
India
Indonesia
Mexico
0
100
200
300
400
500
600
700
800
900
1998-99 1999-00 2000-01 2001-02 2002-03 2003-04 2004-05
Th
ou
san
ds
of
Metr
ic T
on
s
Agricultural Year
Europe
India
Indonesia
Philippine
s

66
Figure 20: Supply and disappearance of coconut oil in the US (CRB 2006).
0
200
400
600
800
1000
1200
1400
1998-99 1999-00 2000-01 2001-02 2002-03 2003-04 2004-05
Mil
lion
s of
Pou
nd
s
Agricultural Year
Imports
Exports
Production
Inedible
Consumption
Edible
Consumption
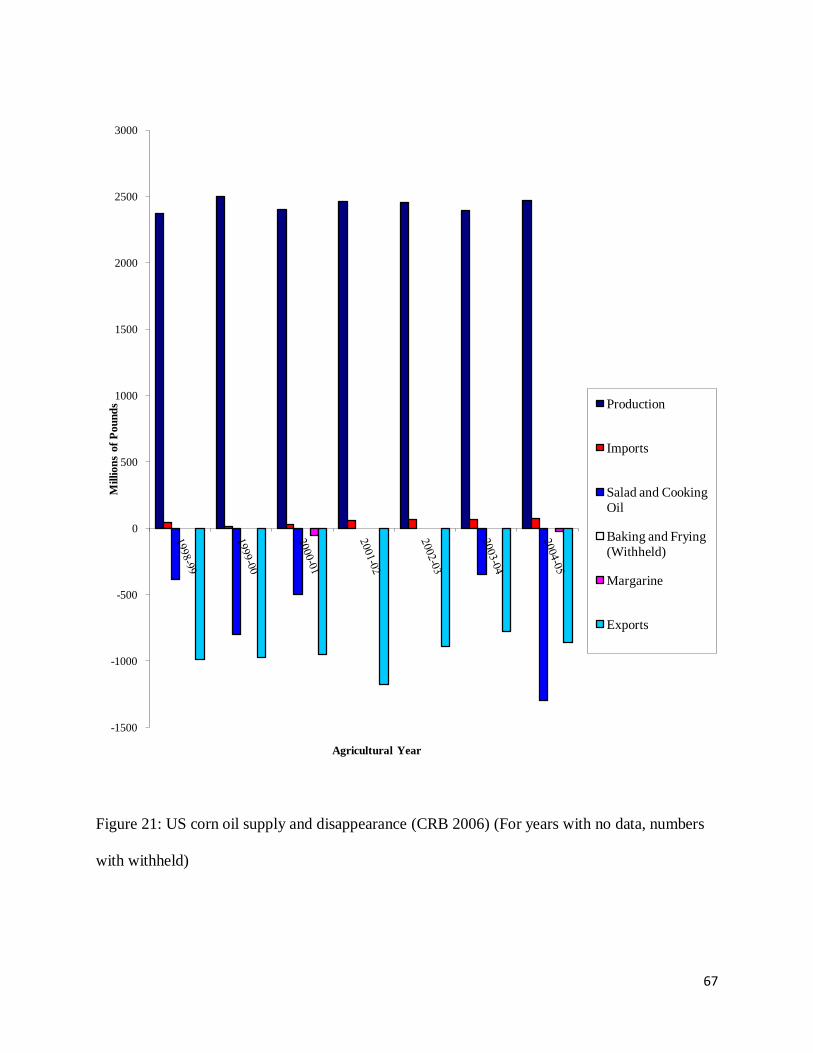
67
Figure 21: US corn oil supply and disappearance (CRB 2006) (For years with no data, numbers
with withheld)
-1500
-1000
-500
0
500
1000
1500
2000
2500
3000
Mil
lio
ns
of
Po
un
ds
Agricultural Year
Production
Imports
Salad and Cooking
Oil
Baking and Frying
(Withheld)
Margarine
Exports

68
Figure 22: Top producers of peanuts (in the shell) (CRB 2006).
Figure 23: 2005 top producers of lard (CRB 2006).
0
2000
4000
6000
8000
10000
12000
14000
16000
1996/97 1997/98 1998/99 1999/00 2000/01 2001/02 2002/03 2003/04 2004/05 2005/06
Th
ou
san
ds
of
Metr
ic T
on
s
Agricultural Year
China
India
Indonesia
Nigeria
United States
0 500 1000 1500 2000 2500 3000 3500
Brazil
Canada
China
France
Germany
Italy
Poland
Spain
USA
Former U.S.S.R.
Thousands of Metric Tons
Cou
ntr
y

69
Figure 24: World production of tallow and grease (CRB 2006).
100
1000
10000
1995 1996 1997 1998 1999 2000 2001 2002 2003 2004
Th
ou
san
ds
of
Metr
ic T
on
s (L
og
Sca
le)
Year
Argentina
Australia
Brazil
Canada
France
Germany
Netherlands
New
Zealand
Russia
United
Kingdom
United
States


![Dr. Eng. Hassan El Shimi · [3] El Shimi, Hassan Ibrahim. (2018). "Potential Feedstocks for Biodiesel and Oleochemicals Production: A Case Study of Thailand". Renewable & Sustainable](https://img.pdfslide.us/doc/110x75/5e1a14501a58e145ff19493a/dr-eng-hassan-el-shimi-3-el-shimi-hassan-ibrahim-2018-potential-feedstocks.jpg)


![Impact of the U.S. [Insert Title] [Year] Biodiesel ......biodiesel feedstocks) below which increasingly incremental demand for biodiesel would push soybean oil prices up to at least](https://img.pdfslide.us/doc/110x75/5feaf35b1f939f4e6e5ae642/impact-of-the-us-insert-title-year-biodiesel-biodiesel-feedstocks.jpg)