Embed Size (px)
Citation preview
Total fatty acid production in golden alga Prymnesium parvum a potential bio-diesel
feedstock [ Analyzing the fatty acids in select strains of P. parvum using gas chromatography ]
College of Agriculture and Life Sciences
Project and Report for Masters in Plant Science and Pest Management Bruce Culver
11/29/2014 Page 2 of 43
Research Contact Information Bruce Culver –Graduate Student Department of Horticulture, Virginia Tech Blacksburg, Virginia 24061-0327 Phone: 732 740-2786 Fax: 540 231 3083 [email protected] Research Advisory Committee
Greg Welbaum – Department of Horticulture 306B Saunders Hall - 0327 Virginia Tech, Blacksburg, VA 24061 Phone: 540 231 5801 [email protected] Zhiyou Wen – Biological Systems Engineering 200 Seitz Hall - 0303 Virginia Tech, Blacksburg, VA 24061 Phone: 540-231-9356 [email protected] Jerzy Nowak - Peace Studies and Violence Prevention / Director 101 Wallace Hall - 0911 Blacksburg, VA 24061 (540) 231-2663 [email protected] Doug Pfeiffer – Department of Entomology 205C Price Hall - 0319 Virginia Tech, Blacksburg, Virginia 24061 (540) 231-4183 [email protected]
11/29/2014 Page 3 of 43
Contents
Abstract…………………………………………………………………………….4
Introduction………………………………………………………………………...5
Life Cycle Analysis………….………………….…….…………………………....8
Materials and Methods……………………………………………………….…...10
Results and Discussion...………………………………………………………….19
Conclusion…...……………………………………………………………………29
Acknowledgments………………………………………………………………...31
Appendix……………………………………………………………………….....32
References………………………………………………………………………...38
11/29/2014 Page 4 of 43
Total fatty acid production in golden alga Prymnesium parvum a
potential bio-diesel feedstock
Bruce Culver a, Greg Welbaum a, Zhiyou Wen b
a Department of Horticulture, Virginia Polytechnic Institute and State University, Blacksburg VA 24061,
United States, b Department of Biological Systems Engineering, Virginia Polytechnic Institute and State University,
Blacksburg VA 24061, United States
Abstract
Developing renewable and sustainable feedstocks for biodiesel production is one strategy for reducing
our dependence on petroleum-based fuel. Microalgae are attractive feedstocks for biodiesel due to their
high lipid content and fast growth rate. In addition algae, can be cultured on marginal lands using
saline water and thus avoiding competition with arable land. This study investigates the total fatty acid
content in Prymnesium parvum, which has the potential as a feedstock for biodiesel production.
Prymnesium parvum was cultured in artificial sea water with the salinity adjusted to 14 - 15 (psu) and a
pH ranging from 7.8 - 8.5. The culture temperature was 25.7°C under florescent light with a 16:8 (L/D)
cycle. Total fatty acids produced had a mean of 11.679 % ± 0.68671 (DW). These percentages were
below the 22-38% previously reported by E. W. Becker 1994. Total algal biomass produced had a
mean yield of 0.34mg ± 0.07204 (DW) / L. In comparison to other algal species used as feedstocks, P.
parvum produced significantly less fatty acids and biomass. Prymnesium parvum also exhibited signs
of self toxicity with frequent crash cycles. The self toxicity would have contributed to its inability to
produce both lipids and dry biomass. Further studies for increasing fatty acid production in P. parvum
may require using a continuous bioreactor system, controlling environmental conditions to relieve self-
toxicity and adjusting nutrient concentrations. Exposure to different light/dark regiments along with
increasing CO2 concentrations should be explored to possibly increase yields.
Keywords: Prymnesium parvum; Biodiesel feedstock; Total fatty acids
11/29/2014 Page 5 of 43
Introduction
Developing renewable and sustainable feedstocks for biodiesel production is one strategy for
reducing our dependence on petroleum-based transportation fuels. Biodiesel produced from
microalgae lipids are gaining popularity within the research community and have the potential to
replace current feedstocks such as chicken fat if the technologies for growing algae and
conversion of lipids to fuel are vastly improved (Chisti 2008).
Currently vegetable oils, animal fats and waste oils from cooking are used for biodiesel
production. Microalgae produce fatty acids that can be converted into esters used in biodiesel
synthesis, these esters are comparable to those produced from either animal and vegetable oils
(Miyamoto 1997). These cellular lipids are membrane components, storage molecules and
metabolites used in algal cell proliferation and buoyancy (Halver 1978). It is reported that the oil
content of some algae species can exceed 80% (DW) in comparison to such crops as soybean or
oil palm which produce less than 5 % of their total biomass as oil (Chisti 2008). In order to
limit infrastructure, production and harvesting costs, technologies for converting microalgae
feedstocks into biodiesel need improvement (Miao and Wu 2006).
In an algal comparison chart listed in the book entitled Microalgae: Biotechnology and
Microbiology by E. W. Becker 1994, a strain of Algae Prymnesium parvum was listed as a
potential species for bioenergy production with a high lipid percentage between 22-38% on a
fresh or dry weight basis?. This same table was included in the 1997 - FAO Agricultural
Bulletin 128 (Renewable Biological Systems for Sustainable Energy) and thus presented again as
a potential species for biodiesel production (Miyamoto 1997).
11/29/2014 Page 6 of 43
There are no current studies that explicitly consider the lipid production of P. parvum under
optimal growth conditions for use as a feedstock for biodiesel and it seems prudent to investigate
its potential. The objectives of this project were to evaluate P. parvum as lipid producer. Growth
rates were calculated to evualate the biomass production capability of this species.
Prymnesium parvum (Haptophyceae) is a golden alga that is highly toxic to fish and found in
both marine and brackish waters worldwide. The distribution of P. parvum ranges from the
Baltic Sea to South Africa; from China to Australia and from Canada to Texas. This wide
distribution, makes P. parvum an ideal species to investigate biodiesel feedstock potential, since
it is naturally adapted to temperate regions (Edvardsen and Larsen 2003).
Prymnesium parvum is extensively studied due to its toxicity in both benthic and pelagic
organisms (Uronen et al. 2007). Prymnesium parvum was not listed in the U.S. Aquatic Species
Program (ASP) in 1998 where 3000 algal strains were screened as potential candidates for bio-
fuel feedstock. The program eventually narrowed the collection to roughly 300 species; mostly
green algae (Chlorophyceae) and diatoms (Bacillariophyceae) for further evaluation (Sheehan et
al. 1998).
The most likely scenario why P. parvum was not chosen as a candidate for the (ASP) is due to its
potential invasive and toxic nature. If cultivated in outdoor raceway ponds it may contaminate
nearby waters if released accidentally. The Aquatic Species Program concluded that outdoor
raceway cultivation was highly productive if pH and CO2 were optimized (Sheehan et al. 1998),
but photobioreactors with recirculation systems have higher biomass production rates (Chisti
11/29/2014 Page 7 of 43
2007). Prymnesium parvum may have the potential for indoor cultivation if proper growth
parameters for lipid synthesis are established. The current trend is to identify fast growing-high
lipid containing algae for indoor/outdoor bioreactor systems. These algae must maintain long
term growth and sustainability in controlled environments. Studies have been conducted on P.
parvum evaluating optimal conditions for toxicity to other organisms in relationship to light, pH,
temperature and salinity ( Larsen and Bryant 1998) (Baker et al. 2007). However sustainability
of growth in culture remains to be studied.
It has been shown that the toxicity of P. parvum is correlated with low phosphorus and nitrogen
conditions that limit optimal growth condition (Johansson and Graneli 1999). Acute toxicity to
fish was highest at the lowest salinity and temperatures , conditions not optimal for exponential
growth of this species. These limiting growth factors combined with low pH contribute to the
physiological stress on the algae, which released toxins into the environment. Maximum growth
rates and highest cell mass of P. parvum were found under warm estuarine conditions (Baker et
al. 2007). Algae under nutrient deficient conditions had the capacity to produce higher lipid
percentages while overall growth was slowed (Sheehan et al. 1998). Maximum growth rate
recorded for P. parvum was 1.4 divisions per day (Edvardsen and Larsen 2003).
Prymnesium parvum is suspected of producing an array of toxins but only two have been
formally characterized and named: prymnesins 1 and 2. These toxins were reported to have
potent hemolytic and ichthyotoxic properties (Igarashi et al. 1996).
11/29/2014 Page 8 of 43
Determining whether P. parvum is a good feedstock for bio-diesel production was the primary
purpose of this report. Feedstock sources for biodiesel must be capable of producing large
amounts of degradable biomass and contain large percentages of total fatty acids for easy
conversion into biodiesel (Sheehan et al.1998).
An objective of this study was to determine whether the total fatty acid content between 22-38%
quoted in FAO Agricultural Bulletin 128 (Miyamoto 1997) could be rountinely obtained in
contained indoor culture. The second hypothesis to be tested is whether P. parvum could yield
adequate to high biomass in addition to producing 22-38% fatty acids. The last objective was to
determine whether P. parvum could sustain and thrive under optimal growth conditions in an
indoor controlled environment.
This study examined growth and lipid contents of three strains of P. parvum grown under
controlled nutrient, light, temperature and salinity conditions, in an attempt to optimize biomass
and hydrocarbon production.
Life Cycle Analysis
Three major limiting factors in the production of algae for biodiesel are sustainable growth,
biomass production and lipid content (Sheehan et al. 1998). Other hurdles exist when
considering algae as a sustainable energy source. During outdoor cultivation, problems
maintaining homogeneity among algal strains is effected by uncontrollable environmental
conditions (Sheehan et al. 1998). Algae in controlled environments are hard to sustain over long
periods without collapse or contamination (Hoff and Snell 2007). Some algae that have the
11/29/2014 Page 9 of 43
highest concentrations of lipids are freshwater algae (Li et al 2008) so a usable fresh water
source is a factor to consider within the life cycle analysis.
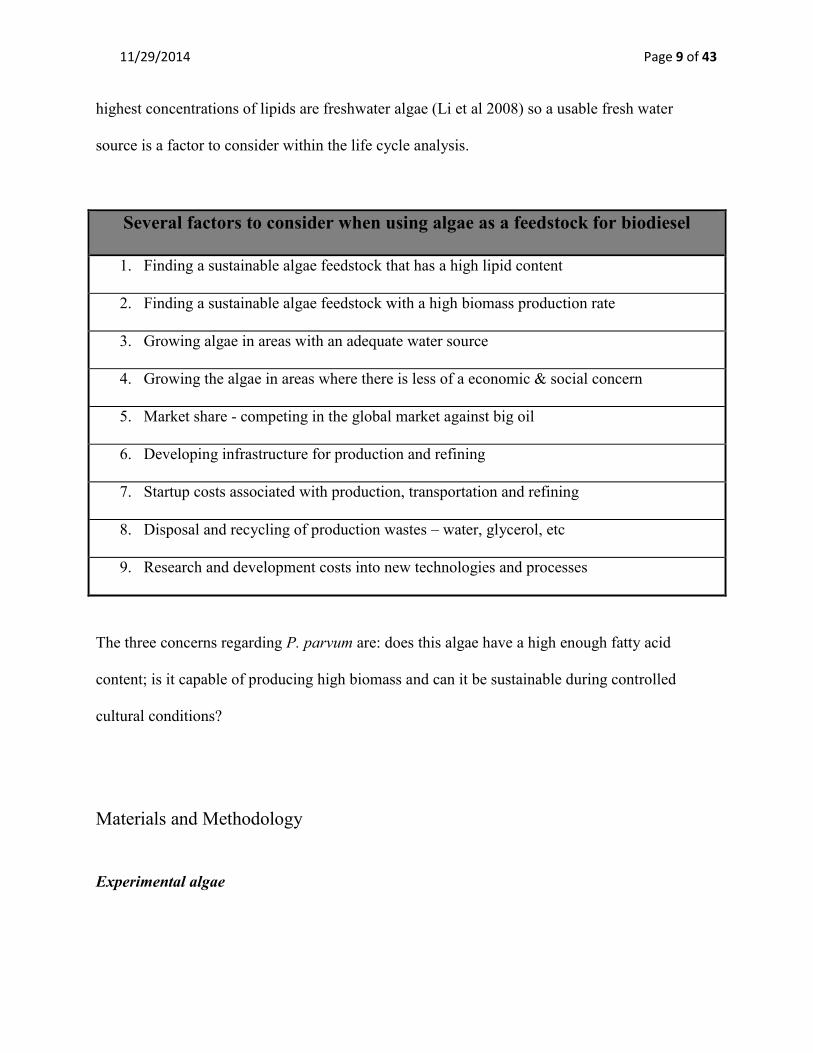
Several factors to consider when using algae as a feedstock for biodiesel
1. Finding a sustainable algae feedstock that has a high lipid content
2. Finding a sustainable algae feedstock with a high biomass production rate
3. Growing algae in areas with an adequate water source
4. Growing the algae in areas where there is less of a economic & social concern
5. Market share - competing in the global market against big oil
6. Developing infrastructure for production and refining
7. Startup costs associated with production, transportation and refining
8. Disposal and recycling of production wastes – water, glycerol, etc
9. Research and development costs into new technologies and processes
The three concerns regarding P. parvum are: does this algae have a high enough fatty acid
content; is it capable of producing high biomass and can it be sustainable during controlled
cultural conditions?
Materials and Methodology
Experimental algae
11/29/2014 Page 10 of
43
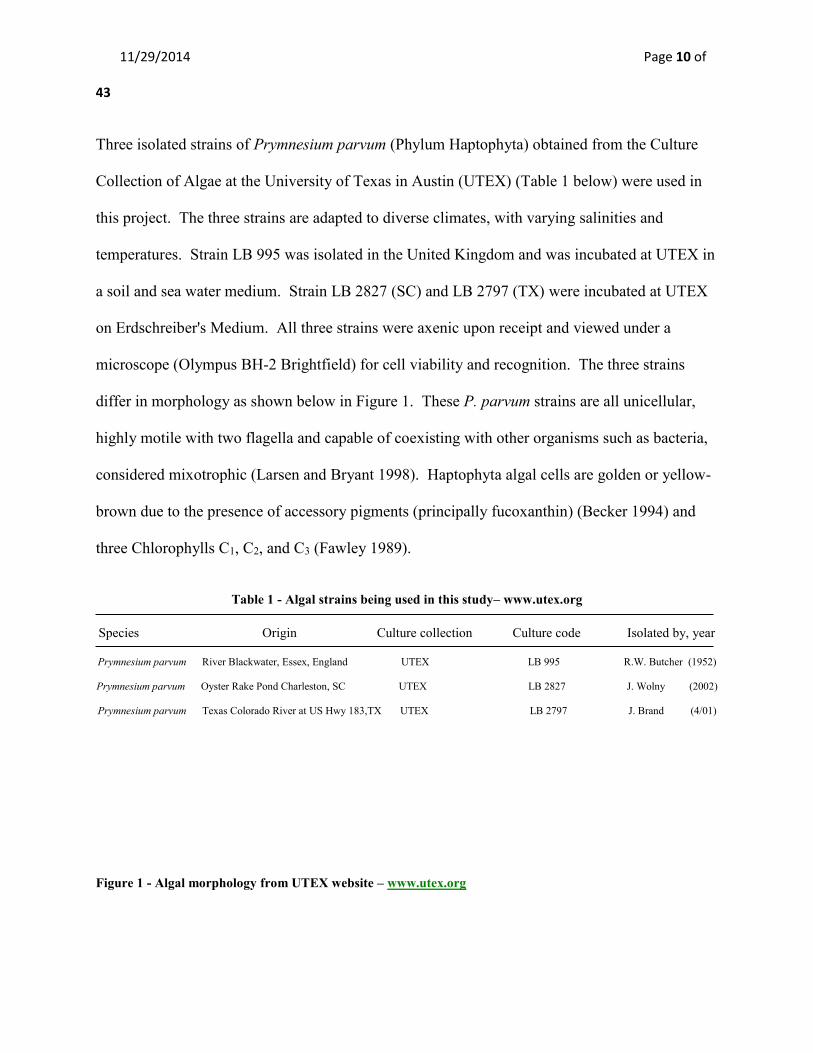
Three isolated strains of Prymnesium parvum (Phylum Haptophyta) obtained from the Culture
Collection of Algae at the University of Texas in Austin (UTEX) (Table 1 below) were used in
this project. The three strains are adapted to diverse climates, with varying salinities and
temperatures. Strain LB 995 was isolated in the United Kingdom and was incubated at UTEX in
a soil and sea water medium. Strain LB 2827 (SC) and LB 2797 (TX) were incubated at UTEX
on Erdschreiber's Medium. All three strains were axenic upon receipt and viewed under a
microscope (Olympus BH-2 Brightfield) for cell viability and recognition. The three strains
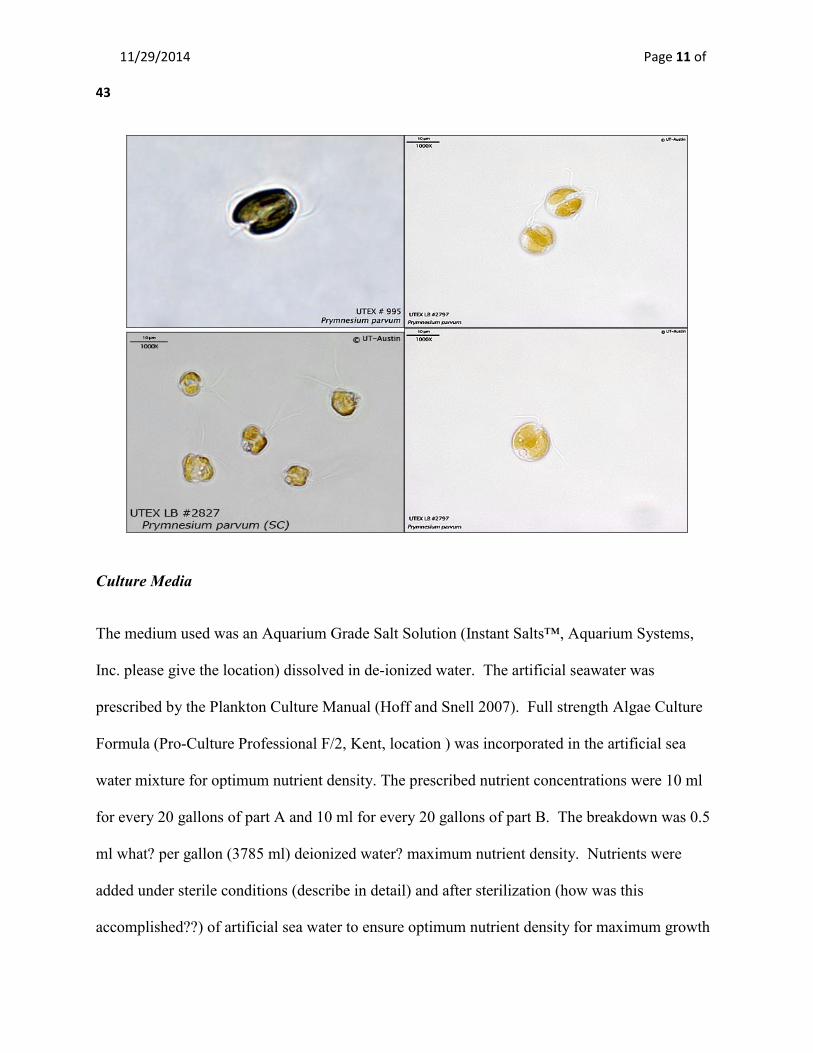
differ in morphology as shown below in Figure 1. These P. parvum strains are all unicellular,
highly motile with two flagella and capable of coexisting with other organisms such as bacteria,
considered mixotrophic (Larsen and Bryant 1998). Haptophyta algal cells are golden or yellow-
brown due to the presence of accessory pigments (principally fucoxanthin) (Becker 1994) and
three Chlorophylls C1, C2, and C3 (Fawley 1989).
Table 1 - Algal strains being used in this study– www.utex.org
Species Origin Culture collection Culture code Isolated by, year
Prymnesium parvum River Blackwater, Essex, England UTEX LB 995 R.W. Butcher (1952)
Prymnesium parvum Oyster Rake Pond Charleston, SC UTEX LB 2827 J. Wolny (2002)
Prymnesium parvum Texas Colorado River at US Hwy 183,TX UTEX LB 2797 J. Brand (4/01)
Figure 1 - Algal morphology from UTEX website – www.utex.org
11/29/2014 Page 11 of
43
Culture Media
The medium used was an Aquarium Grade Salt Solution (Instant Salts™, Aquarium Systems,
Inc. please give the location) dissolved in de-ionized water. The artificial seawater was
prescribed by the Plankton Culture Manual (Hoff and Snell 2007). Full strength Algae Culture
Formula (Pro-Culture Professional F/2, Kent, location ) was incorporated in the artificial sea
water mixture for optimum nutrient density. The prescribed nutrient concentrations were 10 ml
for every 20 gallons of part A and 10 ml for every 20 gallons of part B. The breakdown was 0.5
ml what? per gallon (3785 ml) deionized water? maximum nutrient density. Nutrients were
added under sterile conditions (describe in detail) and after sterilization (how was this
accomplished??) of artificial sea water to ensure optimum nutrient density for maximum growth
11/29/2014 Page 12 of
43
(what was the optimum nutrient density? Is nutrient density the same as concentration?) (Hoff
and Snell 2007).
Culturing Method
The culturing method was the Modified Batch Culture Method, which allows the ability to scale
up to higher quantities for optimum biomass production (what exactly does this mean, please
describe the methode not how it can be used). This method insures the continuation of the initial
cultures after leaving the lag phase and into an exponential growth phase (but what exactly is
it?). After 8-days of exponential growth they what is they? can be divided into larger vessels and
new inoculations can be derived from the exponential cultures. This method is used for a
continuous culturing system like that in raceway ponds but not indoor bioreactors so is it the
same or different then these two? What exactly is a bioreactor? (Hoff and Snell 2007). The
down side to this method can be algae contamination or cultures that exhibit fatigue (how does
algae show fatigue) over a long period of time. It is best to maintain stock cultures in an event of
a colony collapse (Hoff and Snell 2007). Yes this sounds like common sense to me and a sound
scientific principle
The axenic what does this mean?strains (20-25 ml) were transferred from the UTEX mediums
what is this typle of media into 125 ml of prepared (autoclaved nutrient dense what does this
mean?) room temperature what are you calling room temperature better to use degrees media
under a Laminar Flow Hood. The sterile 500 ml flasks were placed in a special designed growth
chamber ( wouldn’t call this a growth chamber, this means something else to most people,
11/29/2014 Page 13 of
43
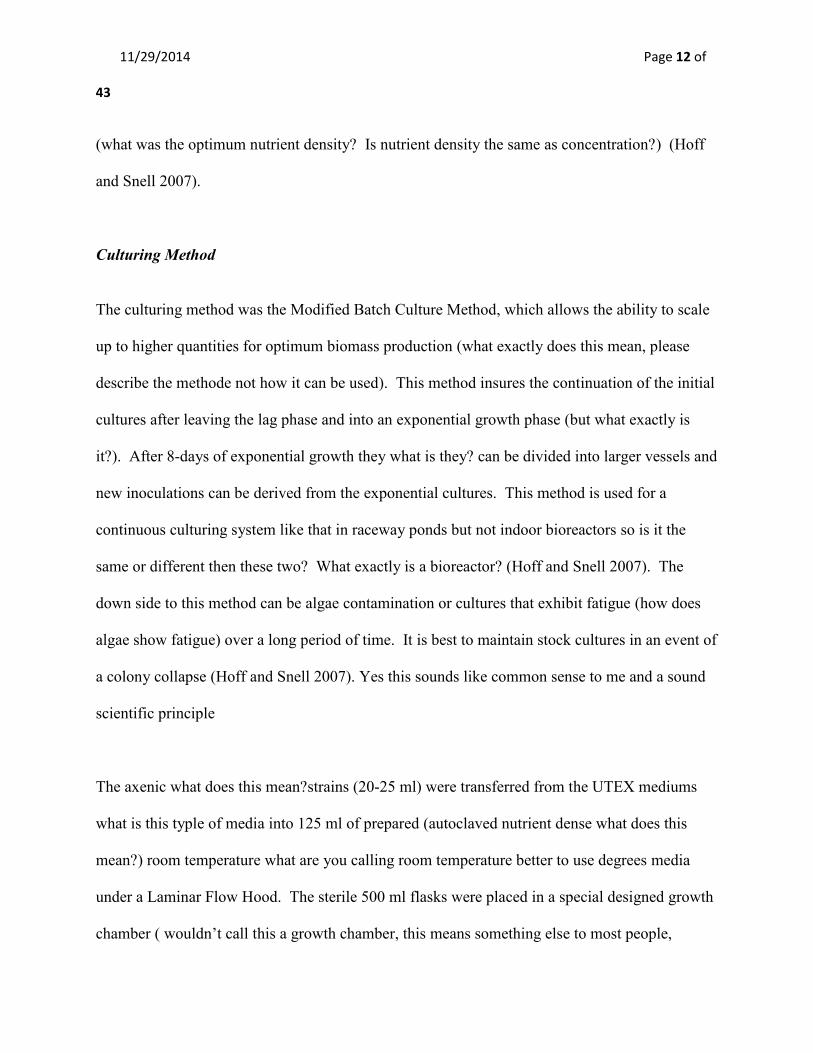
Perhaps growth bench? (Figure 2) and cultures were suspended with forced filtered air under
optimum light and temperature You must define what you mean by optimum. All transferring
utensils, down tubes, flasks were sterilized using a GETINGE Castle 123 Multitherm Steam
Sterilizer.
Figure 2: Reflective Mylar is used in enclosed growth chamber with optimal light and temperature control
Photoperiod, Light Intensity and Temperature
UTEX cultures were transferred to a sterilized culture media and subjected to a photoperiod of
16/8 L:D cycle (Hoff and Snell 2007). The growth chamber was 2 x 3 x 6 four sided rectangular
structure and lined with Mylar to distribute light proportionally throughout the chamber and to
block out any ambient light during the dark cycle (Demetropoulos and Langdon 2004). The
chamber florescent lights used were a combination 48" F40 Ecolux Plant & Aquarium (that
11/29/2014 Page 14 of
43
contain a combination of phosphors which produce light rich in reds and blues) and a F40
Sunshine Light that are full spectrum. Six lights were alternately positioned above while two
alternate lights were positioned on the lower back side of the chamber behind the growth flasks
(Figure 2).
The Photon fluence rates were measured using a LI-COR Quantum/Radiometer/ Photometer –
Model LI-250 Light Meter. Positions surrounding the flasks were measured and the mean light
received was 114.85 µmol photons m-2 · s -1. This photon fluence rate is comparable to previous
studies conducted by Larsen and Bryant 1998 and Baker et al. 2007.
Prymnesium parvum is very eurythermal (able to withstand extreme temperature variations)
(Larsen and Bryant 1998). The cultures were maintained at an average temperature of 25.6 -
25.8° C during the light cycle and 23° C during the dark cycle. The temperature was measured
using a hand-held YSI ® Model 63 pH, conductivity, temperature and salinity meter. Maximum
growth potential for P. parvum was recorded at temperatures between 25° C and 30° C at
moderate salinity (Baker et al. 2007).
Salinity and pH
Prymnesium parvum is extremely euryhaline (able to adapt to wide range of salinity) (Larsen and
Bryant 1998). The cultures were maintained at ½ concentration of prescribed “Instant Salts” ™
11/29/2014 Page 15 of
43
in a range between 14 and 15 practical salinity units (psu). The optimal salinity was determined
by Baker et al. 2007 and Larsen and Bryant 1998 at 22 psu. Most algae found in bay waters and
brackish estuaries tolerate a salinity between 12-27 parts-per-thousand (ppt) which when
converted is close to psu measurements not accounting for temperature and dissolved oxygen
(Hoff and Snell). Toxic blooms have been associated with extreme low and high salinities but at
lower temperatures than this experiments (Baker et al. 2007).
The pH measured ranged between 7.8 - 8.51 depending on the light and dark cycles. Optimal pH
for salt tolerant algae in artificial seawater is between 7.5 and 8.5 (Hoff and Snell). Both the
salinity and pH was measured using a hand-held YSI ® Model 63 pH, conductivity, temperature
and salinity meter.
Algal Cell Counts, Harvesting, Drying and Lipid Analysis
Direct cell counts were taken to measure cell growth rates under an Olympus BH-2 Brightfield
Microscope using a Neubauer hemacytometer at 10X objective (100X magnification). Cell
counts were conducted before inoculation, during exponential growth phase, during a stationary
growth phase and during a death or crash phase (Hoff and Snell 2007). Four counts total were
taken per sample and averaged; then recorded using a hand held counter for accuracy. Counts
were taken twice daily or once daily depending on the experiment run. The motile cells were
killed using formalin; a mixture of formaldehyde, methanol and water to assure no cell
movement. Cell counts are expressed as cells/ml (Hoff and Snell 2007).
11/29/2014 Page 16 of
43
Algal cells were harvested and poured into centrifuge tubes and centrifuged at 9000 rpm for 9
minutes. The algal cells were harvested and frozen at – 20° C until samples were able to be
freeze dried over period between 72 – 96 hours. The freeze dryer used was a LABCONCO –
Freezone ® 1 Liter Bench top Freeze Dry System. The freeze drying method assures that
samples can be adequately weighed for total cell dry weight (Zhanyou et al 2007).
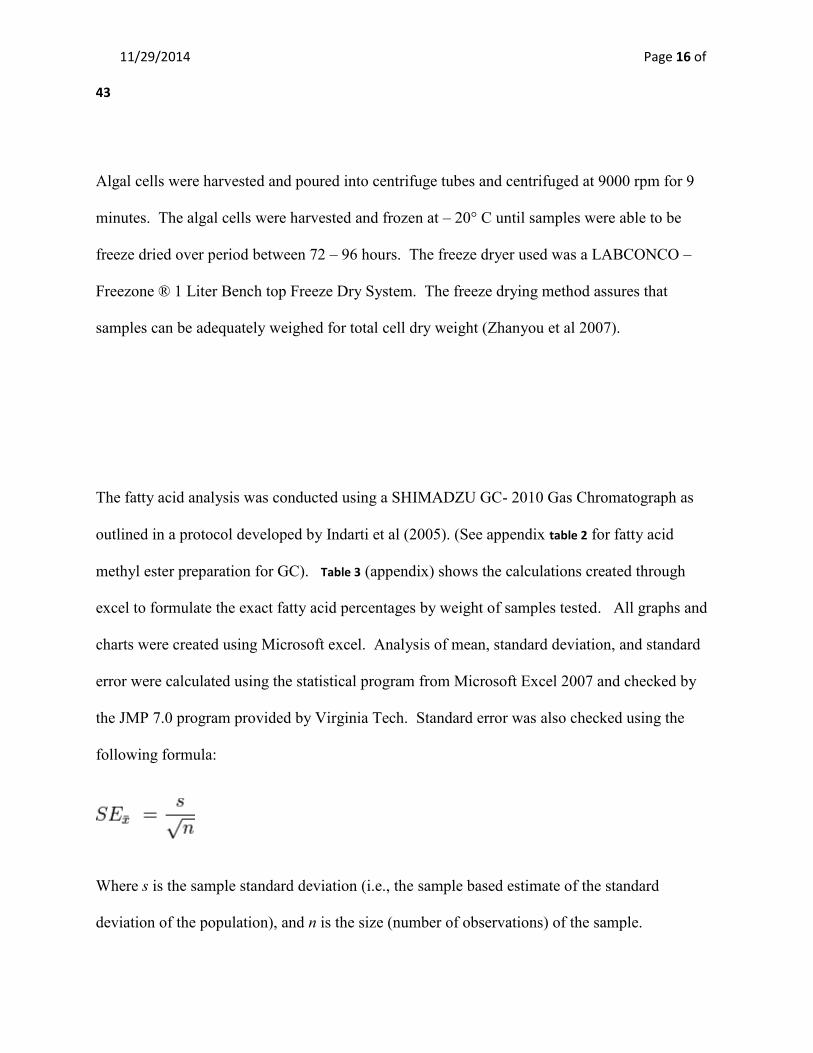
The fatty acid analysis was conducted using a SHIMADZU GC- 2010 Gas Chromatograph as
outlined in a protocol developed by Indarti et al (2005). (See appendix table 2 for fatty acid
methyl ester preparation for GC). Table 3 (appendix) shows the calculations created through
excel to formulate the exact fatty acid percentages by weight of samples tested. All graphs and
charts were created using Microsoft excel. Analysis of mean, standard deviation, and standard
error were calculated using the statistical program from Microsoft Excel 2007 and checked by
the JMP 7.0 program provided by Virginia Tech. Standard error was also checked using the
following formula:
Where s is the sample standard deviation (i.e., the sample based estimate of the standard
deviation of the population), and n is the size (number of observations) of the sample.
11/29/2014 Page 17 of
43
Population doubling time (T2), population growth rates (r) and divisions per day (k) were
calculated using growth curve analysis equations developed by Guillard in 1973 and listed below
(Andersen 2004).
Equation 1: r = ln (N1/N0) / Δ t
Equation 2: k= r/0.6931
Equation 3: k= log2 (N1/N0) / Δ t
Equation 4: T2 = 0.6931/r
Algae Growth Trials
Growth Trial One and Trial Two – Hampton Virginia Seafood AREC Summer 2008
During these two trials three strains of Prymnesium parvum (UK) LB 995, (SC) LB 2827, and
(TX) LB 2797 were used. The growth conditions were different from the trials conducted in
Blacksburg and real filtered seawater was used with salinity at 18 ppt. Medium temperature was
29° C and pH was between 7.8 and 8.53. Light intensity was not measured and all nutrients used
were as described above (Culture Media) using Kent F/2 full strength solution. Water and
utensils were autoclaved and the alga was suspended with forced filtered air. Algae was grown
on a 12:12 L:D cycle as mentioned in Baker et al 2007. Algae was counted using a
hemacytometer and recorded for growth analysis. No samples were collected for lipid analysis
11/29/2014 Page 18 of
43
during these two trials. Algae were transferred from 1 liter flasks to 5 gallon Carboys for a study
injecting bottled CO2 to measure pH variances and cell numbers. The trials were concluded
earlier than expected and the data was used for analyzing doubling times of algae.
Growth and Lipid Analysis Trial Three, Four, Five – Biological Systems Engineering - Blacksburg
Virginia (fall 2008 – spring 2009)
During these three trials three strains of Prymnesium parvum (UK) LB 995, (SC) LB 2827, and
(TX) LB 2797 were tested. All environmental conditions are described in the material and
methods. During trial three in Blacksburg; cell counts where only taken at harvesting time and
analyzed for lipids. During trials four and five (once the algae grew out of the lag phase into the
exponential growth phase) 1-liter of algae was distributed between eight-sterile 1-liter flasks at
125 ml per flask. The initial cell count before inoculation was recorded at 3,972,500/ ml. An
additional 375 ml of media was added to each flask under sterile condition in a laminar hood. In
trial four - cell counts were recorded each day for 12 days to determine if lipid percentages
would increase or decrease over time and to determine each phase of the growth cycle. Before
the trial ended cells from the first three flasks were transferred under sterile conditions to
inoculate a new 1-liter flask to start the fifth trial (a modified batch method).
During trial five the initial cell counts before inoculation was recorded at 3,900,000/ ml. Once
again 125 ml per flask was distributed into eight 1-liter flasks and additional 375 ml of media
was added to each flask. In this trial cell counts were recorded each day of harvesting from day
7 - 14. The overall biomass was weighed after freeze drying and lipids were analyzed to see if
11/29/2014 Page 19 of
43
yields were lost or gained over time. Two trials were not conducted due to algae crashes in
January and March, which will be discussed in the results section. The statistical analysis used is
the same as stated above.
Results and Discussion During all 5 trials three strains of Prymnesium parvum (UK) LB 995, (SC) LB 2827, and (TX)
LB 2797 were tested for growth potential and lipid analysis. In both the Hampton and
Blacksburg trials both (SC) LB 2827 and (TX) LB 2797 grew well in the media culture and
showed some promising results although colony collapses did result with each strain, most likely
due to self toxicity (Olli and Trunov 2007). Out of eleven algae samples delivered from UTEX,
(TX) LB 2797 proved to be the most promising. Texas LB 2797 only failed to grow once; this
after initial inoculation. Some start up cultures failed due to low cell density and inability to
adapt to environmental changes.
11/29/2014 Page 20 of
43
The only lipid analysis of (SC) LB 2827 was conducted on samples from trial three in
Blacksburg (Graph 1- page 23). Algal strain (UK) LB 995 did not grow in any of the trials and
was discarded as a potential candidate for culturing. Out of five trials, lipid analysis was done on
18 replicates of - (TX) LB 2797 and only 2 replicates of - (SC) LB 2827 due to culture collapse.
The growth parameters used in trials 1 and 2 are similar to 3, 4 and 5 but not exact so data should
be viewed as a preliminary finding. The limited data makes it hard to substantiate the hypothesis
concretely.
Growth Rate Trial One and Trial Two – Hampton Virginia Seafood AREC Summer 2008
Computation of population growth rates, divisions per day and population doubling times were
conducted on Texas LB 2797 during trial one and two. Computation of population growth rates,
divisions per day and population doubling times were conducted on South Carolina LB 2827
during trial one. South Carolina LB 2827 failed earlier in trial two and was used in a carbon
Carboy trial not discussed in this paper since the trial was not completed.
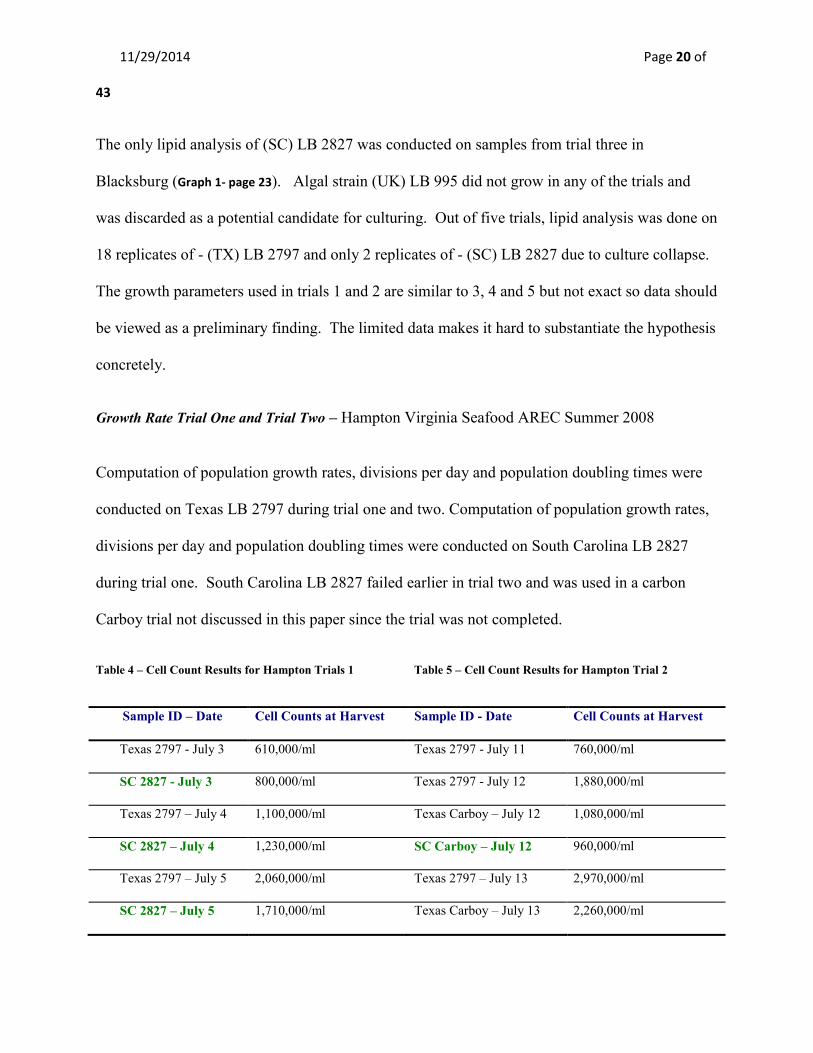
Table 4 – Cell Count Results for Hampton Trials 1 Table 5 – Cell Count Results for Hampton Trial 2
Sample ID – Date Cell Counts at Harvest Sample ID - Date Cell Counts at Harvest
Texas 2797 - July 3 610,000/ml Texas 2797 - July 11 760,000/ml
SC 2827 - July 3 800,000/ml Texas 2797 - July 12 1,880,000/ml
Texas 2797 – July 4 1,100,000/ml Texas Carboy – July 12 1,080,000/ml
SC 2827 – July 4 1,230,000/ml SC Carboy – July 12 960,000/ml
Texas 2797 – July 5 2,060,000/ml Texas 2797 – July 13 2,970,000/ml
SC 2827 – July 5 1,710,000/ml Texas Carboy – July 13 2,260,000/ml
11/29/2014 Page 21 of
43
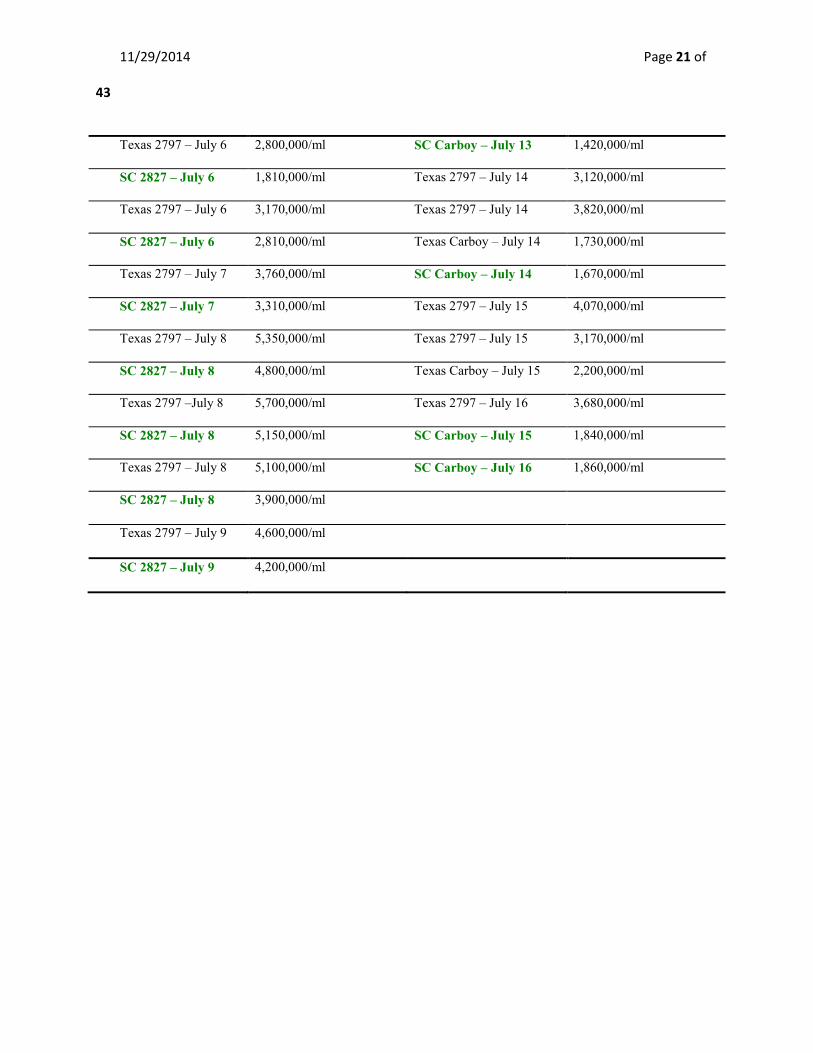
Texas 2797 – July 6 2,800,000/ml SC Carboy – July 13 1,420,000/ml
SC 2827 – July 6 1,810,000/ml Texas 2797 – July 14 3,120,000/ml
Texas 2797 – July 6 3,170,000/ml Texas 2797 – July 14 3,820,000/ml
SC 2827 – July 6 2,810,000/ml Texas Carboy – July 14 1,730,000/ml
Texas 2797 – July 7 3,760,000/ml SC Carboy – July 14 1,670,000/ml
SC 2827 – July 7 3,310,000/ml Texas 2797 – July 15 4,070,000/ml
Texas 2797 – July 8 5,350,000/ml Texas 2797 – July 15 3,170,000/ml
SC 2827 – July 8 4,800,000/ml Texas Carboy – July 15 2,200,000/ml
Texas 2797 –July 8 5,700,000/ml Texas 2797 – July 16 3,680,000/ml
SC 2827 – July 8 5,150,000/ml SC Carboy – July 15 1,840,000/ml
Texas 2797 – July 8 5,100,000/ml SC Carboy – July 16 1,860,000/ml
SC 2827 – July 8 3,900,000/ml
Texas 2797 – July 9 4,600,000/ml
SC 2827 – July 9 4,200,000/ml
11/29/2014 Page 22 of
43
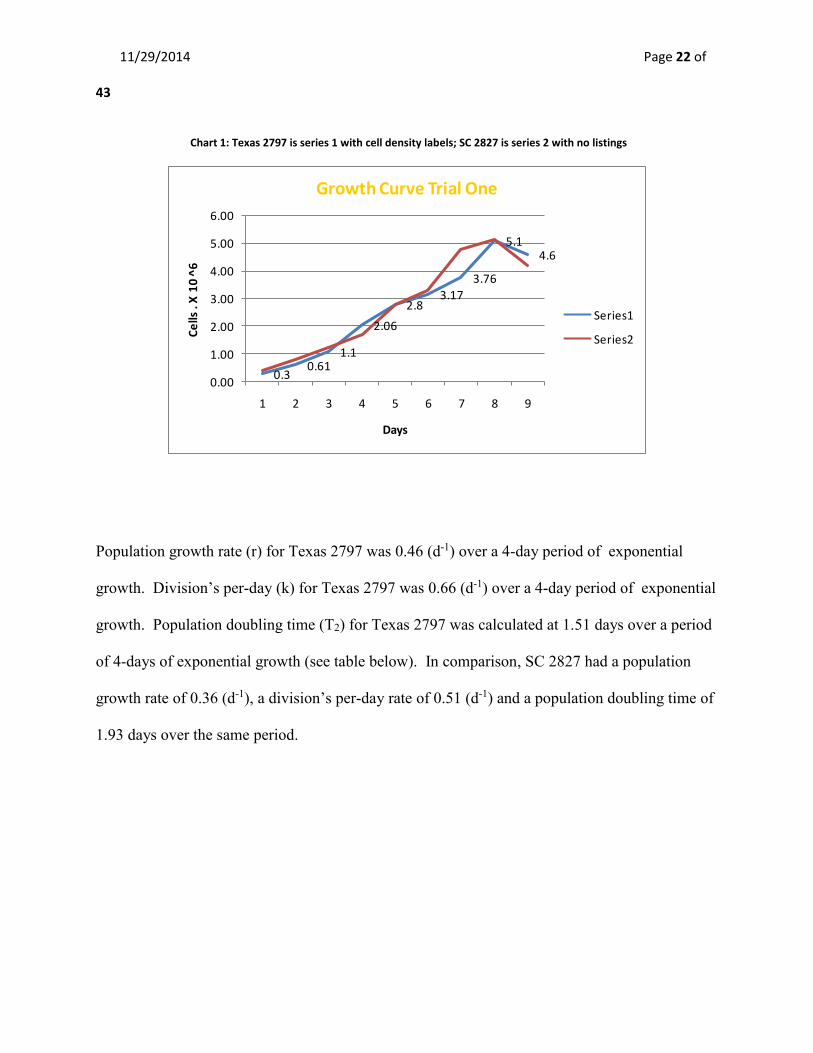
Chart 1: Texas 2797 is series 1 with cell density labels; SC 2827 is series 2 with no listings
0.30.61
1.1
2.06
2.83.17
3.76
5.14.6
0.00
1.00
2.00
3.00
4.00
5.00
6.00
1 2 3 4 5 6 7 8 9
Ce
lls .
X 1
0 ̂
6
Days
Growth Curve Trial One
Series1
Series2
Population growth rate (r) for Texas 2797 was 0.46 (d-1) over a 4-day period of exponential
growth. Division’s per-day (k) for Texas 2797 was 0.66 (d-1) over a 4-day period of exponential
growth. Population doubling time (T2) for Texas 2797 was calculated at 1.51 days over a period
of 4-days of exponential growth (see table below). In comparison, SC 2827 had a population
growth rate of 0.36 (d-1), a division’s per-day rate of 0.51 (d-1) and a population doubling time of
1.93 days over the same period.
11/29/2014 Page 23 of
43
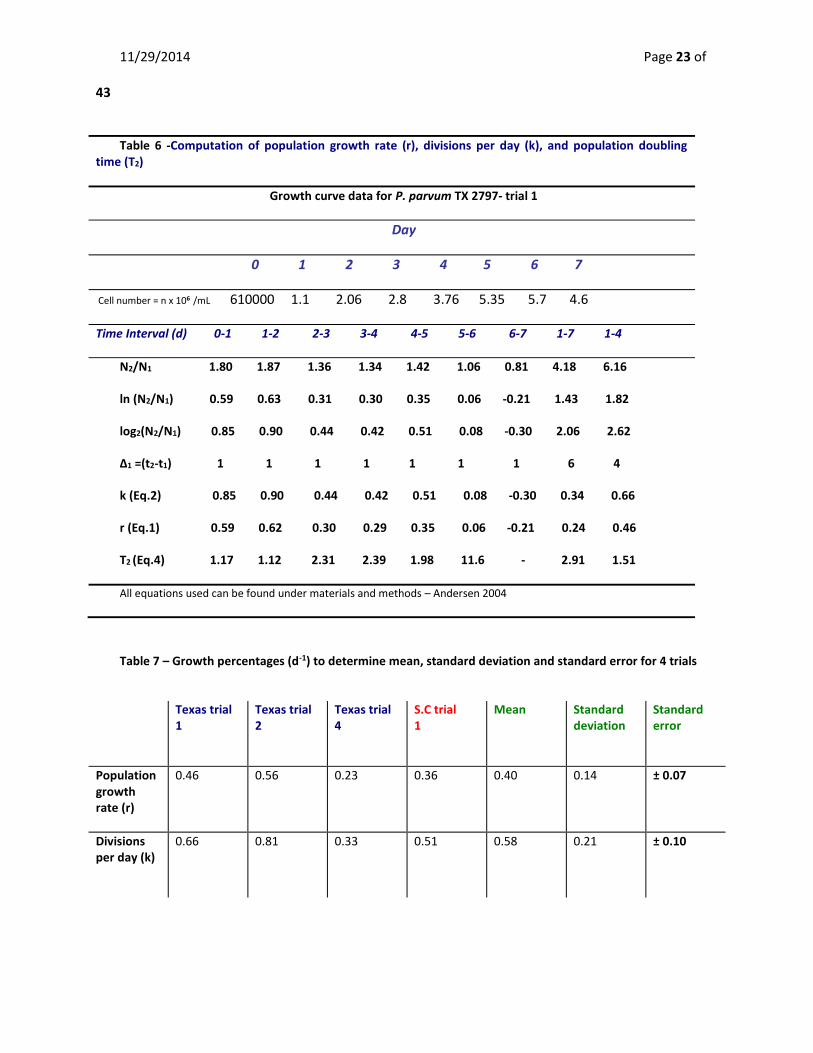
Table 6 -Computation of population growth rate (r), divisions per day (k), and population doubling time (T2)
Growth curve data for P. parvum TX 2797- trial 1
Day
0 1 2 3 4 5 6 7
Cell number = n x 106 /mL 610000 1.1 2.06 2.8 3.76 5.35 5.7 4.6
Time Interval (d) 0-1 1-2 2-3 3-4 4-5 5-6 6-7 1-7 1-4
N2/N1 1.80 1.87 1.36 1.34 1.42 1.06 0.81 4.18 6.16
ln (N2/N1) 0.59 0.63 0.31 0.30 0.35 0.06 -0.21 1.43 1.82
log2(N2/N1) 0.85 0.90 0.44 0.42 0.51 0.08 -0.30 2.06 2.62
Δ1 =(t2-t1) 1 1 1 1 1 1 1 6 4
k (Eq.2) 0.85 0.90 0.44 0.42 0.51 0.08 -0.30 0.34 0.66
r (Eq.1) 0.59 0.62 0.30 0.29 0.35 0.06 -0.21 0.24 0.46
T2 (Eq.4) 1.17 1.12 2.31 2.39 1.98 11.6 - 2.91 1.51
All equations used can be found under materials and methods – Andersen 2004
Table 7 – Growth percentages (d-1) to determine mean, standard deviation and standard error for 4 trials
Texas trial 1
Texas trial 2
Texas trial 4
S.C trial 1
Mean Standard deviation
Standard error
Population growth rate (r)
0.46 0.56 0.23 0.36 0.40 0.14 ± 0.07
Divisions per day (k)
0.66 0.81 0.33 0.51 0.58 0.21 ± 0.10
11/29/2014 Page 24 of
43
Population doubling times (T2)
1.51 1.24 3.01 1.93 1.92 0.78 ± 0.39
The divisions per day rate in these four trials were slightly higher when compared to research
conducted by Larsen and Bryant 1998 in which P. parvum (using various strains) was grown in
different combinations of salinity, light and temperature. The mean 0.58 ± 0.10 in this study
(Table 7) is in comparison to 0.39 ± 0.06 reported by Larsen and Bryant (1998). The range of
growth rates reported for P. parvum in previous studies ranged from 0.3-1.4 divisions per day
(Edvardsen and Larsen 2003). Since most of the samples were counted during or after the
stationary phase it would make sense why the numbers were slightly lower than average.
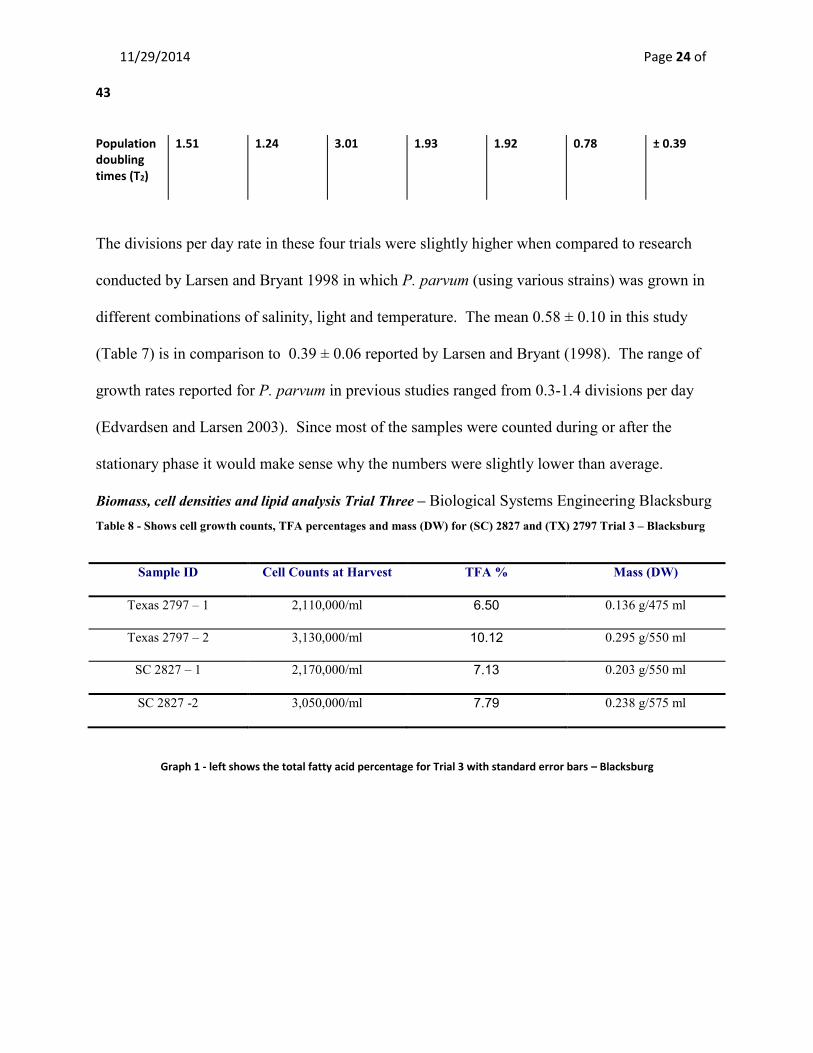
Biomass, cell densities and lipid analysis Trial Three – Biological Systems Engineering Blacksburg Table 8 - Shows cell growth counts, TFA percentages and mass (DW) for (SC) 2827 and (TX) 2797 Trial 3 – Blacksburg
Sample ID Cell Counts at Harvest TFA % Mass (DW)
Texas 2797 – 1 2,110,000/ml 6.50 0.136 g/475 ml
Texas 2797 – 2 3,130,000/ml 10.12 0.295 g/550 ml
SC 2827 – 1 2,170,000/ml 7.13 0.203 g/550 ml
SC 2827 -2 3,050,000/ml 7.79 0.238 g/575 ml
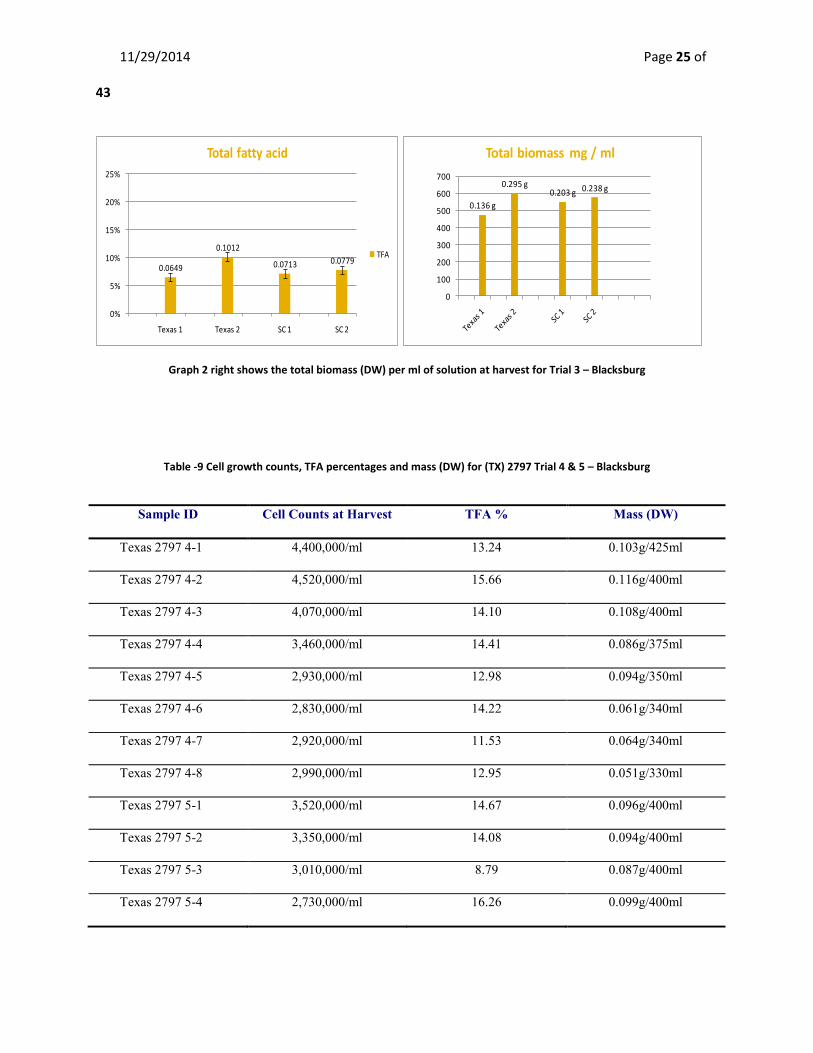
Graph 1 - left shows the total fatty acid percentage for Trial 3 with standard error bars – Blacksburg
11/29/2014 Page 25 of
43
0.0649
0.1012
0.0713 0.0779
0%
5%
10%
15%
20%
25%
Texas 1 Texas 2 SC 1 SC 2
Total fatty acid
TFA
0.136 g
0.295 g0.203 g 0.238 g
0
100
200
300
400
500
600
700
Total biomass mg / ml
Graph 2 right shows the total biomass (DW) per ml of solution at harvest for Trial 3 – Blacksburg
Table -9 Cell growth counts, TFA percentages and mass (DW) for (TX) 2797 Trial 4 & 5 – Blacksburg
Sample ID Cell Counts at Harvest TFA % Mass (DW)
Texas 2797 4-1 4,400,000/ml 13.24 0.103g/425ml
Texas 2797 4-2 4,520,000/ml 15.66 0.116g/400ml
Texas 2797 4-3 4,070,000/ml 14.10 0.108g/400ml
Texas 2797 4-4 3,460,000/ml 14.41 0.086g/375ml
Texas 2797 4-5 2,930,000/ml 12.98 0.094g/350ml
Texas 2797 4-6 2,830,000/ml 14.22 0.061g/340ml
Texas 2797 4-7 2,920,000/ml 11.53 0.064g/340ml
Texas 2797 4-8 2,990,000/ml 12.95 0.051g/330ml
Texas 2797 5-1 3,520,000/ml 14.67 0.096g/400ml
Texas 2797 5-2 3,350,000/ml 14.08 0.094g/400ml
Texas 2797 5-3 3,010,000/ml 8.79 0.087g/400ml
Texas 2797 5-4 2,730,000/ml 16.26 0.099g/400ml
11/29/2014 Page 26 of
43
Texas 2797 5-5 2,410,000/ml 12.94 0.056g/380ml
Texas 2797 5-6 2,300,000/ml 8.62 0.059g/375ml
Texas 2797 5-7 2,210,000/ml 8.07 0.051g/380ml
Texas 2797 5-8 1,980,000/ml 9.53 0.048g/350ml
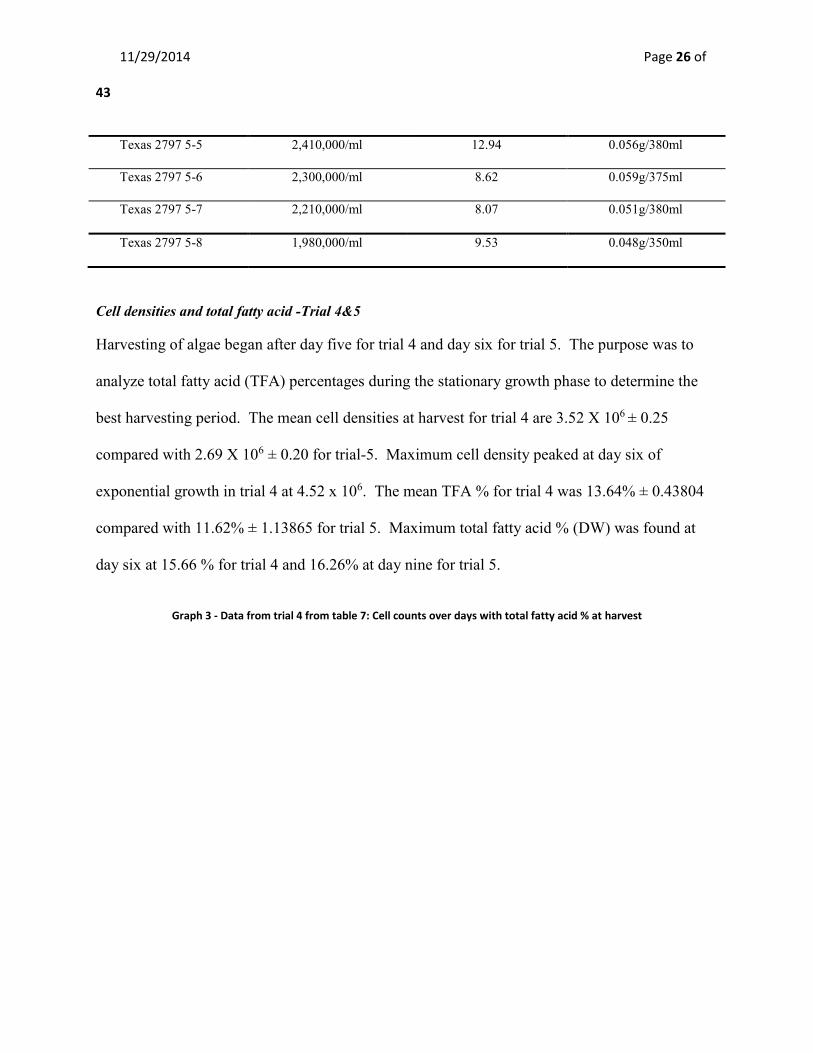
Cell densities and total fatty acid -Trial 4&5
Harvesting of algae began after day five for trial 4 and day six for trial 5. The purpose was to
analyze total fatty acid (TFA) percentages during the stationary growth phase to determine the
best harvesting period. The mean cell densities at harvest for trial 4 are 3.52 X 10⁶ ± 0.25
compared with 2.69 X 10⁶ ± 0.20 for trial-5. Maximum cell density peaked at day six of
exponential growth in trial 4 at 4.52 x 10⁶. The mean TFA % for trial 4 was 13.64% ± 0.43804
compared with 11.62% ± 1.13865 for trial 5. Maximum total fatty acid % (DW) was found at
day six at 15.66 % for trial 4 and 16.26% at day nine for trial 5.
Graph 3 - Data from trial 4 from table 7: Cell counts over days with total fatty acid % at harvest
11/29/2014 Page 27 of
43
13.2415.66
14.10
14.41
12.98 14.22 11.53 12.95
0.00
1.00
2.00
3.00
4.00
5.00
6.00
1 2 3 4 5 6 7 8 9 10 11 12
Cells
. m
L x
10^6
Days
Growth Rate and TFA %
TFA %
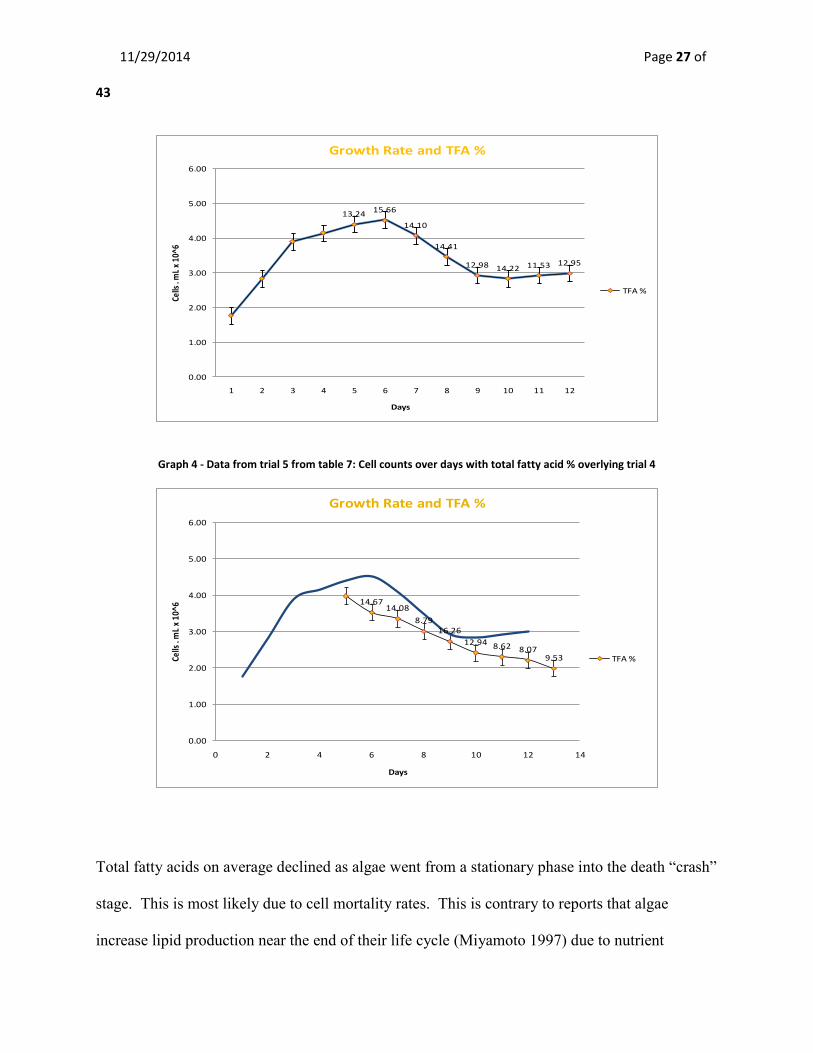
Graph 4 - Data from trial 5 from table 7: Cell counts over days with total fatty acid % overlying trial 4
14.6714.08
8.7916.26
12.94 8.62 8.079.53
0.00
1.00
2.00
3.00
4.00
5.00
6.00
0 2 4 6 8 10 12 14
Cells
. m
L x
10^6
Days
Growth Rate and TFA %
TFA %
Total fatty acids on average declined as algae went from a stationary phase into the death “crash”
stage. This is most likely due to cell mortality rates. This is contrary to reports that algae
increase lipid production near the end of their life cycle (Miyamoto 1997) due to nutrient
11/29/2014 Page 28 of
43
starvation. Nutrient levels may not be the limiting factor since nutrient levels for trial 5 were
equivalent to trial 4, therefore decline may be contributed to loss of cell density as a result of self
toxicity (Olli and Trunov 2007). Crashes and declines occurred in each trial in Hampton and
Blacksburg. The crashes came during the third runs of each trial set in January and March in all
strains suggesting that P. parvum may not be able to sustain itself under controlled lab
conditions. In the Hampton trials when the algae were transferred to the Carboys the production
rates declined as expected due to dilution factors and decreased light diffusion (Hoff and Snell
2007). In the small stock flasks numbers began to decline in both the SC and TX strains
showing signs of imminent collapse. No Biomass was harvested during the Hampton trials, so
no algae were analyzed for total fatty acids.
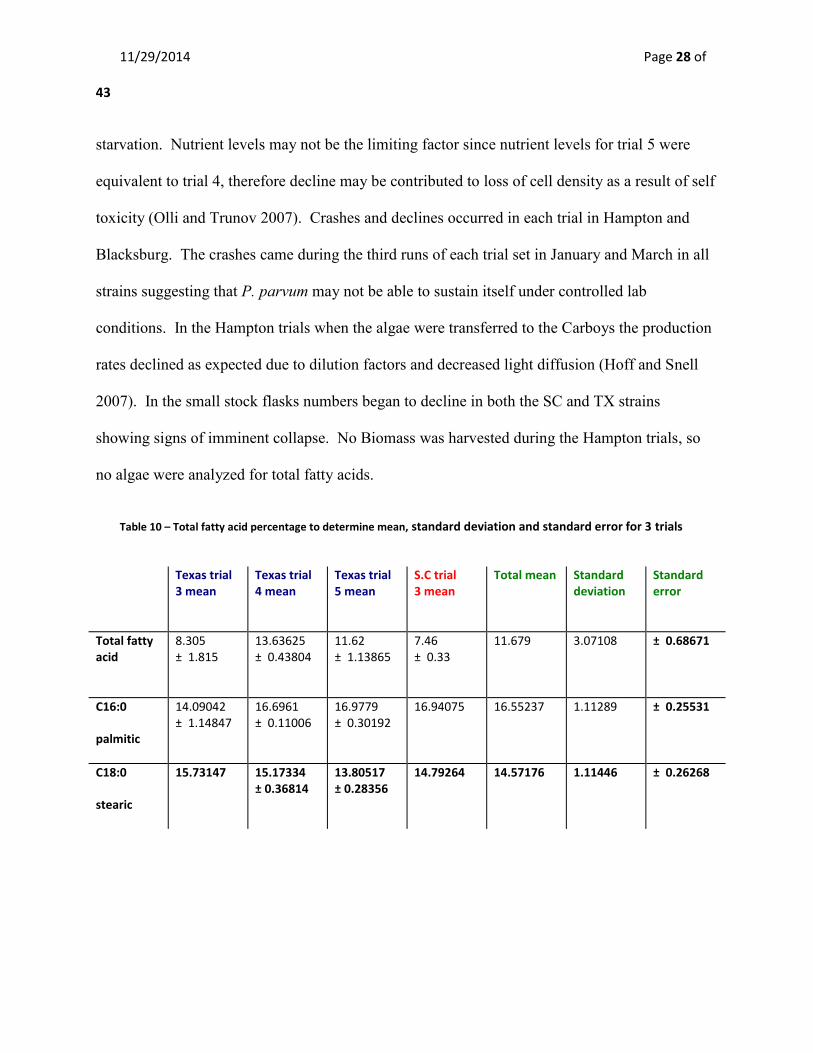
Table 10 – Total fatty acid percentage to determine mean, standard deviation and standard error for 3 trials
Texas trial 3 mean
Texas trial 4 mean
Texas trial 5 mean
S.C trial 3 mean
Total mean Standard deviation
Standard error
Total fatty acid
8.305 ± 1.815
13.63625 ± 0.43804
11.62 ± 1.13865
7.46 ± 0.33
11.679 3.07108 ± 0.68671
C16:0
palmitic
14.09042 ± 1.14847
16.6961 ± 0.11006
16.9779 ± 0.30192
16.94075 16.55237 1.11289 ± 0.25531
C18:0
stearic
15.73147 15.17334 ± 0.36814
13.80517 ± 0.28356
14.79264 14.57176 1.11446 ± 0.26268
11/29/2014 Page 29 of
43
In order to determine the exact fatty acid composition from microalgae using Gas
Chromatography, one must use a known set of prepared fatty acid standards. The above fatty
acids C16:0 (Palmitic acid) and C18:0 (Stearic acid) were previously identified by Chi et al. in
2007 using the same gas chromatography method with a set of fatty acid standards and
heptadecanoic acid internal standard C17:0. Retention times for C16:0 and C18:0 were recorded
and compared with chromatograms of P. parvum standards. Two known fatty acids for P.
parvum were then quantified (Table 10, Appendix). The two fatty acids C16:0 and C18:0 make
up 30% of the total fatty acids in P parvum.(Table 10, Appendix).
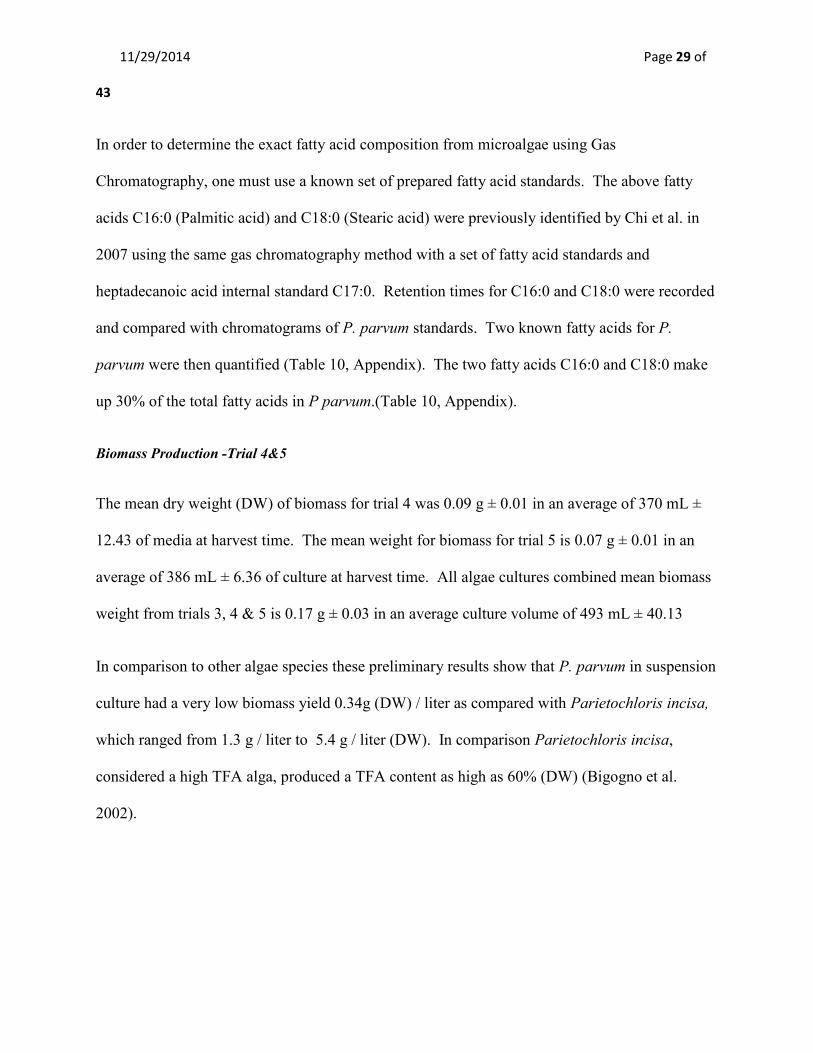
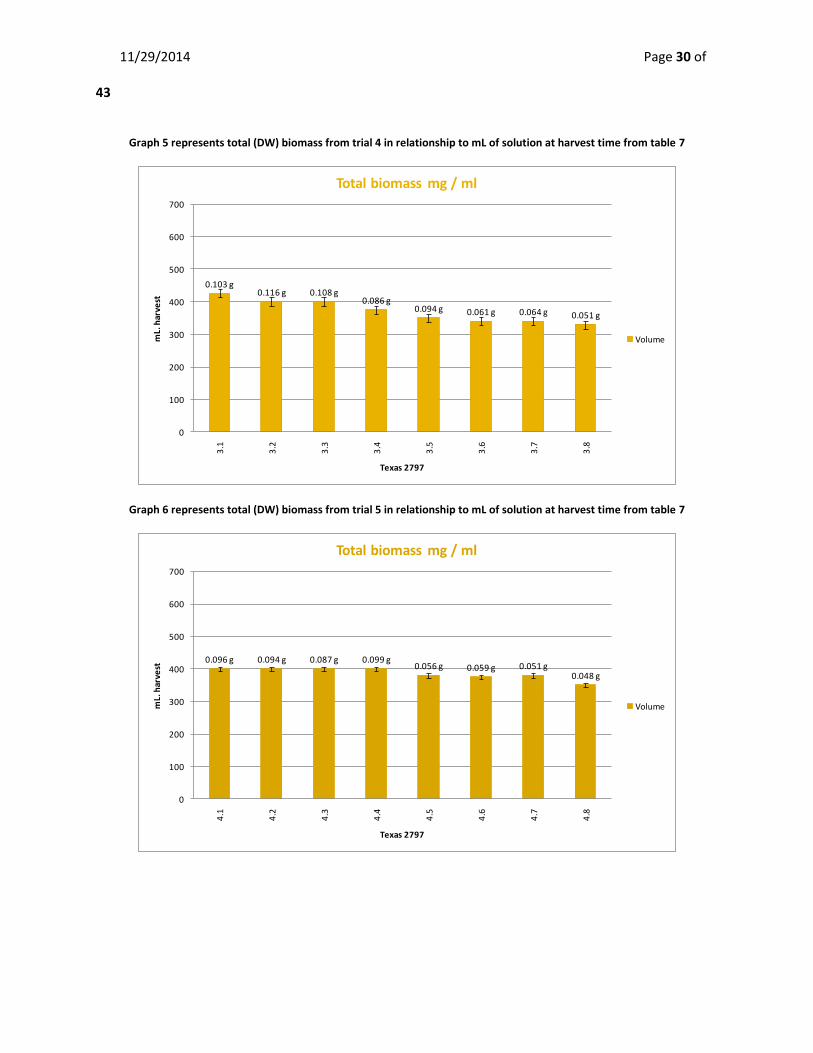
Biomass Production -Trial 4&5
The mean dry weight (DW) of biomass for trial 4 was 0.09 g ± 0.01 in an average of 370 mL ±
12.43 of media at harvest time. The mean weight for biomass for trial 5 is 0.07 g ± 0.01 in an
average of 386 mL ± 6.36 of culture at harvest time. All algae cultures combined mean biomass
weight from trials 3, 4 & 5 is 0.17 g ± 0.03 in an average culture volume of 493 mL ± 40.13
In comparison to other algae species these preliminary results show that P. parvum in suspension
culture had a very low biomass yield 0.34g (DW) / liter as compared with Parietochloris incisa,
which ranged from 1.3 g / liter to 5.4 g / liter (DW). In comparison Parietochloris incisa,
considered a high TFA alga, produced a TFA content as high as 60% (DW) (Bigogno et al.
2002).
11/29/2014 Page 30 of
43
Graph 5 represents total (DW) biomass from trial 4 in relationship to mL of solution at harvest time from table 7
0.103 g0.116 g 0.108 g
0.086 g0.094 g 0.061 g 0.064 g 0.051 g
0
100
200
300
400
500
600
700
3.1
3.2
3.3
3.4
3.5
3.6
3.7
3.8
mL.
har
vest
Texas 2797
Total biomass mg / ml
Volume
Graph 6 represents total (DW) biomass from trial 5 in relationship to mL of solution at harvest time from table 7
0.096 g 0.094 g 0.087 g 0.099 g0.056 g 0.059 g 0.051 g
0.048 g
0
100
200
300
400
500
600
700
4.1
4.2
4.3
4.4
4.5
4.6
4.7
4.8
mL.
har
vest
Texas 2797
Total biomass mg / ml
Volume
11/29/2014 Page 31 of
43
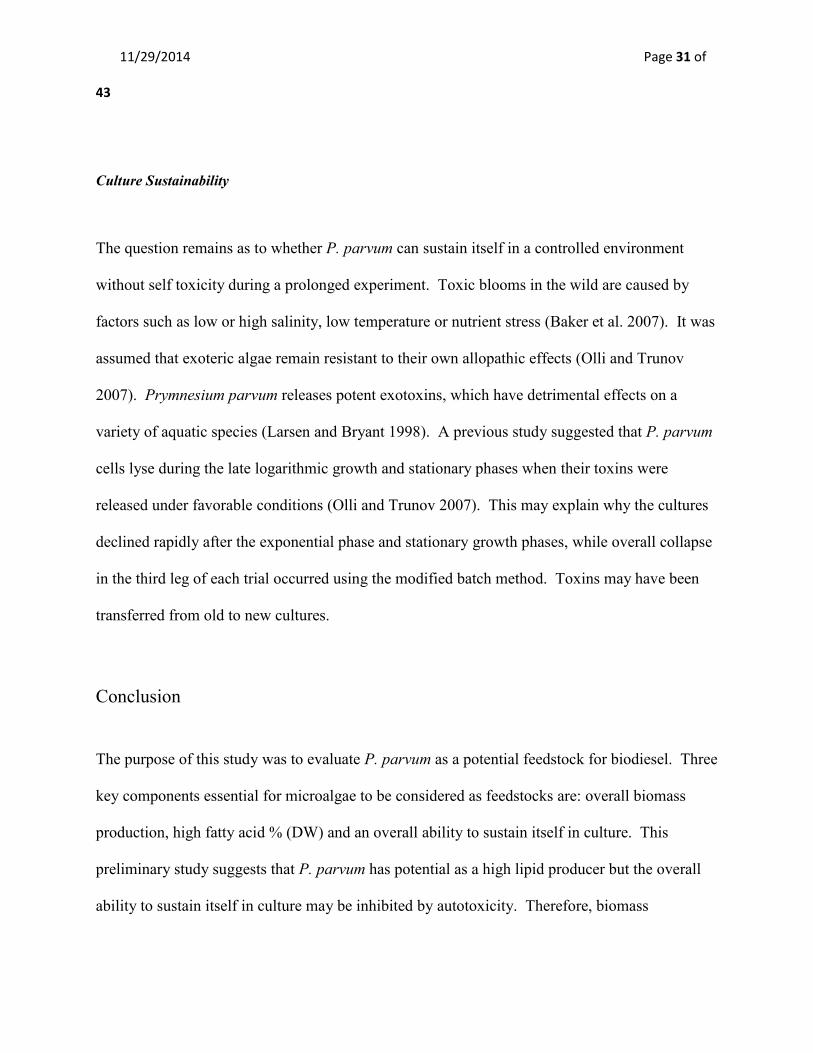
Culture Sustainability
The question remains as to whether P. parvum can sustain itself in a controlled environment
without self toxicity during a prolonged experiment. Toxic blooms in the wild are caused by
factors such as low or high salinity, low temperature or nutrient stress (Baker et al. 2007). It was
assumed that exoteric algae remain resistant to their own allopathic effects (Olli and Trunov
2007). Prymnesium parvum releases potent exotoxins, which have detrimental effects on a
variety of aquatic species (Larsen and Bryant 1998). A previous study suggested that P. parvum
cells lyse during the late logarithmic growth and stationary phases when their toxins were
released under favorable conditions (Olli and Trunov 2007). This may explain why the cultures
declined rapidly after the exponential phase and stationary growth phases, while overall collapse
in the third leg of each trial occurred using the modified batch method. Toxins may have been
transferred from old to new cultures.
Conclusion The purpose of this study was to evaluate P. parvum as a potential feedstock for biodiesel. Three
key components essential for microalgae to be considered as feedstocks are: overall biomass
production, high fatty acid % (DW) and an overall ability to sustain itself in culture. This
preliminary study suggests that P. parvum has potential as a high lipid producer but the overall
ability to sustain itself in culture may be inhibited by autotoxicity. Therefore, biomass
11/29/2014 Page 32 of
43
production was limited by frequent crashes, although additional research is needed to confirm
this hypothesis.
Future studies may include nutrient stability trials and stable monitoring using a Continuous-
Culture Bioreactor System instead of the Modified Batch Method. Using a continuous culture
system may inhibit toxicity if all growth parameters are controlled and harvesting is done before
toxic buildup occurs . Increased levels of CO2 may facilitate sustainability if pH is adequately
monitored; this may or may not increase biomass production. Studies using DNA transformation
technologies could reduce toxins and increase lipid production capabilities, making P parvum a
candidate alga for biodiesel feedstock production.
11/29/2014 Page 33 of
43
Acknowledgements Financial support for this research project was provided through the Virginia Tobacco
Commission for the purpose of the Bio-Based Energy and Products Research and Development
Center Project.
The research was conducted at the Virginia Seafood AREC in Hampton, Virginia (Summer
2008) and at the Biological Systems Engineering Department on the main campus of Virginia
Tech Blacksburg, Virginia (Fall 2008 – Spring 2009).
Thank you to Zhiyou Wen and Michael B. Johnson for their financial support and contribution at
the Biological Systems Engineering Department Laboratory. Thank you to Brendan Delbos,
Michael Jahncke and Michael Schwarz for their financial support and contribution at the
Virginia Seafood AREC in Hampton, Virginia.
Thanks to Greg Welbaum, Zhiyou Wen, Jerzy Nowak and Doug Pfeiffer for their mentoring.
11/29/2014 Page 34 of
43
Appendix
Table 2 - Algae Fatty Acid Methyl Ester preparation for Gas Chromatography Sample Preparation:
1. Weigh out approximately 20 mg of freeze-dried algal cells into glass test tube 2. Add 4 mL mixture of methanol, concentrated sulfuric acid, and chloroform (1.7:0.3:2.0
v/v/v) into each tube. This mixture should also contain 1 mg/sample of the internal standard C17:0 heptadecanoic acid. This translates into 1 mg per 4 mL of solution.
3. Tighten the lids very tightly onto the tubes (use plumbers tape). Place tubes in a 90C water bath for 40 minutes.
4. Remove the tubes from the water bath and let cool. 15 min. 5. Add 1 mL distilled water to each tube and vortex for 30 seconds. 6. After this, two phases should form. The bottom phase contains the fatty acid methyl
esters. 7. Pipette the bottom phase into microcentrifuge tubes, add anhydrous Na2SO4 to the tubes. 8. Centrifuge the tubes at 10,000 RPM for 8 minutes. 9. Pipette the liquid from the tubes into glass GC vials for GC analysis.
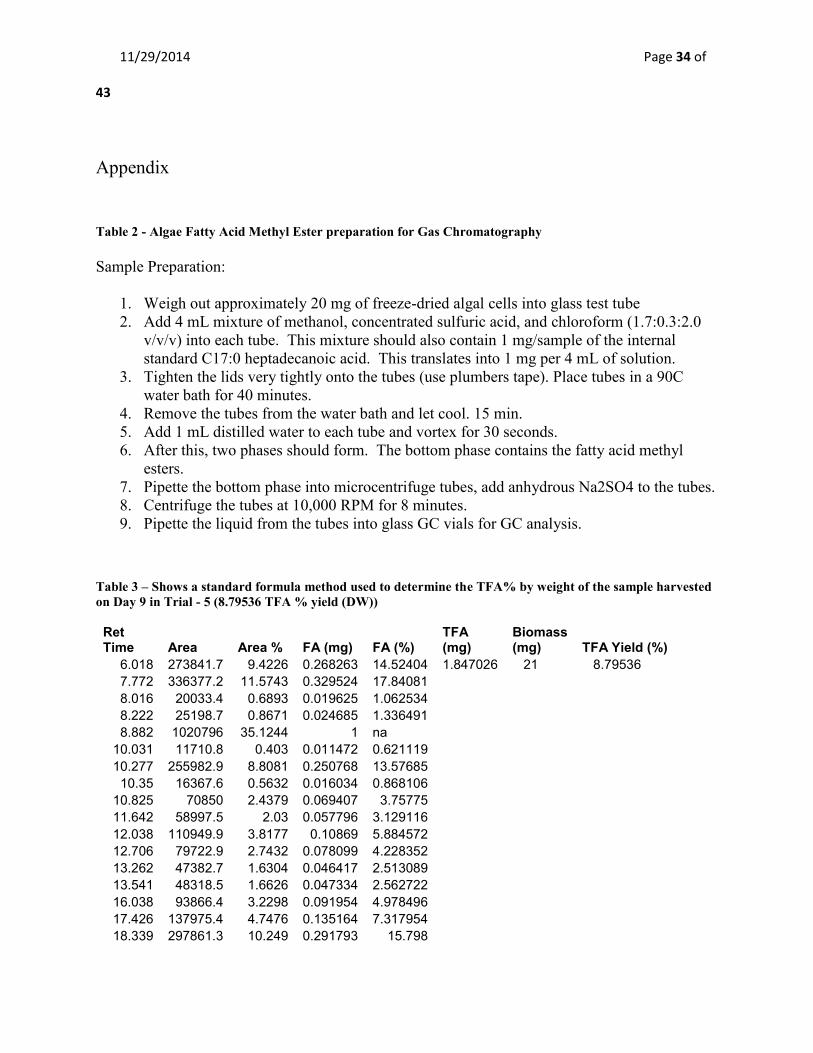
Table 3 – Shows a standard formula method used to determine the TFA% by weight of the sample harvested on Day 9 in Trial - 5 (8.79536 TFA % yield (DW)) Ret Time Area Area % FA (mg) FA (%)
TFA (mg)
Biomass (mg) TFA Yield (%)
6.018 273841.7 9.4226 0.268263 14.52404 1.847026 21 8.79536 7.772 336377.2 11.5743 0.329524 17.84081 8.016 20033.4 0.6893 0.019625 1.062534 8.222 25198.7 0.8671 0.024685 1.336491 8.882 1020796 35.1244 1 na
10.031 11710.8 0.403 0.011472 0.621119 10.277 255982.9 8.8081 0.250768 13.57685 10.35 16367.6 0.5632 0.016034 0.868106
10.825 70850 2.4379 0.069407 3.75775 11.642 58997.5 2.03 0.057796 3.129116 12.038 110949.9 3.8177 0.10869 5.884572 12.706 79722.9 2.7432 0.078099 4.228352 13.262 47382.7 1.6304 0.046417 2.513089 13.541 48318.5 1.6626 0.047334 2.562722 16.038 93866.4 3.2298 0.091954 4.978496 17.426 137975.4 4.7476 0.135164 7.317954 18.339 297861.3 10.249 0.291793 15.798
11/29/2014 Page 35 of
43
100
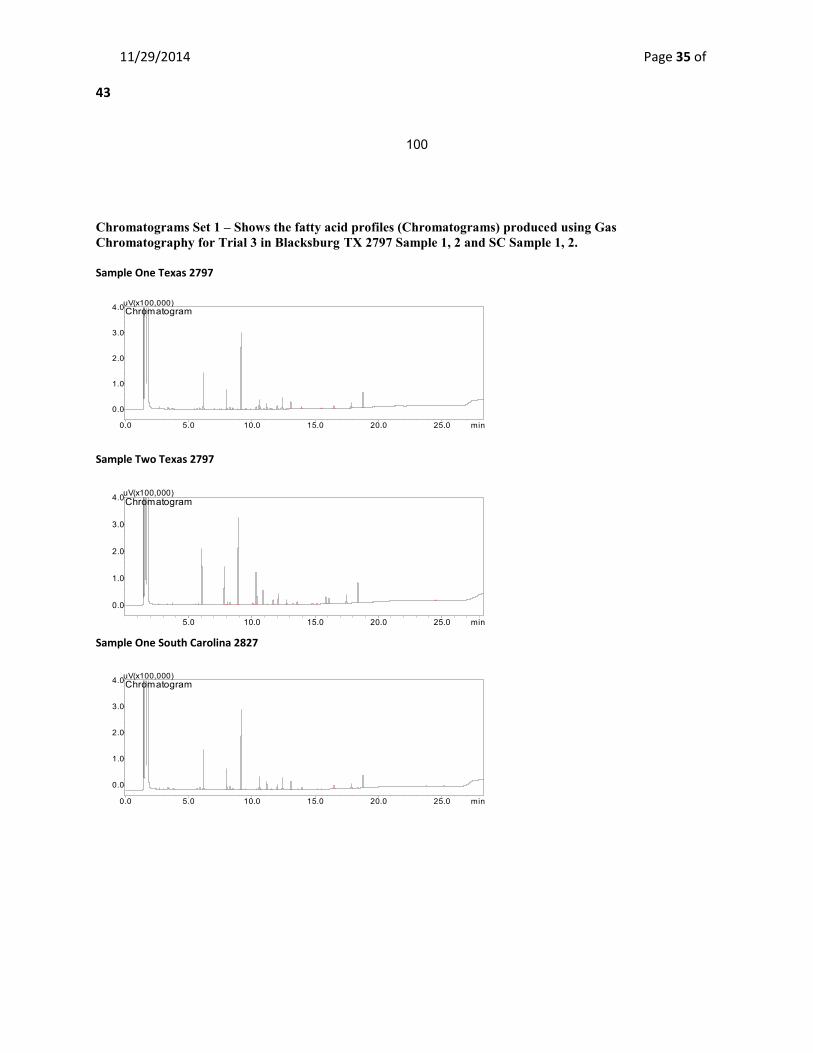
Chromatograms Set 1 – Shows the fatty acid profiles (Chromatograms) produced using Gas Chromatography for Trial 3 in Blacksburg TX 2797 Sample 1, 2 and SC Sample 1, 2. Sample One Texas 2797
0.0 5.0 10.0 15.0 20.0 25.0 min
0.0
1.0
2.0
3.0
4.0uV(x100,000)Chromatogram
Sample Two Texas 2797
5.0 10.0 15.0 20.0 25.0 min
0.0
1.0
2.0
3.0
4.0uV(x100,000)Chromatogram
Sample One South Carolina 2827
0.0 5.0 10.0 15.0 20.0 25.0 min
0.0
1.0
2.0
3.0
4.0uV(x100,000)Chromatogram
11/29/2014 Page 36 of
43
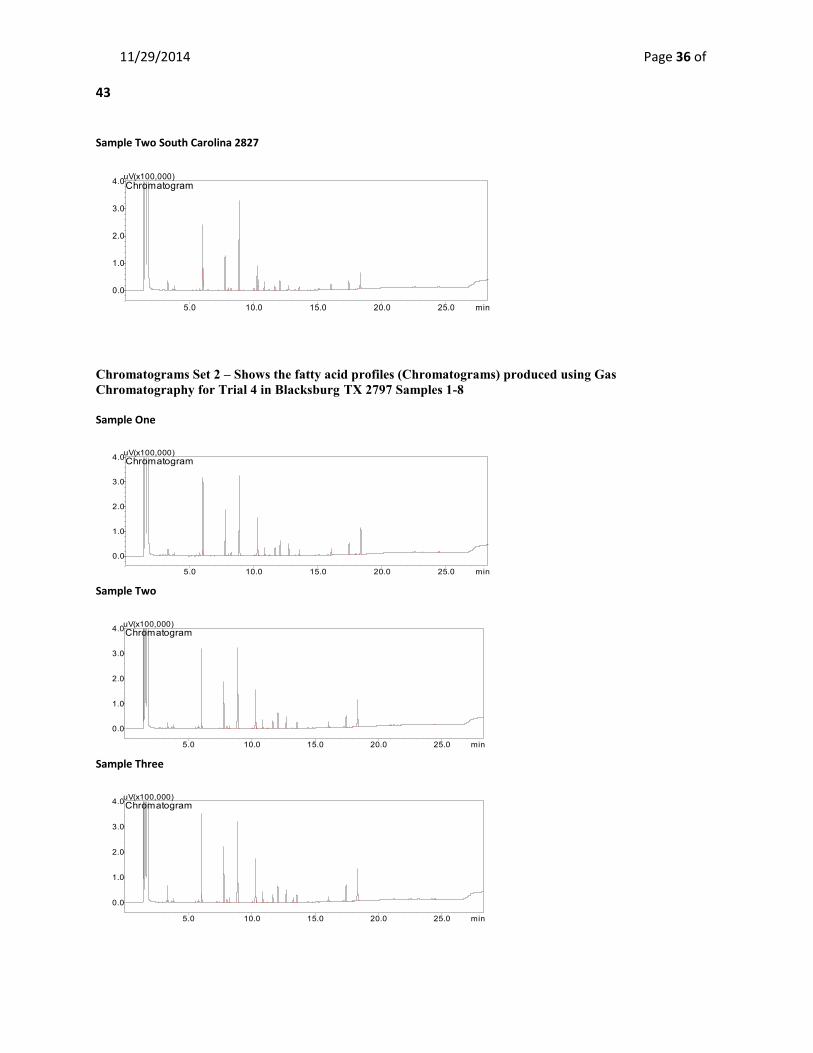
Sample Two South Carolina 2827
5.0 10.0 15.0 20.0 25.0 min
0.0
1.0
2.0
3.0
4.0uV(x100,000)Chromatogram
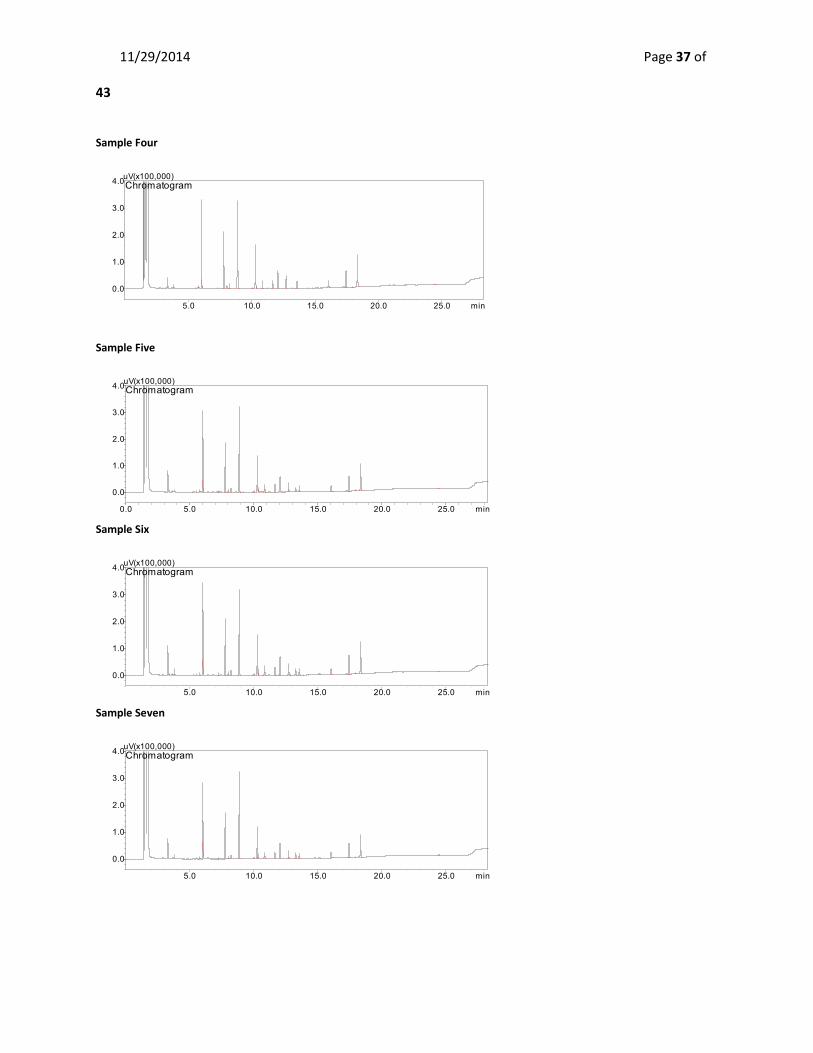
Chromatograms Set 2 – Shows the fatty acid profiles (Chromatograms) produced using Gas Chromatography for Trial 4 in Blacksburg TX 2797 Samples 1-8 Sample One
5.0 10.0 15.0 20.0 25.0 min
0.0
1.0
2.0
3.0
4.0uV(x100,000)Chromatogram
Sample Two
5.0 10.0 15.0 20.0 25.0 min
0.0
1.0
2.0
3.0
4.0uV(x100,000)Chromatogram
Sample Three
5.0 10.0 15.0 20.0 25.0 min
0.0
1.0
2.0
3.0
4.0uV(x100,000)Chromatogram
11/29/2014 Page 37 of
43
Sample Four
5.0 10.0 15.0 20.0 25.0 min
0.0
1.0
2.0
3.0
4.0uV(x100,000)Chromatogram
Sample Five
0.0 5.0 10.0 15.0 20.0 25.0 min
0.0
1.0
2.0
3.0
4.0uV(x100,000)Chromatogram
Sample Six
5.0 10.0 15.0 20.0 25.0 min
0.0
1.0
2.0
3.0
4.0uV(x100,000)Chromatogram
Sample Seven
5.0 10.0 15.0 20.0 25.0 min
0.0
1.0
2.0
3.0
4.0uV(x100,000)Chromatogram
11/29/2014 Page 38 of
43
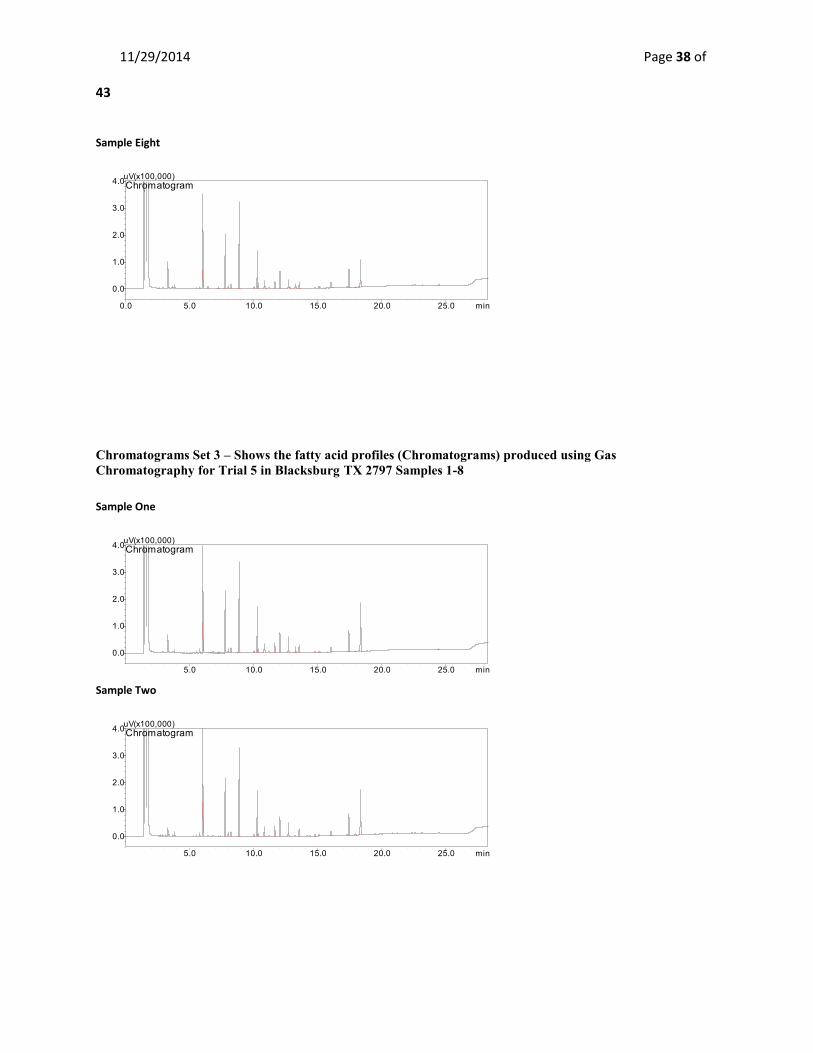
Sample Eight
0.0 5.0 10.0 15.0 20.0 25.0 min
0.0
1.0
2.0
3.0
4.0uV(x100,000)Chromatogram
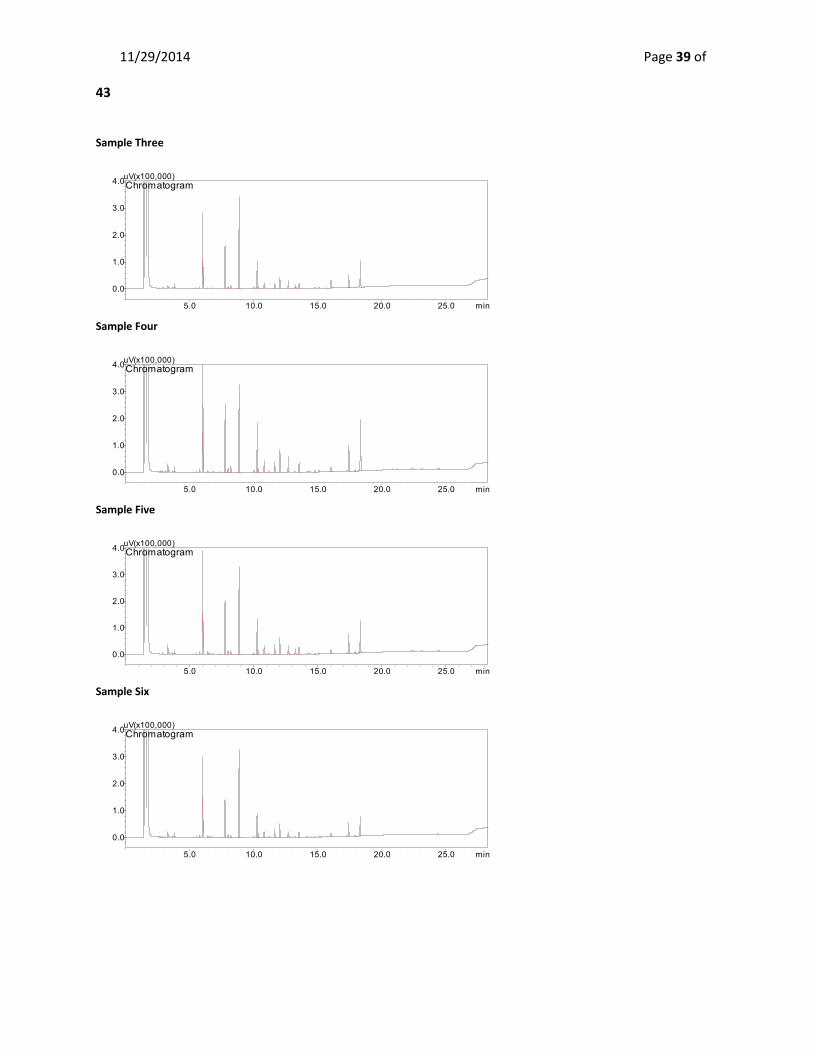
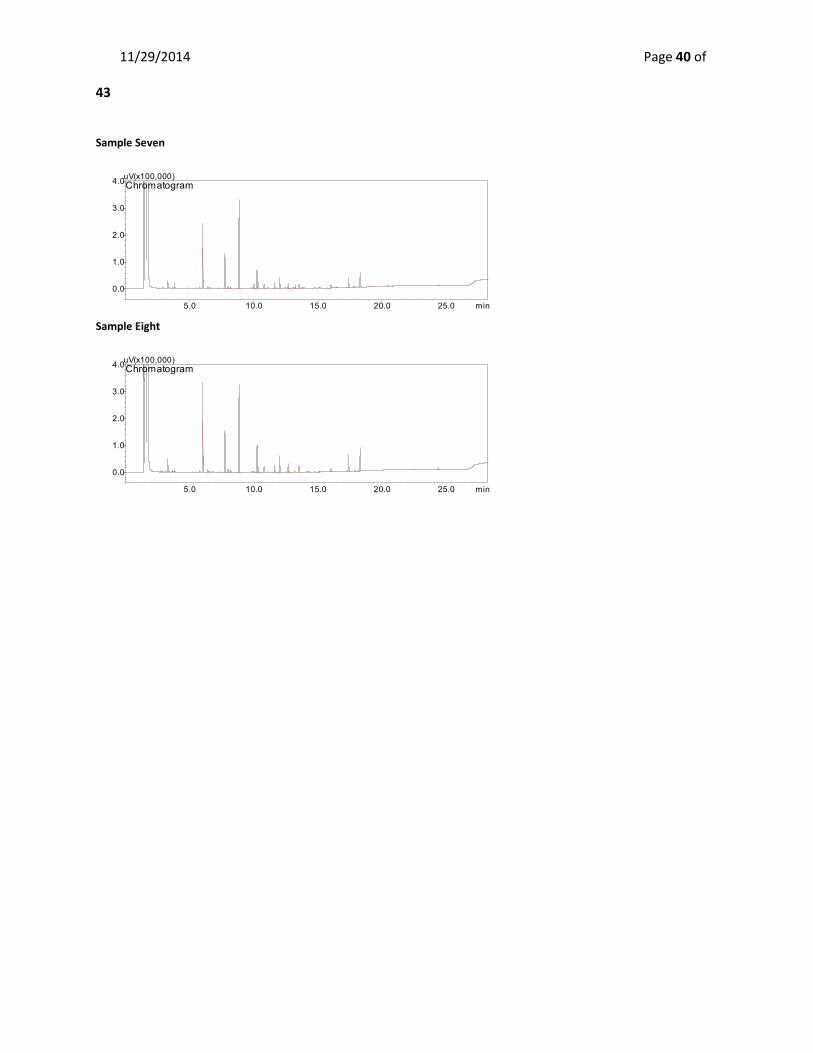
Chromatograms Set 3 – Shows the fatty acid profiles (Chromatograms) produced using Gas Chromatography for Trial 5 in Blacksburg TX 2797 Samples 1-8 Sample One
5.0 10.0 15.0 20.0 25.0 min
0.0
1.0
2.0
3.0
4.0uV(x100,000)Chromatogram
Sample Two
5.0 10.0 15.0 20.0 25.0 min
0.0
1.0
2.0
3.0
4.0uV(x100,000)Chromatogram
11/29/2014 Page 39 of
43
Sample Three
5.0 10.0 15.0 20.0 25.0 min
0.0
1.0
2.0
3.0
4.0uV(x100,000)Chromatogram
Sample Four
5.0 10.0 15.0 20.0 25.0 min
0.0
1.0
2.0
3.0
4.0uV(x100,000)Chromatogram
Sample Five
5.0 10.0 15.0 20.0 25.0 min
0.0
1.0
2.0
3.0
4.0uV(x100,000)Chromatogram
Sample Six
5.0 10.0 15.0 20.0 25.0 min
0.0
1.0
2.0
3.0
4.0uV(x100,000)Chromatogram
11/29/2014 Page 40 of
43
Sample Seven
5.0 10.0 15.0 20.0 25.0 min
0.0
1.0
2.0
3.0
4.0uV(x100,000)Chromatogram
Sample Eight
5.0 10.0 15.0 20.0 25.0 min
0.0
1.0
2.0
3.0
4.0uV(x100,000)Chromatogram
11/29/2014 Page 41 of
43
References
Andersen R. A. 2004. Algae Culturing Techniques. Measuring Growth rates in microalgae cultures. 271-275
Baker J., Grover J., Brooks B., Urena-Broeck F., Roelke D., and R. Errera. 2007. Growth and toxicity of Prymnesium parvum (Haptophyta) as a function of salinity, light and temperature. Journal of Phycology 43(2): 219-227
Balkau F., Fava J., Toepfer K. 2004. Why take a life cycle approach? United Nations
Environmental Program. 1- 23
Becker E. W. 1994. Microalgae: biotechnology and microbiology. Published by Cambridge University Press, New York. 40 edition, 178
Bigogno C., B., Khozin-Goldberg I., Boussiba S., Vonshak A., and Zvi Cohen. (2002). Lipid and
fatty acid composition of the green oleaginous alga Parietochloris incisa, the richest plant source of arachidonic acid. Pytochemistry 60: 479-503
Chi Z., Pyle D., Wen Z., Frear C., and C. Shulin. 2007. A laboratory study of producing
docosahexaenoic acid from biodiesel-waste glycerol by microalgal fermentation. Process Biochemistry 42 1537-1545
Chisti Yusuf. 2007. Biodiesel from microalgae. Biotechnology Advanced. 25, 294-306 Chisti Yusuf. 2008. Biodiesel from microalgae beats bioethanol. Trend in Biotechnology. Vol.
26: No. 3, 126- 131 Demetropoulos C. L. and C. J. Langdon, 2004. Enhanced production of Pacific dulse (Palmaria
mollis) for co-culture with abalone in a land-based system: nitrogen, phosphorus, and trace metal nutrition. Aquaculture 235 433–455
Edvardsen B. and A. Larsen. 2003. Phylogeny, life history, autecology and toxicity of Prymnesium parvum. Golden Alga (Prymnesium parvum) Workshop. October 24-25 Fort Worth, TX. Summary Report. 2004. Singhurst, L and D Sager, eds. PowerPoint
Fawley M. (1989) Detection of chlorophylls C1, C2, and C3 in pigment extracts of Prymnesium
parvum (Prymnesiophyceae). Journal of Phycology 25, 601-604 (1989 Halver J.E. 1978. Lipids and Fatty Acids: Aquaculture development and coordination program.
FAO/UNDP Training Course in Fish Feed Technology. December 1978. Chapter 4, 1-2
11/29/2014 Page 42 of
43
Hoff F. and T. Snell (2007). Plankton Culture Manual. Sixth Edition, 2nd Printing. Florida Aqua Farms, Inc. Chapter 4. 27- 63
Igarashi T., Satake M., and Yasumoto, T. 1996. Prymnesin-2: a potent ichthyotoxic and
hemolytic glycoside isolated from the red tide alga Prymnesium parvum. Journal of the American Chemical Society 118:479-80
Indarti E, Majid MIA, Hashim R, Chong A. 2005. Direct FAME synthesis for rapid total lipid analysis from fish oil and cod liver oil. Journal of Food Composition Analysis 18: 161-70
Jason H., Nelson E., Tilman D., Polasky S., Tiffany D. 2006. Environmental, economic, and energetic costs and benefits of biodiesel and ethanol biofuels. PNAS. Vol. 103: No 30. 11206-11210
Johansson N. and E. Graneli 1999. "Influence of different nutrient conditions on cell density, chemical composition and toxicity of Prymnesium parvum (Haptophyta) in semi-continuous cultures." Journal of Experimental Marine Biology and Ecology 239: 243-258
Larsen A., Eikrem W., Paashe E. 1993. Growth and toxicity in Prymnesium patelliferum
(Haptophyta) isolated from Norwegian waters. Canadian Journal of Botany 71: 1357-1362
Larsen A. and S. Bryant 1998. Growth rate and toxicity of Prymnesium parvum and Prymnesium
patelliferum (Haptophyta) in response to changes in salinity, light and temperature." Sarsia 83: 409-418
Li Q., Du W., Liu D. 2008. Perspectives of microbial oils for biodiesel production. Applied
Microbiology Biotechnology. 80:749–756
Miao X. and Q. Wu. 2006. Biodiesel production from heterotrophic microalgal oil. Bioresource Technology. 97 841-846
Miyamoto Kazuhisa. 1997. Renewable biological systems for alternative sustainable energy
production. Food and Agricultural Organization of the United Nations. Bulletin 128. Osaka, Japan, Chapter 6.2 Microalgae as biological sources of lipids and hydrocarbons. 82 - 83
Olli K and K. Trunov. (2007). Self-toxicity of Prymnesium parvum (Prymnesiophyceae).
Phycologia Volume 46 (1), 109–112 Sheehan J., Dunahay T., Benemann J., Roessler P. 1998. "A Look Back at the U.S. Department
of Energy’s Aquatic Species Program—Biodiesel from Algae." II.B. Microalgal Strain Improvement - 69.

11/29/2014 Page 43 of
43
Uronen P., Kuuppo P., Legrand C., Tamminen T. 2007. Allelopathic effects of toxic Haptophyte
Prymnesium parvum lead to release of dissolved organic carbon and increase in bacterial biomass." Microbial Ecology 54: 183-193


![Dr. Eng. Hassan El Shimi · [3] El Shimi, Hassan Ibrahim. (2018). "Potential Feedstocks for Biodiesel and Oleochemicals Production: A Case Study of Thailand". Renewable & Sustainable](https://img.pdfslide.us/doc/110x75/5e1a14501a58e145ff19493a/dr-eng-hassan-el-shimi-3-el-shimi-hassan-ibrahim-2018-potential-feedstocks.jpg)
![Impact of the U.S. [Insert Title] [Year] Biodiesel ......biodiesel feedstocks) below which increasingly incremental demand for biodiesel would push soybean oil prices up to at least](https://img.pdfslide.us/doc/110x75/5feaf35b1f939f4e6e5ae642/impact-of-the-us-insert-title-year-biodiesel-biodiesel-feedstocks.jpg)