Embed Size (px)
Citation preview
3,350+OPEN ACCESS BOOKS
108,000+INTERNATIONAL
AUTHORS AND EDITORS114+ MILLION
DOWNLOADS
BOOKSDELIVERED TO
151 COUNTRIES
AUTHORS AMONG
TOP 1%MOST CITED SCIENTIST
12.2%AUTHORS AND EDITORS
FROM TOP 500 UNIVERSITIES
Selection of our books indexed in theBook Citation Index in Web of Science™
Core Collection (BKCI)
Chapter from the book Biodiesel - Feedstocks and Process ing TechnologiesDownloaded from: http://www.intechopen.com/books/biodiesel-feedstocks-and-process ing-technologies
PUBLISHED BY
World's largest Science,Technology & Medicine
Open Access book publisher
Interested in publishing with IntechOpen?Contact us at [email protected]
15
Gas-Liquid Process, Thermodynamic Characteristics (19 Blends), Efficiency &
Environmental Impacts, SEM Particulate Matter Analysis and On-Road Bus Trial of a
Proven NOx Less Biodiesel
Kandukalpatti Chinnaraj Velappan and Nagarajan Vedaraman Chemical Engineering Department, Central Leather Research Institute,
Council of Scientific and Industrial Research, Adyar, Chennai
India
1. Introduction
Biodiesel has gained worldwide attention as renewable and blending agent with some lower
gas emissions, besides a slight increase of NOx emission (Michael & Robert ,1998)in the
exhaust gas compared to the petroleum diesel. Vegetable oils (Srivastava & Prasad,2000;
Prasad & Mohan,2003) namley soybean, sunflower, cottonseed and rapeseed have been
examined for fuel without/ with a small modification in the engine. A number of problems,
mainly high viscosity, are associated with vegetable oils when directly used as fuel in the CI
engines (Agarwal , 1998; Sinha & Misra , 1997; Roger & Jaiduk 1985). It is difficult to reduce
particulate matter (PM) and oxides of nitrogen (NOx) ( Mohamad and et al., 2002)
simultaneously owing the trade-off between NOx and PM. Moreover, methyl esters of
vegetable oils are sulphur free and possess good lubricating properties ( De-Gang et al.,
2005). Depending upon the climate and the soil conditions, different countries looking for
different type of vegetable oil ( Goering et al., 1982; Fernando et al., 2003; Antolin et al., 2002;
Freedam et al., 1986; Noureddini & Zhu, 1997; Mohamad et al., 2002; Yi-Hsu & Shaik, 2005;
Sukumar et al., 2005) used for the biodiesel production; soybean oil in US, rapeseed oil in
Europe, palm oil in Malaysia and Indonesia, and coconut oil in the Philippine are being
considered (Barnwal & Sharma , 2005).
In India, out of more than 125 million tons (Arumugam et al., 2003) of rice production,
about 6 million tons of rice bran and 1 million ton of RBOBD is produced annually (Table 1).
General characteristics of refined rice bran oil are as follows: sp gr, 0.916 kg/m3; ref index
1.47; Cloud index, 17; iodine value, 99-108; saponification value, 180-190; unsopanifiable
matter, 3.5(%); smoke point, 213 C; and fire point, 352 C. General properties of vegetable
oil based biodiesel (Table 2) show many variations that might be due to the conversion to
biodiesel through different raw materials and different processes.
www.intechopen.com
Biodiesel – Feedstocks and Processing Technologies
318
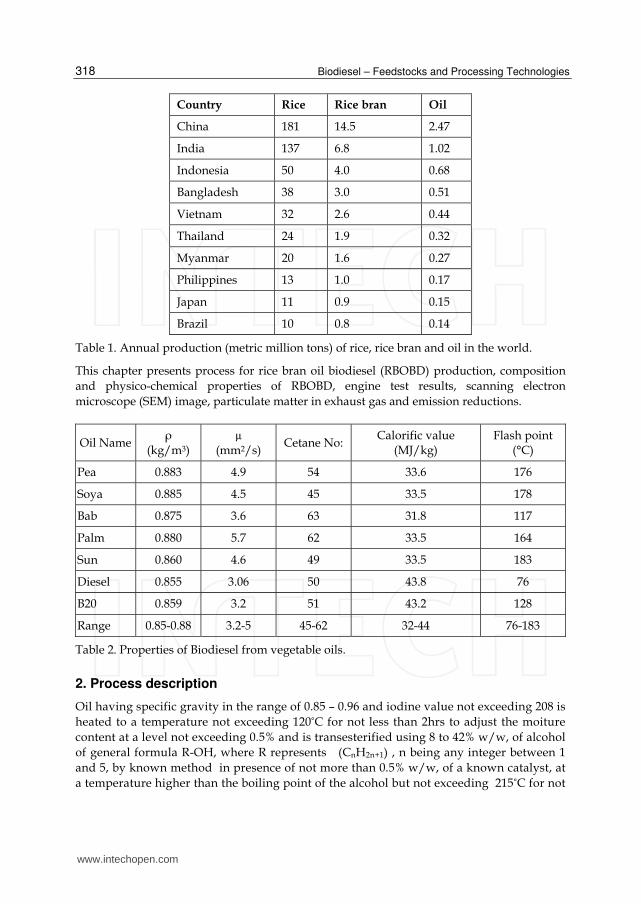
Country Rice Rice bran Oil
China 181 14.5 2.47
India 137 6.8 1.02
Indonesia 50 4.0 0.68
Bangladesh 38 3.0 0.51
Vietnam 32 2.6 0.44
Thailand 24 1.9 0.32
Myanmar 20 1.6 0.27
Philippines 13 1.0 0.17
Japan 11 0.9 0.15
Brazil 10 0.8 0.14
Table 1. Annual production (metric million tons) of rice, rice bran and oil in the world.
This chapter presents process for rice bran oil biodiesel (RBOBD) production, composition
and physico-chemical properties of RBOBD, engine test results, scanning electron
microscope (SEM) image, particulate matter in exhaust gas and emission reductions.
Oil Name ρ
(kg/m3) µ
(mm2/s) Cetane No:
Calorific value (MJ/kg)
Flash point (°C)
Pea 0.883 4.9 54 33.6 176
Soya 0.885 4.5 45 33.5 178
Bab 0.875 3.6 63 31.8 117
Palm 0.880 5.7 62 33.5 164
Sun 0.860 4.6 49 33.5 183
Diesel 0.855 3.06 50 43.8 76
B20 0.859 3.2 51 43.2 128
Range 0.85-0.88 3.2-5 45-62 32-44 76-183
Table 2. Properties of Biodiesel from vegetable oils.
2. Process description
Oil having specific gravity in the range of 0.85 – 0.96 and iodine value not exceeding 208 is
heated to a temperature not exceeding 120°C for not less than 2hrs to adjust the moiture
content at a level not exceeding 0.5% and is transesterified using 8 to 42% w/w, of alcohol
of general formula R-OH, where R represents (CnH2n+1) , n being any integer between 1
and 5, by known method in presence of not more than 0.5% w/w, of a known catalyst, at
a temperature higher than the boiling point of the alcohol but not exceeding 215°C for not
www.intechopen.com
Gas-Liquid Process, Thermodynamic Characteristics (19 Blends), Efficiency & Environmental Impacts, SEM Particulate Matter Analysis…
319
less than 30 minutes under continuous turbulent condition at rpm in the range of 100-150
to get a mixture of ester and glycerol. The Reynolds number (NRe) is maintained at not
less than 4000 irrespective of the type of the reactor. The mixture of ester and glycerol is
subjected to separation by known method for a period of not less than 4 hrs and the top
layer ester is purified by conventional method for a period of not less than 8hrs. The
process of separation as well as purification is repeated for not less than three times in
succession to get biodiesel.
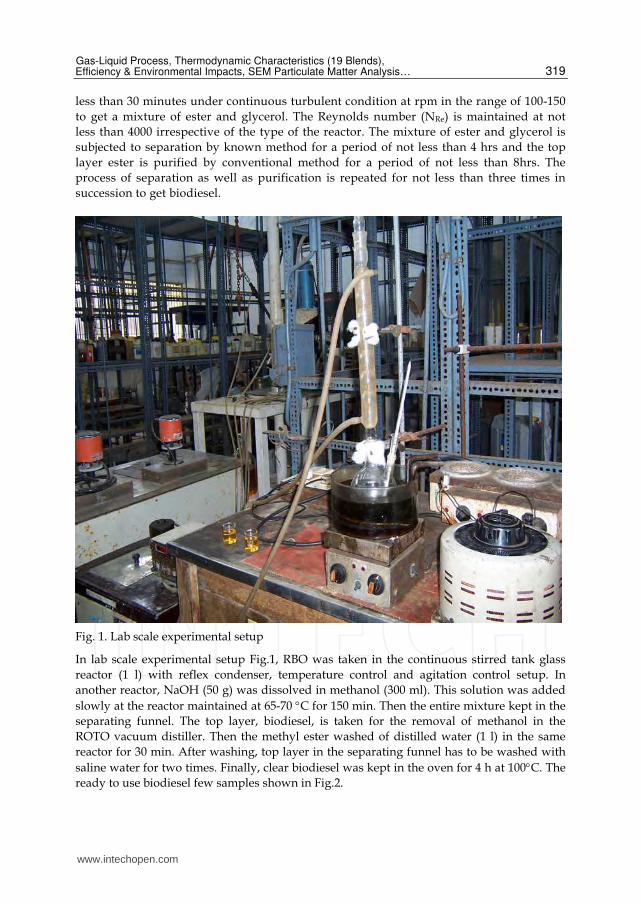
Fig. 1. Lab scale experimental setup
In lab scale experimental setup Fig.1, RBO was taken in the continuous stirred tank glass
reactor (1 l) with reflex condenser, temperature control and agitation control setup. In
another reactor, NaOH (50 g) was dissolved in methanol (300 ml). This solution was added
slowly at the reactor maintained at 65-70 C for 150 min. Then the entire mixture kept in the
separating funnel. The top layer, biodiesel, is taken for the removal of methanol in the
ROTO vacuum distiller. Then the methyl ester washed of distilled water (1 l) in the same
reactor for 30 min. After washing, top layer in the separating funnel has to be washed with
saline water for two times. Finally, clear biodiesel was kept in the oven for 4 h at 100C. The
ready to use biodiesel few samples shown in Fig.2.
www.intechopen.com
Biodiesel – Feedstocks and Processing Technologies
320
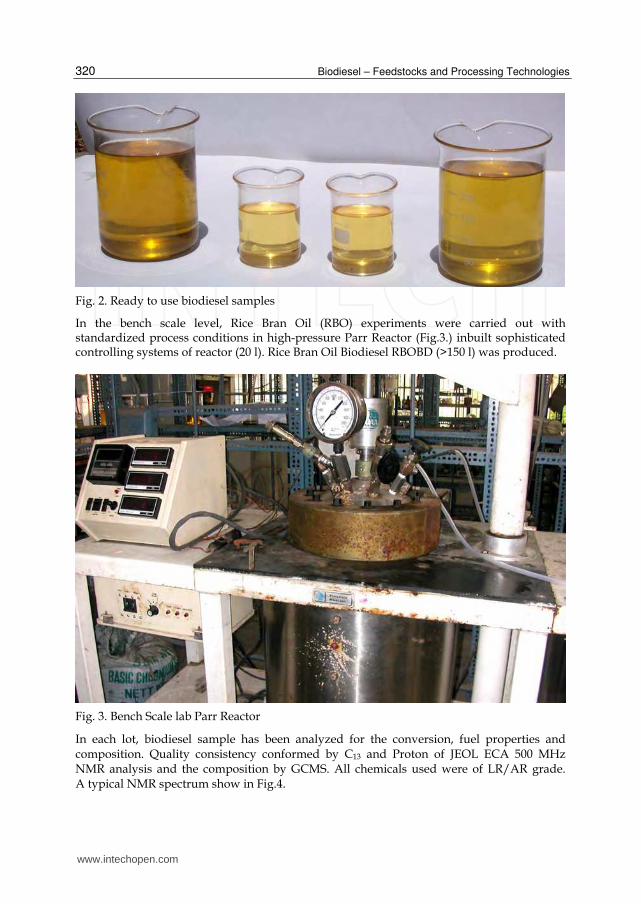
Fig. 2. Ready to use biodiesel samples
In the bench scale level, Rice Bran Oil (RBO) experiments were carried out with standardized process conditions in high-pressure Parr Reactor (Fig.3.) inbuilt sophisticated controlling systems of reactor (20 l). Rice Bran Oil Biodiesel RBOBD (>150 l) was produced.
Fig. 3. Bench Scale lab Parr Reactor
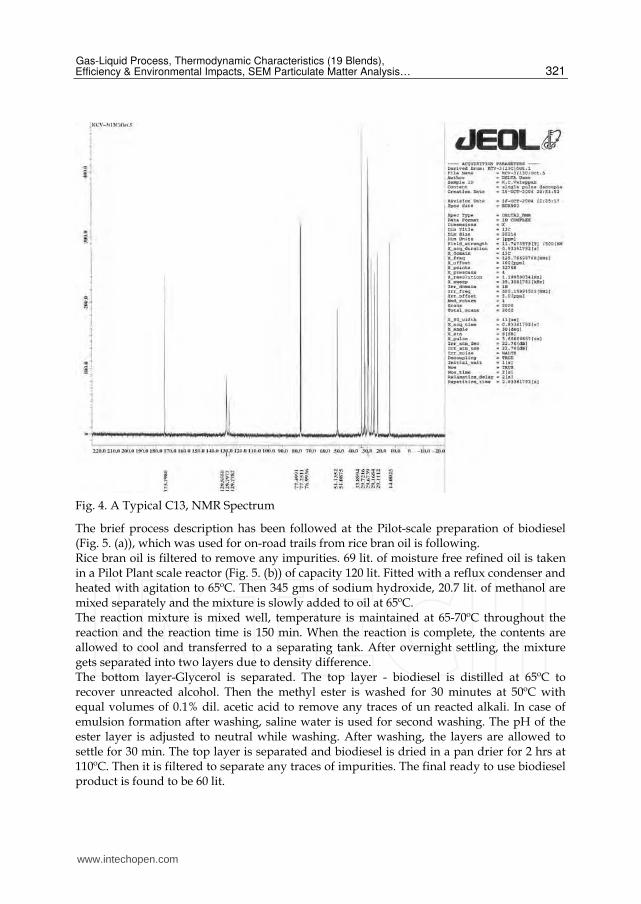
In each lot, biodiesel sample has been analyzed for the conversion, fuel properties and composition. Quality consistency conformed by C13 and Proton of JEOL ECA 500 MHz NMR analysis and the composition by GCMS. All chemicals used were of LR/AR grade. A typical NMR spectrum show in Fig.4.
www.intechopen.com
Gas-Liquid Process, Thermodynamic Characteristics (19 Blends), Efficiency & Environmental Impacts, SEM Particulate Matter Analysis…
321
Fig. 4. A Typical C13, NMR Spectrum
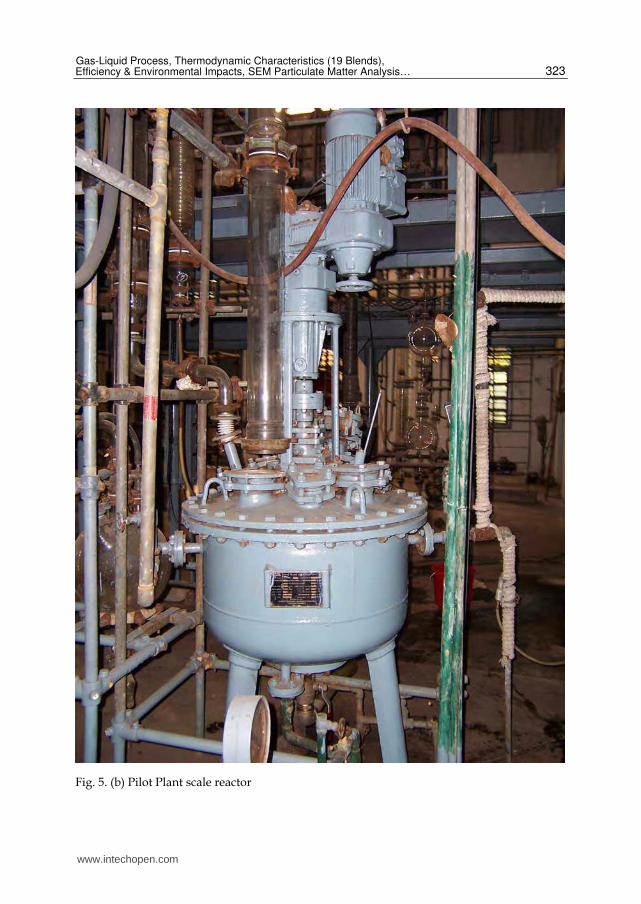
The brief process description has been followed at the Pilot-scale preparation of biodiesel (Fig. 5. (a)), which was used for on-road trails from rice bran oil is following. Rice bran oil is filtered to remove any impurities. 69 lit. of moisture free refined oil is taken in a Pilot Plant scale reactor (Fig. 5. (b)) of capacity 120 lit. Fitted with a reflux condenser and heated with agitation to 65ºC. Then 345 gms of sodium hydroxide, 20.7 lit. of methanol are mixed separately and the mixture is slowly added to oil at 65ºC. The reaction mixture is mixed well, temperature is maintained at 65-70ºC throughout the reaction and the reaction time is 150 min. When the reaction is complete, the contents are allowed to cool and transferred to a separating tank. After overnight settling, the mixture gets separated into two layers due to density difference. The bottom layer-Glycerol is separated. The top layer - biodiesel is distilled at 65ºC to recover unreacted alcohol. Then the methyl ester is washed for 30 minutes at 50ºC with equal volumes of 0.1% dil. acetic acid to remove any traces of un reacted alkali. In case of emulsion formation after washing, saline water is used for second washing. The pH of the ester layer is adjusted to neutral while washing. After washing, the layers are allowed to settle for 30 min. The top layer is separated and biodiesel is dried in a pan drier for 2 hrs at 110ºC. Then it is filtered to separate any traces of impurities. The final ready to use biodiesel product is found to be 60 lit.
www.intechopen.com
Biodiesel – Feedstocks and Processing Technologies
322
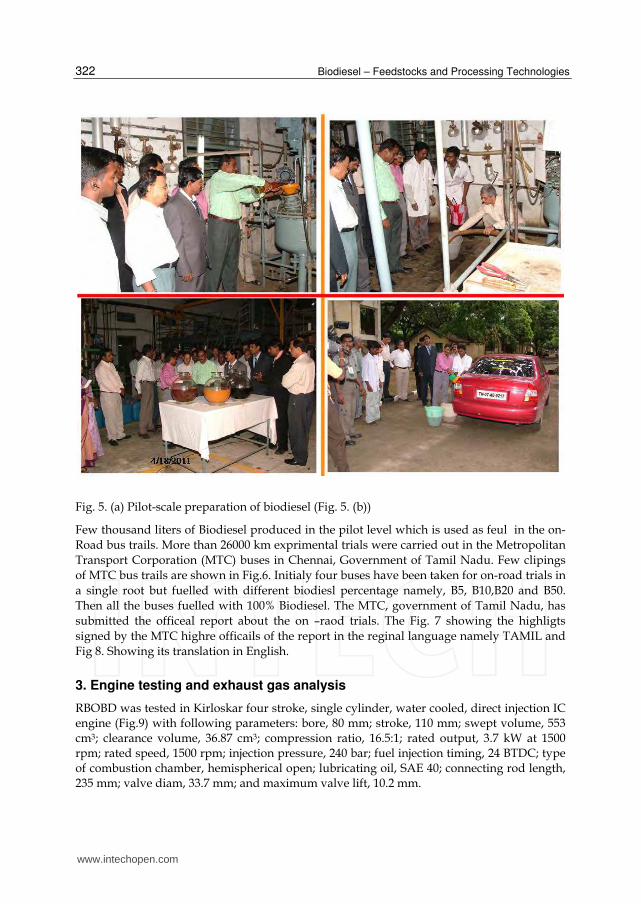
Fig. 5. (a) Pilot-scale preparation of biodiesel (Fig. 5. (b))
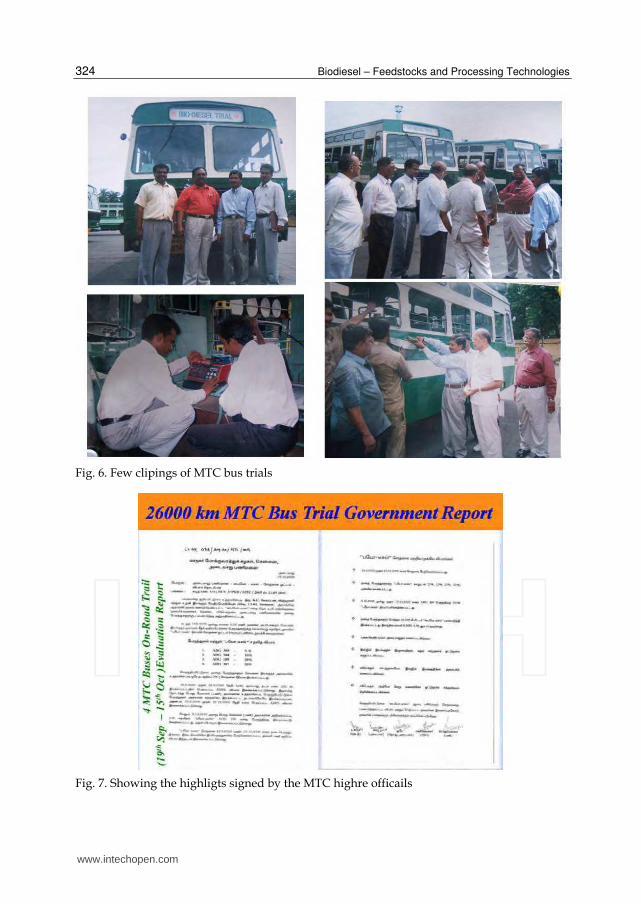
Few thousand liters of Biodiesel produced in the pilot level which is used as feul in the on-
Road bus trails. More than 26000 km exprimental trials were carried out in the Metropolitan
Transport Corporation (MTC) buses in Chennai, Government of Tamil Nadu. Few clipings
of MTC bus trails are shown in Fig.6. Initialy four buses have been taken for on-road trials in
a single root but fuelled with different biodiesl percentage namely, B5, B10,B20 and B50.
Then all the buses fuelled with 100% Biodiesel. The MTC, government of Tamil Nadu, has
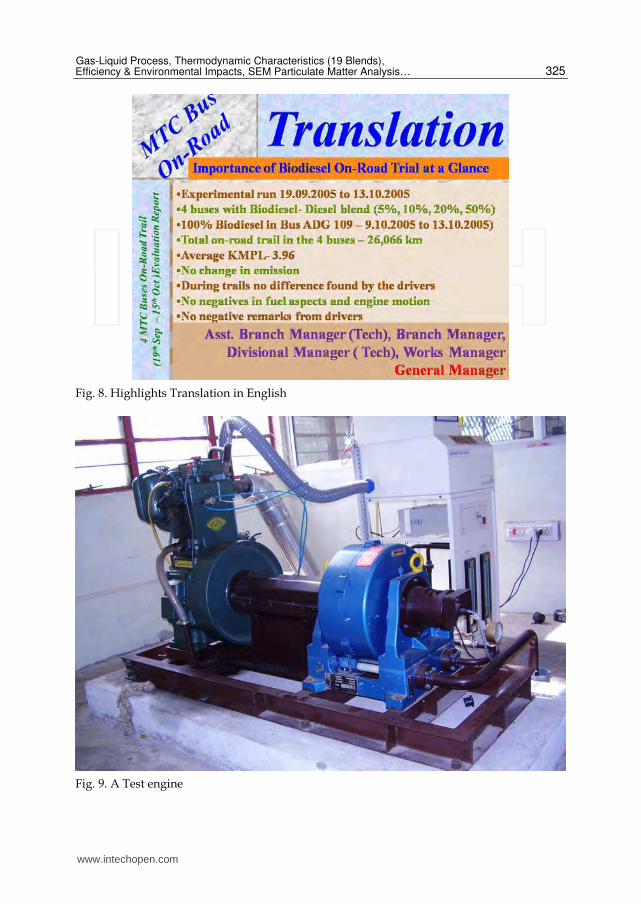
submitted the officeal report about the on –raod trials. The Fig. 7 showing the highligts
signed by the MTC highre officails of the report in the reginal language namely TAMIL and
Fig 8. Showing its translation in English.
3. Engine testing and exhaust gas analysis
RBOBD was tested in Kirloskar four stroke, single cylinder, water cooled, direct injection IC engine (Fig.9) with following parameters: bore, 80 mm; stroke, 110 mm; swept volume, 553 cm3; clearance volume, 36.87 cm3; compression ratio, 16.5:1; rated output, 3.7 kW at 1500 rpm; rated speed, 1500 rpm; injection pressure, 240 bar; fuel injection timing, 24 BTDC; type of combustion chamber, hemispherical open; lubricating oil, SAE 40; connecting rod length, 235 mm; valve diam, 33.7 mm; and maximum valve lift, 10.2 mm.
www.intechopen.com
Gas-Liquid Process, Thermodynamic Characteristics (19 Blends), Efficiency & Environmental Impacts, SEM Particulate Matter Analysis…
323
Fig. 5. (b) Pilot Plant scale reactor
www.intechopen.com
Biodiesel – Feedstocks and Processing Technologies
324
Fig. 6. Few clipings of MTC bus trials
Fig. 7. Showing the highligts signed by the MTC highre officails
www.intechopen.com
Gas-Liquid Process, Thermodynamic Characteristics (19 Blends), Efficiency & Environmental Impacts, SEM Particulate Matter Analysis…
325
Fig. 8. Highlights Translation in English
Fig. 9. A Test engine
www.intechopen.com
Biodiesel – Feedstocks and Processing Technologies
326
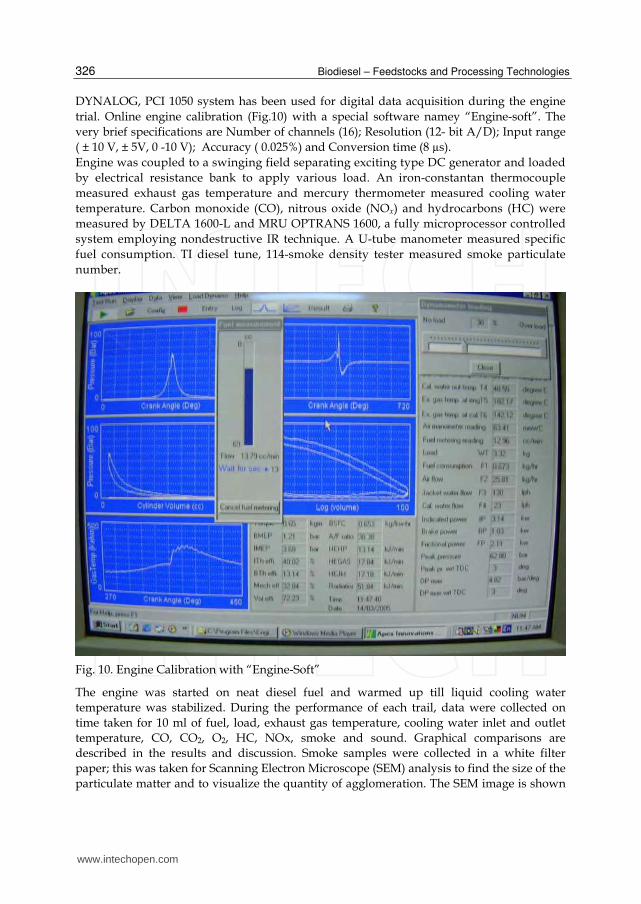
DYNALOG, PCI 1050 system has been used for digital data acquisition during the engine
trial. Online engine calibration (Fig.10) with a special software namey “Engine-soft”. The
very brief specifications are Number of channels (16); Resolution (12- bit A/D); Input range
( ± 10 V, ± 5V, 0 -10 V); Accuracy ( 0.025%) and Conversion time (8 µs).
Engine was coupled to a swinging field separating exciting type DC generator and loaded
by electrical resistance bank to apply various load. An iron-constantan thermocouple
measured exhaust gas temperature and mercury thermometer measured cooling water
temperature. Carbon monoxide (CO), nitrous oxide (NOx) and hydrocarbons (HC) were
measured by DELTA 1600-L and MRU OPTRANS 1600, a fully microprocessor controlled
system employing nondestructive IR technique. A U-tube manometer measured specific
fuel consumption. TI diesel tune, 114-smoke density tester measured smoke particulate
number.
Fig. 10. Engine Calibration with “Engine-Soft”
The engine was started on neat diesel fuel and warmed up till liquid cooling water
temperature was stabilized. During the performance of each trail, data were collected on
time taken for 10 ml of fuel, load, exhaust gas temperature, cooling water inlet and outlet
temperature, CO, CO2, O2, HC, NOx, smoke and sound. Graphical comparisons are
described in the results and discussion. Smoke samples were collected in a white filter
paper; this was taken for Scanning Electron Microscope (SEM) analysis to find the size of the
particulate matter and to visualize the quantity of agglomeration. The SEM image is shown
www.intechopen.com
Gas-Liquid Process, Thermodynamic Characteristics (19 Blends), Efficiency & Environmental Impacts, SEM Particulate Matter Analysis…
327
in Fig 10. Based on the data, specific fuel consumption, indicative thermal efficiency, brake
thermal efficiency, mechanical efficiency and total fuel consumption were estimated. Similar
procedures were repeated for RBOBD.
4. Results and discussion
4.1 Process conditions and compositions RBOBD contains (GC-MS) esters of following acids: palmitic, 16; stearic, 2; oleic, 42; linoleic,
38; linolenic, 1.4; and arachidic, 0.6%. Quality consistency was conformed by C13 and Proton
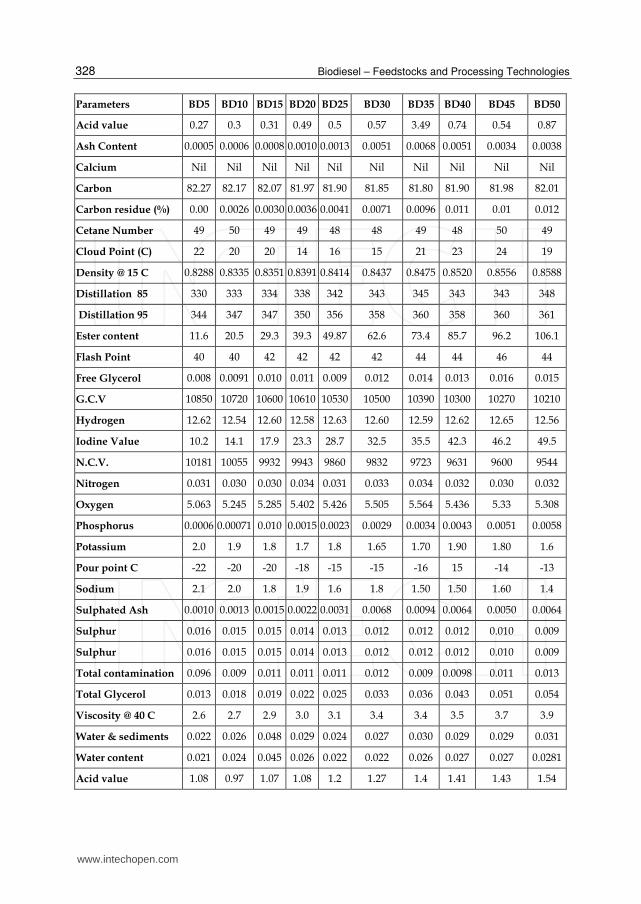
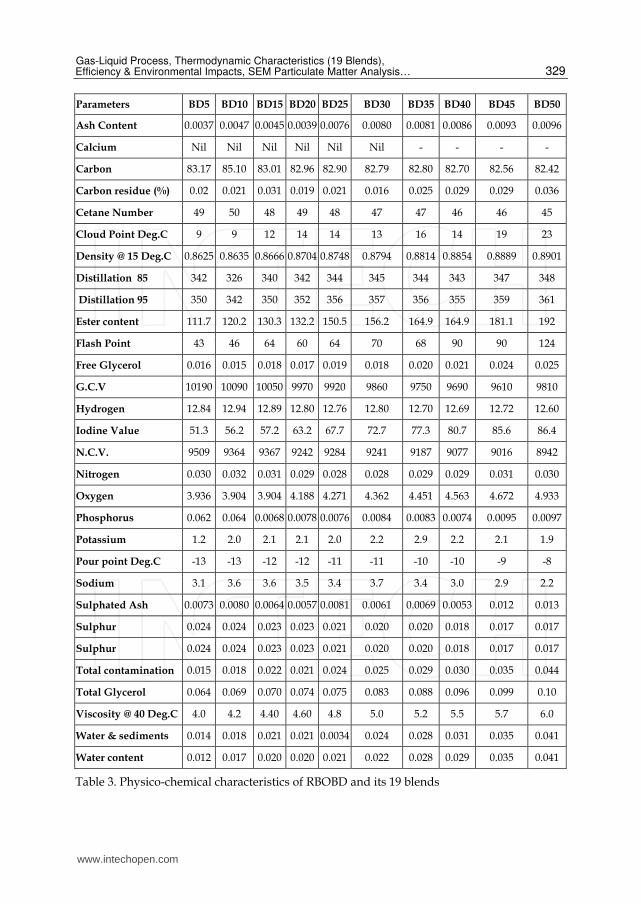
of JEOL ECA 500 MHz NMR. Physico-chemical characteristics of RBOBD and its 19 blends
(Table 3) show that most of the parameters comply with international standards of biodiesel.
An NMR spectrum is already shown in Fig 4.
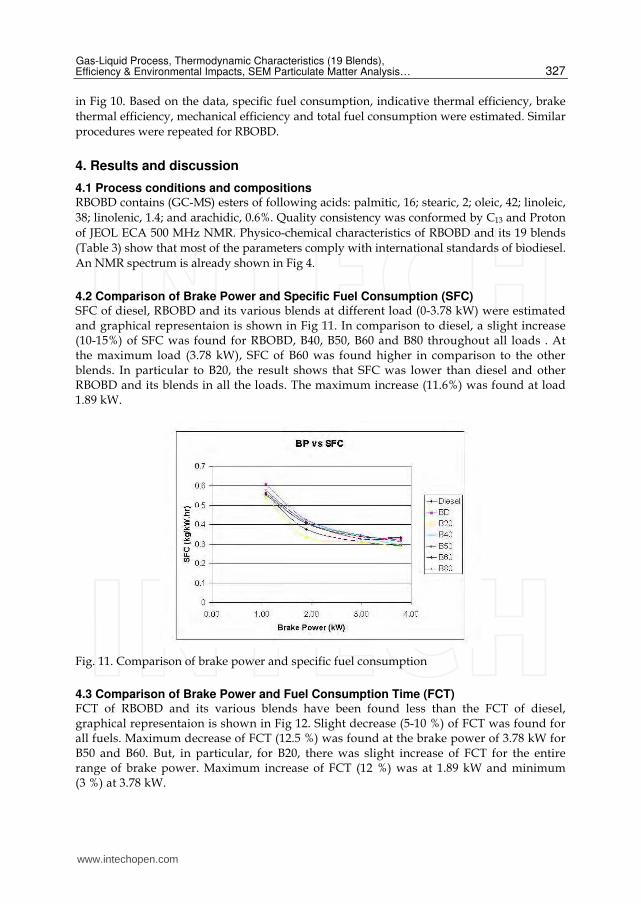
4.2 Comparison of Brake Power and Specific Fuel Consumption (SFC) SFC of diesel, RBOBD and its various blends at different load (0-3.78 kW) were estimated and graphical representaion is shown in Fig 11. In comparison to diesel, a slight increase (10-15%) of SFC was found for RBOBD, B40, B50, B60 and B80 throughout all loads . At the maximum load (3.78 kW), SFC of B60 was found higher in comparison to the other blends. In particular to B20, the result shows that SFC was lower than diesel and other RBOBD and its blends in all the loads. The maximum increase (11.6%) was found at load 1.89 kW.
Fig. 11. Comparison of brake power and specific fuel consumption
4.3 Comparison of Brake Power and Fuel Consumption Time (FCT) FCT of RBOBD and its various blends have been found less than the FCT of diesel, graphical representaion is shown in Fig 12. Slight decrease (5-10 %) of FCT was found for all fuels. Maximum decrease of FCT (12.5 %) was found at the brake power of 3.78 kW for B50 and B60. But, in particular, for B20, there was slight increase of FCT for the entire range of brake power. Maximum increase of FCT (12 %) was at 1.89 kW and minimum (3 %) at 3.78 kW.
www.intechopen.com
Biodiesel – Feedstocks and Processing Technologies
328
Parameters BD5 BD10 BD15 BD20 BD25 BD30 BD35 BD40 BD45 BD50
Acid value 0.27 0.3 0.31 0.49 0.5 0.57 3.49 0.74 0.54 0.87
Ash Content 0.0005 0.0006 0.0008 0.0010 0.0013 0.0051 0.0068 0.0051 0.0034 0.0038
Calcium Nil Nil Nil Nil Nil Nil Nil Nil Nil Nil
Carbon 82.27 82.17 82.07 81.97 81.90 81.85 81.80 81.90 81.98 82.01
Carbon residue (%) 0.00 0.0026 0.0030 0.0036 0.0041 0.0071 0.0096 0.011 0.01 0.012
Cetane Number 49 50 49 49 48 48 49 48 50 49
Cloud Point (C) 22 20 20 14 16 15 21 23 24 19
Density @ 15 C 0.8288 0.8335 0.8351 0.8391 0.8414 0.8437 0.8475 0.8520 0.8556 0.8588
Distillation 85 330 333 334 338 342 343 345 343 343 348
Distillation 95 344 347 347 350 356 358 360 358 360 361
Ester content 11.6 20.5 29.3 39.3 49.87 62.6 73.4 85.7 96.2 106.1
Flash Point 40 40 42 42 42 42 44 44 46 44
Free Glycerol 0.008 0.0091 0.010 0.011 0.009 0.012 0.014 0.013 0.016 0.015
G.C.V 10850 10720 10600 10610 10530 10500 10390 10300 10270 10210
Hydrogen 12.62 12.54 12.60 12.58 12.63 12.60 12.59 12.62 12.65 12.56
Iodine Value 10.2 14.1 17.9 23.3 28.7 32.5 35.5 42.3 46.2 49.5
N.C.V. 10181 10055 9932 9943 9860 9832 9723 9631 9600 9544
Nitrogen 0.031 0.030 0.030 0.034 0.031 0.033 0.034 0.032 0.030 0.032
Oxygen 5.063 5.245 5.285 5.402 5.426 5.505 5.564 5.436 5.33 5.308
Phosphorus 0.0006 0.00071 0.010 0.0015 0.0023 0.0029 0.0034 0.0043 0.0051 0.0058
Potassium 2.0 1.9 1.8 1.7 1.8 1.65 1.70 1.90 1.80 1.6
Pour point C -22 -20 -20 -18 -15 -15 -16 15 -14 -13
Sodium 2.1 2.0 1.8 1.9 1.6 1.8 1.50 1.50 1.60 1.4
Sulphated Ash 0.0010 0.0013 0.0015 0.0022 0.0031 0.0068 0.0094 0.0064 0.0050 0.0064
Sulphur 0.016 0.015 0.015 0.014 0.013 0.012 0.012 0.012 0.010 0.009
Sulphur 0.016 0.015 0.015 0.014 0.013 0.012 0.012 0.012 0.010 0.009
Total contamination 0.096 0.009 0.011 0.011 0.011 0.012 0.009 0.0098 0.011 0.013
Total Glycerol 0.013 0.018 0.019 0.022 0.025 0.033 0.036 0.043 0.051 0.054
Viscosity @ 40 C 2.6 2.7 2.9 3.0 3.1 3.4 3.4 3.5 3.7 3.9
Water & sediments 0.022 0.026 0.048 0.029 0.024 0.027 0.030 0.029 0.029 0.031
Water content 0.021 0.024 0.045 0.026 0.022 0.022 0.026 0.027 0.027 0.0281
Acid value 1.08 0.97 1.07 1.08 1.2 1.27 1.4 1.41 1.43 1.54
www.intechopen.com
Gas-Liquid Process, Thermodynamic Characteristics (19 Blends), Efficiency & Environmental Impacts, SEM Particulate Matter Analysis…
329
Parameters BD5 BD10 BD15 BD20 BD25 BD30 BD35 BD40 BD45 BD50
Ash Content 0.0037 0.0047 0.0045 0.0039 0.0076 0.0080 0.0081 0.0086 0.0093 0.0096
Calcium Nil Nil Nil Nil Nil Nil - - - -
Carbon 83.17 85.10 83.01 82.96 82.90 82.79 82.80 82.70 82.56 82.42
Carbon residue (%) 0.02 0.021 0.031 0.019 0.021 0.016 0.025 0.029 0.029 0.036
Cetane Number 49 50 48 49 48 47 47 46 46 45
Cloud Point Deg.C 9 9 12 14 14 13 16 14 19 23
Density @ 15 Deg.C 0.8625 0.8635 0.8666 0.8704 0.8748 0.8794 0.8814 0.8854 0.8889 0.8901
Distillation 85 342 326 340 342 344 345 344 343 347 348
Distillation 95 350 342 350 352 356 357 356 355 359 361
Ester content 111.7 120.2 130.3 132.2 150.5 156.2 164.9 164.9 181.1 192
Flash Point 43 46 64 60 64 70 68 90 90 124
Free Glycerol 0.016 0.015 0.018 0.017 0.019 0.018 0.020 0.021 0.024 0.025
G.C.V 10190 10090 10050 9970 9920 9860 9750 9690 9610 9810
Hydrogen 12.84 12.94 12.89 12.80 12.76 12.80 12.70 12.69 12.72 12.60
Iodine Value 51.3 56.2 57.2 63.2 67.7 72.7 77.3 80.7 85.6 86.4
N.C.V. 9509 9364 9367 9242 9284 9241 9187 9077 9016 8942
Nitrogen 0.030 0.032 0.031 0.029 0.028 0.028 0.029 0.029 0.031 0.030
Oxygen 3.936 3.904 3.904 4.188 4.271 4.362 4.451 4.563 4.672 4.933
Phosphorus 0.062 0.064 0.0068 0.0078 0.0076 0.0084 0.0083 0.0074 0.0095 0.0097
Potassium 1.2 2.0 2.1 2.1 2.0 2.2 2.9 2.2 2.1 1.9
Pour point Deg.C -13 -13 -12 -12 -11 -11 -10 -10 -9 -8
Sodium 3.1 3.6 3.6 3.5 3.4 3.7 3.4 3.0 2.9 2.2
Sulphated Ash 0.0073 0.0080 0.0064 0.0057 0.0081 0.0061 0.0069 0.0053 0.012 0.013
Sulphur 0.024 0.024 0.023 0.023 0.021 0.020 0.020 0.018 0.017 0.017
Sulphur 0.024 0.024 0.023 0.023 0.021 0.020 0.020 0.018 0.017 0.017
Total contamination 0.015 0.018 0.022 0.021 0.024 0.025 0.029 0.030 0.035 0.044
Total Glycerol 0.064 0.069 0.070 0.074 0.075 0.083 0.088 0.096 0.099 0.10
Viscosity @ 40 Deg.C 4.0 4.2 4.40 4.60 4.8 5.0 5.2 5.5 5.7 6.0
Water & sediments 0.014 0.018 0.021 0.021 0.0034 0.024 0.028 0.031 0.035 0.041
Water content 0.012 0.017 0.020 0.020 0.021 0.022 0.028 0.029 0.035 0.041
Table 3. Physico-chemical characteristics of RBOBD and its 19 blends
www.intechopen.com
Biodiesel – Feedstocks and Processing Technologies
330
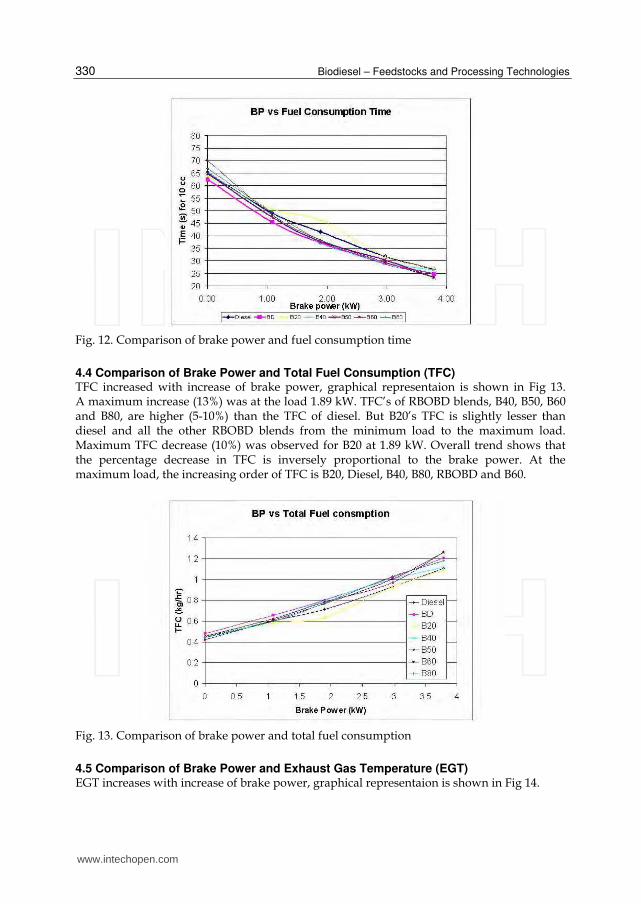
Fig. 12. Comparison of brake power and fuel consumption time
4.4 Comparison of Brake Power and Total Fuel Consumption (TFC) TFC increased with increase of brake power, graphical representaion is shown in Fig 13. A maximum increase (13%) was at the load 1.89 kW. TFC’s of RBOBD blends, B40, B50, B60 and B80, are higher (5-10%) than the TFC of diesel. But B20’s TFC is slightly lesser than diesel and all the other RBOBD blends from the minimum load to the maximum load. Maximum TFC decrease (10%) was observed for B20 at 1.89 kW. Overall trend shows that the percentage decrease in TFC is inversely proportional to the brake power. At the maximum load, the increasing order of TFC is B20, Diesel, B40, B80, RBOBD and B60.
Fig. 13. Comparison of brake power and total fuel consumption
4.5 Comparison of Brake Power and Exhaust Gas Temperature (EGT) EGT increases with increase of brake power, graphical representaion is shown in Fig 14.
www.intechopen.com
Gas-Liquid Process, Thermodynamic Characteristics (19 Blends), Efficiency & Environmental Impacts, SEM Particulate Matter Analysis…
331
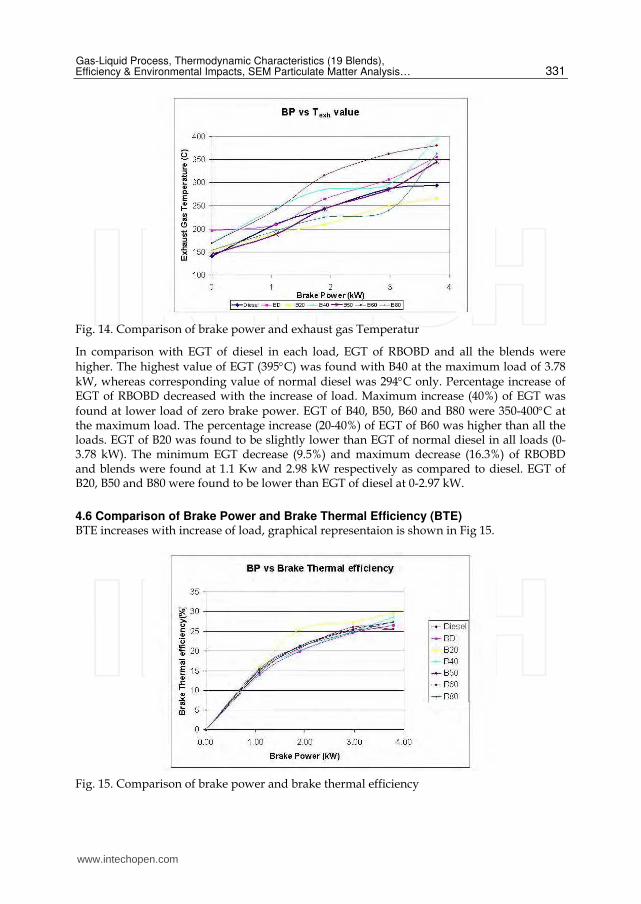
Fig. 14. Comparison of brake power and exhaust gas Temperatur
In comparison with EGT of diesel in each load, EGT of RBOBD and all the blends were higher. The highest value of EGT (395C) was found with B40 at the maximum load of 3.78 kW, whereas corresponding value of normal diesel was 294C only. Percentage increase of EGT of RBOBD decreased with the increase of load. Maximum increase (40%) of EGT was found at lower load of zero brake power. EGT of B40, B50, B60 and B80 were 350-400C at the maximum load. The percentage increase (20-40%) of EGT of B60 was higher than all the loads. EGT of B20 was found to be slightly lower than EGT of normal diesel in all loads (0-3.78 kW). The minimum EGT decrease (9.5%) and maximum decrease (16.3%) of RBOBD and blends were found at 1.1 Kw and 2.98 kW respectively as compared to diesel. EGT of B20, B50 and B80 were found to be lower than EGT of diesel at 0-2.97 kW.
4.6 Comparison of Brake Power and Brake Thermal Efficiency (BTE) BTE increases with increase of load, graphical representaion is shown in Fig 15.
Fig. 15. Comparison of brake power and brake thermal efficiency
www.intechopen.com
Biodiesel – Feedstocks and Processing Technologies
332
BTE of RBOBD was less (5%) than diesel with respect to all loads. All other RBOBD blends (B40, B50, B60 and B80) were within 5 % only. Maximum reduction (20%) of BTE was found at 1.89 kW and minimum increase (7%) at 2.9765 kW. BTE of B20 was found higher than BTE of normal diesel in all loads. At maximum load (3.78 kW), BTE for B20 (29.7%), B40 (28.6%), B50 (25.6%) and B60 & B80 (25.5%) are higher than BTE of diesel.
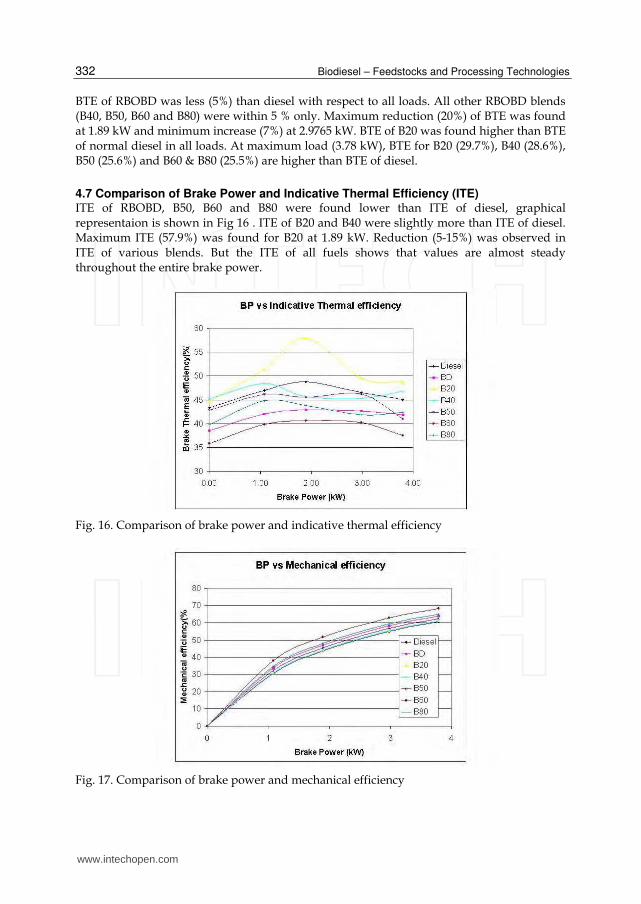
4.7 Comparison of Brake Power and Indicative Thermal Efficiency (ITE) ITE of RBOBD, B50, B60 and B80 were found lower than ITE of diesel, graphical representaion is shown in Fig 16 . ITE of B20 and B40 were slightly more than ITE of diesel. Maximum ITE (57.9%) was found for B20 at 1.89 kW. Reduction (5-15%) was observed in ITE of various blends. But the ITE of all fuels shows that values are almost steady throughout the entire brake power.
Fig. 16. Comparison of brake power and indicative thermal efficiency
Fig. 17. Comparison of brake power and mechanical efficiency
www.intechopen.com
Gas-Liquid Process, Thermodynamic Characteristics (19 Blends), Efficiency & Environmental Impacts, SEM Particulate Matter Analysis…
333
4.8 Comparison of Brake Power And Mechanical Efficiency (ME) ME of the engine run with RBOBD and various blends increases with increase of brake power in comparison with normal diesel, graphical representaion is shown in Fig 17. ME of RBOBD was less (5%) than diesel with respect to all loads. There was a slight increase of ME for all RBOBD blends in the order of B40, B50, B20, B80 and B60. Highest ME (68%) observed for B60 was at the maximum load. Overall trend shows that percentage increase of ME was decreased with increase of load. The result of B60 shows that the minimum increase (12%) was found at maximum load and maximum increase (24%) at minimum load.
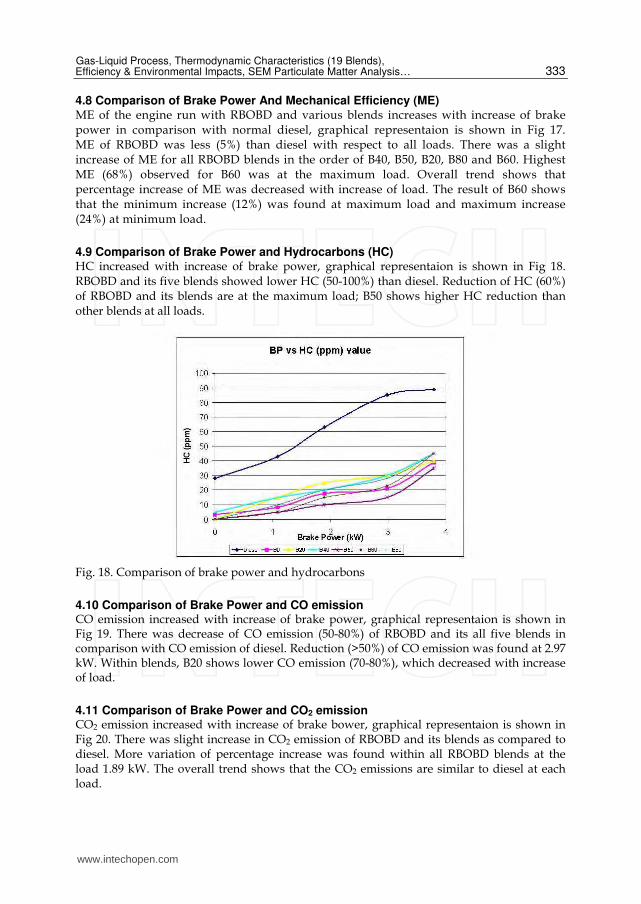
4.9 Comparison of Brake Power and Hydrocarbons (HC) HC increased with increase of brake power, graphical representaion is shown in Fig 18. RBOBD and its five blends showed lower HC (50-100%) than diesel. Reduction of HC (60%) of RBOBD and its blends are at the maximum load; B50 shows higher HC reduction than other blends at all loads.
Fig. 18. Comparison of brake power and hydrocarbons
4.10 Comparison of Brake Power and CO emission CO emission increased with increase of brake power, graphical representaion is shown in Fig 19. There was decrease of CO emission (50-80%) of RBOBD and its all five blends in comparison with CO emission of diesel. Reduction (>50%) of CO emission was found at 2.97 kW. Within blends, B20 shows lower CO emission (70-80%), which decreased with increase of load.
4.11 Comparison of Brake Power and CO2 emission CO2 emission increased with increase of brake bower, graphical representaion is shown in Fig 20. There was slight increase in CO2 emission of RBOBD and its blends as compared to diesel. More variation of percentage increase was found within all RBOBD blends at the load 1.89 kW. The overall trend shows that the CO2 emissions are similar to diesel at each load.
www.intechopen.com
Biodiesel – Feedstocks and Processing Technologies
334
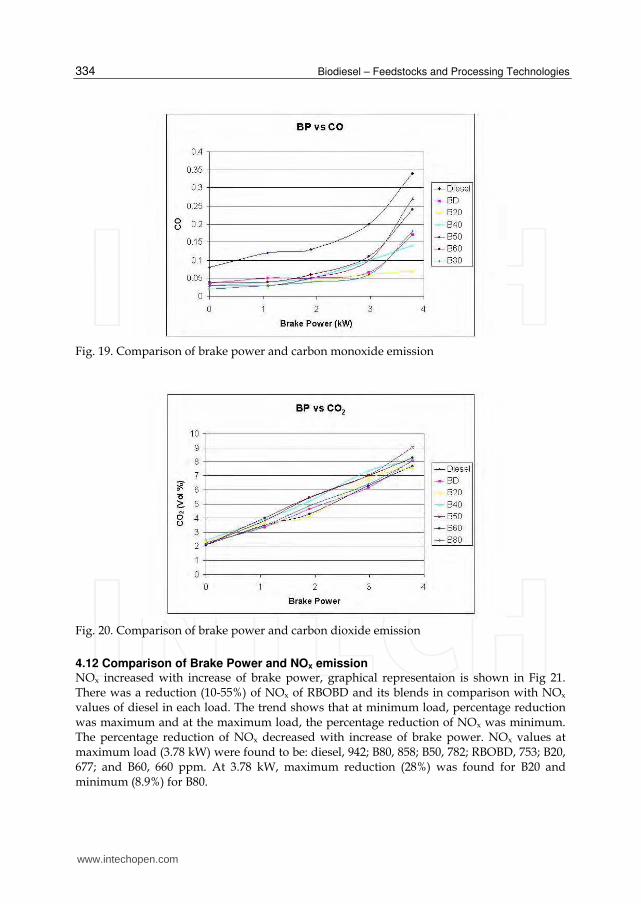
Fig. 19. Comparison of brake power and carbon monoxide emission
Fig. 20. Comparison of brake power and carbon dioxide emission
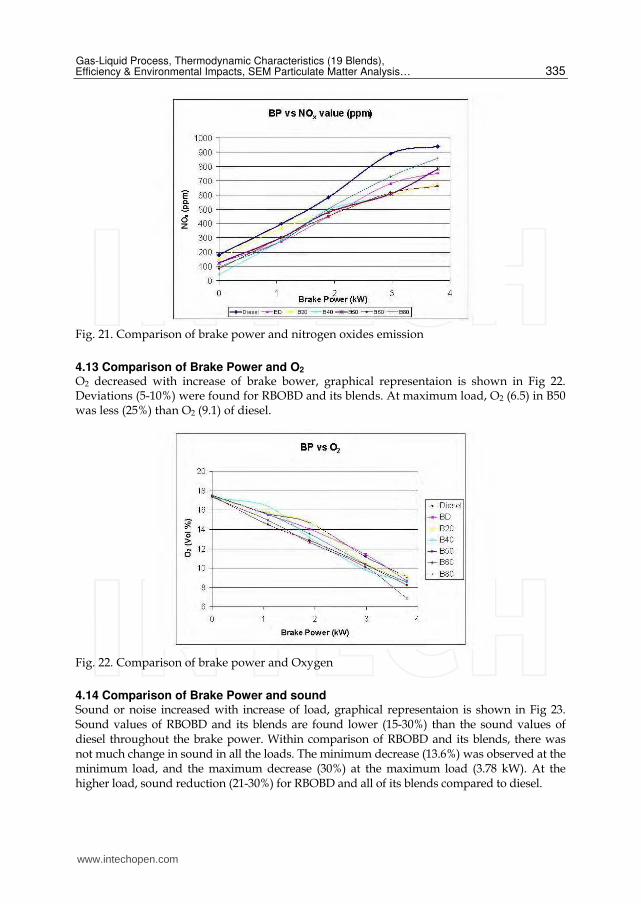
4.12 Comparison of Brake Power and NOx emission NOx increased with increase of brake power, graphical representaion is shown in Fig 21. There was a reduction (10-55%) of NOx of RBOBD and its blends in comparison with NOx values of diesel in each load. The trend shows that at minimum load, percentage reduction was maximum and at the maximum load, the percentage reduction of NOx was minimum. The percentage reduction of NOx decreased with increase of brake power. NOx values at maximum load (3.78 kW) were found to be: diesel, 942; B80, 858; B50, 782; RBOBD, 753; B20, 677; and B60, 660 ppm. At 3.78 kW, maximum reduction (28%) was found for B20 and minimum (8.9%) for B80.
www.intechopen.com
Gas-Liquid Process, Thermodynamic Characteristics (19 Blends), Efficiency & Environmental Impacts, SEM Particulate Matter Analysis…
335
Fig. 21. Comparison of brake power and nitrogen oxides emission
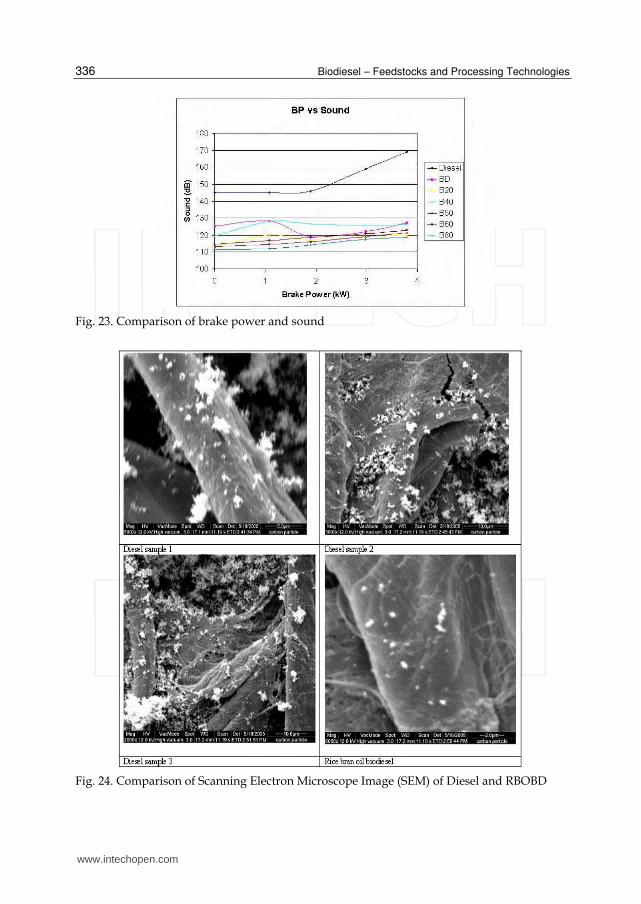
4.13 Comparison of Brake Power and O2 O2 decreased with increase of brake bower, graphical representaion is shown in Fig 22. Deviations (5-10%) were found for RBOBD and its blends. At maximum load, O2 (6.5) in B50 was less (25%) than O2 (9.1) of diesel.
Fig. 22. Comparison of brake power and Oxygen
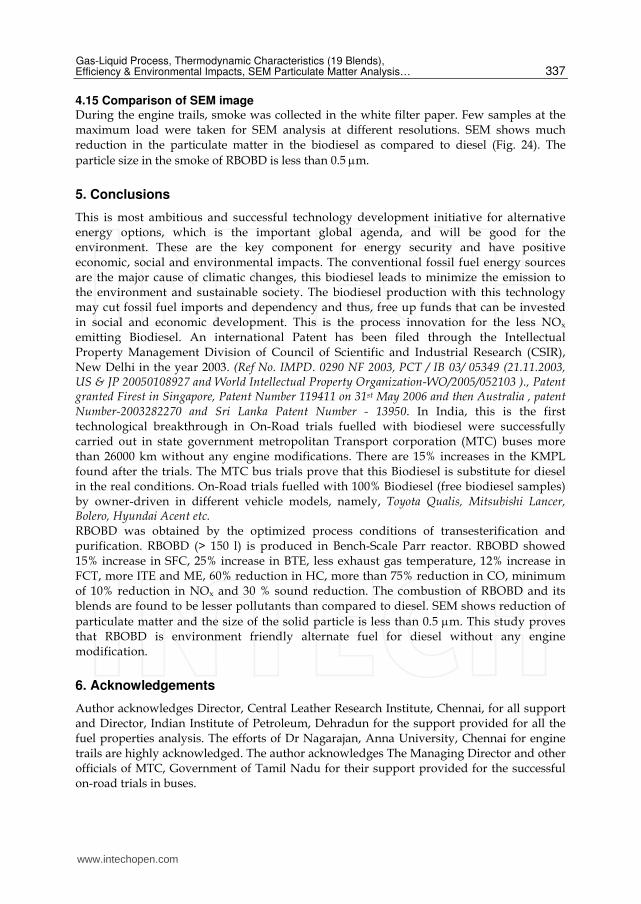
4.14 Comparison of Brake Power and sound Sound or noise increased with increase of load, graphical representaion is shown in Fig 23. Sound values of RBOBD and its blends are found lower (15-30%) than the sound values of diesel throughout the brake power. Within comparison of RBOBD and its blends, there was not much change in sound in all the loads. The minimum decrease (13.6%) was observed at the minimum load, and the maximum decrease (30%) at the maximum load (3.78 kW). At the higher load, sound reduction (21-30%) for RBOBD and all of its blends compared to diesel.
www.intechopen.com
Biodiesel – Feedstocks and Processing Technologies
336
Fig. 23. Comparison of brake power and sound
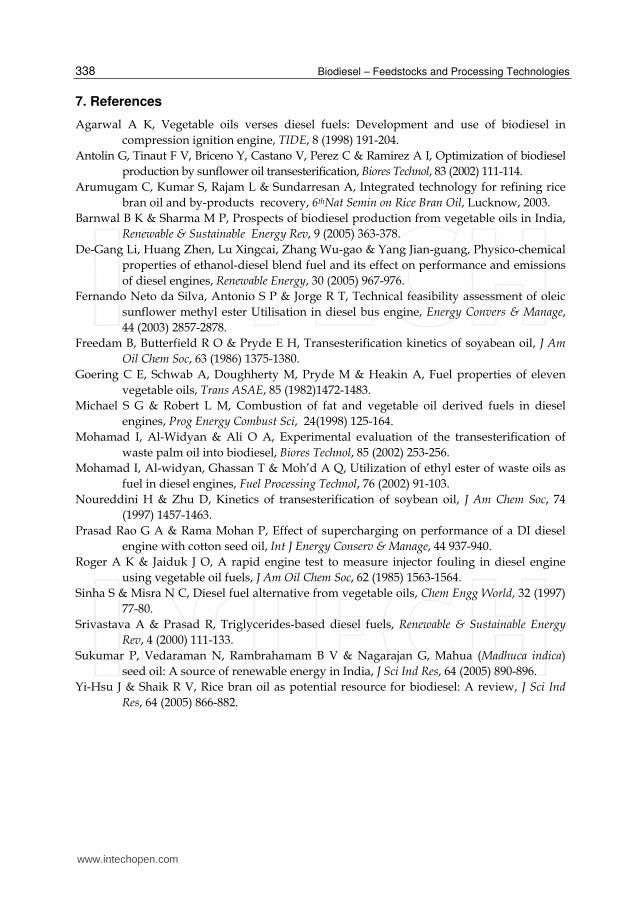
Fig. 24. Comparison of Scanning Electron Microscope Image (SEM) of Diesel and RBOBD
www.intechopen.com
Gas-Liquid Process, Thermodynamic Characteristics (19 Blends), Efficiency & Environmental Impacts, SEM Particulate Matter Analysis…
337
4.15 Comparison of SEM image During the engine trails, smoke was collected in the white filter paper. Few samples at the maximum load were taken for SEM analysis at different resolutions. SEM shows much reduction in the particulate matter in the biodiesel as compared to diesel (Fig. 24). The
particle size in the smoke of RBOBD is less than 0.5 m.
5. Conclusions
This is most ambitious and successful technology development initiative for alternative energy options, which is the important global agenda, and will be good for the environment. These are the key component for energy security and have positive economic, social and environmental impacts. The conventional fossil fuel energy sources are the major cause of climatic changes, this biodiesel leads to minimize the emission to the environment and sustainable society. The biodiesel production with this technology may cut fossil fuel imports and dependency and thus, free up funds that can be invested in social and economic development. This is the process innovation for the less NOx emitting Biodiesel. An international Patent has been filed through the Intellectual Property Management Division of Council of Scientific and Industrial Research (CSIR), New Delhi in the year 2003. (Ref No. IMPD. 0290 NF 2003, PCT / IB 03/ 05349 (21.11.2003, US & JP 20050108927 and World Intellectual Property Organization-WO/2005/052103 )., Patent granted Firest in Singapore, Patent Number 119411 on 31st May 2006 and then Australia , patent Number-2003282270 and Sri Lanka Patent Number - 13950. In India, this is the first technological breakthrough in On-Road trials fuelled with biodiesel were successfully carried out in state government metropolitan Transport corporation (MTC) buses more than 26000 km without any engine modifications. There are 15% increases in the KMPL found after the trials. The MTC bus trials prove that this Biodiesel is substitute for diesel in the real conditions. On-Road trials fuelled with 100% Biodiesel (free biodiesel samples) by owner-driven in different vehicle models, namely, Toyota Qualis, Mitsubishi Lancer, Bolero, Hyundai Acent etc. RBOBD was obtained by the optimized process conditions of transesterification and purification. RBOBD (> 150 l) is produced in Bench-Scale Parr reactor. RBOBD showed 15% increase in SFC, 25% increase in BTE, less exhaust gas temperature, 12% increase in FCT, more ITE and ME, 60% reduction in HC, more than 75% reduction in CO, minimum of 10% reduction in NOx and 30 % sound reduction. The combustion of RBOBD and its blends are found to be lesser pollutants than compared to diesel. SEM shows reduction of
particulate matter and the size of the solid particle is less than 0.5 m. This study proves that RBOBD is environment friendly alternate fuel for diesel without any engine modification.
6. Acknowledgements
Author acknowledges Director, Central Leather Research Institute, Chennai, for all support and Director, Indian Institute of Petroleum, Dehradun for the support provided for all the fuel properties analysis. The efforts of Dr Nagarajan, Anna University, Chennai for engine trails are highly acknowledged. The author acknowledges The Managing Director and other officials of MTC, Government of Tamil Nadu for their support provided for the successful on-road trials in buses.
www.intechopen.com
Biodiesel – Feedstocks and Processing Technologies
338
7. References
Agarwal A K, Vegetable oils verses diesel fuels: Development and use of biodiesel in
compression ignition engine, TIDE, 8 (1998) 191-204.
Antolin G, Tinaut F V, Briceno Y, Castano V, Perez C & Ramirez A I, Optimization of biodiesel
production by sunflower oil transesterification, Biores Technol, 83 (2002) 111-114.
Arumugam C, Kumar S, Rajam L & Sundarresan A, Integrated technology for refining rice
bran oil and by-products recovery, 6thNat Semin on Rice Bran Oil, Lucknow, 2003.
Barnwal B K & Sharma M P, Prospects of biodiesel production from vegetable oils in India,
Renewable & Sustainable Energy Rev, 9 (2005) 363-378.
De-Gang Li, Huang Zhen, Lu Xingcai, Zhang Wu-gao & Yang Jian-guang, Physico-chemical
properties of ethanol-diesel blend fuel and its effect on performance and emissions
of diesel engines, Renewable Energy, 30 (2005) 967-976.
Fernando Neto da Silva, Antonio S P & Jorge R T, Technical feasibility assessment of oleic
sunflower methyl ester Utilisation in diesel bus engine, Energy Convers & Manage,
44 (2003) 2857-2878.
Freedam B, Butterfield R O & Pryde E H, Transesterification kinetics of soyabean oil, J Am
Oil Chem Soc, 63 (1986) 1375-1380.
Goering C E, Schwab A, Doughherty M, Pryde M & Heakin A, Fuel properties of eleven
vegetable oils, Trans ASAE, 85 (1982)1472-1483.
Michael S G & Robert L M, Combustion of fat and vegetable oil derived fuels in diesel
engines, Prog Energy Combust Sci, 24(1998) 125-164.
Mohamad I, Al-Widyan & Ali O A, Experimental evaluation of the transesterification of
waste palm oil into biodiesel, Biores Technol, 85 (2002) 253-256.
Mohamad I, Al-widyan, Ghassan T & Moh’d A Q, Utilization of ethyl ester of waste oils as
fuel in diesel engines, Fuel Processing Technol, 76 (2002) 91-103.
Noureddini H & Zhu D, Kinetics of transesterification of soybean oil, J Am Chem Soc, 74
(1997) 1457-1463.
Prasad Rao G A & Rama Mohan P, Effect of supercharging on performance of a DI diesel
engine with cotton seed oil, Int J Energy Conserv & Manage, 44 937-940.
Roger A K & Jaiduk J O, A rapid engine test to measure injector fouling in diesel engine
using vegetable oil fuels, J Am Oil Chem Soc, 62 (1985) 1563-1564.
Sinha S & Misra N C, Diesel fuel alternative from vegetable oils, Chem Engg World, 32 (1997)
77-80.
Srivastava A & Prasad R, Triglycerides-based diesel fuels, Renewable & Sustainable Energy
Rev, 4 (2000) 111-133.
Sukumar P, Vedaraman N, Rambrahamam B V & Nagarajan G, Mahua (Madhuca indica)
seed oil: A source of renewable energy in India, J Sci Ind Res, 64 (2005) 890-896.
Yi-Hsu J & Shaik R V, Rice bran oil as potential resource for biodiesel: A review, J Sci Ind
Res, 64 (2005) 866-882.
www.intechopen.com
Biodiesel - Feedstocks and Processing TechnologiesEdited by Dr. Margarita Stoytcheva
ISBN 978-953-307-713-0Hard cover, 458 pagesPublisher InTechPublished online 09, November, 2011Published in print edition November, 2011
InTech EuropeUniversity Campus STeP Ri Slavka Krautzeka 83/A 51000 Rijeka, Croatia Phone: +385 (51) 770 447 Fax: +385 (51) 686 166www.intechopen.com
InTech ChinaUnit 405, Office Block, Hotel Equatorial Shanghai No.65, Yan An Road (West), Shanghai, 200040, China
Phone: +86-21-62489820 Fax: +86-21-62489821
The book "Biodiesel: Feedstocks and Processing Technologies" is intended to provide a professional look onthe recent achievements and emerging trends in biodiesel production. It includes 22 chapters, organized intwo sections. The first book section: "Feedstocks for Biodiesel Production" covers issues associated with theutilization of cost effective non-edible raw materials and wastes, and the development of biomass feedstockwith physical and chemical properties that facilitate it processing to biodiesel. These include Brassicaceaespp., cooking oils, animal fat wastes, oleaginous fungi, and algae. The second book section: "BiodieselProduction Methods" is devoted to the advanced techniques for biodiesel synthesis: supercriticaltransesterification, microwaves, radio frequency and ultrasound techniques, reactive distillation, and optimizedtransesterification processes making use of solid catalysts and immobilized enzymes. The adequate and up-to-date information provided in this book should be of interest for research scientist, students, andtechnologists, involved in biodiesel production.
How to referenceIn order to correctly reference this scholarly work, feel free to copy and paste the following:
Kandukalpatti Chinnaraj Velappan and Nagarajan Vedaraman (2011). Gas-Liquid Process, ThermodynamicCharacteristics (19 Blends), Efficiency & Environmental Impacts, SEM Particulate Matter Analysis and On-Road Bus Trial of a Proven NOx Less Biodiesel, Biodiesel - Feedstocks and Processing Technologies, Dr.Margarita Stoytcheva (Ed.), ISBN: 978-953-307-713-0, InTech, Available from:http://www.intechopen.com/books/biodiesel-feedstocks-and-processing-technologies/gas-liquid-process-thermodynamic-characteristics-19-blends-efficiency-environmental-impacts-sem-part