Embed Size (px)
Citation preview

Base aTHE
~ResearcJOURNAL
As usual, we have many fascinating articles-statistical, historical, and a mixture of both-in this issueof BRJ. Tom Shieber's lead piece is a wonderful ex,ample of basic SABR research, which deserves a placeon the required,reading list of anyone who wants acomplete picture of the game. One special article, byEddie Gold, is about John Tattersall, an early SABRmember and creator of the Tattersall Homerun Log,which we hope will soon be made public in updatedform.
We've also got Al Kermisch (what would a ResearchJournal be without his researcher's notebook?), DavidVoigt, and a sprinkling of the usual suspects I seem toround up every year as SABR's Claude Raines.Thankfully, we also have lots of first,time authors,whose work is so vital to the health of our Society.Geographically, we stretch from North Dakota to theDominican Republic, and chronologically from 1845to the late, lamented 1994 season.
-M.A.
The Evolution of the Baseball Diamond Tom Shieber 3
The Gowell Claset Saga Jamie Selko 14
Teammates with the Most Combined Hits "Biff" Brecher and Albey M. Reiner 17Disenfranchised All,Stars of 1945 Charlie Bevis 19
Games Ahead and Games Behind: A Pitching Stat Alan S. and James C. Kaufman 24Don Newcombe: Grace Under Pressure Guy Waterman 27If God Owned the Angels Tom Ruane 32
Alonzo Perry in the Dominican Republic Jose de Jesus Jimenez, M.D 39
The DiMaggio Streak: How Statistically Likely? Charles Blahous 41
19th Century Pitching Changes Robert E. Shipley 44Satchel Paige's 1935 Season in North Dakota Scott Roper 51
A Case for the DH ....................................•................. ............. Russell O.Wright , 55
The Cahill Brothers' Night Baseball Experiments David Pietrusza 62
John C. Tattersall, SABR's Homer Man ..+.+++.++++.+.++++++ •• +++++ •••• Eddie Gold. 67
Baseball's Antitrust Exemption + ••••••••••••••••••••••••••••••••••••••• Stephen D. Guschov, Esq 69
Baseball, Bluegrass, and Suicide Bob Bailey 75
Correlating Fielding and Batting Position Randy Klipstein 78
1894! + •••••••••••••••••••••••••••••••••••••••••••••••• David Q. Voigt 82
Waiting for the Hall to Call + ••••••••••••••••• Nat Rosenberg 85
Do Lefties Mature Late? Perry Sailor 88
Baseball's Amateur Draft David C. Thom,as + ••• 92
A Brief History of the Complete Game Dennis Stegmann 97On Batting Order Steven Seifert, M.D 101
The True Triple Crown > •••••••••••••••••••••••••••••••••• ••••• Mark Simon 106
From a Researcher's Notebook Al Kermisch 108
Editor: Mark AlvarezDesignated Reader: Dick Thompson
THE BASEBALL R~SEARCH JOURNAL (ISSN 0734-6891, ISBN 0-910137-57-9), Number 23.Published by The Society for American Basehall Rese(lfch, Inc, p,n Box 93183, Cleveland, OH,44101. Postage paid at Birmingham, AL. Copyright The Society for American Baseball Research,Inc. All rights reserved. Reproduction in whole or in part without written permission is prohibited.Printed by EBSCO Media, Birmingham, AL.

The Society for American Baseball Research
History
.The Society for American Baseball Research (SABR) was founded on August 10, 1971,by L. Robert "Bob" Davids and fifteen other baseball researchers at Cooperstown, NewYork, and now boasts more than 6,500 members worldwide. The Society's objectives areto foster the study of baseball as a significant American institution, to establish an accurate historical account of baseball through the years, to· facilitate the dissemination ofbaseball research information, to stimulate the best interest of baseball as our nationalpastime, and to cooperate in safeguarding proprietary interests of individual researchefforts of members of the Society.
Baseball Research Journal
The Society published its first annual Baseball ResearcJl Journal in January 1972. Thepresent volume is the twenty-third. Most of the previous volumes are still available forpurchase (see page 112). The editorial policy is to publish a cross section of researcharticles by our members which reflect their interest in history, biography, statistics andother aspects of baseball not previously published.
Interested in Joining the Society?
SABR l11elllbersllip is opel1 to all tllose itlterested ill baseball research, statistics or history. The 1995 member$hip dues are $35 US, $45 Canada & Mexico and $50 overseas(US funds only) and are based on the calendar year. Memhers receive the RasehallResearch JOllrnal, The National Pastinle, The SABR Bulletin, and other special publicationB. To join SABR, ·use the form found on the bottom of the publication order formfound on page 112. For further information, contact the SABR office at the address orphone belo,v:
SABRDept. BRJ
PO Box 93183Cleveland OH 44101
216-575-0500

The Evolution ofthe Baseball Diamond
Perfection came slowly
Tom Shieber
Red Smith once wrote: "Ninety feet betweenbases is the nearest to perfection that man has yetachieved."! Technically, this statement is incorrect:there has never been 90 feet between bases. In fact, inthe nineteenth century, the distance between basesoften varied from season to season as changes in therules altered the placement of the bases on the infielddiamond.2 This "perfection" of the baseball diamonddid not occur spontaneously, but evolved throughmore than 50 years of tinkering \vith the rules of base,·ball.
The modern baseball diamond is a square with sides90 feet in. len.gth, and is used as an aid in the position ...ing of the bases and base lines. The term "diamond"was used early in the history of tl1e ganle to differell"tiate the infield conJiguratioIl of the "New York n
game of baseball from that used in the "Massachu..setts" game. In the New York game the batter, orstriker, stood at the bottom corner of th.e illfield, tlluSviewing a diamond.. like positioning of the bases.However, the batter in the Massachusetts game wouldview tIle illfield as a rectangle.
The positioning, orifntation, size and make ... up ofthe bases on the infield diamond were not always ex ...plicitly stated in the rules of the game. This lack ofdefinition is not unusual, as much of the game itselfwas not detailed in the early rules. Rather than defin..ing the game of baseball and how it was to be played,
Tom Shieber operates a solar telescope at Tnt. \"",Tilson Observatury inSouthern California. He currently chairs the SABR Pictorial HistoryCommittee.
Plate A
these early rules were used to differentiate the par..ticular version. of baseball beillg played (forn orh~r
similar baseball.. like games of the era. Nevertheless, itis possible to trace tIle basic evolution of the baseballdiamond.
The Amateur Era-The New York KnickerbockerBase Ball Club, formally organized in 1845, estab ..lished the first written rules of basebalL3 Of theoriginal 20 rules, only 14 actually pertained to theganle of baseball, and the remaining six concernedclub matters. Of the 14 game rules, only the first re ..

THE BASEBALL RESEARCH JOURNAL
lated to the layout of the playing field: "1. The basesshall be from 'home' to second base, 42 paces; fromfirst to third base, 42 paces, equidistant." Simple ap'"plication of the Pythagorean theorem shows that asquare whose diagonal is 42 paces has sides of slightlyless than 30 paces. The Knickerbocker rules made nomention of the exact placement or size of the bases inthe infield.
In 1856, an article in the December 13 issue of theNew York Clipper listed the rules of basebalL Theserules were essentially identical to the originalKnickerbocker rules and were published along with arudimentary diagram of the baseball infield. Unfortu ...nately, the inaccuracies of the diagram render ituseless in determining the exact orientation and po...sitions of the bases of the era. In fact, the diagramshows the distance from home to second base to benoticeably longer than the distance from first to thirdbase, though the rules clearly specify equal distances.4
(see plate A.)The first convention of baseball players was held in
1857, al1d a new set of rules, 35 in number, wasadopted.5 Sections 3 and 4 of these rules relate to thelayout of the baseball diamond:
3. The bases must be four in number, placedat equal distances from each other, and se ...curely fastened upon the four corners of asquare, whose sides are respectively thirtyyards. They must be so constructed as to bedistinctly seen by the umpires and referee,and must cover a space equal to one squarefoot of surface; the first, second, and thirdbases sllall be canvas bags, painted white, andfilled with sand or saw... dust; the hom_e baseand pitcher's point to be each marked by a flatcirc.ular iron plate, painted or enameledwhite.
4. The base from which the ball is struck shallbe designated the home base, and must be dt ...rectly opposite to the secon.dbase; th.e firstbase must always be that upon the right hand,and the third base that upon the left handside of the striker, when occupying his posi ...tion at the home base.6
Rule 3, defining the size of the infield square, wascarefully constructed so as to avoid the use of theword "pace." According to Daniel Adams,Knickerbocker club member and 1857 president ofwhat would later be known as the National Associa ...
tion of Base Ball Players, this rule was rewritten tosimply clarify the distances on the ball field, the word"pace" being "rather vague."7
Adams' statement implies that the wording of thenew rule did not change the size of the infield. Thus,the "pace" was meant to be understood as a measure ...ment approximately equal to three feet. Yet, eventoday the meaning of the Knickerbocker "pace" is thesubject of debate. Some baseball scholars believe theword "pace" should be interpreted as an exact mea ...surement, which, during the 1840s, was defined as2... 1/2 feet. 8 Given a pace of 2... 1/2 feet and again em...ploying the Pythagorean theorem, each side of theinfield diamond would be roughly 74 ... 1/2 feet inlength. Other historians take the point of view that apace, being a unit of measurement defined solely bythe individual doing the pacing, allowed for a scalablediamond dependent on the size of the players. There ...fore, since a child's pace is smaller than that of anadult, the diamond as laid out by a child would beproportionally smaller than the adult's diamond. 9
Plate B
THE BASEBALL RESEARCH JOURNAL
Plate C
With the question of the true meaning of the pace yetunanswered, the exact size of the Knickerbocker in...field square remains uncertain.The first baseballannual, Beadle's Dime Base ...Bali Player, was publishedin 1860. In this guide, the rules regarding the baseballdiamond remained unchanged from those adopted atthe 1857 convention, but an accompanying diagramwas new. The first, second, and third bases are repre ...sented by asterisks (certainly not representative oftheir actual shape), and home base is represented bythe curious figure of an octagon inscribed within aslightly larger octagon (see plate B). Whereas homebase was clearly stipulated to be circular, early draw...ings of baseball games often showed home base ashaving a smaller circle inscribed upon the plate (seeplate C).
Following the official rules section of the 1860Beadle's guide is an explanatory section in which edi ...tor Henry Chadwick reviewed and elaborated uponsome of the rules of the game. With regard tohome base, Chadwick stated that it should be"not less than nine inches in diameter."loThough there are numerous drawings, there isonly one known photograph showing the circu ...lar home base (see plate D).
With regard to the first, second, and thirdbases, Chadwick stated that: "The proper size ofa base is about fourteen inches by seventeen; butas long as it covers one square foot of ground ...the requirements of the rules will be fulfilled."11Note that the official rule required the base to"cover," not necessarily "be," one square foot ofsurface. Thus, by Chadwick's interpretation ofthe rule, any base that covers an area greater
than or equal to 12 square inches is Ie ..gaL 12 Unfortunately, there are noknown photographs or drawings clearlyshowing the bases of the era to be rect ..angular. The drawings and photographsthat do exist show bases that appear tobe square, or quite close to square. 13
Nevertheless, the explanatory section inevery Beadle's guide up to and includingthat of 1871 states that the proper size ofa base was 14 by 17 inches.
The rules as published in the 1861Beadle's guide contained an addition tosection 4:
And in all match games, a line con...necting the home and first base andthe home and third base, shall bemarked by the use of chalk, or other
suitable material, so as to be distinctly seen bythe umpire. 14
The purpose of this rule was to aid the umpire indetermining whether a hit ball was fair or fouL 15
There were no further rule changes with ·regard tothe layout of the baseball diamond until 1868. How...ever, the 1867 Beadle's guide featured a departurefrom the old diagram of the baseball field to a moreaccurate representation of the infield. The bases areshown with their correct shapes, and, presumably, intheir correct positions on the infield square (see plateE). Though the rules still did not explicitly state howthe bases were to be oriented in the infield, the dia...gram implied that all four bases were to be centeredon their respective corners of the infield square andthat the first, second, and third bases were to be po...sitioned such that two corners of each base touchedthe base lines. In other words, the bases were rotated
----~0)..----~---

THE BASEBALL RESEARCH JOURNAL
Plate F
Plate G
an explanatory section elaborating upon the rules andplay of the game. In the explanatory section of the1869 DeWitt's guide, Chadwick stated that all fourbases "should be at least eighteen inches square, al ..though the rules prescribe that they shall cover onesquare foot of surface."18 Meanwhile, the explanatorysection in the 1869 Beadle's guide still stated that thebases should be "about fourteen inches by seventeen."Chadwick's contradictory statements as published inthe two guides were repeated for three years. In 1872,the discrepancy was resolved when both guides simplydropped the sections that included the suggested basesizes.
An additional change to the official rules of 1868occurred with the following amendment to section 4:"The base bag shall be considered the base, and notthe post to which it is, or should be, fastened."19 Nodoubt, the previous season (or seasons) saw occur..rences of bases becoming dislodged from their originalposition, leaving both runner and fielder dumb ..founded as to which one was the true base. The postwas a block of wood or stone, sunk into the infieldground and level with the 'playing surface, to whichthe bases were attached by stakes (see plate D).
Plate E
45 degreesfrom theirmore famil ..iar, modernorientation.This strangeorientationof the basesis clearlyseen in anumber ofdrawings ofball games ofthe era (seeplate F).
A majorchange inthe rules re ..garding thelayout of the
baseball diamond occurred for the 1868 season, thefirst such change since the Knickerbocker rules hadbeen written down more than 20 years before: Thewords "circular iron" were stricken from section 3 ofthe official rules. With this change, the rule regardingthe size of the other bases was applied to home base aswell: home base to "cover a space equal to one squarefoot of surface."16 The official rules as published inthe 1868 Beadle's guide noted this change in theshape of home base, but the same guide's infield dia..gram and explanatory section failed to reflect thischange. 17 By the following year these mistakes wererectified. Interestingly, while the official rules stillfailed to stipulate the exact positioning of the baseson the infield square, the 1869 Beadle's diagram im..plied that, unlike the first, second, and third bases,home base was to be oriented with its sides parallel to
the baselines (seeplate G).
For mostof its life,DeWitt'sBase BallGuide was,I ikeBeadle's,edited byHen r yChadwick.It, too,contained
----------...0~----

THE BASEBALL RESEARCH JOURNAL
The Openly Professional Era-With the exceptionof one minor alteration to the rules, the layout of theinfield diamond remained unchanged as the era ofopenly professional teams dawned. Starting with theseason of 1872, home base was no longer to be madeof iron, but of "white marble or stone, so fixed in theground as to be even with the surface."2o
Whereas diagrams of the baseball infield had longsince shown first, second, and third bases centered ontheir respective corners of the diamond, not until1874 did the rules officially require this placement.The exact positioning of home, first, and third (buttechnically not second) base was implied in a newfoul line rule (rule 5, section 8) stating:
The foul ball lines shall be unlimited inlength, and shall run from the center of thehome base through the center of the first andthe third base to the foul ball posts .... 21
A change in the exact positioning of home baseoccurred for the season of 1874. An addition to rule1, section 6, required home to be "with one corner ofit facing the pitcher's position."22 This orientationhad been implied in diagrams of the baseball infieldsince 1869. Furthermore, since 1869, Chadwick's ex~
planatory section of the Beadle's guide mentioned thisorientation of home base. 23 The reason behind theclarification of home base's orientation was simpleand well explained by Chadwick in the 1874 DeWitt'sguide:
The [home] base [is] to be fixed in the groundwith one corner pointing towards thepitcher's position, so as to insure the pitcher'shaving the full width of the home base topitch over, instead of the one foot of width hewould have were the base to be placed withthe square side facing him. 24
The rules for the season of 1875 further clarifiedthe position of home base. An addition to rule 1, sec~
tion 6, required that home base be positioned suchthat the corner that faces the pitcher "touch the foulball lines where they meet at the home base corner."25This amendment moved home base from a positioncentered on its corner of the infield diamond to a lo~
cation completely in foul territory. While the infielddiagram found in the 1875 Beadle's guide failed to re~
fleet this move of home base, the diagram in theDeWitt's guide of that year did show the change.
To understand the reason behind this rule change,it is necessary to review what was known as the "fair~
foul" hit. The fair~foulhit was a particular techniqueof hitting that took advantage of the fair and foul ballrules of the day. These rules, from "Rule V ~ The Bat..ting Department," were as follows:
11) If the ball from a fair stroke of the bat firsttouches the ground, the person of a player, orany other object, either in front of, or on, thefoul ball lines, it shall be considered fair.
12) If the ball from a fair stroke of the bat firsttouches the ground, the person of a player, orany other object behind the foul ball lines, itshall be declared foul; and the ball so hit shallbe called foul by the umpire even beforetouching the ground, if it be seen fallingfoul. 26
In summary, a ball that initially landed in fair ter~
ritory, regardless of whether it stayed in fair territoryor whether it passed first or third base in fair territory,was a fair ball. A fair~foul hit was one in which thebatter deftly hit the ball such that it first touched theground in fair territory and then bounded into foulterritory. Often the fielders would have to run a greatdistance into foul territory to retrieve such a hit ball.To shorten this distance, the first and third basemenwould play quite close to the foul lines, which subse~
quently opened up large gaps in the infield andallowed what would otherwise be easy ground ballouts to safely make it to the outfield as hits.
Henry Chadwick, among others, was eager to lessenthe impact of the fair~foul hit. To meet this end, heproposed adding a tenth man (or "right shortstop") toeach team so that the large gaps in the infield wouldbe narrowed. 27 Chadwick popularized this idea bywriting special sections in both the Beadle's andDeWitt's guides of 1874 suggesting the use of the 10..man rule. However, though the Beadle's guide of 1875as well as the DeWitt's guides from 1875 to 1882 con..tinued to have sections clearly implying that the10~man rule was the norm for organized baseball, the10~mangame was never adopted into the official rulesof the game.
The rule change for 1875 called for home base tomove from its former position, centered on its cornerof the diamond, back approximately 8~ 1/2 inches,such ·that it was located completely in foul territory.This change also moved the batter back a distanceinto foul territory and thus made it more difficult forhim to successfully make a fair~foul hit. 28 This change

THE BASEBALL RESEARCH JOURNAL
Plate H
in the batter's position did not solve the "problem" offair ... foul hitting; in 1877, the fair ... foul hit was elimi ...nated from the game altogether by changing thedefinition of a fair ball essentially to the modern rule.
The Emergence of the National League-For 1876,the inaugural season of the National League, the rulesof the. game calle.d for an infield diamond that had thefollo\ving characteristics: The four bases each covered12 iliC1H:~S square; lionie base was located In. foul tef...fiLory, irs frol1t COftlef Loucilitlg tIle j UIlctioIl of tIlefirst and third base lines; the first, second, and thirdbases were centered on their respective corners of theitlfield square, alld oriellled sucil tilat two corIlers ofeach base touched the base lines. The orientation ofLlie [il~l, SCCUlld, cHid liliid Lases, as well as lile exaclposition of the secono h8se, were still only implied bythe diagrams that supplemented the published rules.Furthermore, while the diHgr:=Jlll print'cd in the new1H'/6 Spalding\ ()Jlicial Base 13all (3uide correctlyshowed this layout of the infield, the diagram in the1876 Beadle's guide still failed to show home base infoul territory.
For the year of 1876 alone, the rules in bothBeadl.e's and DeWitt's guides, but n.ot those in theSpalding guide, allowed home hase to he composed ofwood. By the following year, however, none of the
guides mentioned a wooden home base.Two major changes in the infield diamond rules
were introduced for the season of 1877. The firstchange moved home base for the second time in threeyears. This time home base was to be positioned"wholly within the diamond. One corner of said baseshall face the pitcher's position, and two sides shallform part of the foullines."29 With this change, andafter two years of printing erroneous diagrams, the1877 Beadle's guide finally contained a diagram thatcorrectly reflected the state of the infield diamond,home base being shown completely in fair territory.
The second infield change for 1877 concerned thesize of the bases. "The first, second and third basesmust cover a space equal to fifteen inches square ...."30Home base remained a square foot in size.
Whereas the infield diagram in the 1877 Beadle'sguide still showed the first, second, and third basesrotated 45 degrees from their current orientation (seeplate H), the diagrams in the 1877 DeWitt's andSpalding guides no longer showed the bases in thisskewed orientation. Instead, they showed the basesides parallel to the base paths, as they are today.Nevertheless, the orientation of these bases was notexplicitly stated in the official rules at the time.31
The 1880s-Prior to the 1880 season, the officialrules of the game were completely rewritten, rear...ranged, and, in general, improved. Though much ofthe wording regarding the layout of the infield dia ...mond was altered, the state of the infield itselfremained unchanged. However, the positioning of thefirst, secolid, alid tliird bases w'as llladc cXl'l ici I byncvv vvording of thc rules: " ... the center of each [base]sllall be UfJUll a separaLe CUftler of tIle infield ....HJ2
No further changes were made to the rules regard ...ing the baseball diamond until 1885. For that season,it was no longer acceptable to havc homc base madeof Inarble. Home could now be composed only of"white rubber or white stone."33 The change wasluaJe to help prevent players fron.1 sllppitlg Otl theslick marble plate.34 The rules of the three~year oldAmerican Associntion departed from those of tl1e Nil""liollal League and called for white rubber lio111c bases0111y:
The only major differences between the infield dia...mond of 1885 and that of over a century later are tl1epositions of the first and third bases, and the shape ofthe home base (see plate .1). Whereas photographs ofthe square home base of the era are numerous, clearpictures of the first and third base bags centered onthe base paths are quite difficult to locate. This posi ...
-------,--'1.---c0r-----~

THE BASEBALL RESEARCH JOURNAL
Plate]
tioning of the bases is best seen in a photograph thatwas taken prior to the April 29, 1886, opening daygame at the Polo Grounds in New York City (seeplate K).
'llu;: vear It387 oruugllt ~bout: n single set of ruler,embraced by botll tIle National League and theAmerican .i\ssociation. The tvvo leagues cOlllproluised'vlitll regard Lu Lll~ luyUUl uf tIle il1ficld dlarnotld: tIleNational League adopted the American Associationrule requirillg Il01ue ba~e to be l11ade ord y of wl1iLcrubber. Furthermore, the rules for this season alteredthe positions of the bases:
The first, second and third bases must be ... soplaced LIlat the center of the seconC"1 hrlSP shallbe upon its corller of tIle itlfield, and the cen...leI uf lile first and rhird bases sllall be 011 tIlelilies rUIIIliIlg to and from second hr.1se an.dseven and one...half inches from the foul lines,providing that each base be entirely withinthe foul lines.35
Why change the positions of first and third hrJse?Prior to 1887, if a batted ball hit first or third base,the umpire was faced with a most difficult decision as
to whether the ball was fair or foul. A ball hitting thehalf of the base that was in fair territory was a fairball, while a ball hitting the other half of the base wasa foul ball. At times, deciding which half of the basehad been hit was practically impossible. Moving firstand third base completely into fair territory made thedecision academic: if the ball hit the base, it had to bea fair ball.
Note that according to the wording of the rule, thefirst and third bases were to be positioned such thatthey straddle the base lines to and from second base.However, the diagram that accompanied the rules inthe 1887 Spalding guide shows the bases positioned asthey are today, neatly nestled in their repective cor...ners of the 90 ... foot infield square (see Plate L).Interestingly, it was the diagram, not the wording ofthe rule, that prevailed. To this day, second base re ...mains "upon its corner of the infield," while the firstand third bases lie wholly within the diamond. Thisrather strange positioning of second base is oftenoverlooked in modern ... day representations of thebaseball diamond. Even the cover of The MacmillanBaseball Encyclopedia shows an infield diamond withsecond base erroneously placed wholly within theninety ... foot infield square. Modern day rules avoidany possible conflict between the written rule and thediagram by essentially stating that the diamondshould be laid out so that it looks like the diagram
Plate K
-~~~~0),-------

THE BASEBALL RESEARCH JOURNAL
CORRECT DIAGRAM OF A BALL aROUN~ I
ap.Z
A.A. A.-Ground reserved for Umpire, Batsman and Catcher.B. B. -Ground reserved for Captain and Assistant.C.-Players' Bench. D.-Visiting Players' Bat Hack.E.-Home Players' Bat Rack.
Plate L
The Modern Baseball Diamond-In 1894, a new,more mathematical and geometrical diagram of thebasebalLdiamond accompanied the Spalding guiderules.36 While the actual layout of the diamond didnot change, it was now more precisely defined withlabeled points and angles. Henry Chadwick thoughtthe new, complicated description of the infield a bitridiculous:
The diagram of the diamond needs a surveyorto lay it out so that it might be made compre..hensible to amateurs and novices in. the game.What with its "arcs" and its "radiuses"and itsalgebraic style ofdescription, it is likely to bea greek puzzle to foreign votaries of thegame.37
I pitched some 14 exceptional good games forCleveland last summer [2 .. 17, 5.86 in 1899]. Iam like a gnarled oak and am getting betterevery year. I may pitch in some smaller leaguethis year. [Charlie] Comiskey says he will give
As the turn of the century approached, the infielddiamond was basically identical to that of today withbut one notable exception: the shape of home base.This final significant change to the diamond rules wasimplemented for the 1900 season. Two triangular ar..eas were added to the front of the square home basesuch that the front was flO longer a point, but a 17 ..inch wide, flat side of the now familiar five ..sidedshape. The Spalding guide of 1900 explained the rea..son for the change:
With the plate placed in accordance with theform of the diamond field, that is, with itscorner facing the pitcher instead of one of itssides, a width of 17 inches was presented forthe· pitcher to throw the ball over instead of12 inches, the width of each side of the base.But this left the pitcher handicapped by hav..ing to "cut the corners" as it is called, besideswhich the umpire, in judging called balls andstrikes, found it difficult to judge the "cut thecorner" balls. To obviate this difficulty, theCommittee [of Rules], while keeping thesquare plate in its old place-touching thelines of the diamond on two of its sides-gaveit a new form in its fronting the pitcher, bymaking the front square with its width of 17inches, the same as from corner to corner,from foul line to foul line. The change madeis undoubtedly an advantage alike to thepitcher and umpire, as it enables the pitcherto see the width of base he has to throw theball over better than before, and the umpirecan judge called balls and strikes with less dif..ficulty.38
The invention of the five ..sided home base wasclaimed by National League pitcher Crazy Schmit. Ina letter he sent to The Sporting News, Schmit statesthat he suggested the five ..sided home base to JamesHart (chairman of the Baseball Rules Committee)two years earlier. After briefly mentioning his inven..tion, Schmit goes on at length to detail his career ina style uncannily reminiscent of Jack Keefe, the"busher" pitcher made famous in Ring Lardner's storyYou Know Me, AI. Recounting the. previous season,Schmit writes:
.~tJAb•
-. ~ .,- ./V··
supplied.
-------------------~~r----------------=--------
THE BASEBALL RESEARCH JOURNAL
me a chance when things are settled. I hadeverything arranged to play for [J ohn]McGraw, but if he goes to St. Louis it is alloff.30
The majority of Schmit's letter is spent listing ex..cuses for many of his 17 losses with the dismal 1899Spiders. Unfortunately for Schmit, McGraw did go toSt. Louis, and Crazy pitched in only four more majorleague games, winning none and losing two. Schmit(apparently sensitive of his "Crazy" monicker) endedhis letter as follows: "I hope you will not add anynicknames to my name. I remain your humble reader.Frederick Schmit." Whether or not the idea for thefive ..sided home plate really came from Schmit re ..mains unclear. The fact that he has one of the worstwinning percentages (7 ..36, .163) in baseball historydoes not.40
Former baseball commissioner Ford Frick wrote:
...The establishment of the 90..foot distancebetween bases must be recognized as thegreatest contribution to perfect competitionany game has ever known. It is that specifica..tion on which our hitting and fielding recordsare based; that unchanging measurement ofsuccess or failure that has set the guidelinesfor heroes; the great reason why baseball,through the years, has qualified as the mostmathematically perfect game ever devised byhumankind.41
Like Red Smith, Frick describes the baseball dia ..mond as being "perfect." It is the awkward.. lookinghome plate, the strange positioning of the secondbase, and the first and third bases nestled snugly intheir corners of this 90..foot square that we embrace asperfection.
CHRONOLOGY OF BASEBALL DIAMOND RULE CHANGES
1845 First written rules of baseball set down by the Knickerbocker Base Ball
Club of New York City.
Distance across infield diamond (home to second and first to third) is set
at forty ... two paces.
1857 New set of rules adopted at first convention of baseball players.
The sides of the infield square are thirty yards.
First, second, and third bases must each cover a square foot in area and are
canvas bags filled with sawdust or sand.
Home base is circular and made of iron.
1860 In Beadle's guide explanatory section, Henry Chadwick suggests that first,
second, and third bases be fourteen by seventeen inches and that home
base be at least nine inches in diameter.
1861 Rule requires that chalk lines be drawn between home and first and home
and third.
1867 Beadle's guide publishes first truly representational diagram of baseball dia ...
mond.
1868 Home base changed from a circle to a square.
Size of home base same as that of first, second, and third bases.
Clarification in the rules states that the base bag, not the post to which the
bag should be attached, is to be considered the base. This rule dropped in
1876 according to Spalding guide; 1877 according to Beadle's and DeWitt's
guides.
1869 In DeWitt's guide explanatory section, Henry Chadwick suggests first, sec ...
ond, and third bases be eighteen inches square.
1872 Beadle's and DeWitt's guides no longer contain explanatory sections. Dis ...
crepancy between suggested sizes of first, second, and third bases (fourteen
by seventeen inches versus eighteen inches square) is thus removed.
Home base required to be made of white marble or stone.
1874 Foul line rule implies home, first, and third bases are centered on foul lines.
1875 Home base required to have one point facing pitcher and is positioned
wholly in foul territory.
1876 Beadle's and DeWitt's guides allow wooden home base; Spalding guide does
not.
1877 Home base moved wholly into fair territory.
First, second, and third bases are to cover fifteen inches square. Home base
still to cover twelve inches square.
Fair... foul hit removed from the game, as definition of fair and foul balls are
changed.
Spalding and DeWitt's guide diagrams show bases with sides parallel to base
paths. Beadle's guide will continue to show first, second, and third bases ro ...
tated 45 degrees from their modern orientation through 1881, the final
year of its publication.
Beadle's and DeWitt's guides no longer allow wooden home base.
1885 National League home base made of white rubber or stone. American As ...
sociation home base made only of white rubber.
1887 National League and American Association adopt same set of rules.
Home base made only of white rubber.
First and third bases moved into fair territory.
1894 New geometric diagram of baseball diamond adopted.
1900 Home base changed to five ... sided shape.
Acknowledgements
Thanks go to Tom Heitz, Liane Hirabayashi, Fred Ivor... CampbeU, Larry Webster,
and the library staffs of both the National Baseball Library in Cooperstown, New
York, and the paul Ziffren Sports Resource Center at the Amateur Athletic Foun...
dation of Los Angeles.
1 Kevin Nelson, Baseball's Greatest Quotes (New York: Simon and Schuster, 1982),
183.
2 For example, the distance between first and second base on the modern infield
diamond is, at its shortest, 88 feet 1.5 inches.
3 Harold Seymour, Baseball: The Early Years, vol. 1 of Baseball (New York: Oxford

THE BASEBALL RESEARCH JOURNAL
University Press, 1960~1990), 15~18.
4John Thorn, "The True Father of Baseball," chap. 1 in Total Baseball (New York:
HarperCollins Publishers, HarperPerennial, 1993), 6.
5Frederick Ivor~Campbell argued in favor of this scalable pace in his research pre~
sentation "Why Forty~Two Paces?" at the 23rd SABR National Convention, June
26, 1993. Ivor~Campbell also noted that deliberate pacing for an adult male can
reasonably yield a three~foot pace and, thus, an infield square with sides ninety feet
in length.
6A similar diagram and set of rules were published in The Spirit of the Times, 12
May 1855.
7The initial convention was held January 22, 1857, but the rules were officially
accepted at a later meeting, held on February 25, 1857. Not until the convention
of the following year, held March 10, 1858, did the organization name itself the
"National Association of Base Ball Players."
8Ibid., 6.
9Frederick Ivor~Campbell argued in favor of this scalable pace in his research pre~
sentation, "Why Forty~Two Paces?" at the 23rd SABR National Convention, June
26, 1993. Ivor~Campbell also noted that deliberate pacing for an adult male can
reasonably yield a three~foot pace and, thus, an infield square with sides ninety feet
in length.
IOHenry Chadwick, ed., Beadle's Dime Base~Ball Player, (New York: Irwin P. Beadle
& Co., 1860), 18.
11 Ibid.
12 According to an article in The New York Clipper, 20 May 1865, bases a cubic foot
in size were used in Philadelphia in 1860. However, it is unclear that the game in
which these bases were used was what one would refer to as baseball. Certainly the
use of such bases was not the norm for the era.
13 One of the earliest patents of a baseball base is U.S. Patent No. 75,076. The
device is a base that is attached to a stake by means of a swiveling cap. The dia~
gram accompanying the description of the patent shows the canvas base to be
circular, though it is clearly not intended for use as a home base. It is unknown
whether the device was ever manufactured.
14 Henry Chadwick, Beadle's Dime Base~Ball Player, (New York: Beadle & Co.,
1861 L 12"
1J According to the 1861 Beadle's guide, some clubs had adopted this rule during
the season of 1860.
16 Henry Chadwick, cd., Beadle)s Dime 13ase~I3all Placyer, (New Yurk: BeaJle & Co.,
1868), 17.
17 Curiously, The New York Clipper, 21 December 1867 and 28 December 1867,
fuileJ Lu llluke noLe uf Lhe chunge of home from a circle to a square in. articles
detailing the rule changes for the upcoming 1868 season.
18 Henry Chadwick, ed., The Base,Ball Guide for 1869, (New York: Robert tv1.
DeWitt, 1869),30.
19 Henry Chadwick, ed., Beadle's Dime Base~Ball Player, (New York: Beadle & Co.,
1868), 17. In Appendix 4·, "Rules and Scoring" of Total Baseball, (New
York:HarperCollins Publishers, HarperPerennial, 1993), Dennis Bingham and Tom
Heitz state that this rule was dropped in 1876. While the 1876 Spalding guide no
longer includes this rule, both the Beadle's and DeWitt's guides of that year do. All
three guides omit the rule for 1877.
20 Henry Chadwick, The Base~Bali Guide for 1A72, (New York: Robert M. DeWitt,
1872),111.
21 Henry Chadwick, ed., Beadle's Dime Base~Ball Player, (New York: Beadle &
Adams, 1874),76.
22 Henry Chadwick, DeWitt's Base~Ball Guide for 1874, (New York: Robert M.
DeWitt, 1874),76.
23 Henry Chadwick, ed., Beadle's Dime Base~Ball Player, (New York: Beadle & Co.,
1869),14.
24 Ibid.
25 Henry Chadwick, DeWitt's Base~Ball Guide for 1875, (New York: Robert M.
DeWitt, 1875),74.
26Jbid., 83.
26 John Thorn, telephone conversation with author, 11 June 1993.
27The idea of a ten~man game was not new. Not uncommonly, box scores of base;
ball games from the 1860s showed ten men per team, the extra man noted as
playing "RS" or right shortstop.
28While the batter's box moved back 8~1/2 inches with the move of home base, the
same season of 1875 called for a change in the lines of the batter's box that re~
suIted in the batter being moved an extra foot away from fair territory.
29Henry Chadwick, DeWitt's Base~Ball Guide for 1877, (New York: Robert M.
DeWitt, 1877),64.
30Ibid.
31 From 1867 to 1881, the final year of its publication, the Beadle's guide diagram
the baseball infield showed the first, second, and third bases to be rotated 45
degrees from their modern orientation.
32 Spalding's Base Ball Guide for 1880, (Chicago: A.G. Spalding & Bros., 1880),59.
33 Spaldin,g's Base Ball Guide for 1885, (New York: A.G. Spalding & Bros., 1885),
108.
34 The Sporting Life, 26 November 1884, p. 3.
35 Spalding's Base Ball Guide for 1887, (Chicago: A.G. Spalding & Bros., 1887), 107.
36 By this time both the Beadle's and DeWitt's guides were no longer published.
Beadle's last year of publication was 1881, while DeWitt's was 1885.
37 Henry Chadwick, ed., Spalding's Base Ball Guide for 1894, (New York: American
Sports Publishing Company, 1894), 152.
38 Henry Chadwick, ed., Spalding's Official Base Ball Guide, (New York: American
Sports Publishing Company, 1900),201.
39 "The Nevv Home Plate," The Sporting News, 24 ~1arch 1900.
4°Jack Wadsworth has the worst won~loss percentage for <=l pitc.her with at least five
victories: 6~38, .136. However, as of the end of the 1993 season, Anthony Young's
record stood at 5~.31, .141.
41 Ford Frick, Games, Asterisks, and People: Memoirs of a Lucky Fan, (New York:
Crown Publishers, Inc., 1973),9. Note that, like Red Smith, Frick erroneously
sLaLes Lite JisLanc.e between bases to be ninety feet.
PLATES
A Early Baseball Diarnuru! Diagram, The New York Clip--per, 13 December 1856.
B "Diagram of a Base Ball Field." Henry Chadwick, ed.,Beadle's Dime Base--Ball Player, (New York: Beadle & Co., 1862).
C Brooklyn Atlantics versus Philadelphia Athletics, 22 Octo...ber 1866. John Thorn and Mark Rucker, The National Pastime 3,no. 1 (Spring 1984),24.

THE BASEBALL RESEARCH JOURNAL
D Rockingham Nine, Portsmouth, New Hampshire, 1865.John Thorn and Mark Rucker, The National Pastime 3, no. 1(Spring 1984),8.
E Beadle's Diagram for 1867. Henry Chadwick, ed.,Beadle's Dime Base..Ball Player, (New York: Beadle & Co., 1867).
F Brooklyn Atlantics versus Philadelphia Athletics, 7 Septem...ber 1868. The New York Clipper, 12 September 1868.
G Beadle's Diagram for 1869. Henry Chadwick, ed.,Beadle's Dime Base..Ball Player, (New York: Beadle & Co., 1869).
H "Diagram of the Diamond Field." Henry Chadwick, ed.,
Beadle's Dime Base .. Ball Player, (New York: Beadle & Adams,1877) .
J "Diagram of a Ball Ground." A.G. Spalding and LewisMeacham, eds., Spalding's Official Base Ball Guide for 1878,(Chicago: A.G. Spalding & Bro., 1878),3.
K Boston Beaneaters versus New York Giants, 29 April1886. John Thorn and Mark Rucker, The National Pastime 3, no.1 (Spring 1984),50.
L "Correct Diagram of a Ball Ground." Spalding's BaseBall Guide for 1887, (Chicago: A.G. Spalding & Bros., 1887),4.
Baseball's best benchWhile doing a random stroll through The Sports Encyclopedia: Baseball, I came upon the astounding accomplish~
ments of the 1921 Cleveland Indians' bench players. Although the Tribe finished 4~1 /2 games behind the .Yankees thatyear., it q,vas not for the lack of a good supporting cast.
Twelve players were listed helnqJ) the starting eight for Manager Tris Speaher, half of who"" llfld 131 0'1' Ulore at bats.The six whn ditln't p1.ny '11l'll,Jt inclttded fouf catchers who had 22 hits in 75 at bllL~ ( .293).
The six others reprp.sent the finest collection of subs any manager ever had. Tioga Gen.,.g~Burns t!Jas the first guy offthe bench, hitting .361 and sluggin,g .480 (ttJithout an homers). He backed up Dor Jnhn~to11 at first base.
lack. Gran.ey ttJas in his penultimate season, and like Tioga, he hit his career high ( .299) . Joe Wood was the numberone outfield reserve, also in his next~to~last season in the bi~s. Wood proved what a remarkable athlete he ttJas by hav...in,g jtV£? fine years as an outfielder after his IIall ...uf...Fame calibe1~ pitching career was brought to an abrupt end becauseof arm miseries. Smoky Joe also managed his career high in 1921 (.366 and .562). His four homeruns were one morethan Spea,ker h.it in 312 more at bats.
Riggs Stephenson was Billy WTantbsganns'backup at second base. Riggs must have been no fun to have in the lockerroom, because T ran,'t think of an)' other reason why his.330 batting average as a secund and third baseman earned himonly a ticket to the minors. Was Wamby's triple play all that im,portant, to cancel out his .250 average? Also, Riggsiewas in his rookie year, barely out of the University of Alabama.
Joe Evans was the final m.ember of the]. V. outfield. He hit .333, givin~ the second...string garden a clean sweep in th.ebatting race ahead of the starting outfield of Elmer Smith, Charlie Jamieson, and Tristram E.
The final member of the big six bench was Les Nunamaker. He hit .359, another career high. And combined withstartet' Steve O'Neill's .322 this represented one of the top backstop platoons in history. Jnciden.tally, two of the bit...playingbench men tvcrcpre.tty fine catclters; Art 'V(/il.~()'Yl, at th.e end of his career; and Luke Sewell, at the beginning of his I Phu.:h'I"homas was a decent third receiver, too.
The Tribe's bench average that year was .341 (compared to the Varsity's .299). I doubt there ever was a better bench.-Cappy Gagnon

The Gowell Claset Saga:2--0, 9.53
"One of these things just doesn't belong here ..
Jamie Selko
"
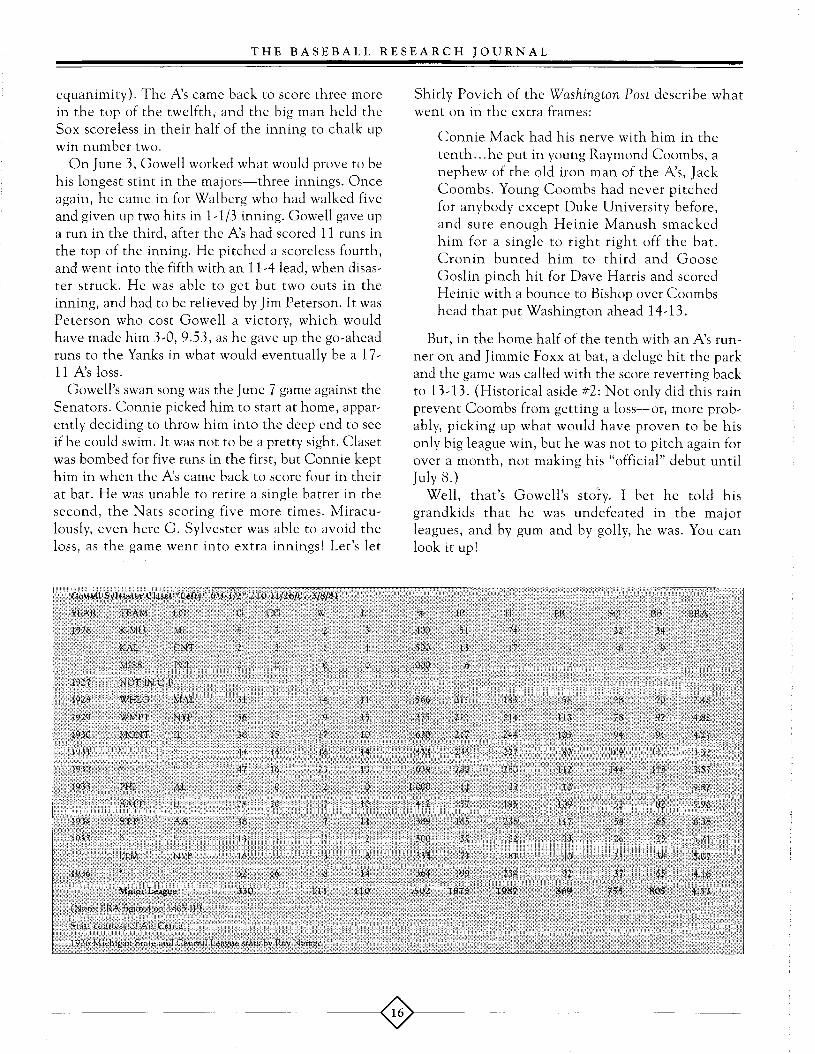
Sometimes, when you're cruising through the BigMac, something just kinda catches your eye. You do adoubletake to see if your eyes have deceived you, and10! you've stumbled onto a gem. If you're like me,sometimes the gem is Nyls Nyman's first year, orJohnny Tsitouris, 1962-but much more often it's aone ... liner, and usually one with a bit of a tarnish.Gowell Claset's line is the one that probably made agreater impression on me than any other. For years, Itried to get a handle on the incongruity inherent inhis winning percentage as opposed to his ERA. Fi ...nally, unable to reconcile the two disparate figures, Idid what should have been done long ago-I lookedit up.
Gowell Sylvester "Lefty" Claset, pride of BattleCreek, made the Connie Mack N.s at the start of theirfinal tumble from the top, 1933. Many of the stars ofthe 1929~'30... '31 machine were gone, others were ag...ing fast, especially the pitchers, with only Grove bothstill there and still in form. Gowell was huge for thetinle, a strappillg 6'3", 210 pOUl1d brotll of a lad of 25.Apparently, sports writers had trouble with his firstname, it being two syllables and all, for he was re ...ferred to as Dowell, Cowell al,d Gowell durilig liisbrief sojourn in the bigs. His last name also gave themproblems, sometimes.being rendered Closet.
He made his first appearance early on in the season,April 12 to be exact, coming in in relief of TonyFrietCls, who had heen pinc:h ...hit for hy PClrke
Jamie Selko lives in Eugen, Oregon.
Coleman in the seventh with the A's trailing theSenators 2~1. He pitched the eighth and gave upthree hits and a walk. The N.s were down 4~1 when heexited. Gowell then didn't get called on to pitch un~
til April 22, when he again came in in a game startedby Frietas. Tony had been manhandled by the Yan~
kees, and this time Gowell followed Roy Mahaffey.The Athletics were behind 8~7 when he came in inthe eighth, which he got through unscathed. In theninth, though, he tired, allowing the Yanks to score arun in the 1/3 inning he pitched. His totals for thegame included three hits and two walks.
Following this outing, he did not pitch again for amonth, until May 22. By this time, the A's had suf~
fered eight rainouts and two "coldouts". The restseemed to have done him good, however, as he re~
lieved Frietas (again) in a game against the Brownswith the score tied 4~4 in the sixth. He pitched aninning without allowing a runner. Grove came in topitch the seventh, eighth, and ninth, eventually pick~
il1g up credit for a 6 ...5 Atilletics Will. (Historic asideNo.1: this was the period during which Connie Mackhad decided to use Lefty as a relief pitcher. This wasth.e Sec.olid of five gall''U:=s irl a row ill wllicll llc w'as Lo
pitch, and in which he picked up three wins and twosaves. He was then rested during a blowout, picked upa save, sat out another blowout, and finally came in ina double header to record a win and a save. So, hepitc:herl in eight Ollt of 10 gClmes, gClrn~ring four win.sand four saves before Mr. Mack returned him to thestarting rotation.)

THE BASEBALL RESEARCH OURN AL
relieved Rube Walberg whohad given up13 hits in 7.. 1/3innings, enter..ing the gamewith the A's onthe short endof a 7..5 score.He worked atough 2/3 in ..ning, allowingbut one hit, histhird consecu..tive scorelessouting, cover..ing a total offour innings.On the 30th,Gowell workedhis fourthgame in ninedays, comingin in relief ofLefty who hadpitched ascoreless ninthand tenthagainst theWhite Sox,and had leftwith the scoretied 6..6. In thetop of the elev..enth, the A'sscored two, butin the bottomof the inning,Gowell gaveup two, blow..ing whatwould havebeen a win for
...J Grove (which~ I'm sure Lefty
handled with
u'-'~· ... '-' .... ""-'uu outing of his majorgave up no hits, walked three and
........... ".'-J''L-t.'-. along with win number one.had to pitch an inning for the
inning, Shibe Park was hit bywhich resulted in the game
out
Gowell Claset
Two days later,the fire again. '--"'-J'JL .............. .L~
fourth and the r-o..rrY'l"l7"-"'C'
of the fourth. Whendid it in earnest, L'F'F'..... '"Y'./V
4 and making itthe Browns scoreless inthe seventh with two
THE BASEBALL RESEARCH JOURNAL
equanimity). The A's came back to score three morein the top of the twelfth, and the big man held theSox scoreless in their half of the inning to chalk upwin number two.
On JUll.e 3, Gowell worked what would prove to behis longest stint in the majors-three innings. Onceagain, he came in for Walberg who had walked fiveand given up two hits in 1,.1/3 inning. Gowell gave upa run in the third, after the A's had scored 11 runs inthe top of the inning. He pitched a scoreless fourth,and went into the fifth with an 11,.4 lead, when disas,.ter struck. He was able to get but two outs in theinning, and had to be relieved by Jim Peterson. It wasPeterson who cost Gowell a victory, which wouldhave made him 3,.0,9.53, as he gave up the go,.aheadruns to the Yanks in what would eventually be a 17,.11 A's loss.
Gowell's swan song was the June 7 game against theSenators. Connie picked him to start at home, appar,.ently deciding to throw him into the deep end to seeif he could swim. It was not to be a pretty sight. Clasetwas bombed for five runs in the first, but Connie kepthim in when the A's came back to score four in theirat bat. He was unable to retire a single batter in thesecond, the Nats scoring five more times. Miracu,.lously, even here G. Sylvester was able to avoid theloss, as the game went into extra innings! Let's let
Shirly Povich of the Washington Post describe whatwent on in the extra frames:
Connie Mack had his nerve with him in thetenth ...he put in young Raymond Coombs, anephew of the old iron man of the A's, JackCoombs. Young Coombs had never pitchedfor anybody except Duke University before,and sure enough Heinie Manush smackedhim for a single to right right off the bat.Cronin bunted him to third and GooseGoslin pinch hit for Dave Harris and scoredHeinie with a bounce to Bishop over Coombshead that put Washington ahead 14,.13.
But, in the home half of the tenth with an Ns run,.ner on and Jimmie Foxx at bat, a deluge hit the parkand the game was called with the score reverting backto 13,.13. (Historical aside #2: Not only did this rainprevent Coombs from getting a loss-or, more prob,.ably, picking up what would have proven to be hisonly big league win, but he was not to pitch again forover a month, not making his "official" debut untilJuly 8.)
Well, that's Gowell's story. I bet he told hisgrandkids that he was undefeated in the majorleagues, and by gum and by golly, he was. You canlook it up!
------------------~~)--------------------

Teammates With the Numbers
Group firepower
"Biff" Brecher and Albey M. Reiner
Sam Rice and]oe Judge: the chanlps.
DiSCerning students of the game know that,though baseball emphasizes individual skills, thegreatest pleasure comes from the meshing of those in...dividual components into a great team. When wedefine a great baseball player, we ask two questions:first: did he perform at a very high level consistentlyover many years? and, second, did his teams. win?There were some real greats who spent whole careersin or near thebasemel1tRalph Kiner,winning onehomerunchampionshipafter another(...)n the pa..tlletic F'iratesof the late'4·05; the in·comparableErnie Banksall tIle dreary(-~ubs for overtwo decades.But, in theel'ld, the ob ...jective ofbaseball is not to put up big numbers, but to win. It is
ttBiff" Brecher and Albey M. Reiner are Brooklyn Dodger fans who havenot yet recovered from the blow.
no coincidence that most Hall of Famers were sur...rounded by other excellent players. That's why theywon. Ruth and Gehrig, Aaron and Mathews, Maysand McCovey, the names come sliding off the tonguetogether naturally for every baseball fan.
Most fans have a special affection for gifted team ...mates who play together well year after year, maturingand growing old gracefully together. We think of the
Dodger in ...field of tl1~
, 70s -Garvey,Lopes,Russell, andCey; of t.heTig~r5'
WhitakerandTrammell; ofYount,Molitor, rlndGantner inMilwalJkee.
.-J YOUllt,
~ Molitor andGantner set acareer record
which will almost certainly never be broken. Theyamassed more h-its as teaulluates than any other threelil.erl i11 Iilstot'y. FruIn 1978, tIle first year all threeplayed together, through 1992, they garnered a total

THE BASEBALL RESEARCH JOURNAL
of 6,381 hits-2,455 for Yount, 2,261 for Molitor, and1,665 for Gantner. In the process, they passed the hittotal of the Pirates trio consisting of the Waner broth,ers and Pie Traynor-5,748. Yount and Molitor arealso high on the list of all, time duos, at number 4.Only the Waner brothers, Clemente and Mazeroskiand the old Senator duo of Sam Rice and Joe Judgeare ahead of them.
One group of teammates stands out from the rest onthe historic team hit parade-the Boys of Summer,perhaps the most beloved team in history, was alsoclearly the best hitting team of all time. The greatBrooklyn Dodgers of the late '40s and early '50s hadsix stars who stayed together for nine years, putting upreally big numbers every year. By the time they werethrough, they had banged out 8,305 hits. No team hasever exhibited such longevity and consistency. Theyare way ahead of their nearest rivals, the Yankees'Murderers' Row.
The following Tables list significant teammate hitcombos over the years. Table 1 contains the names ofduos from the modern era who have amassed 4,000 ormore career hits while playing for the same team.Table 2 shows trios who have collected at least 5,000
hits. Table 3 shows larger groupings with over 6,000hits. Table 4 presents a few combinations that did notquite make it. We have arbitrarily decreed that aplayer must participate in at least ten games for a sea,son to count toward the record. While we arereasonably sure we have collected all the relevantduos, we suspect that there are a significant numberof larger groups that could be added. We invite thereaders to suggest additional names.
While compiling this information, we were struckby several interesting points. First, it rarely helps toadd more players to the list. As you do so, you invari,ably shrink the number of years in which the playersplayed concurrently. Second, despite the feared slug,gers who have graced their roster over the years, noYankees are on the duo list, although the Murderers'Row line,up is on the list for trios and multiple play,ers. Ruth and Gehrig fell 226 hits shy of the 4,000,hitmark. Third, note that another recent superstar,George Brett, made the duo list with three differentteammates-Frank White, Willie Wilson, and HalMcRae. That group is also Number 5 on the all, timemultiple player list. Fourth, the all,time leading duo,Sam Rice and Joe Judge, was quite a surprise.

Disenfranchised All--Stars of 1945
Hard luck in career years
Charlie Bevis
Goody Rosen was having a career year at mid-season 1945, batting .363 as the center fielder for theBrooklyn Dodgers, third best in the National League.So was Washington knuckleball pitcher Roger Wolff,having compiled a 9...5 record at the 1945 AII ... Starbreak for the second...place Senators.
Both Rosen and Wolff could have expected to benamed to their respective league's AII ...Star squads for1945. Neither was. They weren't snubbed by themanagers charged with the team selections nor werethey injured or unable to play. There were no manag...ers or players in the 1945 AII ... Star Game-it wascanceled!
Since its beginning in 1933, the AII ...Star Game hassurvived adverse weather conditions (1952, 1961 &1969) and a player strike (1981), but in 1945 itcouldn't overcome federal government travel restric ...tions imposed by the Office of DefenseTransportation.
Instead of a July 10 AII ...Star Game at Boston'sFenway Park, seven exhibition games were playedaround the country on July 9 and 10. There were fiveintra ... city games between competing AmericanLeague and National League teams-highlighted bythe Yankees ...Giants contest at the Polo Groundsone intra ... state game between the Reds and theIndians, and one inter... sectional game.
Charlie Bevis is the son of the shortstop on the 1932 semi...pro Bevis familybaseball. team,) s'ubjecl of hi~ July 1994 piece in Yankee magazine. He haswritten a number of articles on baseball history and is currently writing abiography of Mickey Cochrane.
The ODT had refused to grant the Tigers permis ...sion to detour 62 miles to Pittsburgh to play thePirates, so these two teams didn't participate in theexhibition series. But the ODT did allow the Dodgersto take a circuitous route from Brooklyn to Cincin...nati by way of the nation's capital so that they couldplay the Senators on July 10.
It was this July 10 game that Rosen and Wolff hadto settle for in lieu of a July 10 AII ...Star appearance,as the Senators defeated the Dodgers 4...3. Rosen wentofor 3 while Wolff pitched effectively in three in ...nings of relief.
Although there were no official AII ... Star squadschosen in 1945, The Sporting News and the Associ ...ated Press each published its own selections forhypothetical National and American League AII ...Starsquads in early July. These selections are listed in theaccompanying tables.
The 1945 non...AII ...Star Game has spawned an un...usual category of players who should have beenselected to represellt tlleir leagues in the annual ex ...hibition classic but never got another opportunity toparticipate in any AII ...Star Game.
Of the 63 players selected for the two hypotheticalAII ...Star squads, 27 would have been first ... time All ...Stars. Just nine of these received another shot at theAII ...Star Game. Thus 18 1945 players are Disenfran...chised AII ...Stars, having been selected to one or bothof the hypothetical teams but never again being se ...lected for th.e ll1id",sullllller classic.

THE BASEBALL RESEARCH JOURNAL
CatchersAmong the complete unanimity in the choices for
catchers in each league were two players shown incapitalized letters in Table 1 who would have beenfirst,time AII,Stars, Mike Tresh and Ken O'Dea.
Tresh of the White Sox probably would havestarted the AII,Star Game for the American League,based on his first half performance in comparison tolong,time veterans Rick Ferrell and Frankie Hayes. Inhis seventh season with Chicago, Tresh was hitting.253 with his usual compliment of 0 home runs. Treshwas best known for hitting only two career homeruns, 787 games and 2,568 at bats apart, in 1940 and1948-and for fathering son Tom, who went on toplay with pennant,winning Yankee teams in the1960s.
O'Dea, a backup on the St. Louis Cardinal pennantwinners of 1942,44, finally got his starting shot in1945, when Walker Cooper went into the Navy onMay 1. O'Dea made AII,Star status on a three,catchersquad behind Phil Masi of the Boston Braves, whowas hitting .335 at midseason, and veteran ErnieLombardi. By year,end, though, O'Dea would be shar,ing duties with rookie Del Rice, while another rookie,Joe Garagiola, took over for the pennant,winning1946 Cardinals as O'Dea was traded to the Braves toback up Masi.
InfieldersThe five players for whom this would have been the
only All,Star selection are highlighted in Table 2. Inthe National League, Marty Marion was such a domi,nant shortstop that one hypothetical team had threethird basemen rather than selecting a backup short,stop.
Dodger youngster Eddie Basinski, 22, was an inter,esting choice for backup shortstop on the other list.Basinski, a violinist in the off,season with the BuffaloPhilharmonic Orchestra, was signed by the Dodgersout of the University of Buffalo after a tryout aI,though he hadn't played baseball in either highschool or college. Pee Wee Reese returned to playshortstop in 1946 for the Dodgers and "Fiddler"Basinski played just 56 more major league gamesthereafter.
Nick Etten of the Yankees was having a great sea,son in 1945, taking a shot at the Triple Crown. Ettenled the American League with 111 RBIs, was secondin homeruns with 18, and finished with a .285 battingaverage, not far behind Snuffy Stirnweiss' .309league, leading mark. At 31, Etten would play onlyone more season with the Yankees, and he would miss
the pennant winning years to come.At least second baseman Eddie Mayo had the satis,
faction of playing in a World Series, as the Tigers wonthe American League pennant in 1945 and went onto defeat the Cubs in seven games. Mayo's play duringthe season earned him runner,up status for MVP, be,hind ·teammate Hal Newhouser.
There was a split decision for backup third basemanbehind 38,year,old White Sox sensation TonyCuccinello, leading the American League in battingat midseason with a .328 average. Mark Christman ofthe Browns would play four more years after the war.Oscar Grimes of the Yankees, like Etten, had only onemore full season.
Christman could be a controversial choice on theTSN squad as he had played less than halfof the firsthalf of the season. However, with Browns managerLuke Sewell as the would,be A.L. manager of the1945 AII,Star team on the heels of the Browns' 1944pennant, Christman very well could have been cho,sen as back,up third baseman based on his previousyear's performance.
OutfieldersRosen, one of the four outfielders highlighted in
Table 3 who were denied their one shot at AII,Starselection, was in what was to be the best season of hiscareer. After his great first half, Rosen did not fade inthe second half. He finished third in the NationalLeague at .325, behind Cavaretta at .355 and Holmesat .352. Rosen was traded to crosstown rival the NewYork Giants early in the 1946 season, his finale, asPete Reiser returned to patrol center at Ebbets Field.
Cardinal Buster Adams also had a career year in1945, finishing third in home runs with 22, fifth inRBs with 109, and second in total bases with 279.When the St. Louis regulars returned the next year,Adams became the Cardinals ace pinch hitter on the1946 pennant winner.
Thirty,year,old rookie Vance Dinges of the Phila,delphia Blue Jays, a.k.a. Phillies, also had a great firsthalf, hitting at a .328 clip for the last,place NationalLeague entry. However, Dinges had a not,so,greatsecond half, and finished with a .287 batting average.He'd only play one more major league season after1945.
In the American League, the Philadelphia A'sBobby Estalella was having a great season as well,which would be his last as a regular. Estalella, one ofthe first Cuban born major leaguers, batted .299 tofinish fourth in the American League batting race.

THE BASEBALL RESEARCH JOURNAL
PitchersWolff was one of the seven pitchers noted in Table
4 who missed their only shot at AII~Star status in1945. The 34~year~oldknuckleballer finished the sea~
son with a 20~10 record and 2.12 earned run average,third best in the American League. Wolff pitched justtwo more seasons in the majors.
Cleveland's Steve Gromek had a 19~9 record atyear~end, third best winning percentage in theAmerican League. As one of the younger 1945 AII~
Stars at 25, Gromek went on to play 12 more years inthe majors.
Russ Christopher of the A's did not have a goodsecond half. After an outstanding first half record of11 ~5, he finished with a disappointing 13~13 mark forConnie Mack's 1945 entry. Christopher became thetop reliever for the 1948 World Champion ClevelandIndians.
Red Barrett of the Cardinals experienced the mostwins among the four National League pitchers, top~
ping the circuit with 23 victories, easily the bestseason of his career. Barrett finished third in the 1945National League MVP voting.
Hank Wyse was right behind Barrett with 22 wins,and finished fifth in Earned Run Average, to lead theCubs to the National League pennant. Young HalGregg of the Dodgers and Blix Donnelly of the Car~
dinals both had .500 second halves following their
promising first half performances. Gregg would finishwith 139 strikeouts, second best in the NationalLeague.
Many of the Disenfranchised 1945 AII~Stars hadthe best season of their major league career. After get~
ting their chance to excel, most of them took a backseat when veterans returned from the service.
Illustrating this point are the four members of theDisenfranchised 1945 AII~Stars who played with theSt. Louis Cardinals, the sandwich season betweenCardinal pennant~winningyears of 1944 and 1946.O'Dea, Donnelly, Barrett and Adams were key mem~bers of the 1945 club. But just Barrett and Adamswere with the 1946 pennant winners at season'send-Barrett as a reliever and spot starter, and Adamsmainly as a pinch hitter. Neither saw action in theseven~gameWorld Series that year.
Quality of play in 1945 has been maligned by somebaseball historians, who use one~armed outfielderPete Gray of the St. Louis Browns as an example.Others have defended the 1945 season, citing thelack of outrageous statistics by veteran players fromthe previous seasons.
The recent induction into the Hall of Fame ofNewhouser, the American League Most ValuablePlayer in 1945, reminds us that the accomplishmentsof players like Rosen and Wolff, who happened topeak during World War II, deserve more recognition.
-------:-------------:-----~0)--------------------

THE BASEBALL RESEARCH JOURNAL
1945 AII--Star "Selections"Explanations: The Player's batting average (BA) is that at the time of the All~Star break; for pitchers won~loss record (W~L) is similar. TSN signifies the hypothetical team
selected by The Sporting News; AP signifies the hypothetical team chosen in an Associated Press poll of major league managers. An "X" denotes that player was chosen
for that organization's hypothetical team. "Past" and "Future" refer to regular All~Star Game selections before and after 1945; number of times selected with last/next year
in parentheses. Names in capital letters are of "disenfranchised All~Stars" of 1945.
American League
BA TSN AP Past Future
.238 X X 7 (1944) 0
.240 X X 4 (1944) 1 (1946)
.253 X X 0 0
National League
.296 X X 7 (1943) 0
.335 X X 0 3 (1946)
.263 X X 0 0
Table 1. Catchers
Player Team Pos
Rick Ferrell WAS C
Frankie Hayes CLE C
MIKE TRESH CHI C
Ernie Lombardi NY C
Phil Masi BOS C
KEN O'DEA STL C
Table 2. Infielders
Player Team Pos
NICK ETTEN NY 1B
George McQuinn STL 1B
Dick Siebert PHI 1B
EDDIE MAYO DET 2B
Snuffy Stirnweiss NY 2B
MARK CHRISTMAN STL 3B
Tony Cuccinello CHI 3B
OSCAR GRIMES NY 3B
Lou Boudreau CLE 55
\/l;;;111 GLt,;;:pl1ICUl'! GTL 1'1',','
Phil Cavaretta CHI 1B
Frank McCormick CrN 1B
non Johnson CHI ZR
Emil Verb;:m STL 2B
Boh Elliott PIT ,711
Stan Hack CHI 3B
Whitey Kurowski STL 3B
1vlarty tviarioI1 S'T'L SS
EDDIE BASINSKI BRO SS
Outfi@hl@rs
Player Team Pos
George Case WAS OF
Doc Cramer DET OF
Roy Cullenbine DET OF
BOBBY ESTALELLA PHI OF
Hank Greenberg DET OF
BA TSN
.294 X
.265
.265 X
.292 X
.309 X
.322 X
.328 X
.276
,274 X
.Jl H X
.372 X
.293 X
,309 X
.281 X
.ZR I X
.327
.330 X
.253 X
.299 X
BA TSN
.327 X
.278 X
.265 X
.292 X
.286
American League
AP Past
X 0
X 4 (1944)
1 (1943)
X 0
X 0
0
X 2 (1938)
X 0
X 1 (1944)
~~ (1944)
National League
X 1 (194A)
X 7 (1944)
X 1 (1944)
X 0
X 1 (IY44)
X 4 (1943)
X 2 (1944)
X 2 (1944)
0
American League
AP Past
X 3 (1944)
X 5 (1940)
2 (1944)
0
X 4 (1940)
Future
o2 (1947)
oo1 (1946)
o
ooZ (1947)
r; (1946)
2 (1946)
1 (1946)
o2. (1946)
) (lY4'1)
o2 (1946)
1 (194<1)
o
Future
oo
o
oo

THE BASEBALL RESEARCH JOURNAL
Jeff Heath CLE OF .315 X 2 (1943) 0
Bob Johnson BOS OF .297 X X 7 (1944) 0
Wally Moses CHI OF .278 X 1 (1937) 0
National League
BUSTER ADAMS STL OF .300 X 0 0
VANCE DINGES PHI OF .328 X 0 0
Tommy Holmes BOS OF .401 X X 0 1 (1948)
Bill Nicholson CHI OF .259 X X 4 (1944) 0
Mel Ott NY OF .325 X X 11 (1944) 0
Andy Pafko CHI OF .301 X 0 4 (1947)
GOODY ROSEN BRO OF .363 X X 0 0
Dixie Walker BRO OF .299 X 2 (1944) 2 (1946)
Table 4. Pitchers
American League
Name Team Pos W..L TSN AP Past Future
Al Benton DET P 7~ 1 X 2 (1942) 0
Hank Borowy NY P 10~5 X X 1 (1944) 0
RUSS CHRISTOPHER PHI P 11~5 X X 0 0
Dave Ferriss BOS P 14~2 X X 0 1 (1946)
STEVE GROMEK CLE P 9~5 X X 0 0
Jack Kramer STL P 8~ 7 X 0 2 (1946)
Thornton Lee CHI P 9~6 X 1 (1941) 0
Dutch Leonard WAS P 9~3 X X 3 (1944) 1 (1951)
Hal Newhouser DET P 13~5 X X 3 (1944) 3 (1946)
Allie Reynolds CLE P 8~ 7 X 0 5 (1949)
ROGER WOLFF WAS P 9~5 X 0 0
National League
RED BARRETT STL P 10~6 X X 0 0
Mort Cooper BOS P 8~ 1 X X 2(1943) 1 (1946)
Paul Derringer CHI P 9~6 X 6 (1942) 0
BLIX DONNELLY STL P 4~6 X 0 0
HAL GREGG BRO P 10~5 X X 0 0
Van Lingo Mungo NY P 9~4 X 3 (1937) 0
Claude Passeau CHI P 10~2 X X 3 (1943) 1 (1946)
Preacher Roe PIT P 6~6 X X 0 4 (1949)
Rip Sewall PIT P 9~7 X 2 (1944) 1 (1946)
Bill Voiselle NY P 10~7 X 1 (1944) 0
HANKWYSE CHI P 10~5 X 0 0

Games Ahead and Games Behind
A stat for evaluating pitchers
James C. Kaufman and Alan S. Kaufman
Teams are compared with a single statistic to decide pennants: Games Ahead/Games Behind. Whileit has its limitations, the stat is compellingly simpleand truly reflects baseball's bottom line. We decidedto evaluate pitchers based on the Games Ahead/Games Behind stat, computing it conventionally, theway it is used to determine each team's standing in itsdivision.
The main benefit of this stat is to permit quickcomparisons between teams (or pitchers) with differ...ent numbers of decisions. For example, when teamshave played the same number of games, then all youhave to do is compare their number of wins to deter...mine how many games one team is behind another.When they have played different numbers of games(e.g., if one team is 31 ... 21 and another is 30... 15), com...paring wins doesn't help much. The Games Aheadstat tells us that the second team (with one fewerwin) is actually 2.5 Games Ahead.
A benefit of Games Ahead compared to simplewinning percentage is that it is a practical stat th.attranslates directly to the number of games a team orpitcher must win to catch up with its or his opponent.For pitchers, Games Ahead is really a bottom ... linestat. The number of games won is important and so is
James c. Kaufman and Alan S. Kaufman are the authors of The WorstBaseball Pitchers of All Time (McFarland, 1993), to be published and inrevised form by Citadel Press in April, 1995. Alan is Research Professor atthe University of Alabama, and is the author of psychological texts and testthat are used throughout the world. James is a freelance writer and formerjournalist who has published may works of fiction, non-fiction, and poetry.
ERA; but the name of the game is to maximize thenumber of wins and minimize the number of losses. Apitcher who accomplishes that feat consistently willlead his team to the pennant.
The attached chart shows the -major league leadersin "Games Ahead" from Al Spalding in 1876 toTommy Glavine in 1993 and Jummy Key in 1994,along with the number of games they finished aheadof the next pitcher. In '93, Greg Maddux (20 ... 10) wonhis second straight NL Cy Young trophy, but in viewof the airtight Division race in the NL West, a casecan be made for Glavine (22 ...6) as being more instru...mental in the Braves' narrow triumph over theGiants. The Atlanta lefty edged the Giants' JohnBurkett (22 ... 7) and the Astros' Mark Portugal (18 ... 4)for the ML Games Ahead crown. In 1992, Glavinealso paced the NL in Games Ahead (despite losingthat Cy Young to Maddux as well), though he trailedML leader Jack Morris.
The Games Ahead method isn't intended to re ...place tIle existing ways of evaluating pitchers; it's justanother angle. Some notable findings:
Walter Johnson led all ML pitchers by 7 games in1913, the modern record. Lefty Grove holds down thesecond and third spots. Old Hoss Radbourn is the all ...time leader with an 8 ... game bulge in 1884. DennyMcLain's 4...game edge in 1968 is the largest margin ofthe past half...century.
Though the chart only lists ML leaders, JackChesbro led all AL pitchers by 9.5 games in 1904, theall ... time record for one league. The modern NL record

THE BASEBALL RESEARCH JOURNAL
is 5 games, set by Dizzy Dean in 1934 and tied by DonNewcombe in 1956.
Grove and Tom Seaver are the only modern pitch...ers to lead the majors four times; Seaver led duringthree different decades. Pete Alexander and SandyKoufax led the majors three times, each doing it inconsecutive years. Counting pre ... 1900 seasons, CyYoung also led four times; Kid Nichols was a three ...time champ and finished second twice.
It's not in the chart, but we also computed who fin ...ished the most games behind the leader each season.Jose DeLeon finished 16.5 games behind Bob Welchin 1990 and 18.5 games behind Doc Gooden in '85(when DeLeon was 2... 19) to join Hall ...of... Famer RedRuffing and ex ... Mets Roger Craig and JerryKoosman-among others-as two ... time tail ... enders.DeLeon's 18.5 Games Behind equalled Craig's futilitywith the '63 Mets; you've got to go back to 1934,when Si Johnson trailed Dizzy Dean by 19 games, tofind a pitcher who finished a more distant last. Theworst mark of this century is Happy Jack Townsend's25 ...game deficit in 1904; the worst ever is the 35.5games that an 18 ... year... old rookie named LarryMcKeon (18 ... 41) finished behind Radbourn (60 ... 12)in 1884.
Besides Ruffing, the list of tail ...enders includes Hallof Famers Candy Cummings, Tim Keefe, BurleighGrimes, Jesse Haines and Robin Roberts. It also num...bers Lee Richmond in 1882, who had pitched the
majors' first perfect game two years earlier; DonLarsen, who pitched the only World Series perfectgame; and Virgil Trucks, who pitched two no ...hittersthe same year he finished 17.5 Games Behind.Among Anthony Young's notable feats in 1993, whenhis 27 straight losses and 1... 16 mark made headlines,was the fact that he finished 15.5 games behindGlavine's Games Ahead pace.
Ruffing went from Games Behind chump in 1928...29 to Games Ahead champ in 1938. Also going frombottom to top were Will White, Paul Derringer, andPreacher Roe. The opposite path was taken by Rob..erts, McLain, Jim Bunning and Rick Sutcliffe.
The AII ... time Games Ahead champ, regardless ofyear, is no contest: Radbourn, in 1884, was +48 (winsminus losses) in his 60... 12 season to finish 5.5 gamesahead of John Clarkson's 53 ... 16 mark one year later.Since 1900, there's a three ... way tie at the top-the+29 records turned in by Jack Chesbro (41 ... 12),Smoky Joe Wood (34 ... 5) and Walter Johnson (36 ... 7).The leaders since 1930 are Grove's +27 and McLain's+ 25 the seasons each won 31 games; Ron Guidry's+22 in 1978 is the best since expansion. The worstrecord ever by a Games Ahead champ was RogerClemens' +11 in '87 (20 ... 9).
Kirk McCaskill (10... 19) and Rod Nichols (2 ... 11) seta record in 1991. They finished only 10.5 games be ...hind the leaders, the best "worst" ever.
Games Ahead (GA) "Champs" (1876... 1994)Year ML Leader (W..L) GA Year ML Leader (W..L) GA
1876 Spalding (47~13) 4 1895 C. Young (35~10)
1877 Bond (40~17) 6.5 Hoffer (31~6) 6.5
1878 Bond (40~19) 6 1896 Hoffer (25~7)
1879 Ward (4 7~17) 3 1897 Nichols (31~1l) 0.5
1880 Corcoran (43~14) 5.5 1898 Nichols (31~12) 0.5
1881 Corcoran (31~14) 1.5 1899 Hughes (28~6) 1.5
1882 W.White (40~12) 1900 McGinnity (29~9) 3
1883 Radbourn (49~25) 1.5 1901 C. Young (33~10)
1884 Radbourn (60~12) 8 1902 Chesbro (28~6) 0.5
1885 Clarkson (53;16) 2 1903 C. Young (28~9) 0.5
1886 Baldwin (42~13) 1904 Chesbro (41~12)
1887 Kilroy (46~19) 1905 Mathewson (31~8) 4
1888 S. King (45~2l) 0.5 1906 M. Brown (26~6) 2.5
1889 Clarkson (49~19) 0.5 1907 Donovan (25A) 2.5
1890 Gleason (38~17) 0.5 1908 Mathewson (37~1l) 0.5
1891 Hutchinson (44~19) 1909 Mullin (29~8)
1892 C. Young (36~12) 2.5 1910 Coombs (31~9)
1893 Nichols/Killen (34~14) 1911 Marquard (24~7) 0.5
1894 Meekin (33~9) 0.5 1912 J. Wood (34~5) 4.5

THE BASEBALL RESEARCH JOURNAL
Year ML Leader (W..L) GA Year ML Leader (W..L) GA
1913 W. Johnson (36.. 7) 1952 Roberts (28 .. 7) 2
1914 B. James (26.. 7) 0.5 1953 Spahn (23 .. 7)
1915 Alexander (31 .. 10) 3 1954 Lemon (23 .. 7)
1916 Alexander (33 .. 12) 3.5 1955 Newcombe (20..5) 2
1917 Alexander (30.. 13) 0.5 1956 Newcombe (27 .. 7) 3.5
1918 Vaughn (22 .. 10) 1957 Bunning (20..8) 0.5
Hendrix (19 .. 7) 0.5 1958 Turley (21 .. 7) 1.5
1919 Cicotte (29.. 7) 3 1959 Face (18 .. 1) 2.5
1920 Bagby (31 .. 12) 2 1960 Broglio (21 ..9) 0.5
1921 Mays (27 ..9) 1.5 1961 Ford (25 ..4) 3.5
1922 Bush (26 .. 7) 2.5 1962 Purkey (23 ..5) 0.5
1923 Luque (27 ..8) 3 1963 Koufax (25 ..5) 1.5
1924 Vance (28 ..6) 3 1964 Koufax/Bunker (19..5) 0.5
1925 S. Coveleski (20..5) 1965 Koufax (26..8) 2
1926 Uhle (27 .. 11) 1966 Marichal (25 ..6) 0.5
1927 Hoyt (22 .. 7) 0.5 1967 Lonborg (22 ..9) 0.5
1928 Benton (25 ..9) 1968 McLain (31 ..6) 4
Grove (24..8) 1969 Seaver (25 .. 7) 1.5
Hoyt (23 .. 7) 1970 Cuellar (24..8)
Crowder (21 ..5) 2 Gibson (23 .. 7) 0.5
1929 Earnshaw (24..8) 1971 Blue (24..8)
1930 Grove (28..5) 5.5 McNally (21 ..5) 2
1931 Grove (31 ..4) 6.5 1972 Carlton (27 .. 10) 1.5
1932 Gomez (24.. 7) 0.5 1973 Hunter (21 ..5) 1.5
1933 Grove (24..8) 1974 Messersmith (20..6) 0.5
1934 Dean (30.. 7) 1975 Seaver (22 ..9) 0.5
1935 Dean (28 .. 12) 1976 Carlton/Garland (20.. 7) 0.5
1936 Hubbell (26 ..6) 4 1977 Seaver (21 ..6)
1937 Hubbell (22 ..8) Candelaria (20..5) 1
J. Allen (15 .. 1) 0.5 1978 Guidry (25 ..3) 3.5
1938 Ruffing (21 .. 7) 0.5 1979 Flanagan (23 ..9)
1939 Derringer (25 .. 7) 1980 Stone (25 .. 7) 1.5
1940 Feller (27 .. 11) 1981 Seaver (14 .. 2)
B. Newsom (21 ..5) 1.5 1982 P. Niekro (17 ..4) 0.5
1941 Riddle (19..4) 1983 Dotson (22 .. 7) 0.5
1942 Hughson (22 ..6) 1984 Sutcliffe (20..6)
Bonham (21 ..5) 0.5 1985 Gooden (24 ..4) 2
1943 Chandler (20..4) 1.5 1986 Clemens (24..4) 3.5
1944 Newhouser (29..9) 2.5 1987 Clemens (20..9) 0.5
1945 Newhouser (25 ..9) 1988 Viola (24.. 7)
1946 Ferriss (25 ..6) Cone (20..3)
1947 Jansen (21 ..5) 1989 Saberhagen (23 ..6) 2.5
1948 Bearden/Brecheen (20.. 7) 1990 Welch (27 ..6) 2.5
Kramer (18..5) 1991 Smiley/Erickson (20..8) 0.5
1949 Parnell (25 .. 7) 0.5 1992 Morris (21 ..6)
1950 Maglie (18 ..4) ZO.5 1993 Glavine (22 ..6) 0.5
1951 Roe (22 ..3) 1994 Key (17 ..4)
C)-4. .... 'l.'/;l:l(1' ......

Grace Under Pressure
Don Newcombe's performance in clutch situations
Guy Waterman
Big Don Newcombe was one of baseball's dominant pitchers of the 1950s. Mainstay righthander ofthe last great Brooklyn Dodger teams, Newk won 17games as a late,called rookie in 1949, 19 games in1950 and 20 in 1951. Then, following a stint in theservice, he came back to win 20 games again in 1955and a magnificent 27 in 1956.
Newcombe also pioneered as the first black pitcherto appear in the regular rotation of a twentieth cen,tury major league team. This role placed him underunprecedented social and psychological pressures.
Jackie Robinson had been the first black to crossthe color line in 1947, but when Jackie went to theplate, he was one lone black man facing a team ofnine entrenched white men, one of whom (thepitcher) controlled the ball. That was mighty toughon Robinson, but a comfort perhaps to his white op,ponents.
When Newcombe began to pitch regularly for the1949 Dodgers, the racial roles were reversed. NowSouthern white batters, who had never played withblacks or been required to treat them as equals in anywalk of life, suddenly found themselves going up tothe plate to face a big black man standing tall on amound just sixty feet away, backed by eight unitedblack and white teammates. Furthermore, this big
Guy Waterman is co~author (with his wife, Laura) of several books on
recreational history. In other incarnations, he may have been a nightclub pianoplayer, a Washington speechwriter, and a Vermont backwoods homesteader~
mountain climber.
black man had that hard white ball in his hand, andhe obviously was big (6' 4", 220 pounds) and couldthrow that ball very fast and, on occasion, danger,ously close to a batter's head.
This reversal of roles placed Newcombe in a socialand psychological setting unprecedented in baseballhistory, a tremendous pressure to bear for a 23,year,old rookie.!
The "Choke" Charge-The charge was levelledagainst Newcombe for many years, based on a halfdozen post,season games, that he could not stand upto pressure, that he "choked" in the clutch, that helost the big games. Newcombe himself was keenlyaware of this charge. In a 1962 interview, he recalledthe whispers he heard even at the height of his careerin 1956:
"People were· talking about my 'choking up.' notbeing able to win a big game ... being 'gutless.' andall that stuff."2
In 1956 a writeup in The Sporting News, discussingthe Most Valuable Player Award, expressed surprisethat Newcombe won, calling attention to "two dismalfailures in the [World Series] with the Yankees" andalleging that Sal Maglie (13,5, versus Newcombe's27,7 in 1956) might have won instead:
Newcombe's failure to come through in thelast weeks of the Brooklyn pennant drivewhile Maglie made himself the leader of theeffort, ... developed the impression

THE BASEBALL RESEARCH JOURNAL
that ...Salvatore, with his 13,5, would get theprize.3
This, despite Newcombe's post,All,Star breakrecord of 18,2. But after a loss in the 1956 World Se,ries, a parking lot attendant accosted Newcombe withthe worst kind of accusation:
"Can't you take competition? What's the matter,Newk, are you gutless?"4
In 1957 the Saturday Evening Post called Newcombe"one of the most maligned pitchers in baseball."5 Aslate as 1975 the stigma endured. In The Dodgers, pub,lished that year, Tommy Holmes closed his passage onNewcombe with this comment:
"The misfortunes he encountered in games with thepennant at stake and in World Series competition de,tracted greatly from his reputation."6
These charges are serious-but are they merited?How well did Don Newcombe perform under pres,sure? In fairness to the man and to the historicalrecord, this question deserves a careful, objective an,swer. Let's look at the record.
1949: A rookie comes through-Newcombe cameup to the Dodgers in May, 1949, a year of a very closepennant race between Brooklyn and St. Louis.Though a raw rookie, just turning 23 in June, Newkwas thrown into the starting rotation. As the racetightened during the last six weeks of the season,Newcombe was repeatedly handed pressure,packedassignments. On August 8, 1949, with the Dodgersand Cards deadlocked at 63 wins and 39 losses each,Newcombe faced Brooklyn's cross,town rivals, theNew York Giants, and won a 2,1 squeaker; had helost, the Brooks would have fallen from first place, asthe Redbirds won that day. Later that month Brook,lyn and St. Louis went head to head, the Dodgers nowtrailing by two games. Newcombe drew a start againstCardinallefthander Al Brazle, whose record was 13,5 going into the game. Newk responded with a six,hitshutout, cutting the Cards' lead to a single game. Acontemporary' report of the game indicates theamount of pressure involved in that game:
Less than twenty,four hours earlier the Dodg,ers were on the brink of the obscurity thatgoes with a runner,up finish, but late yester,day afternoon they were breathing defianceinto the faces of the Cardinals, convincedthat theirs was a team destined to win theNational League pennant.
The convincer was a 6,0, six,hit victory thatDon Newcombe hurled ...
...The gallant Brooks fashioned back,to,backconquests Tuesday night and yesterday, cap,tured the two "must" games, and now feelcertain that the top prize will go to them.
Newcombe's work in this crucial contest wasa pitching masterpiece ...7
Nevertheless, by late September St. Louis had as,sumed the lead again. With four games remaining,one full game back, Newcombe and Preacher Roepitched a double,header against the Boston Braves,on September 29, 1949. When Roe won the firstgame and the radio reported the Cards losing to Pitts,burgh, the teams were deadlocked: surely a pressuresituation for a 23,year,01d rookie, going against theBraves' 32,year,01d ace, Johnny Sain, a 24,game win,ner the previous year. Newcombe responded bywinning the big game with a four,hit shutout.
On the last day of the season, October 2, 1949, thepennant still not clinched, Shotton startedNewcombe again, with only two days' rest. Obviouslythe Brooklyn manager felt his best hope lay with theyoung star, despite his inexperience. The Dodgerswon that key game, though Newcombe did not pitchwell and was relieved in the fourth inning.
For the World Series opener on October 5, 1949,Shotton again picked Newcombe for the starting role,again with just two day's rest. Through eight stronginnings, Newcombe overpowered the awesome Yan,kee lineup, holding them to four hits, with no walks,striking out 11. It was an amazing feat for an inexpe,rienced and overworked 23,year,01d, pioneering asthe first black starter in a Series. The only trouble wasthat New York's Allie Reynolds was even better thatday, holding the powerful Brooklyn batters to twohits. In the ninth, Tommy Henrich caughtNewcombe's one mistake of the day, sending it overthe fence for a tough 1,0 verdict. But who succumbedto pressure that day? Newcombe, who pitched master,fully save for that one mistake? Or the vauntedDodger hitters who couldn't get anything goingagainst Reynolds?
In a second Series start that year, on October 8,Newcombe lost again, knocked out in the fourth in,ning en route to a 6,4 loss. Clearly that was not oneof his better performances. Be it noted: he was pitch,ing with just two days' rest for the third time in a row.
-----------------~-~~~~ -----,----'--------,--------------

THE BASEBALL RESEARCH JOURNAL
1950: Winning the big ones in September-In 1950the Dodgers again trailed in September, this time 7,.1/2 games behind the Philadelphia Phillies (the"Whiz Kids" of that year) whom they faced for a cru,.cial double,.header on September 6. This was anabsolutely critical twin bill for the desperate Brooks.Newcombe stepped into that pressure,.laden scenarioand won a close opener, 2,.0, yielding but three hits.Having come through brilliantly there, he proceededto start the second game as well. Bear in mind, thiswas no meaningless season,.end contest in which tostage a gimmick like having one pitcher start bothgames, in the style of Iron Man McGinnity of theDark Ages. This was a key double,.header, a do,.or,.diesituation for the Dodgers. Having pitched so bril,.liantly in the opener, Newcombe would havecontinued his shutout streak through the secondgame had it not been for fielding misplays by the nor,.mally excellent rightfielder, Carl Furillo, which led totwo tainted Phillie runs. N ewk left in the seventh,trailing 2,.1, but Brooklyn rallied for three runs tosweep the crucial two games and stay alive in the pen,.nant race.
Still, by September 23, the Dodgers were seven
games out when Newcombe faced Philadelphia's ace,the future Hall of Farner, Robin Roberts. In manyface,.to,.face duels, Roberts had beaten Newcombebefore. But in this pressure situation, Newcombeedged Roberts, 3,.2.
On October 1, the last day of the season, Brooklynfaced Philadelphia again, with the race still unde,.cided. A Dodger win would tie it up and force aplayoff. Newcombe again faced Roberts. Once againNewkpitched magnificently, holding the Phils to onepoorly,.earned run for nine innings. (Snider andRobinson failed to agree on who would catch a weakpop fly by Del Ennis which either of them might havecaught; this put a runner into scoring position whoshould not have been there.) But Brooklyn's batterscould not get more than one run off the great Robertseither, so the game went into the tenth inning. Inthat frame, Dick Sisler's story,.book three,.run homerbroke the tie and the hearts of Dodger fans. Yes,Newcombe lost this big one-but he might so easilyhave won in nine innings had others done their jobsas well as he did his.
1951: Trying to Stop the Giants'Rush-In 1951Newcombe played a hero's role in the Dodgers' des,.
Don Newcombe at the height of his powers.
-------------------~~r-~ -------------------
...Jcoz
THE BASEBALL RESEARCH JOURNAL
perate struggle to hold their eroding lead over thefast ..charging Giants.
On September 8, when the big Dodger lead of Au..gust was beginning to blow away, Newk faced theGiants and stopped them on two hits ("an overpow..ering exhibition," said the New York Times).8
On September 29, with just two days' rest, Newkfaced his old nemesis, Robin Roberts and, in a "must"game, beat him with a seven..hit shutout, the Timescommenting:
"Facing near..elimination from the National Leaguepennant race, the Dodgers and big Don Newcomberose magnificently to the challenge."9
The very next day, Newk stepped into an urgentrelief role, hurling 5 .. 2/3 innings of shutout reliefwhich held the door open for an eventual Dodgerwin, 9 ..8 in 14 innings. This amazing sequence of 14..2/3 shutout innings in two successive days occurredjust two days before he was asked yet again to take theball-and start the famous playoff game against theGiants on October 2.
On that fateful day the overworked Newcombeheld the powerful Giants to just one run througheight innings. Even then, had Branca (or Labine orErskine) done his job and got Bobby Thomson out,Newcombe would forever after have been cited as theman who came through in the clutch to win that de ..cisive playoff game. Instead there came the "shotheard 'round the world" and Brooklyn was once morein second place.
The Dodger ace missed all of 1952 and 1953 on ac..count of military service, and part of 1954 as well, theyear of the Giants and Dusty Rhodes' pinch homerunsand Willie Mays' dash to deepest centerfield-notpart of this story.
The mid--1950s mainstay for pennant winners-In1955 the Dodgers won an easy race by a 13 .. 1/2 gamemargin, so pressure was not present. In 1956 it wasagain close, with Dodger pitchers facing a lot of"must" games. Newcombe came through with his fin ..est year, going 27 .. 7 to win both the Cy Young Award(its first year) and the National League Most ValuablePlayer. Repeatedly, Newcombe won key victorieswhen the race was tightest. On August 2 he beat thechallenging Braves with a four..hit shutout; the Times'report next day started: "Don Newcombe won the·'bigone' yesterday... "10 He ran up a scoreless string of 39..2/3 innings right in the heat of the pennant race,then won· critical close games in ·September-3 .. 1 ineleven innings. against the Giants on September 7, athree ..hit shutout over the Cubs on September 15,
followed by two easy victories, then a heartbreakerloss to Roberts on September 26, and finally a last..daypennant..clincher on September 30. (The last was ad..mittedly a sloppy 8 .. 6 contest in which the offenseplayed a more vital role than the winning pitcher.)
Toward a Just Evaluation-Newcombe lost World
Series games in 1955 and 1956, and these, combinedwith his 1949 Series losses and those weak final in..nings in the 1950 and 1951 finales, fueled countlesswhispers that he couldn't win the big ones. I hopethat a more just evaluation may be derived from theforegoing. review of his performance in pressure ..packed pennant races, plus a realistic look at how wellhe came through in that first game of 1949, the 1950season finale, and the 1951 playoff. Given any degree
,of reasonable support from his teammates, three ofthose key games would have ended in Newcombe vic..tories, just as so many key pennant games had.
Often overlooked is that other ace pitchers lost cru..cial games too. (Every game has a loser.) Reynolds,winner of that 1..0' 1949 Series opener, had drawn amuch more important assignment in the second.. to ..last game of the regular season that year, a game theYankees literally had to win to stay alive. Reynolds"choked," if that phrase must be used, allowing theRed Sox to take a 4..0 lead; subsequent Yankee pitch..ing and hitting overcame the deficit. Whitey Ford,winningest pitcher in Series history and renowned asa clutch performer, lost two games in the 1963 Clas..sic,one a 2.. 1 squeaker. It is not recorded that anyonecharged he folded under pressure. That great competi..tor Bob Gibson failed to win the crucial seventh gamein 1968. Let no fool try to accuse Gibson of "chok..ing."
When his first major league. manager, Burt Shotton,was asked to comment on one of Newcombe's closelosses in 1949, lle put it in proper perspective:
What do I think of him? I think he's human,that's alL He just had a bad game in him, thesame as every damn one of us in this business,and it came out. Certainly there's nothingelse I could think of the boy. He's a greatpitcher and he'll be back in there deliveringwhen we need him. 11
After his 1956 Series losses, President Dwight D.Eisenhower wrote a letter to Newcombe, advising himto forget the Series and remember his performance inthe close pennant race. Wrote Ike: "Every athlete inevery sport in the world knows that some days things

THE BASEBALL RESEARCH JOURNAL
just don't break right."12 Sportswriter Dick Youngsummed it up years later with the reminder: "Thething to remember is that Don Newcombe was askedto pitch the big ones."13
Don Newcombe in his prime was an impressive,complex, and powerful figure. He faced pressures andhostilities unprecedented for young black pitchers ofhis time. In later years his career came to an early endamid the disgrace of alcoholism. Yet the big manovercame that enemy too and returned to become acounsellor to big league athletes on coping with the
fatal temptations of alcohol and drug abuse. In 1979he received the Ernie Meld Award as the "figure whohas contributed greatly to the overall image of profes..sional baseball both on and off the field." Priorwinners had included such other admirable role ...mod..els as Ernie Banks, Roberto Clemente, and PhilNiekro.
Young players had good reason to heed his message.No one knew better than Don Newcombe the mean..ing of pressure. Taking his life as a whole inperspective, no one responded with greater courage.
Notes1. The unprecedented pressures on Newcombe as the first black pitcher in regu~
lar rotation has been examined in detail in Guy Waterman, "Racial Pioneering onthe Mound: Don Newcombe's Social and Psychological Ordeal," NINE: A Journalof Baseball History and Social Policy Perspective, Volume 1, Number 2 (Spring 1993),pp. 185~195.
2. The Sporting News, June 9, 1962.3. The Sporting News, November 28, 1956, p. 10.4. Michael Brown, quoted in Don Newcombe, "I'm No Quitter," Saturday EveningPost, March 9,1957, p. 27.5. Ibid. (headline).6. Tommy Holmes The Dodgers, (New York: Macmillan, 1975), p. 113.7. "Dodgers Blank Cards, Trail by Game," New York Times, August 25,1949, p. 27.8. "Dodgers Crush Giants, 9~0," New York times, September 9,1951, p. S~1.
9. "Newcombe Halts Phils, 5~0, Aided by Pafko 2~Run Homer," New York Times,September 30, 1951, p. S~1.
10. "Dodgers Beat Braves Third in Row," New York Times, August 3, 1956, p. 13.11. Burt Shotten, quoted in "Big Don Looms as Dodgers' Hurler for 2nd SeriesGame," Afro~American,October 8, 1949, p. 19.12. Dwight D. Eisenhower, quoted in Newcombe, "I'm No Quitter," p. 27.13. Dick Young, The Sporting News, October 16, 1973.
The Johnny Cooney CaperJohnny Cooney was with the Braves for 10 years, 1921 ...30, with a pitching record of 34...44. He played some outfield
and first base, batted .300 or better four different times in limited plate appearances, and never hit a homerun . In 1935,he was born again as an outfielder with the Dodgers. He became the Bums' regular center fielder in 1936...37, hit well,but was still looking for his first four...bagger. Then it was back to the Braves as an outfielder in 1938. In 1939, his 15thNational League season, at age 38, he cracked two homeruns in two days. Then he reverted to form, never again hit...ting a circuit clout, although he played through 1944 . In 3,372 at bats over 20 years, he hit two homeruns.
-Don Nelson

If God Owned the Angels...
A look back at the major leagues' first twentieth...century expansion
Tom Ruane
On October 17,1960, the National League votedto expand to ten teams in 1962 with the addition ofentries in New York and Houston. Beaten to thepunch, the American League issued a surprise an..nouncement nine days later. The surprise wasn't somuch their decision to expand to ten teams, but tojump the gun on the N.L. by adding the new teams(in Los Angeles and Washington) in the spring of1961.
So began the first wave of expansion in modernbaseball history. For the A.L. entries, it looked like arecipe for disaster. An ownership group for the Wash..ington franchise had been selected on November 17,but the league went into the annual winter meetingswith the Los Angeles franchise still up in the air. TheDodgers wanted to delay the move of another teaminto their area, while the A.L. countered with a pro..posal for both leagues to expand to nine teams in1961 witll illter.. league play. The N .L. refused, sayingthat four months simply wasn't enough time to get aclub ready to play.
The A.L. disagreed and on December 6, rejecting aproposal by Charlie Finley, selected a group of ownersfor Los Angeles headed by Gene Autry. They'd al ..ready missed the major..minor league draft and hadonly a week to prepare for the expansion draft.
Tom Ruane lives and researches in Poughkeepsie, New York.
Pushed back a day by a severe snowstorm, the ex..pansion draft took place in Boston on December 14,1960. Each of the eight existing clubs provided a listof 15 players, selected from their 40..man reserve list,who would be made available to the new teams. Atleast seven had to have been on their 25 ..man rostersas of September 1st. The Angels and Senators wererequired to pick 28 players from these lists, four fromeach club. In addition, each expansion team had totake at least 10 pitchers, two catchers, six infieldersand four outfielders.
This was similar to the draft on October 10, 1961,to stock the National League teams. Most of the dif..ferences seemed to favor the N .L. entries. They'd hada year to scout and prepare for the draft instead of aweek. There was no requirement that a team pick acertain number of players by position. In addition tothe 15 ..man lists, each existing club also had to makeavailable two additional players from their 25 ... manroster. Half of these so ..called "premium" playerswould be doled out in a supplemental draft.
The disadvantages! One was that the talent poolhad already been diluted by the preVi01JS expansiondraft. But the largest potential disadvantage-andthe one generating the most argument at the timewas that the N .L. teams had been able to formulatetheir expansion lists prior to the deadline for settingtheir 40..man winter rosters. Since a team will typi ..cally release marginal players at that time in order toprotect tlli110r league prospects, t}lese fringe playerscould not be included on the A.L. lists of available

THE BASEBALL RESEARCH JOURNAL
Not only were the A.L. teams better each year, butthe worst year for the Angels and Senators (1963) wasstill better than the best year for the Mets and theColts/Astros (1966). The average A.L. expansionteam over this period had a record of 69~92, while theN.L. teams averaged 58~104. Things got so bad forthe Mets and Colts that a special draft was held forthem following the 196,) se8son.
Why were the A.L. teams so much better? Werethe players the Mets and Colts had to choose fromthat much worse than the ones made available to theAngels and Senators? With 20~20 hindsight, howgood a team could the Mets have been if they'd con~
centrated on picking the best players available insteadof washed~up ex~Dodgers? If an omniscient generalmanager had been running the Angels instead of Fred
players. Promising younger players, or more valuableveterans, had to be added instead.
At the time, the feeling was that the NationalLeague teams were getting a raw deal. The owners ofthe Houston Colts threatened to give their franchiseback to the league if the player pool wasn't improved.George Weiss of the Mets and Paul Richards of theColts made a special appeal to the league's other gen~eral managers at a meeting held during the WorldSeries. Even A.L. officials joined in the criticism.
Bing Devine, Cardinal general manager and one ofthe plan's architects, offered a weak defense, sayingthat the league had never promised the new clubs"pennant contending teams or even first~divisionout~
fits," and that he was "sure the Colts and Mets didn'tenter the league with the expectation that we'd fur~
nish them-at any price-with a sure~fire pennant. "Winner.He wasn't kidding. No one was going to confuse
either the Mets or the Colts with a first~division out~
fit for a long, long time. The Angels, on the otherhand, would find themselves in first place on July 4,1962, in the middle of only their second season, andwould finish that year a solid third~place team.
Table 1 shows the comparative records of the twoleague's expansion teams for their first five years.
Table 1
American League
1961 131~ 191 .4071962 146~ 177 .4521963 126~ 197 .3901964 144~ 180 .4451965 145~ 179 .448
Total 692.. 924 .428
National League
1962 104~ 216 .3251963 117~ 207 .3611964 117~ 205 .3631965 115~ 209 .3551966 125~ 198 .387
578.. 1035 .358
Haney, could they have won the pennant in 1962? In1961?
In order to (at least partially) answer these ques~
tions, I need to be able to analyze the sources of talentthese teams relied upon: the expansion draft, playerpurchases, free agent signees and trades. Fortunately,much of this information is available. We know (forthe most part) who was on those expansion lists, whatplayers were sold during 1961 and 1962 and who weresigned as free agents. And while we don't know whattrades could've been made (just as we don't knowwhat players could've been purchased), we do knowwho was traded and for whom.
Since one of the things I'll want to do is compareplayers, both individually and in groups, I'll needsome way of measuring talent. For this study I'll beusing the Marginal Player Rating (MPR)l, a variationof the Total Player Rating used by Thorn and Palmerin Total Baseball. MPR, described in more detail inthe Notes, represents a player's contribution, ex~
pressed in wins, over what a marginal orreplacement~valueplayer would've done. An averageregular or starting pitcher will have a MPR some~
where between 1 and 2, while a negative MPR(converted to zero for this study) means that theplayer probably shouldn't be in the major leagues.
Let's start with the 1960 A.L. draft. Table 2 showsthe list of players the existing clubs made available tothe Angels and Senators.Pitchers are listed first anda W or L after the name indicates that the player wasdrafted by either Washington or Los Angeles.
In addition to these players, Los Angeles selectedtwo players from a minor league pool and Washingtonthree. The Angels picked up Steve Bilko and AlbiePearson, while the Senators added Leo Burke, JoeMcClain and Haywood Sullivan. Following the draft,the two teams swapped Davis and Mahoney,Aspromonte and Veal, Hamlin and Zipfel, Chanceand Hicks.
Table 3 shows the lists (as far as I can tell) of theNational League players made available to the Metsand Astros during the 1961 draft. Here an H or N af~
ter the name indicates that player was drafted byeither Houston or New York.
Some of this is conjecture. Since the Reds wereheading into the World Series at the time this infor~
mation was released, much of their list was keptsecret. The press printed a "best guess" of the rest aswell as the names of the "premium" players to bemade available after the initial phase. In addition,the Giants' list contained only 14 names, an oversightthat went unmentioned (and uncorrected) in the pa~

THE BASEBALL RESEARCH JOURNAL
CHICAGO CLEVELANDAlan Brice Ted Bowsfield,LDick Donovan,W J. Klippstein,WEd Hobaugh,W Mike LeeTurk Lown Carl Mathias,WKen McBride,L Don NewcombeGerry Staley Dave Tyriver
Hank Bauer Julio Becquer,LChester Boak,W Steve KorcheckFrank Cipriani Hal NaragonPete Daley,W John Schaive,WDutch Dotterer,W EThroneberry,LKen Hamlin,W J. ValdivielsoJay Hankins Elmer Valo
Table 2
BALTIMOREDean Chance,W~teve DalkowskiBilly Hoeftpordon JonesRon Moeller,L
lBob BoydClint CourtneyWalt DropoGene Green'WChuck Hinton,WBilly Klaus,Wames Liggett
Don Ross,LG. Woodling,W~rank Zupo
Table 3
BOSTONBob CarlsonJerry Casale,LArnie EarleyDave HillmanDarrell MasseyFred Newman,LT. Sturdivant,WTed WillsWilbur Wood
Jim Fregosi,LDon GileJim Mahoney,LRip RepulskiEd Sadowski,LWillie Tasby,W
Earl Averill,LJoe GinsbergBilly GoodmanJoe Hicks,LT. Kluszewski,LDean LookJim McAnany,LJim RiveraEarl Torgeson
K. Aspromonte,WSteve DemeterDon DillardMarty Keough,WJim King'WGene Leek,LGordon LundJoe MorganRed Wilson
DETROITP. Burnside'WWyman CareyPat DobsonDick EganA. Gatewood,LJoe GrzendaAlan KochDave Sisler'WBob Sprout,L
Harry ChitiNeil Chris leyDick GernertBob Rodgers,LCoot Veal,L
KANSAS CITYRay BlemkerBob Davis,WNed Garver,LDon LarsenJoe PetrokovicHowie ReedKen Sanders
MINNESOTAPete CiminoTex Clevenger,LR. Hernandez'WHector Maestri,WTom McAvoyTom MorganH. Woodeshick,W
NEW YORKLuis ArroyoEli Grba,LGerald HeintzDuke Maas,LBob MeyerBobby Shantz,WRoland SheldonTed Wieand
Fritz BrickellBob Cerv,LAlan HallKen Hunt,LDale Long,WGil McDougal
LOS ANGELESNelson ChittumRoger Craig,NJim Golden,HRene ValdesRick Warren
PHILADELPHIA PITTSBURGRay Culp Al Jackson'NRuben Gomez Clem LabineBruce Gruber W. MizellJess Hickman,H Curt RaydonKen Lehman Bobby Shantz,HRobin Roberts Jim Umbricht,H
CHICAGODick BurwellDick Drott,HMel Wright
Richie AshburnWalter BalesLou BishopEd Bouchee'NSam Drake,NGeorge FreeseAl Heist,HJim McAnanyJim McKnightPaul PopovichMel RoachMoe Thacker
CINCINNATIHarvey AlexMarv FodorKen Johnson,HSherman Jones,NHowie NunnOrlando PenaRay Ripplemeyer
Rogelio AlvarezGus Bell,NElio Chacon,NVic DavalilloDick Gernert,HFred HopkeDarrell Johnson
MILWAUKEEJohnny AntonelliBob BotzKen MacKenzieSeth MoreheadDennis OverbyPaul Roof,H
Bob Aspromonte,HSheldon Brodsky Bob BoydMel Corbo Neil ChrisleyGil Hodges,N Gino CimoliNorm Larker,H John DeMerit,NAl Norris Felix Mantilla,NRalph Plummer Wayne McDonaldNorm Sherry Merritt Ranew,HGene Wallace Phil RoofGordon Windhorn Sammy White
Dick AllenC. Coleman,NPancho HerreraAl KendersBob SadowskiB. G. Smith,NElmer ValoKen Walters
J. Christopher,NNorm HouselyJohnny LoganRoman Mej ias,HHenry MitchellWalt MorynRocky NelsonElmo Plaskett
ST. LOUISCraig Anderson,NAl CicotteKerry McDanielClint StarkBill Wakefield
C. Cannizzaro,NRoberto HerraraJim Hickman,NGary KolbDon LandrumBob Lillis,HGerry MarxEd Olivares,HR. Schoendienst
SAN FRANCISCODon ChoateRay Daviault,NDick DentonEd FeldmanEddie FisherSam Jones,HBilly LoesDom Zanni
Ernie BowmanEddie Bressoud,HDick DietzHobie Landrith,NJim MarshallJohn Weekly
pers of the day.Table 4 shows the probable players made available
during the "premium" phase
The selected player (the one we're sure about) islisted first. III tIle case of the Cubs, Reds, Braves andGiants, there was some confusion as to the premiumplayers and both guesses are 1istecl.
Which draft had more talent? Table 5 sllovvs tIletotal MPR ,vins for all players available in each draft,the total selected by the expansion teams, as well asthe percentage of talent selected. The three columnsare intended to cover short, medium and long..rangevalue and contain the sum of MPR wins for the yearsindicated.2
In terms of MPR wins, there was actually slightly
PHILADELPHIA PITTSBURGL-ee Walls'N Hal Smith,HDallas Green Don Leppert
Table 4
CHICAGODon Zimmer,Nim'Brewer
Barney Schultz
CINCINNATIJay Hook,NDon BlasingameWally Post
LOS ANGELESDick Farrell,HDary1Spencer
ST. LOUISBob Miller,NAlex Grammas
MILWAUKEEAl Spangler,HDon McMahonBob Taylor
SAN FRANCISCOJoe Amalfitano,HBilly O'DellDick Lemay
more talent available to the National League teams,both in the short and the long term, than to theAmerican League teams. Surprisingly, the Mets andColts as a group didn't seem to do much worse at find ..ing short.. range talent than the Angels and Senators.
Table ~,
1960 American League Draft
61 61,65 61+
Available: 51.4 172.5 291.8Selected: 29.8 130.5 172.7
PCT: 58.0 75.7 59.2
1961 National League Draft
62 62,66 62+
Available: 53.0 177.7 299.9Selected: 28.6 87.3 116.7PCT: 54.0 49.1 38.9
But tIle breakdown by team on Table 6 tells anotherstory.
It now becomes clear why the Mets had such a cli ..sastrous start. Pretty much all the talent drafted ·bythe National League teams was picked up by theColts. 11 players were drafted that year that wouldhave an MPR of 1.0 or higher in 1962; all 11 were

THE BASEBALL RESEARCH JOURNAL
Table 6
drafted by the Colts. It seems incredible that out ofthe 53.0 MPR wins available in the draft, the Metscould've found 22 players that between them totaledonly 4.2 wins-Ed Bressoud by himself had more thanthat. What might not be obvious is why Houstondidn't have a better record than 64...96, as they clearlyout...drafted even the Angels.
More on that later. First, Table 7 shows the top tenplayers available in each draft.
Table 7
1960 American League Draft
61 61 ..65 61+*Donovan 4.5 *Fregosi 14.9 Wood 37.9Hoeft 4.3 *Chance 14.7 *Fregosi 37.8*McBride 3.7 *Shantz 9.4 *Chance 26.3Arroyo 3.7 *Woodeshick 8.7 Dobson 16.5Morgan 3.5 *McBride 8.4 Sanders 14.7*Grba 2.5 *Hinton 8.2 *Woodeshick 11.7Lown 2.5 *Donovan 7.4 *Shantz 9.4*Bowsfield 2.4 *Klippstein 7.4 *Hinton 8.6*Shantz 2.2 Hoeft 7.3 *McBride 8.4
*Woodling 1.9 *Newman 7.2 *Klippstein 8.0
1961 National League Draft:
62 62..66 62+*Bressoud 5.2 Allen 18.1 Allen 49.7*Farrell 3.7 *Bressoud 12.3 Fisher 19.7Roberts 3.5 Fisher 12.1 *Miller 18.2Fisher 3.4 Roberts 11.2 *Bressoud 12,3*Shantz 3.0 *Miller 8.3 Culp 12.0Ashburn 2.3 *Johnson 8.0 Dietz 12.0*Umbricht 2.1 *Farrell 7.3 Pena 11.9Zanni 1.7 *Shantz 7.3 *Johnson 11.3Pena 1.6 *Jackson 6.9 Roberts 11.2*Larker 1.5 *Mantilla 6.2 *Farrell 11.0
Here, an asterisk means that player was selected inthe draft. A few things to note:
1) nearly all of the short... range talent that was over...looked in the A.L. draft was veteran relief pitching.Since the Angels eventually picked up Morgan, oneof the best, this hardly hurt them.
2) almost none of the mediu.m ... range talent wasmissed by the A.L. teams. By 1964, none of the by ...passed positioIl players h.ad a11Y l1its in. lllajor leaguebasebalL The story i11 tb.e Natiollal League 'was quitedifferent. From the Phillies alone, they failed to draftthe 1963 Rookie Pitcher of the Year (Ray Culp) aswell as the 1964
Rookie of the YeHr (Dick Allell). Not Oilly did tileymiss 3 out of 4 of the top players in this range, butmost of the players they did select had their best sea...
Table 9
At..Bats % Innings % Avg.Angels: 3274/5040 65.0 1104/1438 76.8 70.9Senators 4380/4953 88.4 931/1425 65.3 76.9Colts: 4110/516g 79.5 886/1454 60.9 70.2Mets: 3419/5110 66.9 1077/1430 75.3 71.1
Table 8
At..Bats % Innings % Avg.
Angels: 2149/5040 42.6 834/1438 58.0 50.3Senators: 3798/4953 76.7 689/1425 48.4 62.5Colts: 3553/5168 68.8 693/1454 47.7 58.2Mets: 2284/5110 44.7 1057/1430 73.9 59.3
sons elsewhere. Among the top players, only KenJohnson and Dick Farrell would collect the majorityof their MPR wins for the team that drafted them.
3) the only long... range oversights made by the An...gels and Senators were late ... blooming pitchers. In1971, Wilbur Wood and Pat Dobson would win 22and 20 games, respectively, and Ken Sanders would bethe best relief pitcher in baseball. A lot of otherteams missed seeing their potential as well; prior totheir big seasons, Sanders had been released, Woodsold and Dobson traded twice.
One difference between the A.L. and N .L. draftswas in the number of players selected. The A.L.teams had to pick 28 each, or 56 out of the 120 avail ...able players. The N .L. teams could take between 16and 24 players from these lists. Houston selected 19and New York only 18 during this phase. They eachhad to pick four more players apiece during the "pre ...mium" phase of the draft. So while each teamcould've selected as many as 28 players, they didn'thave to take more than 20. In retrospect this mighthave been a disadvantage for the Mets and Colts.Between them, they only picked 16 pitchers. By con...trast, the Angels and Senators selected 25, the lasttwo being Dean Chance and Dick Donovan, whowould both win 20 games and lead their leagues inERA.
Still, how important was the draft as a source ofimmediate talent to the expansion teams? Table 8shows the percentage of the total at ...bats and inningspitched that were produced by the players selected inthe draft.3
But these numhers underestimate th.e draft's impor...tance because they don't include players obtained intrades. After both drafts, the expansion teams dealtsome of those they'd selected.
Table 9 sllows tIle players rIley gor in return.
1..5 1+66.9 102.663.6 70.152.3 61.635.0 55.1
115.214.624.4
4.2
Years following draft
AngelsSenatorsColtsMets

THE BASEBALL RESEARCH JOURNAL
Table 12
Table 12 shows how that compares with eachteam's winning percentage.
The next year, 41 players were purchased or signedas free agents at the major league leveL Table 14shows their MPR breakdown.
1..5,435 93.4 .474.379 59.6 .382,400 38.2 ,412.250 34.0 .322
Table 13
Players 1 1..5 1..
Total 36 11.1 32.9 39.1Angels: 7 6.5 16.6 22.8Senators: 2 0.1 0,4 0,4
Years following draft
Angels: 17.7Senators: 16,4Colts: 17.5Mets: 4.5
The Colts did better than expected given their me..dium.. range draft results, much of this due to theiremerging farm system. Normally, it took about fiveseasons for a young player to work his way through
the minors and make an impact on the par..ent team, but by the end of their secondseason the Colts featured the first all ..rookieline .. up. And it wasn't just a gimmick-in..eluded in that line .. up were future all .. starsJoe Morgan, Jimmy Wynn, Rusty Staub andJerry Grote.
But in the first few years at least, anexpansion team can count on little help from home..grown talent. The only other significant source ofplayers available during that period are free agents(which back then meant players who had been re ..leased) and players for sale. It's impossible to knowwhat players, given enough money, could have beenpurchased, but we do know what players were soldand what free agents were signed. This gives us agood idea of what talent, apart from the expansiondraft, was available to the new teams. From the A.L.draft to the end of the 1961 season, 36 players werepurchased or signed as free agents at the major leagueleveL Table 13 shows the MPR breakdown.
1++27.3
~ 7.0~14.3
~1.0
Table 10
MPR obtained lost difference
1 1..5 1+ 1 1..5 1+ 1 1..5Angels: 3,4 28.3 29.7 0.9 1.8 2,4 +2.5 +26.5Senators: 5.6 18.3 18.3 3.8 22.3 25.3 +1.8 ~4.0
Colts: 1.5 5.6 5.6 8,4 19.7 19.9 ~14.1
Mets: 0.8 0.8 0.8 0.5 1.8 1.8 +0.3 ~1.0
It's a little surprising how little trading the Metsdid. Immediately following the draft, George Weiss,the president of the Mets, looked over the roster ofhis 22 selections and told the press:
Please don't think that this is the line ..upwhich will open the season. Trades andmoney will change it. I'd say two .. thirds ofthis group will be with us in spring trainingin St. Petersburg.
A look at these trades goes a long way to explain..ing why the Colts didn't do better during theirinaugural season. They sent their most valuableshort.. term talent, Ed Bressoud, to Boston for a disap ..pointing Don Buddin. They swapped Bobby Shantz,another of their best picks, to the Cards for two play..ers who between them had 0.1 MPR wins left in theircareers. While at the other extreme, the Angelsswapped a group of players like Jim McAnany, TexClevenger and Ken Hamlin for three future all ..stars:Leon Wagner, Billy Moran and Lee Thomas.
The new teams traded 16 of the drafted players be ..fore the end of their first season. Table 10 shows howthey did in those trades.
As it turned out, 21 of the 22 players would playnext season for the Mets. Only Lee Walls, sent to theDodgers along with a bucket of cash for Charlie Neal,would be dealt away prior to spring training. Eventu..ally, the Mets would start dealing, trading away mostof the medium.. range talent they drafted. FelixMantilla, Al Jackson and Bob Miller would all havetheir best seasons elsewhere. Of their combined 21.4MPR wins, all but 1.9 of tllern would come for otherteams.
If you adjust the earlier chart of the talent draftedby each team to account for the trades made duringthe first year, you get the figures in Table 11.
Table 11
Years following draft
1Angels: 17.7Senators: 16,4Colts: 17.5Mets: 4.5
1..5 1+93,4 129.959.6 63.138.2 47.334.0 54.1
Table 14
Players 1 1..5 1..
Total 41 16.9 45.7 68.2Mets: 11 4.8 7.3 7.9Colts: 6 3.1 10.1 21.6

THE BASEBALL RESEARCH JOURNAL
Table 15 shows the players who were the top fiveplayers sold or signed as free agents.
An asterisk means that the player was picked up byan expansion team.
Relief pitchers comprised the bulk of the long ...range talent. With the exception of the Angels' TomMorgan, all of the valuable relief pitchers (Kline,McMahon and Drabowski) had their best season withother teams.
More talent was moved in this fashion during theMets and Colts first year than during the Angels andSenators. So once again, the N.L. teams' poor show...ing doesn't seem to have been due to a lack ofavailable talent. But it also should be noted that pur...chases and free agents were a much thinner source oftalent in both years than the expansion draft.
And while the Angels' domination in purchasingplayers and signing free ... agents is a little deceptive(they did let Ron Kline get away before his best sea...sons), this was yet another category in which theyexcelled. How well could've they done with an all ...knowing general manager?-probably not that muchbetter than they did. To be sure, some of it was dumbluck. At the conclusion of the draft, the Senatorswanted to add a fifth outfielder. They offered FredHaney a list of 3 or 4 unfamiliar players to pick fromin exchange for Joe Hicks. "Well, I don't know whoto take," he said. "Hell, I'll take a chance onChance."
Of course the team could've been improved. Anomniscient general manager probably would'vepicked up Dick Donovan and Chuck Hinton (bothlate picks by Washington), who, considering theiroutstanding 1962 seasons (Donovan winning 20games and Hinton hitting .310), would've made theYankees even more uncomfortable that summer. Asit was, the Angels found themselves in a pennant race
Table 15
1960.. 1961:
61*Tom Morgan 3.5*Ron Kline 1.5Dick Brown 1.1*Rocky Bridges 0.9
Chuck Essegian 0.8
1961 .. 1962:
62Robin Roberts 3.5*Don McMahon 3.0*Richie Ashburn 2.3Joe Nuxhall 2.0*Frank Thomas 1.6
61 ..*Ron Kline 15.4*Tom Morgan 4.9Dick Brown 3.8Ed Rakow 3.3
Wes Covington 2.9
62..*Don McMahon 21.5Moe Drabowski 15.2Robin Roberts 11.2Joe Nuxhall 6.8*Richie Ashburn 2.3
during their second season, something no other ex ...pansion team has been able to accomplish in any oftheir first four seasons.
Just as it's hard to examine all the blunders madeby the Mets during their first season and imagine anfirst ...year team doing a worse job, it's not easy to lookat what the Angels accomplished without regarding itas an upper... bound on the amount of short ... term suc...cess an expansion team can enjoy. What's amazing isthat, picking from similar groups of players, and withonly days to prepare instead of a year, the Angels wereable to win 65 more games over the first two yearsthan the Mets.
In 1968, both leagues would expand again. Therules would be different, with the established teamsproviding lists of protected (rather than available)players, but once more the A.L. teams would be farbetter than their N .L. counterparts. The Kansas CityRoyals, while not matching the immediate success ofthe Angels, would end up with the best five ... yearrecord of any expansion team. It wouldn't be until1976 that the American League would have truly aw...ful expansion teams, when the Blue Jays and Marinerswould enter the league and approach, but not reach,the five ... year record of futility set by the Mets andColts.
Unfortunately, a similar analysis of how these laterexpansion teams did is not possible at present. Theprotected lists were never entirely leaked to the pressas the first (and the most recent) ones were. And thepassage of time (25 years in the case of the 1968 ex...pansion) hasn't made the league offices any morewilling to declassify this information. So for the timebeing, we don't know just how good the Royals (orthe Expos or the Mariners) could've been-whetherplayers like Dick Allen or Ray Culp were overlookedor whether they did as good a job as possible with themeager talent made available to them.
Notes:
1. Total Player Rating (TPR), used by Thorn and Palmer in Total
Baseball, measures a player's value (expressed in wins) over an average perfor,
mance at his position. A team consisting entirely of players with TPRs of zero
would be expected to win about half their games. By itself, then, this is not a
particularly good indicator of talent since it treats an average player as having no
value.
What's missing from the formula is the difference between an average
player (again expressed in wins) over a replacement,vaille pl8yer. This should take
into account service-an average player who played regularly should be more valu,
able than one sitting on the bench. For simplicity, I h8ve me8s11red service in
~-------------<~J---------~-

THE BASEBALL RESEARCH JOURNAL
terms of plate appearances for position players and a combination of innings
pitched and relief appearances for pitchers. In order to determine the formula, I
assumed that a team consisting entirely of replacement,value players would have
a winning percentage of .350. I used the performance of first,year expansion teams
as a rough approximation of this.
Over the course of a season, then, a team consisting entirely of play,
ers with TPRs of zero would win about 25 more games than a team of
replacement,value players. Figuring about 13 of those wins would come from the
position players, who'd have about 5600,6000 plate appearances a year (depend,
ing upon the use of the DH), I gave all position players credit for one win for each
450 plate appearances. The pitching wins were also divided up rather arbitrarily;
assuming 1450 innings and about 200 relief appearance a year, I gave all pitchers
a win for every 160 innings pitched and another for every 80 relief appearances.
These wins were added to the player's TPR to yield his Marginal Player
Rating (MPR). For this study, I converted all negative MPRs to zero. A negative
MPR simply means that the player was worse than a replacement,value player at
his position (not uncommon for an expansion team) and I didn't want to treat a
terrible player who played regularly as worse than an inferior player cut during
spring training.
2. Where more than one player was suggested as the other "premium" player (for
example, Don McMahon and Bob Taylor from the Braves), I have averaged their
MPRs.
3. The players swapped by the Angels and Senators immediately following the
draft are included in the A.L. figures.
No KiddingAs the 1994 baseball season recedes into the record books, it may be of interest to say a few words about one of the
game's great unsung heroes. I am referring to Juan Ponce de Leon, who was born in Madrid in 1460, broke into pro...fessional baseball in 1874 at an age when most players are well past their primes, played intermittently with the National,American, Federal, and other leagues over a 69 ...year period, and died in St. Augustine, Florida in 1963 at the ripe oldage of 503.
Juan (a.k.a. Kid de Leon, the Castilian Kid and Kid Madrid) was a pretty fair ballplayer, with a batting average of.306, 992 RBIs, and 235 stolen bases in 19 seasons played. However, his amazing vital statistics alone would be enoughto enshrine him among baseball's (near... ) immortals, not to mention the fact that he was probably the first player ofHispanic descent to make it in the big time ~ Why did the Kid wait so long before launching his career? First of all, as everyschoolchild knows, he spent his early years searching for the legendary Fountain of Youth . .(Indeed, there is some evidencethat he actually found it.) It should also be remembered that the game of baseball was not invented until de Leon waswell into middle age. (A persistent report that he was seen in his mid...200's with a Spanish Triple A team was discred...ited a long time ago.)
I came upon this astounding information recently while leafing through the huge Total Baseball encyclopedia, whichgives Kid de Leon's complete stats for illustrative purposes on page 631 in the section explaining the use of the all... timeplayer register. Some skeptics will probably come forward to claim that the whole thing is just a put...on, and it is curi...ous that the Kid doesn't appear in the actual register. However, the two men who put Total Baseball together, John Thornand Pete Palmer, are well known as serious...minded, dedicated baseball scholars, and it hardly seems likely that they wouldattempt to perpetrate a hoax of such magnitude on their readers.
-Louis JayHerman

Alonso Perry in theDominican Republic
A dominant force
Jose de Jesus Jimenez, M.D.
Baseball in the Dominican Republic beganin1891, when a group of Cuban sportsmen headed bythe brothers Ignacio and Ubaldo Aloma introducedthe game in the country.
In the first 29 years of this century, short series wereplayed among local teams. At times, we were visitedby professional teams from Cuba and Puerto Rico.There was no professional baseball from 1929to 1935starting again in 1936. In 1937, great baseball came tothe D.R., when a group of stars from the NegroLeagues in the U.S., including men like LeroyMatlock, Satchel Paige, Joshua Gibson, LazaroSalazar, Martin Dihigo, and Sam Bankhead visitedthe country. The Dominican capital was representedby the team "Ciudad Trujillo". This team won the 36..game season championship. Other teams were"Aguilas Cibaenas" (The Eagles) from Santiago andthe Estrellas Orientales (Oriental Stars) from SanPedro de Macoris. The "Ciudad Trujillo" team was afusion of the two traditional teams in our capital:Licey and Escogido.This fusion did not last long. Infact, after 1937, there was no professional baseball inthe D.R. until 1951.
That year, the summer season lasted from May 5 upto September 24, with teams in Santo Domingo, inthe capital (then named Ciudad Truj illo)-with bothLicey and Escogido, in Santiago, with the Eagles, andin San Pedro de Macoris with the Oriental Stars.
Jose de Jesus Jimenez, M.D. is a SABR member who lives in theDominican Republic.
From 1951 through 1954, the season was dividedinto two rounds of 27 games each. The winners of thefirst and second rounds had to face off in the final se ..ries in order to decide the national championship.Games were played Saturday afternoon and Sundays:one in the morning and the other in the afternoon.
Alonso Perry, a 6'3", 200.. lb. veteran of the NegroLeagues played his first Dominican profession game asfirst baseman and cleanup hitter for Licey. In his firstgame he got no hits, but from then on he connectedfor one or more in 27 straight games, a record for Do..minican baseball. He ended the regular season at .400(36 ..for 90), with nine homeruns. In the final seriesagainst Escogido, he was named Most Valuable Playerafter connecting in five straight·games, deciding thelast contest with a grand slam.
In 1952, Perry played the full season, batted.327,and lead the league with 11 homeruns. Licey lost thefinal series against the Eagles four games to three.
In 1953, Perry set a still .. standing record of 53 runsbatted in. He was also leader in homers (11) and sto..len bases (16 )-only time in anyone has everaccomplished that double in the D.R. In the final se..ries between the Eagles and the Licey Tigers, Perrywas the leader in batting: 8 hits in 21 at bats for anaverage of .381. The series was finally won by the" Ti..gers four games to one.
Perry again led the league in 1954, with an averageof .336, and he carried his team to the final seriesagainst the Estrellas Orientales. The series was wonby the Stars.

THE BASEBALL RESEARCH JOURNAL
In 1955, Dominican baseball became affiliated withOrganized Baseball, and became winter baseball,sometimes played, for the first time, under lights. TheDominican League of Professional Baseball was ere ..ated. The teams were the traditional ones: Aguilas,Licey (Tigers), Escogido and Estrellas Orientales. Theaffiliation with organized baseball in the UnitedStates, and the switch to winter ball allowed the Do..minican teams to bring many more excellent playersfrom the u.S.
In1955, the modern stadium "Quisqueya" was inau..gurated in our capitaL The 1955 ..56 season started onOctober 23 and finished February 5, 1956. There wasa single regular season, then with a semi..final seriesand finally, the winner of the semifinal series had toface the winner of the regular season. In that inaugu..ral season, Perry batted .325 and was leader in doubleswith 12.
Perry had an off..year in1956 ..57, and many Licey
fans started to think that the old idol was reaching anend. But Perry came back to win the batting title thenext year, with an average of .332. His last season inDominican baseball was 1958..59. This time playingwith the Estrellas Orientales, his total of 49 homersset a record that stood until Ricardo Carty hit 50 in1973 .. 74. Perry is considered the non.. Dominicanplayer with the best career in the history of Domini..can basebalL His final batting average was .310.
Perry was born in Alabama in 1923. He played inthe Negro Leagues in the U.S. from 1940 to 1950. Hewas originally a pitcher, but was later switched to firstbase so that his potent bat would be in the lineup ev..ery day. He never played in the major leagues, as hecertainly would have if he'd been white. He alsoplayed in Mexico from 1955 until 1963. WithDiabolos Rojos in 1956, he won the Mexica,n Leaguetriple crown: 392 .. 28 .. 118.

The DiMaggio Streak:How Big a Deal was It?
Other players actually had a better chance
Charles Blahous
Joe DiMaggio's 56-game hitting streak is rightlypraised in song and story as a herculean feat of consis ..tency. And yet I would be willing to wager that fewrecognize just how improbable, how flukish thisachievement was, even for the great DiMaggio. Inthis article I want to pose and to answer the question,"Even given the high level of performance establishedby Joe DiMaggio in 1941, how unlikely was it for Joeto put his hits together in a way that produced a 56..game streak?" And, once we answer that, to ask, "Isthere anyone who actually would h.ave llad a betterchance, statistically speaking, to produce tllis as ..tounding result?"
Mal')' sraristic iarts h.ave allelnpL~d Lu csthllatc tll~
illlprobability of Di~1aggio'shitting streak using thefrequel1cies of occurrence of h.it6 tb.rougllout baseballas a basis. Of course, the likelihood of such a streakvaries dramatically as a function of hit prohnhility perat bat (hatting average), such that the chances of a.250 hitter putting such a streak togetller are l1egli ..gible wh.en compared to a .375 hitter. DiMaggio'schances of putting together such a streak were greatlyenhanced because he was aile of th.e leadillg l1ittersfor average in the game. Given the quality ofDiMaggio's hitting in 1941, and the large numbers ofat bats afforded him by being in the middle of the
Charles Blahous lives in Alexandria, Virgi·nia.
Yankee lineup, how likely was the streak in purelystatistical terms?
For the purposes of this study we will ignore walksand hit batsmen, and other plate appearances inwhich an at bat is not assigned, instead of trying toestimate the chances that DiMaggio had to turn awalk into a hit. Since hits can only occur in plate ap..pearances in which an at bat is charged, we can definehis opportunities for hits as being his at bats, eventhough in some unquantifiable sense, this is not true.However, given. tllat we are 011ly tryirlg to IIlcasurethe unlikelihood of h.is llits beillg arraI1ged ill suell away as to produce a streak, and are not interested in
L',~~,I,"JU.'""''''J6. tIle lOlalllulubcr uf llits, taking Oil\1aggiois.357 average as an assigned frequency of hit produc~
tion, this is all U6SUlllpticHl consistent ~vil.h OUT uinuLA player's chances of getting a hit in a game are a
tlJnction of t\VO things: his RllcceFlR rote per at bat, undhis number of at bats. Joe's chance of getting a hit in1941 was .357 per at bat, wllicl1 is to say tllat 111S
chance of making an out was .643. In a given numberof at bats, his chance of getting at least 011e l1it is,conveniently, Olie InillUS l1is cl1a11ce of gettirlg nohits. Thus, we simply take his chance of not getting ahit, .643, and raise it to the power equal to the num..ber of his at bats. In 1941, Joe averaged 3.89 at batsper game, meaning that his chance of going withoutduring each game was 0.179. Ergo, in each game, Joe'schances of getting at least one hit were 82.1 percent.
If your chances of getting at least one hit in eachgame are .821, your chances of getting at least one hit

THE BASEBALL RESEARCH JOURNAL
You can easily see how minor fluctuations in bat ...ting average can cause large differences in a player's
in each of a span of 56 games is .821 to power 56, or.0000160. That represents Joe's chance, given a 56 ...game span, of getting at least one hit in every game.
Now, Joe played 139 games in 1941, meaning thathe had 84 56... game spans. His chances of putting to ...gether a 56 ...game streak in anyone of them is, again,one minus his chances of never getting a 56 ... gamestreak. This amounts to .00134, which is to say thatJoe had a 0.134 percent chance in 1941, given his.357 average and total number of at bats, of hitting in56 straight games.
One way to put this in perspective is to note howmany identical 1941 seasons Joe would have had toplay before he would have had an even... moneychance of putting together a 56 ...game streak. Takingthe chances of his failing to put together such astreak, and raising them exponentially to the numberof seasons played, you get into the 51 7th season be ...fore Joe's chances of doing it somewhere along theway are better than 50...50.
N ow, bear in mind that Joe has to play each ofthese seasons at the level that he established in 1941.Even the career... average ... level Joe DiMaggio wouldhave to play for much longer to have a 50...50 chanceof turning the trick.
It should be obvious from the above derivation thatJoe DiMaggio, great player that he was, was not themost likely man to produce a 56 ... game streak, at leaston the basis of probability. Perhaps he alone had theconsistency and temperament to pull it off. Yet, thereare a number of other twentieth...century players whohad seasons with a better chance to do it than Joe,thanks to their high batting averages and at bats pergame. A list of some strong candidates follows:
PlayerNap LajoieTy CobbTy CobbGeorge SislerGeorge SislerRogers HornsbyRogers HornsbyAl SimmonsLefty O'DoulBill TerryJoe DiMaggio
Yr.19011911191219201922192219241925192919301941
Avg..426.420.409.407.420.401.424.387.398.401.357
YrsChance to
of Streak 50~50
18.9 percent 412.4 percent 6
4.6 percent 158.7 percent 8
15.6 percent 55.3 percent 134.5 percent 165.8 percent 126.4 percent 116.7 percent 110.13 percent 517
chances of putting together a long streak. Batting av ...erage is clearly the most important factor, closelyfollowed by at bats per game, and finally by number ofgames played (streak opportunities).
You may find it incredible that Nap Lajoie'schances of putting together a 56 ...game hitting streakin 1901 were almost one in five. Your instincts areright. There is a fallacy underlying these figures thatwe have yet to analyze.
The above data assume that the batter plays hisgames in perfectly consistent conditions. But ofcourse, Joe DiMaggio did not receive 3.89 at bats inevery game of 1941. Sometimes he had five, andsometimes only two. This has a large effect on aplayer's chances to put together a long streak, for thesimple reason that a two at... bat game takes away fromhis chances more than a six at ...bat game adds to them(already, at five at bats, chances of getting one hit arevery good, and are not significantly added to in thesixth at bat, whereas failure to get a third chance isstatistically likely to be crucial). The further we strayfrom perfect at ...bat consistency, the more a player'schances diminish. Indeed, even moving from 3.89 tothe real ...world discrete figures of three or four at batshas a detrimental effect.
Nap Lajoie is listed as having 4.15 at bats for everygame in 1901. Suppose, in a given 56 ...game streak, hehad one game with two at bats, 11 with three, 28 withfour, 12 with five, three with six, and one with sevenat bats. Normally, with perfect at ... bat consistency, hischances of a streak over those 56 games would be0.276 percent. The variation in at... bat numbers by it...self reduces the result to 0.107 percent, reduces hischances during the season of having such a streakfrom 18.9 percent to 7.7 percent, and increases thenumber of years from four to nine that he would haveto hit .426 in this manner to have a 50 ...50 shot.
Nine years may not seem like a long time to have toplay before the 56 ... game streak becomes an even...money proposition, but, of course, no one has ever hit.426 over nine years, and it's highly unlikely that any...one ever will. It is further testimony to DiMaggio'sachievement that, even when Lajoie was hitting atwhat seems like an now unattainable pace, thechances were more than 90 percent against him.
Still, Lajoie's streak potential does seem very high,perhaps unrealistically high, given the curious factthat Total Baseball does not list him as havingachieved even a 30 ... game hitting streak in 1901,which he would have been overwhelmingly likely todo at at least some point, even with random fluctua ...tions in his at bats per game. In every game, on

THE BASEBALL RESEARCH JOURNAL
average, that Lajoie played that year, he had a full 90percent chance of coming away with at least one hit,making a 30... game streak quite likely at some point.His failure to be listed as having one may seem a bitodd. It is worth noting that the next best "streak can...didates, " George Sisler in 1922 and Ty Cobb in 1911,had hitting streaks of 41 and 40 games, respectively.
Lajoie's record is particularly problematic in view ofthe fact that Murphy's biography of Lajoie lists him ashaving a .422 average for 1901 instead of the .426credited him by Total Baseball. Moreover, evenMurphy's figure is higher than that supposed for sometime, until an error in Lajoie's record was rectifiedand nine hits were restored to him. In short, the lackof a long streak is not the only way in which Lajoie'srecords for 1901 are a bit unusual. This and the factthat in the American League of 1901, a foul did notcount as a strike, means that the reader may be justi ...fied in viewing Ty Cobb, George Sisler, and RogersHornsby as the twentieth...century players most quali ...fied to hold this particular record. That DiMaggio, orfor that matter Pete Rose, possesses a streak longerthan Sisler's or Cobb's, is an astounding feat of con...sistency and concentration.
The discerning reader may wonder how these cal ...culations take proper account of the influences ofpitching and opposing defense, the latter factor per...haps particularly coming to mind in view of the waythat DiMaggio's streak came to an end. In a sense, ourcomputations took these factors into account whenwe accepted DiMaggio's .357 batting average as agiven commodity. That batting average resulted froma complex interaction of DiMaggio's hitting abilitywith the skill of the pitchers he faced, as well as thedefenses arrayed against him. Since we know the cu...mulative result of those interactions, and are merelytrying to figure the likelihood of the hits being ar...ranged in a certain way, we do not need to know howthey worked together to produce the .357 resultthat is, so long as we assume· that DiMaggio had thesame chance of getting a hit in each of the 56 games.
In the real world, as we have seen, DiMaggio didnot have the same chance in every game, due for ex ...ample, to the differing number of at bats from game togame. When we face this reality, we also lose theluxury of ignoring the specific influences of pitchingand other factors. Just as it matters, for example,whether DiMaggio had two four at..bat games or oneeach of two at..bat and six at ... bat games, it also mat ...ters whether he faced the better pitcher in the twoat ... bat versus the six at..bat game, as his hit chanceswould be affected accordingly. If we were to estimate
--ICDZ
Nap Lajoie
DiMaggio's streak chances with perfect rigor, wewould have to know not only the opposing pitchers'statistical profiles, but also the precise way in whichpitchers' and fielders' skills worked together withDiMaggio's abilities, to affect his chances in every atbat. Although game designers have over the years as ...sumed that offensive and pitching/defensive statisticseach contribute exactly 50 percent to the statisticalprofile associated with every at bat, this is an assump ...tion, not a known fact. Instead of risking theintroduction of a new error based on that assumption,I have chosen to accept the errors of approximationresulting from ignoring specific influences of pitchersduring the streak.
During his 56 ... game hitting streak, DiMaggio hadthree games with two at bats, 11 with three, 26 withfour, and 16 with five. A .357 hitter, with that distri ...bution of games, would have had a 0.00000796chance of getting at least one hit in everyone ofthem. Over the course of the season, DiMaggio, with84 such chances to have streaks, would have had a0.0668 percent chance of coming up with one byseason's end.
What this all means is that Joe DiMaggio, given his.357 batting average and the at~bat chances that hereceived, did something that he shouldn't have beenexpected to do unless he hit that way for 1,038 years.Given the infrequency today with which any battershit even .357, it looks like DiMaggio's mark may bewith us for a long, long time.

Baseball Axiom No. 22
All generalizations about nineteenth...century pitching are false ...including this one
Robert E. Shipley
Timothy John Keefe, a most versatile nineteenthcentury hurler, won 342 major league games between1880 and 1893. Of these 342 wins, six were achievedwhile lobbing underhand from a 4.. ft. by 6.. ft. boxwith its front line located 45 from home plate, 35while tossing underhand from a 4..ft. by 6..ft. box withthe front line 50 feet from home plate, 110 whilethrowing sidearm and overhand from this same 4..ft.by 6..ft. box, 42 while firing overhand from a 4..ft. by7..ft. box with its front line located 50 feet from home,122 while hurling overhand from the back line of a 4..ft. by 5,1/2,ft. box with a front line located 50 feetfrcnn 11oule; 17 \.vhile pitcllilig OVel'llarld frulu tIleback line of a 4..ft. by 6,..ft. box vvith the front line 10'cated 11 feet from home, and 10 while flinging''''l,.:rll~'.'I'''lnnd frrnTi fI pilcllillg :,lab located 60 sixinches from home plate.
ConJusin,g? Try this.Timothy John Keefe, a nineteenth..century Hall..of..
Fanler, Wall 342 gaInes between 1880 and 189.3. Of342 \\ri!1S, 193 Vlcrc achh~ved during Y~flrs "vhJ~n
the batter could call for pitch locations either abovethe waist and below the shoulders (High) or belowthe vvaist and above the krlccs (tow); 149 wereachieved during years when the batter erljoyed 110such privilege.
Robert E. Shipley lives in Aston, Pennsylvania
Or this.Timothy John Keefe, a nineteenth..century star who
pitched in three major leagues between 1880.. 1893,won 342 games. Of these 342 victories, six occurredwhen three strikes were needed for a strikeout andeight balls for a walk, 155 happened when threestrikes were needed for a strikeout and seven balls fora walk, 32 took place when three strikes were neededfor a strikeout and six balls for a walk, 35 wereachieved when four strikes were needed for a strikeoutand five balls for a walk, 35 also were achieved duringCOl1ditions where three strikes were 11eeded for astrikeout and five balls for a walk, a11d 79 were gahiedwhen three ~trik~s ~qllrllled a st'rikeC1LLL c.uuJ four ballsil willk ..
Tl'le POilll uf LIds LJl1uslHJllituny is simply to illustrate what a strange and alien terrain1,il1~tF"F"lltll"Cl.:l1Llll'Ybasl:Lal1 is for the modcrli fali.period of constant experimentation and change, itdoes not lend itself to superficial description or analy-sis. Fittlllg 11(JIle of our /"''I··\..U'l''11f''.'t~r8
regarding the sport, it must be analyzed and investi ..gated on its own terms and in sufficient detail toelisurc tllatwe ate accurately Jescribil1g alid ul1der..starldirlg what actually occurred at the particular timeunder study.
No facile generalizations can be made about base ..ball duril'lg tl'le 11i11eteelltll century. The period wasjust too dynamic and fluid to allow for this. One couldeven argue that there was no one phenomenon thatcould be justly labeled as nineteenth..century base ..
THE BASEBALL RESEARCH JOURNAL
ball.Unfortunately, many researchers and statisticians
have instead approached the topic of nineteenth~cen~tury baseball as if it were a static universe, a monolithwith little variation or nuance. How else to explainthe plethora of topics and lists such as "Nineteenth~
Century Stars," "Nineteenth~Century PitchingLeaders," and "Nineteenth~CenturyBaseball" that re~
verberate through the literature. The main variationthat is sometimes allowed is the infrequent division ofthe nineteenth century into pre~1893 vs. 1893~1899(or 1893~1900) periods in recognition of the modernpitching distance of 60 feet, six inches beginning in1893. While a good start, this framework is alsodoomed to miss much of the richness and nuance ofthe age-especially with regard to the 1880s, themost dynamic period of experimentation and changein baseball history.
Nowhere is this variation and dynamism more ap~
parent than in regard to pitching rules andconditions. As Henry Chadwick frequently stated inthe annual Spalding guides and elsewhere, majorleague rules committees were constantly attemptingto legislate a balance between pitching and hitting.They quickly learned that the easiest way to do thiswas to affect pitching conditions by changing basicgoverning rules. While most pitchers did not surviveas long nor through as many rule changes as "Sir"Timothy Keefe, any nineteenth~centuryhurler whopitched for more than one season faced some versionof "future shock" when he stepped into the pitchingbox or OIl tIle slab for the first time each spring.
It must have heen oifficll1t for l1urlers ",f tll~ Jay tokeep all of tile cllanges straight. It is even more diffi ...cult for the mocl~rn stlldcllt c.f tIlt: game to keepeverything in ch.rollologicul (urld just plaitl logical)order. Secondary source material, some of it writtenby exceptional baseball scholars who have forgottenmore about the game than most of us WIll ever know,often contradict one another, and sometimes eventhemselves, concerning ninet~en.th~centllry rulechal1.gcs and tIle years itl \V11icl1 tlley occurred. ?\1or~,'
over, SOUfc,es tllat do appear to be fairly cOlllplete aswell as factually accurate are usually not very easy tofollow, at least not for those like me w110 llave troublepouring mud out of a l1ikillg boot uiliess directionshave been printed on the heel.
My own personal solution to this situation appearsin the accompanying matrix chart entitled "PitchingConditions." I used Spalding and Reach guides to de~
termine the exact year, wording and result of all rulechanges that affected pitching significantly during
the nineteenth century. Using the chart, you can findthe basic pitching conditions for any given year.
While most of the logic of the chart is self~evident,
two further explanations are required. One, distancefrom home plate is expressed as what I call the "pivot"distance, or the approximate distance from thepitcher's pivot (back) foot to home plate. This avoidsthe problem of comparing apples and oranges and itestablishes a common baseline throughout the years.It shows the actual pitching distance for the yearsbetween 188 7 ~ 1892 when rules stipulated that thepitcher must plant his foot on the back line of thepitching box and then move forward only one step.The only point of confusion occurs for the years1876~ 1886 when pitchers could move within a box.For these instances I have assumed that the pitchersdelivered with their front feet as close to the frontline of the box as possible, so I assumed a pivot dis~
tance 3~1/2 feet behind this. Hence a pitcherthrowing from a box with a front line 45 feet fromhome plate would have a pivot distance of 45 feetplus 3~1/2 feet, or 48~1/2 feet. This column also pointsout several misconceptions about pitching distancethat have sometimes been perpetuated in the litera~
ture. Most obvious of these is the fact that the 1893change to 60 feet, six inches was an effective increaseof five feet, not 10 feet, six inches as is sometimesincorrectly stated. (And, as has been pointed out byothers before, the figure of "60'6"" was not asurveyor's error, but a logical increase of five feet fromthe existing standard.)
The second point is that some things that may havealso affected pitching COlldition:, hAve nut beeti i1'\-clllrled due to impact and spac:e \.:()I1Siderati()n~~ Forcxanlple, tll~ fact tliut nlost players Jid not wear'gloves ulltil LIte laLe 1880s or early 1890s is not in~
eluded 11ere. Neitller is tIle change in th,e ruleallowing an out for a foul hall caught on one bounce(J883~,NL; 1~~4.-UA; 1885~AA).Nor is t1le fact thatsubstitutions were not allowed except for injuries and,in some instances the cons~nt of t11e oppositlg team,until 1889 tvhen one: ((fr~t:''' substitUliUll Vias allo\veu.Nonetheless, all major rule changes tll,d COlldiliullSthat had a significallt inlpacl llave been includedhere.
On one level this matrix serves as another illustra~
tion of the complexities and variation inherent in thepitching profession during that era. On another level,however, it can be seen as a heuristic device, a start~
ing point if you will, for learning more aboutnineteenth century baseball through the use of com~paring and contrasting individual and league
----~--~----<0r----------

THE BASEBALL RESEARCH JOURNAL
performances for specific periods with common rulesand conditions.
The possibilities are abundant. A few examples:Who were the premier underhand pitchers throwingfrom a pivot distance of 48 .. 1/2 feet? From 53 .. 1/2 feet?Which pitchers fared better or worse as the number ofballs for a walk decreased? Which pitchers and hittersdid best in surviving significant rule changes? Howdid Hall ..of..Famers do in individual eras and how didthey survive major rule transitions? How did non..HOFers perform? Are there some who deserve morerecognition for excelling during certain specific eras?Beyond these descriptive comparisons, the more im..portant question of why some respondedcomparatively better to change than others could beaddressed. And finally, how were aggregate battingand pitching statistics affected by particular rulechanges?
I cannot hope to answer all of these questions here,nor will I try. However, I have prepared a short exer..cise to illustrate the promise of such an approach.Beginning with what I consider to be the two mostcritical conditions on the chart-"Pivot Foot Dis ..tance" and "Allowable Pitching Motion"-Iestablished five logical eras within which to comparepitching performances:
I. Underhand Delivery With Pivot Distance of 48 ..1/2 feet (1876 .. 1880)
II. Underhand Delivery With Pivot Distance of 53 ..1/2 feet (1881 .. 1882)
III. Shoulder Height Restriction/N 0 RestrictionDelivery With Pivot Distance of 53 .. 1/2 feet (1883 ..1886)
IV. No Restriction Delivery With Pivot Distance of55 .. 1/2 feet & 57 .. 1/2 feet. (1887 .. 1892)
V. No Restriction Delivery With Pivot Distance of60.. 1/2 feet (1893 .. 1900)
One could well argue for a different breakdownbased on the same criteria. For example, the first un..derhand category could be broken into twosubcategories based on the period of 1876.. 1877 whenpitchers threw more like softball pitchers today (be ..low the hip with no bent elbow) vs. 1878.. 1880 whenpitchers were allowed to throw more like Dick Hall orKent Tekulve (below the waist with bent elbow). Onecould also opt for a separate category called "ShoulderHeight Restriction with Pivot Distance of 53 .. 1/2feet" which would cover 1883 for the NationalLeague, 1884 for the Union Association and 1883 ..June, 1885 for the American Association.
I chose to do neither because the primary sources ofthe time frequently noted how difficult it was for um..
pires to enforce such motion restrictions. In his bookAmerican's National Game, Spalding noted that the"below the hip with no bent elbow" rule had to bechanged since very few pitchers could throw that wayand umpires therefore "permitted the unlawful deliv ..ery of the ball rather than stop the game anddisappoint the crowd." Spalding also noted thechange in 1878 to allow pitching below the waistcaused many pitchers to circumvent the rule by wear..ing their belts abnormally high. In regard to the 1883rule on allowing shoulder height deliveries, Spaldingnoted that this was subject to pitcher deception andthat it was "differently construed by different um..pires." In the 1884 Spalding guide, Henry Chadwickstated that by the latter half of 1883 umpires were lib ..erally allowing overhand pitching rather than theshoulder height restriction because it was difficult tojudge and enforce. (The penalty for disregarding therule in 1883 was only for the umpire to call a "foulbalk." Two "foul balks" in one inning gave the batterfirst base and advanced the runners one base.) Veryclearly, pitching motion restrictions were difficult todetect and enforce as long as they were not outra..geously obvious. It could even be postulated thatduring any period under consideration there werecertainly some pitchers who were "cheating" to thenext level-throwing sidearm in an underhand era,tossing overhand in the era of shoulder height restric ..tion, etc. Hence, I have chosen to lump similarmotions together.
A case could also be made for including conditionsexperienced under Player's League rules in 1890 as aseparate category since the pivot distance was effec..tively set at 57 feet as opposed to 55 .. 1/2 feet for theNational League and American Association duringthe same year. In this case I chose to set up just onecategory for the time period from 1887.. 1892 since theexperience of the Player's League was so short.. livedand affected so few pitchers.
Using these categories I then derived the top tenpitchers based on three different pitching statisticsWins, ERA, and Hits Per Game-for each. Theresults of this exercise appear in the chart entitled"Nineteenth..Century Pitching Leaders." Several pre..liminary points of interest are suggested by the chart.A few of them:
1. 16 pitchers achieved successful enough transi ..tions so that they made a list of top pitchers in at leasttwo different eras. Four made lists in three differenteras: Jim McCormick (non~HOF), Pud Galvill(HOF), Mickey Welch (HOF), and Tony Mullane(non..HOF).
---------~~1----------~

Pud Galvin
hand era. In addition to theaforementionedMcCormick, Galvin, andWelch, only HossRadbourn (HOF) and TonyMullane (non..HOF) madethe transition and kepttheir top ranking.Radbourn is something of aspecial case, since by mostaccounts he continued tothrow in the same subma..rine style throughout hiscareer.
4. Of the 18 top sidearm/overhand pitchers throwingfrom 53 .. 1/2 feet in GroupIII (1883 .. 1886), only sixmade it to top ranking in alater era: Mickey Welch,Tony Mullane, Tim Keefe(HOF), Charlie Buffinton(non..HOF), John Clarkson(HOF), and Bob Caruthers(non..HOF).
5. The top ranked over..hand pitchers from 55 .. 1/2feet to 57 feet in Group IV(1887 .. 1892) fared the leastsuccessfully of any group inmaking the transition to alater era. Of 19 pitchers inGroup IV, only three-allHOFers-made the transi ..tion successfully enough to60 feet, six inches to makea top ten list in the appli ..cable categories: KidNichols, Cy Young, and
achieved top ranking in one"--"t-'L-<l .. '-A, ...... }..... J and some didn't make it in~ allY
Cummings).deserve additional recogni ..
status, but at the very least forin baseball history. Most obvious are
who achieved top ranking inMcCormick (career: 265 ..214
(career: 284.. 220 .563). Ad..also be focused on at least three
their mark predominately dur..'-1. ..... '-.... """' ...... L-<l ............ eras: Tommy Bond (career:

THE BASEBALL RESEARCH JOURNAL
Mickey Welch
193 .. 115 .627), WillWhite (career: 229 ..166 .580), and LarryCorcoran (career: 177 ..89 .665). Vic Willis(career 249.. 205 .548),a Group V pitcher wholost a close vote a fewyears ago for the HOF,also deserve specialmention for achievingthe top ERA and low..est Hits Per Game ofany pitcher duringthose years.
Of course, you canargue that more logicaland meaningful cat ..egories and groupingscan be developed fromthe earlier rule/condi ..tion matrix than thefive groups I chose forthis preliminary analy..sis. And that is just fine. The matrix lends itself tointerpretation ~nd re .. interpretation. Its chief strengthis flexibility, not finality; it should serve to open de..
bate, not close it.Reality is almost
always more com..plex than the Zenpaintings we createin our minds to re ..duce the world tological and moremanageable propor..tions. So it is withthe world of nine ..teenth .. centurybaseball, and in par..tic u I a r,nineteenth..centurypitching. I hope theproposals noted herewill fall upon fertileground and open upnew opportunitiesfor research and in..
ffi terpretation. At thez
very least, the sub ..ject should not
again be broached without keeping in mind the abso..lute truth of Baseball Axiom No. 22-generallyspeaking, of course.
PITCHING CONDITIONS1876--1900
PIVOT ALLOWABLE PITCHING NO. OF NO. OF OTHER/RELATED
IYEAR FOOT PITCHING AREA STRIKES BALLS RULES (BY YEAR)
DISTANCE MOTION
1876 UNDERHAND 4 BATTER CALLS FOR
48'6" BELOW HIP 6'x 6' (BATTER HIGH OR LOW
WITH NO BOX GIVEN A 9 PITCH (1876,86)
1877 (45' TO BENT ELBOW. WARNING
FRONT OF (45' FROM STRIKE PITCHER CAN USE
1878 BOX; APPROX. HOME) BEFORE TWO,STEP DELIVERY
3'6" MORE FINAL IN BOX (187686)
1879 TO PIVOT UNDERHAND 4'x 6' STRIKE)
FOOT) BELOW WAIST; BOX UMPIRE CAN CALL

THE BASEBALL RESEARCH JOURNAL
1880 BENT ELBOW (45') 8 FOR NEW BALL AT
ALLOWED. END OF INNING
1881 (1882); ANYTIME
(1883PRESENT)
1882
53'6" HIT BY PITCH TO
1883 ANY MOTION W/ 7 FIRST (1884~1891
(50' TO SIDEARM AA; 1887~PRESENT
1884 AA FRONT OF SHOULDER 4'x 6' 3 NL)
BOX; APPROX. HEIGHT BOX
1884 UA 3'6" MORE RESTRICTION NO RAISED LEG IN
TO PIVOT (50' FROM WINDUP NL (1~01/2
1884 NL FOOT) HOME) 6 MONTHS 1885)
1885 AA 7 FLAT BAT ALLOWED
(1885~92)
1885 NL
6 BATTER CAN NO
1886 AA 4'x 7' BOX LONGER CALL FOR
ANY MOTION W/O (50' FROM HIGH OR LOW;
1886 NL RESTRICTION HOME) 7 (1887PRESENT)
1887 55'6" 4 PITCHER MUST KEEP
(END OF 1883 4'x 5'6" 5 FOOT ON BACK LINE
1888 (BACK LINE TO PRESENT BOX OF BOX AND MOVE
OF BOX) NL AND PL; (50' FROM FORWARD ONLY ONE
1889 7 JUNE 1885 HOME) STEP (NL 1887~92;
TO 1891~AA) PL1890)
1890 PL 57' 4'x 6' BOX
(BACK LINE) (51') DEFACING OF
BALL PROHIBITED
1890 NL 3 (1890 PRESENT)
55'6" 4'x 5'6" 4
1891 BOX PITCHER MUST KEEP
(BACK LINE (50' FROM FOOT ON SLAB AND
1892 OF BOX) HOME) MOVE FORWARD ONLY
ONE STEP
1893~ (1893 PRESENT)
1900 60'6" PITCHING
SLAB
(60/6")
~~.,.,.,.,.,.,., ....
NL = NATIONAL LEAGUE UA = UNION ASSOCIATION
~A AMERICAN ASSOCIATION PL = PLAYERS LEAGUE
19TH CENTURY PITCHING LEADERS
(MINIMUM 100 INNINGS PER YEAR AVERAGE)
WINS ERA HITS PER GAME
(1876 .. 1880)
1.78 LARRY CORCORAN NL
1. UNDERHAND DELIVERY WITH 48'6" PIVOT DISTANCE
TOMMY BOND NL 180 AL SPALDING NL
MONTE WARD NL 108 MONTE WARD NL 1.85 LEE RICHMOND NL
6.78
8.18

THE BASEBALL RESEARCH JOURNAL
8.19
8.82
9.02
9.02
9.11
9.17
9.20
9.32
8.08
8.30
8.64
8.93
9.07
9.28
9.46
9.50
9.60
9.67
MONTE WARD NL
JIM MCCORMICK NL
JIM DEVLIN NL
MICKEY WELCH NL
GEORGE BRADLEY NL
TOMMY BOND NL
WILL WHITE NL
AL SPALDING NL
WILL WHITE NL 93 JIM DEVLIN NL 1.90
GEORGE BRADLEY NL 89 LARRY CORCORAN NL 1.95
TERRY LARKIN NL 89 WILL WHITE NL 1.99
JIM MCCORMICK NL 70 JIM MCCORMICK NL 2.07
JIM DEVLIN NL 65 TOMMY BOND NL 2.11
PUD GALVIN NL 57 LEE RICHMOND NL 2.15
AL SPALDING NL 48 GEORGE BRADLEY NL 2.22
LARRY CORCORAN NL 43 TERRY LARKIN NL 2.44
II. UNDERHAND DELIVERY WITH 53'6" PIVOT DISTANCE (1881 .. 1882)
JIM MCCORMICK NL 62 DENNY DRISCOLL AA 1.21 DENNY DRISCOLL AA 7.25
LARRY CORCORAN NL 58 WILL WHITE NL 1.66 WILL WHITE NL 7.86
HOSS RADBOURN NL 58 H. MCCORMICK NL, AA 2.05 LARRY CORCORAN NL 7.91
PUD GALVIN NL 56 LARRY CORCORAN NL 2.1420 H. MCCORMICK NL, AA 8.04
JIM WHITNEY NL 55 TONY MULLANE NL, AA 2.1424 JIM MCCORMICK NL 8.30
FRED GOLDSMITH NL 52 HOSS RADBOURN NL 2.23 HOSS RADBOURN NL 8.32
GEORGE DERBY NL 46 JUMBO MCGINNIS AA 2.33 TONY MULLANE NL, AA 8.44
WILL WHITE NL 40 MONTE WARD NL 2.34 HARRY SALISBURY AA 8.46
LEE RICHMOND NL 39 JIM MCCORMICK NL 2.41 STUMP WEIDMAN NL 8.54
MONTE WARD NL 37 STUMP WEIDMAN NL 2.45 FRED GOLDSMITH NL 8.63
III. SHOULDER HEIGHT RESTRICTION/NO RESTRICTION DELIVERY WITH 53'6" PIVOT DISTANCE (1883 .. 1886)
HOSS RADBOURN NL 162 HOSS RADBOURN NL 2.09 TOAD RAMSEY AA 6.62
TIM KEEFE AA, NL 152 JOHN CLARKSON NL 2.10 LADY BALDWIN UA, NL 6.79
MICKEY WELCH NL 141 LADY BALDWIN UA, NL 2.15 TIM KEEFE AA, NL 7.26
PUD GALVIN NL, AA 137 BOB CARUTHERS AA 2.22 MATT KILROY AA 7.34
GUY HECKER AA 134 TIM KEEFE AA, NL 2.25 JOHN CLARKSON NL 7.50
JIM MCCORMICK NL, UA 120 HENRY BOYLE UA, NL 2.26 DAVE FOUTZ AA 7.53
TONY MULLANE AA 104 DAVE FOUTZ AA 2.31 BOB CARUTHERS AA 7.70
BOBBY MATHEWS AA 103 JIM MCCORMICK NL, UA 2.37 TONY MULLANE AA 7.83
C. BUFFINTON NL 102 TOAD RAMSEY AA 2.39 JOHN HEALY NL 7.92
JOHN CLARKSON NL 99 GUY HECKER AA 2.45 CHARLIE SWEENEY NL, UA 7.93
IV. NO RESTRICTION DELIVERY WITH 55'6" & 57' PIVOT DISTANCE (1887 .. 1892)
JOHN CLARKSON NL 204 KID NICHOLS NL 2.50 AMOS RUSIE NL 7.36
SILVER KING AA, P, N 179 CY YOUNG NL 2.53 JACK STIVETTS AA, NL 7.70
GUS WEYHING AA, P, N 177 BILLY RHINES NL 2.66 ED STEIN NL 7.83
BOB CARUTHERS AA, NL 141 SILVER KING AA, P, N 2.845 TIM KEEFE NL, PL .89
MARK BALDWIN N, AA, P 140 JOHN CLARKSON NL 2.846 PHIL KNELL N, P, AA 8.02
TIM KEEFE NL, PL 139 TIM KEEFE NL. PL 2.847 BILL HUTCHINSON NL 8.07
BILL HUTCHINSON NL 139 BILL HUTCHINSON NL 2.87 TONY MULLANE AA, NL 8.14
E. CHAMBERLAIN AA 131 TONY MULLANE AA, NL 2.93 MICKEY WELCH NL 8.21
C. BUFFINTON N, P, AA 129 MICKEY WELCH NL 2.96 KID NICHOLS NL 8.24
TONY MULLANE AA, NL 124 JESSE DURYEA AA, NL 2.97 CY YOUNG NL 8.26
V. NO RESTRICTION DELIVERY WITH 00'0" PIVOT DISTANCE (1893 .. 1900)
KID NICHOLS NL 218 VIC WILLIS NL 3.07 VIC WILLIS NL
CY YOUNG NL 214 AI'v10S RUSIE NL 3.08 CY SEYMOUR NL
BRICKYD. KENNEDY NL 161 JESSE TANNEHILL NL 3.16 AMOS RUSIE NL
PINK HAWLEY NL 154 KID NICHOLS NL 3.20 TED LEWIS NL
CLARK GRIFFITH NL 152 CY YOUNG NL 3.22 KID NICHOLS NL
TED BREITENSTEIN Nt 149 DOC: MC:JAMES NI. 1.14 DOC: MC:JAMES NL
AMOS RUSIE NL 140 CLARK GRIFFITH NL 3.40 TED BREITENSTEIN NL
OVETT ~1EEKIN NL 133 NIXEY CALLAHAN NL 3.~9 BILL HOFPER NL
GEORGE CUPPY NL 130 JACK POWELL NL 3.526 ED DOHENY NL
FRANK KILLEN NL 128 TED LEWIS NL 3.530 BILL HILL NL

Uncovering Satchel Paige's1935 Season
A summer in North Dakota
Scott Roper
Mny of the exploits of Leroy "Satchel" Paige arewell known. His two autobiographies, Pitchin' Manand Maybe I'll Pitch Forever, John Holway's dual biog...raphy of Paige and Josh Gibson (Josh and Satch), andother works are excellent sources for those who wishto learn more about Paige's career and to get a flavorof Paige's flamboyant personality. However, at leastone year in his career lacks substantial documenta ...tion, and the extent to which Paige dominated thebaseball scene during that season is nearly forgotten.This paper, therefore, is an attempt to shed some lighton Satchel Paige's 1935 season, which he spent play...ing semi ... professional baseball in Bismarck, NorthDakota.
Most of the information in this paper comes fromthe 1935 pages of the Bismarck Tribune, with supple ...mentary material originating in Paige's auto ...biographies. Unfortunately, not every game in whichPaige pitched was reported upon in the newspapers(at least three games are known to be missing). Still,I was able to compile a partial record of Paige's sea...son, and the record demonstrates the pitcher'simportance to Bismarck's drive to national promi ...nence.
The Challenge-In 1933, a local semi ... professional
Scott Roper lives in Tucson, Arizona, is a lifelong baseball fan, and coachesLittl.e League. He has been interested in the question of batting order since1966 and developed this model in 1990 using an IBM,-compatible 80486computer and programming in BASIC. He encourages comments viaCompuServe (ID# 73237,100).
team in Jamestown, North Dakota hired three well ...known African American players, Barney Brown andArt and Charley Hancock, to play on its otherwiseall ... white club. Although the move did not greatlyrevolutionize the state's semi ...pro sports scene-mostNorth Dakota baseball clubs had been integrated fordecades-the addition of Negro League stars didthreaten Neil Churchill, auto magnate, mayor of thecity of Bismarck and manager of his city's semi"'probaseball team.
To Churchill, the state baseball bragging rightswere at stake. He knew that he had to counterJamestown's roster moves, so he contacted AbeSaperstein, a promoter for the Negro Leagues, andasked for the name of "the best Negro pitcher in base ...ball." After negotiating with the PittsburghCrawfords, Churchill obtained the services of SatchelPaige, and Bismarck won the 1933 state baseballchampionship.
However, 1935 is the year most people remember'wIlerl tiley think of Satchel Paige in a Bismarck uni ...form. On March 24, 1935, fresh from 17 wins in aCalifornia winter league, Paige returned to Bismarck'sbaseball team for the first time since the 1933 statechampionship. Off the field, he and his new wifeJanet had their problems-for instance, the city'swhite landlords refused to rent them a place to live,so Churchill found them a place to live in an aban ...doned railroad bunk car. On the field, however, Paigewas the most important part of Bismarck's drive to the1935 national semiprofessional baseball champion...

THE BASEBALL RESEARCH JOURNAL
ship.
The Big Season-The sportswriters for the BismarckTribune expected Paige to lead the club to the "biggestbaseball season in [the team's] history." Aside fromPaige, the club's lineup initially included AndyAnderson at catcher, infielders Joe Desiderato, AlLeary, Red Haley, and Bob McCarney, and outfieldersBill Borlan, Gus Becker, and Mike Goetz. This was atbest a temporary lineup, for Churchill replaced manyof those players over the course of the season.
Bismarck opened the season on May 4 inJamestown. The Jamestown club had released all of itsAfrican..American players during the off.. season,choosing instead to field an all ..white team. (Some ofthe released players ended up on the Valley City,North Dakota team.) In the opening game, Paigepitched a brilliant five ..hitter, striking out 10, walkingone, and yielding only two runs. Unfortunately, apassed ball in the eighth and a superior pitching per..formance by opposing pitcher Ed Bradley won thegame for Jamestown, two to one. Paige avenged hisloss in the next game, a May 12 shutout overJamestown. He yielded only three hits, striking outfifteen.
During the month of May, Bismarck is known tohave played a total of twelve games, winning nineand losing three. Paige pitched in ten of those games,four as a relief pitcher, winning seven and losing one.He pitched 67.2 innings in that period, gave up 10runs (all earned), pitched three shutouts, walkedeight, struck out 93 batters, and gave up 29 hits. Paigeheld opposing batters to a .127 batting average,yielded three home runs, and boasted an earned runaverage of 1.33.
Of course, there were a number of highlights inMay that did not always reflect in the statistics. Forinstance, on May 20, the Bismarck Tribune reportedthat in one of Paige's relief appearances, "The DuskyAce itl llis usual colorful styIe toyed with theWilliston stickers, shooting an underhand ball andtaking things easy."
Paige hit home the winning runs in games againstValley City and Beulah, and pitched three innings ofno..hit relief in one of those games (striking out sevenof the nine batters he faced). He also pitched a one..hitter at Devils Lake, a team composed of ClevelandIndians minor leaguers, and won both ends of adouble ..header against the barnstorming House ofDavid team, a club which featured Grover ClevelandAlexander and Elmer Dean (brother of Dizzy andPaul).
Neil Churchill, knowing that Paige could not carrythe team alone, signed a number of other players tosupplement his pitcher. Notable among the newcom..ers were Vern "Moose" Johnson, a power hittingoutfielder from Sioux City of the Western League;Negro League veteran "Behoven" ("Lefty") Vincent;and Kansas City Monarchs catcher Quincy Trouppe.
Unfortunately, the Tribune did not cover some ofthe team's June games, so Paige's records for that pe..riod are incomplete. What is known is that Bismarckplayed at least 26 games, many of them in Canadiantournaments. Of those games, the club won 14, lost11, and tied one game. Paige pitched in 11 of thosegames, three in relief, winning six, losing one, andpitching to a tie in another. Two of Paige's games wereshutouts, including an eight.. inning scoreless tieagainst Chet Brewer and the Kansas City Monarchsin Winnipeg, a game in which Paige struck out 18Monarchs batters. Paige was shelled once in thatspan, giving up six earned runs in a June 23 game ver..sus Valley City.
Paige was up to his challenges in June. Accordingto the Tribune, "(Chet) Brewer has boasted that hewill defeat Paige every time the Capital City coloredace opposes him on the mound but Paige says, 'it justcan't be done.'" To back up those words, Paige de ..feated Brewer and the Monarchs on June 16, 2.. 1,allowing only two Monarchs runners as far as secondbase. Much of that credit belonged to QuincyTrouppe, who threw out three runners attempting tosteal second base.
Bismarck's July record was much improved over itsJune record. The club is known to have played at least34 games, winning 26, losing six, and tying one. Someof this improvement can be credited to NeilChurchill's player additions. Churchill signed pitch..ers Barney Morris and Harold Bates in June, allowingPaige added rest and Churchill to release "Lefty"Vincent, who was suffering from a tired arm. In July,Churchill signed Negro League veteran Hilton Smith,first baseman Ed Hendee of the New York.. Pennsylva..nia League, second baseman Dan Oberholzer ofMinneapolis and Des Moines, and on July 25, Brook..lyn Eagles pitcher..catcher Ted "Double Duty"Radcliffe. Paige pitched in only about a third ofBismarck'sJuly games, and won at least five of thosecontests. He had a record of 16 wins, two losses, andtwo ties on July 6, and was hitting .211 at that pointin the season (14 for 45).
Bismarck finished the season by winning 23 of theirlast 26 known games, including all seven of theirgames in the National Semi.. Professional Baseball

THE BASEBALL RESEARCH JOURNAL

THE BASEBALL RESEARCH JOURNAL
Tournament in Wichita, Kansas. Paige pitched in atleast 11 games in the final stretch, winning eight, sav~
ing one, and losing no games. He is known to havewon at least 27 games over the course of Bismarck'sseason (against two losses and two ties), and mayhave won more-no pitching decisions were reportedin three of Bismarck's victories, and accounts for ahandful of other games did not appear in the newspa~
pers.In the seven~game National Semi~Professional
Tournament, Paige shared the pitching duties withChet Brewer, whom Neil Churchill borrowed fromthe Kansas City Monarchs. Still, Paige pitched38~2/3 innings over five of those games, four of whichwere complete~gamevictories. (He also recorded onesave.) He gave up nine runs (an average of 2.09 pernine innings), and he struck out a tournament record64 batters. Over his last three games in the tourna~
ment, opposing players hit only .190 against him (19for 100; only two of those hits were extra~base hits).For his performance, Churchill gave Paige a new car.
In spite of his spectacular season, Satchel Paigewould have to wait nearly 13 years before joining amajor league club. Scouts from the St. Louis Cardi~
nals, Pittsburgh Pirates, Cincinnati Reds, DetroitTigers, and New York Yankees attended the tourna~
ment, but, as the Bismarck Tribune noted, they were"Ivory~hunters" looking for white talent, and theywere not about to break the unwritten rule barringAfrican Americans from playing in the major leagues.George Barton, a columnist for the Minneapolis Tri ...bune in 1935, ventured that Paige "would bringaround $100,000 in the open market" if were white.
A journalist for the Bismarck Tribune speculated thatPaige, "had he been of a lighter hue, would have beengrabbed up by the major league scouts long before thenational tournament. As it was the dusky hurler re~
ceived the unanimous choice of the tournamentcommittee for the outstanding pitcher award."
The Season Ends-After the tournament, Bismarck'sseason quickly wound down. The club played a hand~
ful of games in Colorado and Kansas beforedisbanding after Labor Day. Neil Churchill returnedto Bismarck and retired from coaching to concentrateon local politics and on his automobile dealership.His team had won at least 79 games over the course ofthe season. Except for Al Leary, Barney Morris, andRed Haley, all of whom returned to Bismarck, nearlyevery player on the team either left for home orjoined other teams.
Satchel Paige joined the Kansas City Monarchs af~
ter the Bismarck club disbanded. Before he did so, headded one more page to his legend:
In a recent baseball game between the Bis ...marck Negro team and the Dickey nine,'Satchel' Paige, star hurler of the Bismarcks,went to the mound in the final inning at theurgent demand of the fans.
Paige sent all of his fielders to the bench, and pro~
ceeded to strike out the first two men to face him.The third batter reached safely on a pop~up to thirdbase, but Paige struck out the next batter to end thegame.
Deuces are WildOn October 2, Cardinal Pepper Martil1, the Wild IJorse of the Osage, had two hits and two stolen bases al1d scored
the only two runs of the game in a 2...0 win over the Athletics in Game Two of the 1931 World Series. Wild Bill Hallahanpitched the shutout for the Cards, and had a 2...0 record in the Series.
Three's a CharmOn October 3, Dickie Kerr, the White Sox's third...best pitcher (and not in on the fix), pitched a three ...hitter, winning
3...0 in Game Three of the 1919 World Series against the Reds.----Don Nelson
---------~0r-~---------

A Case for the DR
The National League's return to dead ball days-
Russell O. Wright
DUring the periods from 1903-19 (the "dead ball"era) and 1963 --68 (when the strike zone waschanged), most fans agreed offense and defense wereout of balance. The National League has returned tothe imbalance of these periods and I recommend thedesignated hitter as a proven way to restore balance.The following graphs from my book The Evolution ofBaseball demonstrate that (1) the NL is out of balanceand (2) the AL avoided a similar imbalance with theDH.
Runs Comparisons-Figure 2--1 shows runs per gameby periods for the AL and NL. In three of the five pe-riods the leagues were close together. The AL leadfrom 1920--41 is primarily due to the Yankees, whooutscored the rest of the AL by nearly the same mar-gins by which they outscored the NL, although theTigers also helped add to the AL margin. The AL leadfrom 1973--89 is due to the DH. The AL increase overthe 1961--72 dip was 10.8 percent while the NL in-creased only 1.5 percent. In 1973--89, the NL was only6.5 percent above 1903--19 while the ALwas 15.5percent above.
Looking at the leagues separately, Figure 2--3 showsAL runs per game by five year interval. The 1965--69dip back to dead ball days was eliminated by the DH,and 1985--89 is just above the 1950--54 peak. We'll seein other graphs that the main effect of the DH is toreturn the AL to 1942--1960, where a rough balance
Russell O. Wright lives in Torrance, California. Graphs are from his book,Evolution of Baseball, (McFarland), and are numbered accordingly.
FIGURE 2-1-AL/NL AVERAGE RUNS PER TEAM PER GAME BY PERIOD
AL
AL
NL
.75..L.--I...-_--i.-._-I...-_-I....-_-I....-_.....L-_.....L-_.....L---I1903 1910 1920 1930. 1940 1950 1960 1970 1980 1989
was struck between 1903 --19 dead ball days and thedominance of the hitters from 1920--41.
For the NL,Figure2--5 shows runs per game by fiveyear interval. The "deadest" ball interval for the NLwas 1915--19 due to the effects of the Federal Leaguein 1915 and WWI in 1917--18. The NL scored more
~-----------<~J------------

THE BASEBALL RESEARCH JOURNAL
FIGURE 2-3--AL AVERAGE RUNS PER TEAM/GAME BY FIVE YEAR INTERVAL
5.20 J11
5.00 J
Il.4.80I
~.60
f.4.40 \ 11\ /"
, r~'\~.20
\ /f.4.00 I
/~ ~1/-3.80
/f,3.60
1903 1910 1920 1930 1940 19SO 1960 1970 1980 1989
1.~:5 - 4.0:5 4.87 5.18 4.39 4.50 4.30 3.98 4.39
2nd:5 3.65 3.81 4.92 15.31 4.30 4.37 3.81 4.34 4.:54
F IBURE 2-9--AL AVERAGE BATTING AVERAGE BY FIVE YEAR INTERVAL
.284 '"I
'M.278 ,.272
\.266
l (~.260 A
V
\ /.2:54 1/\1, 1 , I.248 IJ \/.242
V.236
1903 1910 1920 1930 1940 19:50 1960 1970 1980 1989
1.~:5 - .257 I .286 .279 .261 .261 .252 .2:51 .264
2nd:5 .246 .2:53 I .28:5 .282 .2:59 .256 .239 .262 .262
FIGURE 2-5--NL AVERAGE RUNS PER TEAM/GAME BY FIVE YEAR INTERVAL
~.80 1\
~.64/ \J ,
~.48 A,I'\
[~l
I \/ \~1 • \ r V
f.4.oo
/ VL:s.84
j
1.3.68 \l
-3.521903 1910 1920 1930 1940 1950 1960 1970 1980 1989
1.~5 - 4.21 4.:59 4.68 4.14 4.52 4.21 4.13 4.04
2nd:5 3.82 3.57 4.8:5 4.56 4.39 4.39 3.89 4.14 4.12
FIGURE 2-11--NL AVERAGE BATTING AVERAGE BY FIVE YEAR INTERVAL
.285 .A( ,
.280 \\.27:5
\.270 ,.265
.260\r~
~V '\ t.2:5:5 \ 1\
J ~ \JI \.2SO
I V
.24:51903 1910 1920 1930 1940 19SO 1960 1970 1980 1989
1.~5 - .260 .284 .280 .2:58 .261 .255 .253 .256
2nd:5 .249 .251 .286 .273 .262 .2:59 .249 .2:58 .2:52
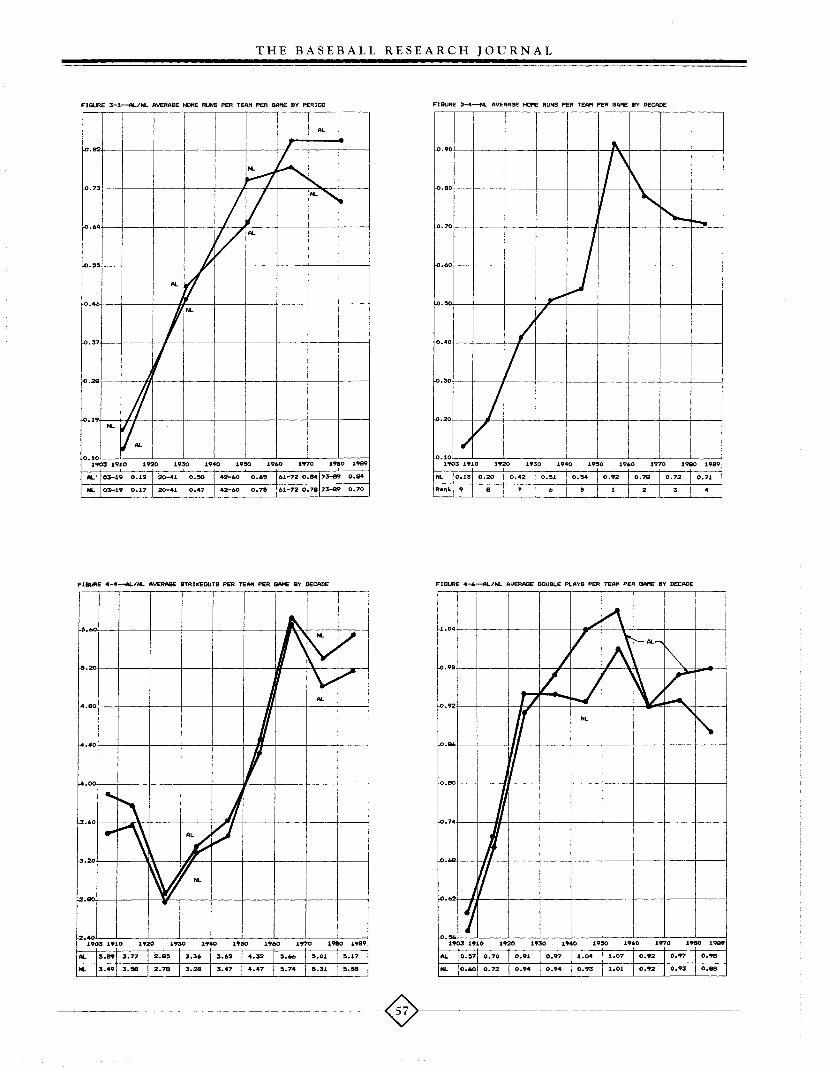
THE BASEBALL RESEARCH JOURNAL
FIGURE 3-1--AL./NL AVERAGE HOf'IE RUNS PER TEAM PER 6AI'IE BY PERIOD FIGURE 3-4--NL AVERAGE HOME RUNS PER TEAM PER GAME BY DECADE
AL
~.82,
~~"-~.73
IV NL,•"'().64
V AL
t"'().55
VAL
~.46 J
I~"'().37
AI~.28
II"'().19Nt.
V~...().10
1903 1910 1920 1930 1940 1950 1960 1970 1980 1989
AL' 03-19 0.12 20-41 0.50 42-60 0.65 61-72 0.84173-89 0.84
Nt. 03-19 0.17 20-41 0.47 42-60 0.75 61-720.7BI73-89 0.70
..0.90 ~
j\...().BO 1\
~ "'--~ r--.-0.70
j-0.60
)"""f.o.50
VI"'().40
Vf.o.30
J-0.20
~V
roO. 101903 1910 1920 1930 1940 1950 1960 1970 1980 19B9
NL 0.13 0.20 0.42 0.51 0.54 0.92 0.78 0.72 0.71
Rank 9 8 7 6 5 1 2 3 4
FJeuRE 4-4--AL/NL AVERAGE BTRIKEOUTS PER TEAM PER GAME BY DECADE FIGURE 4-6--AL/NL AVERAGE DOUBLE PLAYS PER TEAM PER GAME BY DECADE
AL
NL
.80+--.j...---#.J----_I__--+---4----l---_f_---f----l
•74+--+-----.~+---_I__--+_--+_--_t_--_f_--_+_--_;
•86-t--!-----t-#1J---+---+_---+_--_t_--_f_---1---_;
.92+--I----+--I--,~+_--+_--+_--__t___~q:_·-~_+_--_l
1.04+---!----+----+---+___~+_-_+__t_--_f_--_f_--~
---------~0)--~·----'------------

THE BASEBALL RESEARCH JOURNAL
runs from 1910 through 1914, the middle of the deadball period, than it did in any interval during the 25years from 1965 ..89. And the NL was still declining in1992. Its level of 3.88 runs per game was its lowestsince 1918 outside the 1963 ..68 period. Runs per gamefor the five years from 1988..92 were exactly 4.00,lower than all but three prior intervals (1903 ..09,1915 .. 19, and 1965 ..69).
Batting Averages-Turning to batting averages, Fig..ure 2.. 9 shows AL batting averages by five yearinterval. The shape is similar to that for runs, exceptthe 1965 ..69 interval is the worst ever in the historyof the league. The DH returned batting averages backto 1950s levels.
But the shape of the graph for NL batting averagesin Figure 2.. 11 is quite different than that for NL runs.There was only a small improvement in batting aver..age after WWII while runs in Figure 2..5 had a secondpeak in the 1950s (due to the home run barrage ofthat decade as we'll see in a moment). NL batting av..erages in 1965 .. 69 equaled the dead ball low of1903 .. 09, and they've been steadily declining since1975 .. 79. The five years from 1988..92 at .251 are justbarely above the .249 all .. time lows for the first ninedecades of the century.
FIGURE 8-5--AL. RUN SCORING TEAM LEADERS BY DECADE
YANKS
~.20 "/\5.90
I ,5.60
Y~.sI \5.30
1/ \ ~ YANKS
5.00 ~."
\RED SOX
I RED SOX ,/RED SOX
:.4.70 \ ./
fls'v/
:.4.40 '"---TWINS
~.10
LGERS~.eo
1940 1950 1960 1970 1980. 19891903 1910 1920 1930
AL 3.85 4.40 5.51 6.29 4.97 5.08 4.43 4.70 4.85
Rank 9 8 2 1 4 3 7 6 5
FIGURE 8-8--NL RUN SCORING TEAM LEADERS BY DECADE
"ANTS
5.12f'\... CAl DS
I \DODGERS
5.00 "I,
~ \f.4.88 \/
~V \DODGERS
~.76
J ~REDS
~.64 A
I \ V\:-4.52
u I V,
PIRA
~:-4.40 .."NBI ANTS
REDS
\-4.28
~PHILB
~.161903 1910 1920 1930 1940 1950 1960 1970 1980 1989
NL 4.41 4.34 5.21 5.11 4.85 5.07 4.40 4.67 4.25
Rank 6 8 1 2 4 3 7 5 9
Home Runs-Figure 3 .. 1 shows home runs per gamefor the NL and AL by period. In spite of such famoushome run hitters as Babe Ruth, Lou Gehrig, andJimmie Foxx, the AL was only slightly ahead of theNL in home runs from 1920..41, and the AL trailedthe NL substantially in 1942..60 giving the NL theoverall lead through 1972. The biggest margin be ..tween the leagues prior to 1972 was the NL's 15percent lead from 1942 ..60. But with the DH from1973 ..89 the AL stayed even with its 1961 .. 72 levelwhile the NL declined. The biggest margin betweenthe leagues came in 1973 ..89 when the DH drove theAL to a 20 percent edge over the NL (the margin forthe decade of the 1980s was 25 percent in favor of theAL).
The NL decline is seen more clearly in Figure 3..4which shows NL home runs by decade. The NL in..creased in home runs in every decade (in spite of theeffects of WWII in the 1940s) until the 1963 ..68strike zone change caused a sharp. decrease from the1950s to the 1960s. The NL did not recover, and itdeclined through the 1980s-its lowest decade sincethe 1940s.
Strikeouts-Another measure confirming the trend

THE BASEBALL RESEARCH JOURNAL
FIGURE 10-:5--AL HOI'IE RUN TEAM LEADERS BY DECADE
AI.. 0.17 0.17 0.79 1.00 0.7S 0.99 1.0:5 0.99 1.02
1-0.46+---..+---I---+----+----+----+---+----i1------;
Double Plays-Moving to another revealing but lessnoticed measure, Figure 4~6 shows double plays by
DODGERS
1.08 l\/ '"
ltAVES
-0.96
I "'.-O.S4
~B' "-NTSCUBS
GIANS/
1-0.72
VPH'L. I
1-0.60
1/1-O.4S ,
1-0.36 // PH'L.
1-0.24'I
Ie ANTS
1-0.121903 1910 1920 1930 1940 19:50 1960 1970 1980 1989
NL 0.16 0.:51 0.62 0.74 o.so 1.14 1.01 0.89 0.82
Rank 9 S 7 6 :5 1 2 3 4
FIGURE 10-e--NL HOI'IE RUN TEAM LEADERS BY DECADE
decade for each league. The AL and NL were veryclose until the 1930s, when the AL outscored the NLby a wide margin as we saw in Figure 2~1. The resultwas that the AL moved ahead of the NL in doubleplays for the first time. This is because increasingbaserunners (especially the number of runners onfirst) means increasing double plays. This explains theAL peak over the NL through the 1950s, when runsin both leagues were nearly identical-the AL had ahuge surge in walks in the years just before and after1950. All of the original eight AL teams except theTwins set their double play records between 1948 and1956. The NL surged in walks too, but at a lower levelthan the AL.
The number of opportunities is so important indouble plays that three NL teams (the Phillies,Braves, and Reds) set their curent records in the late1920s, even though fielding has greatly improvedsince then. These three teams had plenty of opposingbaserunners in the late 1920s as that was the peakperiod for NL offense and these were the worst threeteams in the league during that time.
Both leagues were equally low in double plays inthe 1960s due to the death of offense (increasingstrikeouts also tend to decrease double plays as theball is simply put in play less often), and both leagues
2
1980 198919701960
4
19:50
7
1940
69Rank S
TIBER~
Y";kS ./ Y:::OLES
1-o.96'~~_---+-_--+-V-ll-I_\'9r--+-\---+-v_..-llnNJnD ANS- RED SDX~
j ~ ~I-O.S6'+--+---f--I--I-+--+J~V--l+_---+---+----iI-----;
YAN S
f.O. 76>4--+----I----,/I--4---+-YANICS:-+---+---+----t---i
1-0.66-1----1-----+--/--4---+--f---------t--+----+-----1
1-O.:561+--+---4-I~~--I---+---+---+---l'----r-----i
J'-O.36~/--4---+--f------t---+---+-----I
fo.26 UAOS A S
k>.16 ... I1903 1910 1920 1930
is strikeouts as shown in Figure 4~4. The AL led theNL until the 1950s, but the difference between theleagues was small from the 1920s through the 1960s.Strikeouts increased in every decade from the 1920sto the 1960s as pitchers recovered from the rulechanges favoring hitters around 1920 and the batterscontinued the "big swing" approach. The peak decadewas the 1960s due to the 1963~68 strike zone change.Reversing the strike zone change and reducing thepitcher's mound caused a dip in the 1970s, but bothleagues are increasing again and the 1980s were thesecond highest decade ever for both.
As we have seen, however, the AL is matching itshighs in strikeouts with highs in home runs while theNL hits fewer and fewer home runs even as strikeoutsincrease. The NL now leads the AL in strikeouts byits largest margin ever, and strikeouts in the NL forthe ten years from 1983~92 are 5.77 per game, break~ing the record set in the decade of the 1960s. The fiveyears from 1988~92 are higher yet at 5.80. The NL setits all time high for a single year at 6.01 in 1986 (1987was 6.00). It's clear pitchers dominate hitters in theNL.
------------<~>--~-~--------

THE BASEBALL RESEARCH JOURNAL
FIGURE 14-3O--GIANTS RUNS AND ERA VB LEAGUE AVERAGES BY DECADE
:5.10 1'....
V1\k.70
J.-- \"~
~~-4.30 I-- -
~.-- i'-
~
:u[.3.90l...- I-- ,. '--
V '"~~ I--
.--
'\I h/ I...- 1I~r--..'--
1-3.:50 i-I--
V V[.3.10 I--f--
'--
L:z.70
~/
~.3O
LED N RUN D FFERENT AL/WON ~NNANT
4:5 8 123 7 I 1234 34 7 4 12 94:5 123 7 1234 3 67 1 4 2 9
1.901903 1910 1920 1930 1940 19:50 1960 1970 1980 1989
Run-1 4 •39 1 4.34' I :5.21* I 4.91 4.44 1.4.:57 4.36 4.21 I 4.10
ERA 12.411 2.66' I 3.66 I 3.60' 3.96 I 3.71 3.29 3.76 I 3.:58
had their lowest double play marks since the begin...ning of the 1920s. Double plays increased in the ALin the 1970s and 1980s with the DH bringing offenseback to life, but \vith lower \valk levels total doubleplays are still belo\v the peaks of the 19408 and 1950s.NL double plays} ho,~vever~ h~v~ f;;;)l1~n filh;;:Jrply in the1980s as NL offense has gone into cardiac arrest (andstrikeouts have continued to grow).
Double plays in the 1980s for the NL were back atthe same level they were in the late teellS even,though errors llave declitled by over 40 percent sincethen. The NL mark of 0.80 in 1989 was the league'slowest sirlce 1919. Even in 191 7, in the middle of theNL's worst offensive period fronl 1915 ... 19 (as we sawin Figure 2... 5), the NL, ,;vas able to (lv~r(lg~ O.7Rdnllhle plays per game. The NL is back into the deadball era in more ways than just declining runs andbattitlg averages.
League leaders for runs-So far we've been lookingat results for the leagues. Now let's look at data for theleading runs an.d homeruns teams in each league. ThisdaLa also conJirm the NL is in a decline, which theAL avoided ':'lith the use of the DH. First ,ve'111ook attb.e leading teams for runs in each decade.
The best AL run... scoring teams in each decade areshown in Figure 8 ...5. It's easy tosee that the Twins inthe 1960s led the AL with almost exactly the sameruns per game that the Tigers posted in leading theAL from 1910... 19. This was due to the 1963 ...68 strikezone change. The DH brought the AL out of its 1960sdip, but the Red Sox, who led the league in the 1970sand 1980s, couldn't get back even to their leagueleading levels of the 1940s-let alone the five ... plusruns per game the Yankees recorded in leading theleague in the 1950s. The leagues have recovered bet..ter than the leaders because the leagues are morebalanced now. Many measures in The Evolution ofBaseball show that equity between the teams is at anall time high today.
Figure 8 ... 8 shows the same data for the NL. TheReds in the 1960s led the league with about the sameruns per game posted by the leading Pirates and Gi..ants in 1903 ... 09 and 1910... 19 respectively. The deadball era returned to the 1960s in the NL just as it didin the AL. The Big Red Machine of the 1970s pulledthe NL above dead ball levels, but it was still wellbelow the levels of the 1940s and 1950s-not to men..tion the peaks of the 1920s and 1930s. The Philliesthen led the NL in the 1980s with the lowest leadingaverage of the century. This was not simply a returnto dead ball days. By this measure, the 1980s were thedeadest ball decade of them all in the NL.
League leaders for homeruns-If we look atliOtnerUlis hI tIle satne way, we see a silnilar pattern illthe difference between the two leagues, althoughhome run levels have never returned to anything nearthe levels of the dead ball period.
Figure 10...5 shows home run leaders for the AL bydecade. The huge surge in homeruns in the 1920s and19308 led by the ·'tankees stalled (I 11 ttle durillg tIle1940s due to the effects ofWWII. The Yankees neverled a decade agaill after tb.e 1940s, but only the Tigersill tIle 19605 alld tIle Orioles in. rh.e 1980s were ableto top the record of the 1930s Yankees. This is an...other of many measures that show how far aheaJ of allother major league teams the Yankees were in the19.10s.
Not otlly was tllere no dead ball "dip" in the AL inthe 1960s, no AL team has been able to match the1960s Tigers for average homeruns in a decade. Runsand batting averagesplummeteJ in tIle 1960s, but tIleTigers kept hitting them out at a record rate (the factthat Tiger Stadium·is the greatest llolllerdollle of tllen1all didn't hurt). The use of the DH in the AL simply

THE BAS E B ALL RES. EAR C H J 0 URN A L
kept leader homeruns near their 1960 peaks (leaguehomeruns were at record highs in the 1980s in theAL). But keeping leader homeruns near their peakswas a great achievement compared to results in theNL.
Figure 10..8 shows homerun leaders for the NL. TheDodgers set the major league record for a decade inthe 1950s (with the short fence in the LA Coliseumhelping to boost the records set earlier in EbbetsField). This was a culmination of a constant increasein leader homeruns from 1903 onward, the same pat..tern shown for the league overall in Figure 3 ..4. But,matching the league pattern again, NL homerun lead..ers have declined in every decade since the record1950s.
A different team has led every decade since the1950s, but each leader has declined from the previousdecade. By the 1980s, the Cubs led the league at alevel just barely above the league .. leading Giants inthe 1940s (in spite of the effects ofWWII). Overall,NL leaders declined by 28 percent from the 1950speak to the 1980s (for the league as a whole in Figure3 ..4 the decline was 23 percent). AL leaders in the1980s were 3 percent above 1950s levels (for theleague as a whole the increase was 16 percent). Onceagain the AL has avoided a major decline in offensewith the use of the DH.Serious decline for the NL-To give final emphasisto the decline of NL offense, let's look at the decaderecord of the Giants, the NL.leader in runs and homeruns (and winning percentage) from 1903 ..89. Figure14..30 shows runs per game and ERA by decade for
the Giants as compared to the league averages. Theleague averages are represented by the top of the rect..angular box for runs and by the bottom of the box forERA. The asterisks in the data box at the bottom ofthe page show when the Giants were first or last inthe league in a decade for either measure. A valuewith an asterisk that was above the league averagemeans a first place finish, a value below the leagueaverage means a last place finish (the Giants werefirst four times but never last).
The graph shows that the dead ball era for the Gi..ants was the 1980s, when they averaged 4.10 runs pergame, their lowest in the century-and they were stillabove the league average (they are the only team inthe majors never to fall below the league average inruns for a decade). The lowest year ever for the Gi..ants was 1985, when they averaged only 3.43 runs pergame. Even in 1943, during the depths of WWIIwhen the Giants won only 55 games and had theirlowest winning percentage of the century at .359,they were able to score 3.58 runs per game (they'vefallen below that 1943 level only four times sincein 1956, and again in 1980, 1985, and 1992).
One team does not make a trend. But when the bestscoring NL team for the century, the only one thathas never fallen below the league average for a de ..cade, has three of its worst four years in 1980, 1985,and 1992, it certainly can be said to be confirming atrend.
And so we end as we began. Defense and offenseare out of balance in the NL, and a proven remedy isat hand-the DH.

The Cahill Brothers'Night Baseball Experiments
"Inverted calciums" and "flaming arcs"
David Pietrusza
Baseball had experimented with night play eversince Edison had perfected the incandescent bulb.Most of the episodes were crude or even carnival ... like,often in backwater venues. Just before World War I,however, a more sophisticated and sustained effortwould be made. It would involve not fly ... by ... nightbaseball promoters but a trio of highly reputable in...dustrialist ... inventors.
The troika was a brother act, the CahillsGeorge, Thaddeus, and Arthur-who owned aHolyoke, Massachusetts floodlight manufacturingfirm. Beginning in 1904 with George in the lead, theydeveloped plans for a logical sideline, night basebalL
Both George and Thaddeus had attended lawschool, but back in the 1890's had become far moreinterested in finding new uses for electricity.Thaddeus, for example, invented an electric type ...
I I h " " ' h'"writer, "wire ess te ep ony, composlng mac lnes,and a rather contradictory discovery, "wired wirelessdevices." In March 1908 it was reported that Georgehad perfected a pitching machine employing com...pressed air. "I was always fond of baseball," Cahillrecalled, "and an enthusiastic player in my schoolboyand college days."
"Night is the natural time for play, for amuse ...ment, for relaxation," George once observed inexplaining his ardor for night balL "I believe thatman's greatest games, his outdoor manly sports, can be
David Pietrusza is the author of Lights On!: The Story of Night Baseball(A&M). He was Associate Editor of Total Baseball (Third Edition).
and should be played at night."In 1908 Cahill put out feelers to organized base ...
ball and a result was this July 18 letter from SportingLife Editor Francis Richter to Cincinnati Reds Presi ...dent August "Garry" Herrmann:
Friend Herrmann:
Mr. George F. Cahill ...has invented an elec ...trical apparatus for playing base ball at nighton which he has secured completely protect ...ing patents. The invention is practical, thecost being not at all heavy or excessive andappears to be quite feasible-so feasible infact that Messrs Shibe and Mack of the Ath...letics had almost completed arrangements fora demonstration at Columbia Park in Augustwhen temporarily insuperable obstacles withthe authorities arose. In conversing with Mr.Cahill I suggested that you of all men would,for various and obvious reasons, be the one toconsult about the trial or introduction of theinvention, and he is willing to go to Cincin...nati at a moment's notice if you will receivehim and give him a fair and full hearing. Ifthe scheme is practical, as I fully believe it is,it is highly important that "organized ball"should control an invention that will havethe greatest and most far ... reaching effect uponthe sport. If it should fall into the hands ofspeculative outsiders it would surely mean ri ...

THE BASEBALL RESEARCH JOURNAL
val night~playing leagues. There are greatcommercial possibilities and probabilities inthe invention, which should be kept withinthe present "charmed circle." I have no finan~
cial or other interest in the matter and writesimply as a favor to Mr. Cahill (who has givenme complete details of his system) and a dutyto "organized ball."
Sincerely Yours,Francis Richter
On August 24, 1908, Herrmann, George Cahill anda team of Cincinnati businessmen announced the for~
mation of the "Night Baseball Development Co.,"incorporated at the state capital in Columbus with acapital of $50,000. Herrmann would invest $4,000personally.
"President Herrmann has great faith in the prac~
ticality of the system," observed Sporting Life, "If itworks successfully every fan who has ever beendocked a half day's pay for sneaking out to the ballpark will worship Mr. Herrmann. Think of it! Base~
ball every afternoon and evening. Great double bill.Two frolics daily. Take the children in the afternoonand come back yourself for the night show. Pitchersfor today: Ewing and Mathewson at 3:30; Spade andWiltse at 8 P.M. No tie games. Play never stopped onaccount of darkness. Stay and see the finish."
By late September three towers ("Not unlike gi~
-ant oil derricks") had already been erected andcompletion was promised in "two weeks." Yet a pessi~
mistic edge seemed to be creeping into the venture,with talk of using the illuminating mechanism for"political meetings" if the baseball bubble burst. Itwas a harbinger of ill fortune; nothing at all happenedthat season-and friction even grew between thepartners over such mundane items as their electricalbills.
Yet, in the New Year hope-and baseball-alwaysreturns. An intriguing detail was announced in Feb~
ruary 1909. Herrmann's Reds would take on CharlesComiskey's Chicago White Stockings on April 11,following a day game between the two clubs. Onlythree towers still were in place, but it was promisedthat the remaining two would soon be raised."Comiskey," noted the Chicago Tribune, "already hasmanifested much interest in the development of thenovel plan. It is believed he will put a team on thefield in the evening to oppose the Reds."
Still, that encounter never took place. A March18, 1909 letter from Cahill to Herrmann reveals that
he was unable to resolve "our motor generator ques~
tion." A trial actually occurred on June 18, 1909,following a regular season match versus the Phils.Five one~hundred foot towers holding 14 arc lightswere now erected at the Reds' home, the ornate buthopelessly decrepit Palace of the Fans. One accountstates that two were over the grandstand and oneeach at the scoreboard, the bleachers and in left andright field. {I know that doesn't add up to five, butwill leave the matter up to next researcher to clarify.)
Arc lights consisted of carbon filaments. The car~
bon used in Cahill's projectors was as large as baseballbats and a Cahill employee had to stand at the readyby each lamp to reload filaments as the old carbonburned off. Powering this was a huge 250~horsepower,
60~cycle dynamo which Cahill placed under theGrandstand. It had a speed of 345 revolutions perminute and a voltage of 235.
Forty~five hundred customers, including membersof both the Reds and Phils, congregated in the stands.A. L. Tearney, President of the Amateur BaseballManagers' League of Chicago, also attended with aneye toward implementing the innovation if he indeedliked what he saw.
Originally, Herrmann had still planned on us~
ing Reds players for the exhibition, but fear ofinjuring his chattels caused him to pull back. InsteadHerrmann (obviously losing nerve step by step), se~
cured the services of the local Cincinnati andCovington lodges of the Benevolent Protective Orderof Elks-seemingly a more adventurous bunch thanthe average major leaguer of the day. Herrmann, bythe way, was in the running for the post of GrandExalted Ruler of all of American Elkdom and most ofthe crowd consisted of lodge brothers, their familiesand friends. The proceeds would go into a fund totransport the local Elks delegations to the BPOEConvention in Los Angeles-where they would becounted on to support the magnate's candidacy.
Herrmann professed himself as pleased with theresults of the night's game: "Night baseball has cometo stay. It needs some further development, but withproper lighting conditions-better than this experi~
ment provided-will make the sport immenselypopular."
Reds manager (and future Senators major~domo)Clark Griffith was less enthusiastic: "I don't believenight ball is destined to rival the daylight article, butI will say I was much surprised at the ease with whichthe game was played under to~night. Under improvedlighting it will grow more popular."
He had cause for reticence. Infielders reported

THE BASEBALL RESEARCH JOURNAL
no problems, but outfielders did. One fly ball was to ...tally lost and resulted in a home run (There is somedisagreement on this last point; one source states:"Errors were marked up against the players more be ...cause of their lack of training than the lack of light.")
This was Herrmann's last involvement withCahill's apparatus. Perhaps, the real story of theevening was found in the box score-15 strikeouts byone hurler, nine by his rival. Visibility must have poorat home plate for that was clearly a huge number ofK's for that era. In the outfield the situation may havebeen even worse. "The 'inverted calciums' out in cen...ter field," noted sportswriter Ren Mulford, "were adisappointment .... The game was a novelty and attimes took on the elements of a diamond comedy."And while he thought the experiment had provedthat such events as football or track could be illumi ...nated, he summed up rather correctly, "It will be along time before National and American Leaguers arefighting for championships under the glare of theelectric lights."
For two weeks after the experiment Cahill'slights illuminated a less prestigious pastime-a carni ...val. Admission ten cents. Good crowds attended, upto 10,000 per night, but the sideshows did little to addto the dignity of the idea.
Undaunted, the inventor travelled north toGrand Rapids, Michigan. There he had the support ofthe local Advertisers Club which was billed as the"premier advertising organization of the UnitedStates."
What they planned for the evening was prettyhokey, even by bush league standards. A large numberof fund ... raising souvenirs would be peddled includingcommemorative pennants on walking canes (donatedby Grand Rapids' Herpolsheimer Co.) and red boxesor "bricks" of carmelcorn. "This Brick Builds GrandRapids" read each container, which held a variety ofprizes, mostly cheap noisemakers ("crickets"), but alsocertificates for such more valuable items as "chairs,neckties, magazine subscriptions-everything onearth."
George Cahill installed his system at RamonaAthletic Park, home of the city's Central League fran ...chise, for a July 7 exhibition. Cooperating with himand the Advertisers were the Grand RapidsMuskegon Power Company and the Grand RapidsRailway Company. Thirty "flaming arcs" were in ...stalled, 12 over the grandstand and 18 along the sidesof the playing field. Augmenting them were 10 "mam...moth" searchlights, placed so fly balls could bediscerned. All told 55,000 watts of power were in
place.The Grand Rapids team had started slowly that
season, losing 14 consecutive games in June, but hadrecently shot up to third place. Their competitionwould be the tough first ... place Potters fromZanesville, Ohio.
Financially the game was a roaring success, ev ...erything the Advertising Club could have desired.4,300 witnessed Grand Rapids triumph 11 ... 10 in aseven inning contest. Over one thousand dollars wasraised for next year's pageant.
Earlier in the day Grand Rapids and Zanesvillehad played a regular season contest, with the homeclub prevailing 2... 1 in ten innings. The evening's af...fair could not, however, be an official contest, asCentral League rules specified that games could notstart later than two hours before sunset. The nightgame was hardly as scientific as the afternoon's; infact, it was a farce.
It must have been suspected that the system wasnot strong enough. Before the exhibition, groundrules were laid out that any misjudged fly baIlormuffed grounder would be scored as a hit. Onlydropped throws would be scored as miscues.
Managers Raidy of Grand Rapids and Montgomeryof Zanesville ordered their batters to go easy, and forawhile they did so, although even half...heartedly hitballs could be tough to snag in semi ...darkness. "Aftera run or so was scored," revealed the Grand RapidsEvening Press "they were content to hit the pill as di ...rectly at the pitcher or another infielder as possibleand then loaf down the first base line while beingthrown out."
In the sixth frame, however, all wraps were offand the runs came in bunches. All told there werefive homers, four triples, and six doubles.
The Grand Rapids Herald reported "outfieldershad their troubles in judging the balls lofted in theirdirection but the light was perfect for the batters, andhow they did land on the ball."
Cahill's system would have one last test-at Chi...cago. On January 18,1910, Herrmann wrote to fellowmagnate, Chicago White Sox owner CharlesComiskey, to join in the nightball venture. Two dayslater, Comiskey was on board-"I will invest in yourproposition."
On August 20, 1910 Comiskey, about to embarkon an Illinois River houseboat trip, took time out toannounce that a three ... night multi ... sport trial ofCahill's arcs would commence at new Comiskey Parkon Thursday, August 25. (Interestingly enough, blue ...prints were sent to Comiskey in 1909 by a Cincinnati

THE BASEBALL RESEARCH JOURNAL
lighting firm, perhaps the Cahill..Herrmann combine,detailing how the new field could be illuminated.)
The first evening's action was lacrosse, featuringthe Calumet and Illinois Athletic Club teams. Reac..tion was somewhat mixed. "Although the lamps werenot in the best working condition," the Chicago Tri ..bune noted, "the demonstration proved that in sportswhere the ball is not elevated more than fifteen totwenty feet in the air the lights will prove a successfor night entertainments. Seven of the ten lights usedlast night threw their glare over a section from thebatter's box to a point mid..way between second baseand deep center. The remaining three lights stationedalong the first base line spread their radiancy over theremaining section of the territory required for play."
Comiskey had hurried back from his cruise and wasone of only 300 in attendance. Predictably, he pro ..nounced himself pleased with the results. For therecord, the I. A. C. trimmed Calumet 11 .. 10.
The next evening highlighted soccer, featuringthe local Hyde Park Blues and Campbell Rovers. Theinterminably..named Electrical Review and WesternElectrician observed that the contest "was playedwithout a hitch from lack of light; it was possible toobserve all the details of the play even at the remotegoaL"
On Saturday evening, August 27 over 20,000curious fans witnessed the Logan Square and RogersPark semi..pros going full .. tilt at our National Pastime.Semi..pro ball was then a significant part of the base ..ball firmament, drawing good crowds and employingplayers of real talent. Both squads belonged to thetough six .. club Chicago Baseball League, which in..eluded the famed black Chicago Giants.
"Night Baseball A Success" proclaimed the Tri ..bune, noting that unlike previous efforts-such as AlLawson's-this event was performed with "exactly thesame conditions as a contest in broad daylight.
A totalof 137,000 candle power was available, thebulbs allegedly making "the diamond bright as day."Oddly enough, ten of the amps were installed in thetraditional manner, facing down, while ten otherswere placed on the ground facing skywards. "By thismanner," explained the Reach Guide, '''fly balls' and'grounders' or 'liners' were equally discernible andcould be seen plain at midnight as during any part ofthe day."
"This was the most severe test of the lighting sys..tern," judged the Electrical Review and WesternElectrician, "but the ball was clearly observed at alltimes .... The players did not complain of glare fromthe lamps,some contending that it was not as
troublesome as facing the sun."The Electrical Review and Western Electrician
went on to explain the "Cahill flaming arc" in somedetail:
Additional lights are provided for lightingthe space above the field so that the ball canbe clearly observed throughout its course. Inthe new installation at the 'Sox' Park theselatter lamps were used for the first time, ten ofthem being placed in groups of two on theground at the edges of the field, while tensimilar lamps were mounted on top of thegrand stand for the general illumination ofthe field.
These lamps were placed at a height ofnearly eighty feet from the ground and weregrouped as follows: four on the edge of theroof on the first .. base side, two on a towerover the right wing of the grand stand, andtwo on a similar tower over the left wing.
Hinged screens were provided for the rooflamps and these were swung out in front ofthe lamps to shut off the brightest and mostdirect rays from the eyes of thebaseball .. players. The tower lamps, beingmore remote from the diamond, were notscreened. Being placed over the roof line, theten high lamps did not throw an objection..able direct glare into the eyes of thespectators.
The ten ground lamps were placed ingroups of two, as follows: a group on each sideof the home plate and close to the edge of thegrand stand, a group near the edge of the cen..ter field, a group near the edges of the rightand the left fields. A screen in the form of anarc was placed about ten feet in front of eachof these groups to shield the players from thedirect rays of the ground lamps.
Still only about 50 percent of the recommendedvoltage was employed. An "even better future" was instore, vowed the Tribune, "Of the nineteenoperators ... only seven were versed in their actualworking. At times the lights would flicker, but whenonly two or three acted badly the change was not no ..ticeable. The present voltage is below the amount

THE BASEBALL RESEARCH JOURNAL
wanted and promises of better current have been. "given.
Observers heralded the fielding as quite good(only four errors were made). Future big leaguer AlWickland turned in an outstanding play incenterfield, converting a sure Rogers Parks extra... basehit into a spectacular double play. Logan Square won3... 0.
Ironically, while all this was going on,Comiskey's Pale Hose were at New York's HilltopPark, playing to a 6;6 tie in the second game of adouble ...header-called on account of darkness.
Since all the comments seemed very favorable,it's somewhat mysterious why nothing further wasdone with Cahill's system. Yet it was his last attemptto light big league baseball. Not that Cahill aban ...doned the lighting business or even his interest insporting events. In the late 1920's, he was even illu ...minating the Polo Grounds, Yankee Stadium andForbes Field-not for baseball, but for other eventssuch as football and boxing.
Part of the answer to the Cahills' abandonmentof night ball was yet another futuristic venture theywere pursuing. At about this same time Dr. ThaddeusCahill was making startling advances on a device hedubbed the "Telharmonium." In 1911 the Cahillsshifted their operation from Holyoke to New YorkCity to facilitate progress on their new device, whichcertainly had promise and even today still sounds im ...pressive-a combination of cable radio and theelectric synthesizer.
Music would be produced at the West 56thStreet studios of the New York Cahill TelharmonicCompany (later Dr. Lee DeForest initiated one of thefirst wireless musical presentations from this site) andbe transmitted to multiple "receiving telephones."This vvas not the only contemporary idea to utilizethe telephone in methods other than what we knowtoday. Proposals were advanced to place pay phonesin every home, to have telephones transmit news andeven to have them bill per word for messages liketelegrams. The Cahill plan was simply the most so ...phisticated scheme advanced, and was considered
much more significant than Thaddeus' electric type ...writer.
The New International Encyclopedia described theTelharmonium thusly: "The keyboard is similar tothat of an organ; the keys operate switches so as tobring the several alternators as required. The notesproduced are of remarkable purity, being surpassedonly by that of a good string. The performer has ab...solute control over the notes, both as to expressionand timbre; he canpfoduce at will the note of prac...tically any instrument, and even notes of entirely newquality." The process aroused international interest,and representatives from the French, German andAustro ... Hungarian governments travelled to theUnited States to inspect it.
The device was tested as early as March 1911 inMassachusetts, but 1912 saw a very successfulTelharmonium concert taking place, with musiciansplaying their "electrical keyboards" at the studiowhich audiences in New York (at Carnegie Hallamong other locations), Boston, Baltimore, Spring...field, Washington and several other cities enjoyed.
New York's city fathers awarded a franchise tothe Cahills to lay underground Telharmonium trans ...missions wires and even invested several hundredthousand dollars in the operation. It never flew, but itdid help ground their night baseball adventures.
As a postscript, the relationship between GeorgeCahill and Garry Herrmann continued, although indifferent forms. In February 1914 Cahill was sendingHerrmann one of his newest inventions-an automo...bile braking signal, which "the natural forces ofmomentum and inertia" caused a "SLOW DOWN"sign constructed "of expensive materials" to flash outat following motorists.
But by year's end the two were at each other'sthroats, with. Cah-ill sui11g IIerrrnallll. At issue was"what was due us on the license fee" for Cahill's lat ...est brainstorm. The inventor had given up on settlingthe matter amicably and turned it over to an attorney.
Perhaps yet another reason why Mr. Cahill shiedaway from the baseball powers of the day ....
Post...season PalmerJim Palmer has appeared in the lineup in every World Series (six) and League Championship Series (seven) in which
the Baltimore Orioles have been involved. He pitched in, and had one (and only one) decision in, each of those WorldSeries . The '83 playoffs were the first in which he did not pitch, but he appeared as a pinch runner in Game Three. Hisplayoff record was 4... 1, spread over five LCS, one decision in each of five.
-Don Nelson

John C. Tattersall
An early SABR member with a passion for homers
Eddie Gold
JOhn C. Tattersall was the Babe Ruth of baseball statlsticians. His specialty was the homerun and he roundedall the bases.
The Philly resident was vice ...president of a steamshipcompany. But John wasmore shipshape when it cameto his homerun logs.
Tattersall first gained national attention in 1953when The Sporting News, the New York Times andother newspapers ran his story on the. correction ofNap Lajoie's 1901 batting average. It was his calcula...tions that changed Lajoie's average from .405 to .422,the highest in American League history.
The year 1901 was the inaugural season of theAmerican League. Lajoie, a second baseman with thePhiladelphia Athletics, was credited with a spectacu'"lar .422 batting average. However, in 1918 astatistician found that 220 hits in 543 at bats pro ...duces "only" a .405 average.
Several decades later Tattersall went to bat forLajoie. He went through all the Philadelphiaboxscores for that season and found Lajoie had 229hits, which restored his average to .422. The originalerror was in the hit column, not the average.
Tattersall's interest in homeruns developed fromwatching the New York Yankees and Babe Ruth. Hishomer log listed every four... bagger hit each season byplayer and club, with date, pitching victim, park, in...ning, men on base, by pinch...hitter, leadoff batter, etc.
Eddie Gold is a Chicago sportswriter.
But the maven of mammoth homers encountereddifficulties convincing baseball brass that statisticalinaccuracies existed. One such happening (orhoppening) occurred during a game in Philadelphiain 1897. A bunny rabbit appeared on the field and theplayers gave chase. The bunny rounded first, took sec...ond and third, and raced home before being nabbed.The official scorer then came up with a hare ... brainedidea. He listed "Home Run-Rabbit" in the boxscore.
Ever the perfectionist, Tattersall couldn't findRabbit's record anywhere. After scanning miles ofmicrofilm, J. C. realized the joker just pulled the rab ...bit out of a hat. Tattersall wrote to the baseballbigwigs and urged them to eliminate the rabbithomer. But they ignored J. C., thus laying a fat Easteregg. Tattersall was determined to make the rabbit dis ...appear. He contacted Fred Lieb, and the long ... timebaseball writer persuaded the moguls to bid bye ...bye tothe bunny.
Then there was the case of the vanishing grand ...slam homer. The Yankees were playing thePhiladelphia Athletics at the Polo Grounds on May31, 1916. The Ns were leading 6...4 in the eighth in...ning. The Yankees loaded the bases off Bullet JoeBush, bringing utility outfielder Frank Gilhooley tothe plate. Gilhooley blasted a Bush bullet over thecenter fielder's head. Frank chugged around the bases,scoring behind Home Run Baker, Hugh High and RoyHartzell to slam the. A's 8 ... 7.
But when the "official" 1916 averages were re ...

THE BASEBALL RESEARCH JOURNAL
leased, Gilhooley had a big fat zero under the homerun column. (Incidentally, Gilhooley added a homerin 1918 for a grand career total of two.) The recordbooks "slammed" the door on Gilhooley and Tatter..saIl, who argued it was a clean grand..slam homer.
Gilhooley was no household name and figured toget lost in the shuffle. But what about Hall of Famefirst baseman George Sisler? The St. Louis Browns'immortal was refused admission to the 100--homerclub after the record books credited him with 99. Thefactual evidence is that Sisler slugged 102 homers.
Tattersall discovered Sisler to be the victim of threebaseball blunders. The first was on opening day, April12, 1916. Sisler homered off southpaw WillieMitchell of the Cleveland Indians in the third inningwith the bases empty. The ball landed outside theballpark for a legitimate homer. But the official scorer,who was probably battling John Barleycorn, errone ..ously listed the blow as a single in the boxscore.
Sisler again was robbed on September 22, 1921against the A's at Shibe Park. He teed off againstRollie N aylor, sending the ball over the right..fieldwall in the eighth inning to give the Browns a 4..3victory. The boxscore of that game lists Sisler withtwo hits and Jimmie Dykes of the Ns with one hit, asixth.. inning single. But somehow the agate line lists:HR-Dykes. Chalk up another phantom error.
Sisler made it a three ..peat on June 29, 1929 atEbbets Field against the Brooklyn Dodgers. By now he
was nearing the end of his career as a member of theBoston Braves. In the eighth inning, Sisler jumped ona Jughandle Johnny Morrison jughandle curveballwith two on base, the ball going over the right..fieldscreen. He again homered on October 5 at BravesField. But when the "official" averages were releasedthat winter, Sisler was left out in the cold with onehomer.
Tattersall went to bat for Sisler with printed proof.He struck out. The baseball rules committee can..venes every season, but it seems they're moreinterested in sipping martinis than sifting throughdocumented material. (However, Total Baseball nowshows Sisler with 102 homers and Gilhooley withtwo. The Baseball Encyclopedia, oddly, credits him withan even 100.)
As an early member of the Society for AmericanBaseball Research in 1971, Tattersall organized hishomerun material for that group. He died in BocaRaton, Florida, on May 29, 1981, at age 80. Subse..quently, SABR purchased his large volume ofhomerun data, updated his listings and put it on com..puter for use by members.
John dreamed of publishing a large scale officialHome Run Register, which would treat, in differentways, everyone of the 130,000--plus major leaguehomers hit from 1876 through today. His dream maybecome reality. A major publishing house is discuss ..ing just such a book with SABR officials.
The Bonham ConnectionOn August 5, 1940, Ernie "Tiny" Bonham made his major league debut, a 4--1 loss to Fritz Ostermueller in Fenway
Park.On that same day, a washed...up 31 ...year...old righthander named Johnny Whitehead of St. Louis pitched a 4...0 no...hit...
ter against Detroit in a game called after six innings because of rain.Whitehead's alleged fondness for alcoholic beverages shortened his career. This was the only game he won in 1940 and
it was his last ever.The irony: Whitehead died in 1964·at age 55 in Bonham, Texas.
Joe Marchetto

The Exemption of Baseball fromFederal Antitrust Laws
A legal history
Stephen D. Guschov, Esq.
A major league baseball continues to deliver selfinflicted wounds to itself in the form of a playersstrike, the issue of baseball's long~standing exemptionfrom federal antitrust laws has resurfaced.While today's ballplayers and owners recentlyscrapped in conference rooms and hurled accusationsinstead of fastballs, Congress held hearings and heardtestimony about the history of this curious anomaly,and why it may be time to repeal, either in whole orin part, the unprecedented antitrust exemption thatbaseball now enjoys.
The cornerstone of any examination of baseball'sexemption from federal antitrust laws is the FederalBaseball Club of Baltimore, Inc. v. National League ofProfessional Baseball Clubs case of 1922. In it, theUnited States Supreme Court dealt for the first timewith the issue of whether organized baseball was in~
terstate commerce, or more accurately, whether themonopoly that organized baseball had established wasa monopoly of any part of interstate commerce.
The plaintiff in this case was the Baltimore Terra~
pins Baseball Club, incorporated in Maryland, whichwith seven other teams was a member of the FederalLeague of Professional Baseball Clubs, which com~
peted with the defendant American and NationalLeagues in 1914 and 1915. The Baltimore club al~
leged that the defendants had conspired tomonopolize the business of baseball, and had at~
tempted to destroy the Federal League by buying up
Stephen D. Guschov, Esq. is an attorney in Danvers, Massachusetts.
some of the constituent clubs and inducing thoseclubs to leave the league. The plaintiff further allegedthat even the President of the Federal League tookpart in this conspiracy, and he joined the AmericanLeague of Professional Baseball Clubs and the Na~
tional League of Professional Baseball Clubs asdefendants in the case.
The Baltimore club initially won a judgment fortreble damages under the Anti~Trust Acts in the Su~
preme Court of the District of Columbia, but ajudgment of the Court of Appeals of the District ofColumbia reversed that verdict.
The United States Supreme Court took the case onappeal, and noted that it was not concerned withwhether the mere playing of baseball, that is the actof the individual player, was by itself interstate com~
merce. The Court added that "that act, it is true, isrelated to the business of the defendants, but it can nomore be said to be the business than can any othersingle act in any other business forming a part of in~
terstate commerce." The Court indicated that "at thefoundation of the business of one of these leagues ... isa circuit embracing seven different States. No singleclub in that circuit could operate without the othermembers of the circuit, and accordingly ... the matterof interstate relationship is not only important butpredominant and indispensable."
The Court also examined the business end of pro~fessional baseball, and observed that the defendantswere not engaged in a sport; they were engaged in amoney~making business enterprise in which all of the

THE BASEBALL RESEARCH JOURNAL
features of any large commercial undertaking werefound. The Court added that "when the profit ..mak..ing aspect of the business is examined, it will be foundthat the interstate element is still furthermagnified ... Every club in the league earns its profitnot only by the drawing capacity of its team at home,but also by that of the teams of the clubs which itsteam visits in the various cities in the league. Thecontinuous interstate activity of each club is essentialto all the others. The clubs of each league constitutea business unit embracing territorially·a number ofdifferent States."
Despite the overwhelming evidence of interstateactivity by the defendants, the Supreme Court af..firmed the judgment of the Court of Appeals of theDistrict of Columbia, and held that Organized Base..ball was not interstate commerce and did notconstitute an attempt to monopolize within theSherman Act. The Court -reasoned that personal ef..fort, not related to production, was not a subject ofcommerce, and the attempts by the defendants to signplayers needed for baseball contests were not attemptsto monopolize commerce or any part of it. The Courtfurther noted that the doing of an act essentially 10"cal was not converted into an interstate act merelybecause people came from another State to do it. Jus ..tice Holmes, who delivered the opinion of the Court,observed that "the business is giving exhibitions ofbaseball, which are purely state affairs ... and the factthat in order to give the exhibitions the Leagues mustinduce free persons to cross state lines and must ar..range and pay for their doing so is not enough tochange the character of the business." The Courtconcluded by repeating an illustration· given by alower court, that a law firm which sent out a memberto argue a case did not engage in commerce becausethe lawyer travelled to another State. Thus, the con..duct charged by the Baltimore club against thedefendants was deemed not an interference with com..merce among the States.
Gardella-The Federal Baseball Club decision met itsfirst challenge in 1949 in the case of Gardella v. Chan...dler. Danny Gardella was an outfielder for the NewYork Giants, and a fairly talented player at that. In1945, Gardella played in 121 games for New York,and batted .272 with 18 home runs and 71 runs bat..ted in. In 1946, Gardella signed to play with VeraCruz of the Mexican League. Major league club own..ers had heard that the Mexican League would becomea legitimate third league and would steal away players,and as a result in June, 1946, Commissioner Chandler
announced thatany American player who jumped tothe Mexican League would be barred from Americanbaseball for five years. Gardella consequently wasbarred from organized baseball upon his return fromMexico to the U.S. in 1947, and was therefore essen..tially deprived of his means of livelihood. Gardellabrought suit against Albert B. Chandler, individuallyand as the Commissioner of Baseball; Ford C. Frick,individually and as President of the National Leagueof Professional Baseball Clubs; William Harridge, in..dividually and as President of the American League ofProfessional Baseball Clubs; George M. Trautman, in..dividually and as President of The NationalAssociation of Professional Baseball Leagues; and theNational Exhibition Company, which owned theNew York Giants.
Gardella alleged that the leagues and the clubscomprising them had entered into agreements, de ..signed to control the manner in which organizedbaseball was conducted, and which required players tobe bound to their respective clubs by a standard con..tract. Gardella further alleged that the standardplayer contract included a reserve clause which re ..quired a player who was under contract to play withany club to refrain, at the expiration of the period ofhis employment, from contracting to play for, or play..ing for, any other club other than the one to which hehad been under contract or its assignee. Gardella alsoargued that the club owners sold the right to broad..castplay.. by.. play descriptions of the games on theradio and thus across state lines, and some were be ..ginning to sell the right to broadcast the games ontelevision. Some of those to whom the broadcastrights were sold used the opportunity to advertisegoods which were sold and distributed nationally andinternationally. The combination of operating base ..ball teams which travelled between states for thepurpose of playing baseball games, and making con..tracts with radio broadcasting and televisioncompanies to send across state lines play~by..play nar..ratives or moving pictures of the games, were allegedby Gardella to be sufficient to charge the defendantswith being engaged in interstate commerce withinthe meaning of the Anti ..Trust Acts.
In the initial trial, the United States District Courtfor the Southern District of New York ruled for thedefendants in a judgment dismissing Gardella's com..plaint because the court lacked the properjurisdiction to hear the case.
On appeal to the United States Court of Appeals,Second Circuit, Gardella found a more sympatheticforum. The court held that it would be necessary to

THE BASEBALL RESEARCH JOURNAL
determine whether all the interstate activities of thedefendants, in conjunction with broadcasting andtelevision, together formed a large enough part of thebusiness to impress upon it an interstate character.The court suggested that the traveling involved wasbut a means to the end of playing games which, be,cause of radio and television, essentially were playedinterstate as well as intrastate. This, the court re,marked, was substantial interstate commerce of a sortnot considered by the United States Supreme Courtin the Federal Baseball Club case.
The court called the reserve clause "something re,sembling peonage of the baseball players ... all playersin organized baseball must 'accept' it ... andsevere ... penalties are imposed for violation. The mostextreme of these penalties is the blacklisting of theplayer so that no club in organized baseball will hirehim. In effect, this clause prevents a player from everplaying with any team other than his original em,ployer, unless that employer consents." The courtfurther noted that such contracts were so opposed tothe public policy of the United States that, if possible,they should be deemed within the prohibitions of theSherman Act. Brooklyn Dodger executive BranchRickey thundered back that anyone who opposed thereserve clause had "Communist tendencies".
In distinguishing Gardella from the Federal BaseballClub case, the Court of Appeals emphasized that inGardella the defendants had lucratively contracted forthe interstate broadcasts, by radio and television, ofthe playing of the games. In the Federal Baseball Clubcase, that Court had held that the travelling acrossstate lines was an incidental means of enabling gamesto be played locally-i.e., within particular statesand therefore was insufficient to constitute interstatecommerce. Here in Gardella, however, interstate radioand television broadcasts were not at all an inciden,tal means of performing the intrastate activities-i.e.,the local playings of the games. Thus, the GardellaCourt reasoned that the Federal Baseball Club decisionshould have been deemed to hold no more than thatthe travelling of teams and their paraphernalia be,tween states, as a means to the local playing of games,did not give rise to interstate commerce for ShermanAct purposes.
The court also rejected organized baseball's argu,ment that it supplied millions of Americans with"desirable diversion", and would be unable to existwithout the reserve clause. The court remarked thatit could not predict whether that was true, but that inany event, the public's pleasure did not authorize thecourts to condone illegality, and that no court should
strive to legalize a private (even if benevolent) dicta ..torship. As a result, the court reversed and remandedfor triaL
Thus, it appeared that baseball was in dire jeopardyof losing its exemption from federal antitrust laws.Danny Gardella signed to play baseball for a semiproballclub, the Gulf Oilers. Commissioner Chandler,sensing that baseball's exemption hold was weaken..ing, announced on June 5, 1949, that he would offeramnesty to any player who had defected to the Mexi,can League. Gardella at first resisted the amnestyoffer, and his suit commenced pre,trial hearings, asCommissioner Chandler testified concerning players'eligibility and radio fees. Gardella, however, was notfinancially secure enough to withstand a long trialand large legal fees, and on October 7, 1949, just twodays before the New York Yankees won the World Se,ries over the Brooklyn Dodgers, Danny Gardelladropped his suit when he reached a $60,000 settle,ment with organized baseball and was assured that hewould be reinstated into the game. Gardella signedwith the St. Louis Cardinals for the 1950 baseball sea,son, but only batted once for them (unsuccessfully)that year. It marked the end of Gardella's playing ca,reer in organized baseball, and the major leaguesavoided what could have been a damaging reversal ofits exemption from federal antitrust laws.
Toolson-Baseball's continued exemption from fed,eral antitrust laws next was upheld by the UnitedStates Supreme Court in 1953 in the case of Toalsonv. New York Yankees, Inc. George Earl Toolson was aminor league player in the New York Yankees farmsystem. While playing for the Newark Bears, his con,tract was assigned to Binghamton. Toolson refused toreport to Binghamton, and he was placed on thatclub's "ineligible list." The Yankees refused to reassignhim, trade him, or let him play professional ball forany other club, organization, or league.
Toolson alleged damages due to the reserve clause,pursuant to nationwide agreements by the Yankees.Toolson charged organized baseball, through its ille,gal monopoly and unreasonable restraints of trade,had,exploited the players who attracted the profits forthe benefit of its member clubs and leagues. Toolsonalso alleged that the Yankees and other clubs hadentered into a conspiracy and monopoly of profes,sional baseball in the United States to his substantialdamage.
The Court, however, held that if there were anyevils in this field which warranted application of theantitrust laws, it should be by Congress, not the Su,

THE BASEBALL RESEARCH JOURNAL
preme Court that rectified them. The Court affirmedthe judgment against Toolson, on the authority ofFederal Baseball Club of Baltimore v. National League ofProfessional Baseball Clubs, so far as those decisionsdetermined that Congress had no intention of includ...ing baseball within the scope of the federal antitrustlaws.
The Court's vote was 7... 2 against Toolson. The dis ...sent, as authored by Justices Burton and Reed, wasvigorous. It emphasized that in light of baseball's capi ...tal investments used in conducting competitionsbetween teams constantly travelling between states,its receipts and expenditures of large sums transmittedbetween states, its numerous purchases of materials ininterstate commerce, the attendance at local exhibi ...tions of large audiences often travelling across statelines, its radio and television activities which expandits audiences beyond state lines, its sponsorship of in...terstate advertising, its farm system of minor leaguebaseball clubs, coupled with restrictive contracts andunderstandings between individuals and among clubsor leagues playing for profit throughout the UnitedStates, Canada, Mexico, and Cuba, it would be a con...tradiction in terms to say that the defendants werenot engaged in interstate trade or commerce as theterms were used in the United States Constitutionand in the Sherman Act.
The dissent in Toolson added that in 1952 the Sub...committee on Study of Monopoly Power, of theHouse of Representatives Committee on the Judi ...ciary, issued a report dealing with organized baseballin relation to the Sherman Act. The report statedthat organized baseball at that time was a combina...tion of approximately 380 separate baseball clubs,operating in 42 different states, the District of Colum...bia, Canada, Cuba, and Mexico, so as to makeorganized baseball inherently intercity, intersectional,and interstate. The report further noted that of the42 leagues associated within organized baseball in1951, 39 were interstate in nature.
The dissent used the 1952 report findings to stressthat exemption from federal antitrust laws was a mat...ter within the discretion of Congress and Congresshad enacted no express exemption of organized base ...ball from the Sherman Act. In the absence of such anexemption, the popularity of organized baseball in ...creased, rather than diminished, the importance of itscompliance with standards of reasonableness compa...rable with those required by law of interstate trade orcommerce. Thus, the dissent concluded, organizedbaseball was interstate trade or commerce and, assuch, it was subject to the Sherman Act until ex ...
empted. In spite of this forceful dissent, baseball re ...tained its exemption from federal antitrust laws.
Flood-N ineteen years after the Toolson decision, theUnited States Supreme Court once again consideredthe issue of whether baseball was within reach of thefederal antitrust laws, in the case of Flood v. Kuhn.One of the most remarkable items about the Floodopinion, as delivered by Justice Blackmun, was theCourt's lengthy and romantic portrayal of the historyof the game. For more than four pages, the Courtwaxed nostalgic about the game's early days and by...gone heroes. The Court noted the New York Nine'sdefeat of the Knickerbockers, 23 ... 1, in Hoboken, NewJersey, on June 19, 1846, as being a significant date inbaseball's dawn. The Court also hailed the 1871 es ...tablishment of the National Association ofProfessional Baseball Players; the formation of theNational League in 1876; the formation of theAmerican Association and the Union Association inthe 1880's; the introduction of Sunday baseball;interleague warfare with cut... rate admission prices andplayer raiding; the 1885 emergence of the Brother...hood of Professional Baseball Players; the appearanceof the American League in 1901; the first World Se ...ries in 1903; the short ... lived Federal League duringthe World War I years; the 1919 Black Sox scandal;major league expansion; and the 1966 formation ofthe Major League Baseball Players Association. TheCourt then proceeded to list a rollcall of "names, cel...ebrated for one reason or another, that have sparkedthe diamond and its environs and that have providedtinder for recaptured thrills, for reminiscence andcomparisons, and for conversation and anticipationin... season and off... season... " The Court included thelikes of such legends as Ty Cobb, Babe Ruth, WalterJohnson, Lou Gehrig, Jackie Robinson, HonusWagner, Christy Mathewson, Satchel Paige, Three ...Finger Brown, Connie Mack, Cy Young, and DizzyDean in its list of 88 baseball greats worthy of inclu...sion in the Flood decision.
Not done yet, the Court also included references tothe baseball poems "Casey At The Bat" by Ernest L.Thayer and "Tinker to Evers to Chance" by FranklinPierce Adams, the latter of which was deemed worthto be printed in its entirely in the opinion.
The Court eventually arrived at the facts inherentto the dispute at hand: the petitioner, Curtis Charles(Curt) Flood, had begun his major league career in1956 when he signed a contract with the CincinnatiReds for a salary of $4,000 for the season. Flood wastraded to the St. Louis Cardinals before the 1958 sea...

THE BASEBALL RESEARCH JOURNAL
son, and he rose to fame as a center fielder with theCardinals between 1958 and 1969. During thosetwelve seasons Flood hit .293, with his single best of.fensive campaign being 1967, when he hit .335. Floodplayed in the 1964,1967, and 1968 World Series. Hewas awarded seven Gold Gloves. He was co--captain ofthe Cardinals from 1965 to 1969, and he rankedamong the ten major league outfielders possessing thehighest lifetime fielding averages. Flood's St. Louiscompensation in 1961 was $13,500; in 1962, it was$16,000; in 1963, $17,500; in 1964, 23,000; in 1965,$35,000; in 1966, $45,000; in 1967, $50,000; in 1968,$72,500; in 1969, $90,000. These figures did not in-elude any fringe benefits or World Series shares.
In October, 1969, at age thirty--one, Flood wastraded by the Cardinals to the Philadelphia Phillies ina multi--player transaction. Flood was not consultedabout the trade, but was informed of it by telephoneand received formal notice only after the deal wasconsummated. In December, 1969, Flood complainedto the Commissioner of Baseball and asked that he bemade a free agent, and that he be placed at liberty tostrike his own deal with any other major league club.His request was denied. Flood declined to play forPhiladelphia in 1970, despite a salary offer of$100,000. He sat out the season and sued Commis-sioner Kuhn and the Presidents and clubs of theAmerican and National Leagues. After the 1970 cam-paign concluded, Philadelphia sold its rights to Floodto the Washington Senators, and Washington andFlood were able to come to terms for 1971 at a salaryof $110,000. Flood started with the Senators, but ap-parently dissatisfied with his performance and hisoutlaw status in the game, he left the Washingtonclub on April 27-less than a month into the sea-son-and never played major league baseball again.
Flood's suit charged professional baseball with vio-lations of the federal antitrust laws and civil rightsstatutes; violation of state statutes and the commonlaw; and the imposition of a form of peonage and in-voluntary servitude contrary to the ThirteenthAmendment.
The U.S. District Court for the Southern District ofNew York rendered judgment in favor of the defen-dants on August 12, 1970, holding the FederalBaseball Club and Toolson were controlling law. Onappeal, the Court of Appeals for the Second Circuitupheld the District Court decision on April 4, 1971.
On further appeal by Flood, the United States Su-preme Court heard the case and affirmed thejudgment of the Court of Appeals on June 19, 1972.The Supreme Court acknowledged that professional
baseball was a business and was engaged in interstatecommerce, but stated that baseball was an exceptionand an anomaly. The Court reasoned that the aberra-tion was an established one that had been recognizedfor half a century, and was an exception fully entitledto the recognition of legally--binding precedent.
The Court noted that the advent of radio and tele-vision, with their consequent increased coverage andadditional revenues, had not occasioned an overrul-ing of Federal Baseball Club and Toolson. The Courtalso emphasized that Congress as yet had not sub-jected baseball's reserve system to the reach of theantitrust statutes and, as a result, if any change wereto be made, it should come by legislative action. Theremedy, if any were to be indicated, was for congres-sional, and not judicial, action.
Chief Justice Burger remarked that "courts are notthe forum in which this tangled web ought to be un-snarled ... it is time the Congress acted to solve thisproblem."
Justice Douglas dissented from the Court's majoritydecision, and observed that "this Court's decision inFederal Baseball Club ... is a derelict in the stream ofthe law that we, its creator, should remove. Only a ro-mantic view of a rather dismal business account overthe last fifty years would keep that derelict in mid-stream." Justice Douglas noted that he had joined theCourt's opinion in Toolson, but had lived to regret it,and would now correct what he believed to be its fun-damental error. Justice Douglas added that "theunbroken silence of Congress should not prevent usfrom correcting our own mistakes."
Justice Marshall also vigorously dissented, andstressed that baseball should be·covered by antitrustlaws beginning with the Flood case, unless Congressdecided otherwise. Nevertheless, the vigorous oppo-sition ·of Justices Douglas and Marshall could notdisplace the decision of the majority of the SupremeCourt.
The exemption-In 1993, Florida Senator ConnieMack-grandson of the legendary Philadelphia Ath-letics manager-and Ohio Senator HowardMetzenbaum forged an alliance and introduced intothe United States Senate the "Professional BaseballAntitrust Reform Act of 1993." The bill was intendedto rescind baseball's exemption from federal antitrustlaws, and the authors stated that "the business of or-ganized professional baseball is in, or affects,interstate commerce; and the antitrust laws should beamended to reverse the result of the decisions of theSupreme Court...which exempted baseball from cov--

THE BASEBALL RESEARCH JOURNAL
erage under the antitrust laws."Senator Metzenbaum has stated:"... [W]hile the game of baseball remains a simple
pleasure, the business of baseball has become compli ...cated and, at times, cut ... throat. Major league baseballis not just a sport. It is also a billion...dollar big busi ...ness. And, it is a big business which enjoys uniquetreatment under the law.
"Unlike any other big business in America, MajorLeague Baseball is a legally... sanctioned unregulatedcartel. The Supreme Court conferred that extraordi ...nary privilege upon baseball seventy years ago, whenit granted (baseball) a complete exemption from theantitrust laws ...Although the soundness of this rulinghas often been questioned-even by the Court it ...self-it has never been overturned. Instead, the Courthas tossed the ball to Congress, which is why we arehere today.
"Baseball's antitrust exemption is a privilege thatthe baseball owners may be abusing. I am particularlyconcerned that their ouster of Fay Vincent and theirplans to weaken the Commissioner's powers invitesmore abuse of that privilege.
"Jerry Reinsdorf, the owner of the Chicago WhiteSox and one of the key participants in Vincent'souster has stated that the job of the next baseballcommissioner will be to 'run the business for the own...ers, not the players or the umpires or the fans.'
"It appears that the owners don't want a strong andindependent commissioner who can act in the bestinterests of the sport or act as a potential checkagainst abuse of their monopoly power. Instead, theywant a commissioner who will function as the cruisedirector for their cartel. If decisions about the direc ...tion and future of Major League BasebalLare going tobe dictated by the business interests of teams' owners,then the owners should be required to play by thesame antitrust rules that apply to any other business."
At about the same time that Senators Mack andMetzenbaum introduced their bill, Vincent Piazzafather of Los Angeles Dodgersw catcher MikePiazza- and business partner Vincent Tirendi filedsuit in federal court seeking to overturn Major LeagueBaseball's antitrust exemption and force the sale ofthe San Francisco Giants to investors in St. Peters ...burg, Florida. Piazza and Tirendi, partners in acomputer company, were prepared to invest $27 mil ...lion as part of a $115 million deal to purchase theGiants and move the club to St. Petersburg, beforemajor League Baseball quashed the deal and maneu...
vered to keep the Giants in San Francisco.The reaction of baseball's owners to the Senate bill
and the federal suit, however, appeared to be less thanpanic ... stricken. Peter Gammons of the Boston Globecommented that "most baseball people aren't overlyconcerned about threats to take away the antitrustexemption... [T]here are too many members of Con..gress from key states like Washington, Wisconsin,Pennsylvania, Ohio, Missouri and California who re ..alize that if such a bill resulted in one of their teamswalking to Florida, it would cost them their jobs. Sec..ond, Congress has a few more urgent items on theagenda ... than giving Howard Metzenbaum andConnie Mack publicity. Finally, the reality is that formore than 40 states, the real result of such a billwould be the end of the minor leagues as they are nowconstituted."
On August 5, 1993, U.S. District Court Judge JohnR. Padova rejected a motion by Major League Base ...ball to dismiss the suit of Vincent Piazza and VincentTirendi. Padova noted in his decision that baseball'santitrust exemption applied only to its now ...defunctreserve system, wherein a club held a player's contractin perpetuity. The reserve system essentially has beenreplaced by the system of limited free agency. As aresult, the Padova decision stripped away much ofbaseball's protection from adherence to federal anti ...trust rules.
On the heels of this decision, it was reported thatVincent Piazza and Vincent Tirendi received feelersfrom Major League Baseball regarding whether theywould be willing to drop their suit if they wereawarded a Tampa Bay ... St. Petersburg franchise thenext time that baseball expands.
Just over a year later, on September 28, 1994, it wasannounced that Piazza and Tirendi had settled theircase with Major League Baseball out of court, andwould receive a $6 million settlement as compensa...tion.
In Congress, even though Major League Baseballonce again held onto its coveted antitrust exemption,the sentiment in Washington was that if the playersand owners have not reached an agreement to endthe strike by early 1995, the legislation will be re ... in...troduced in the next session of Congress.
"The real message should be a wake...up call to base ...ball," Utah Senator Orrin Hatch commented. "If youdo not want Congress to be involved, then settle thisdispute yourself."

Baseball, Bluegrass and Suicide
A cluster of Kentucky tragedies
Bob Bailey
SUicide is a particularly tragic means of death.With or without a note, it is often impossible to com..prehend why someone would take their own life.There have been five active players and one leaguepresident who have committed suicide in majorleague history. There have been others who took thisway out of their existence subsequent to their majorleague careers.
In one 10..year period from 1907 to 1916 four Ken..tuckians-three former players and the previouslymentioned league president-took their own lives.There is no connection among the events but geogra..phy.
The first was Bob Lankswert, who played under thename Bob Lankford (some sources list him asLangsford). He was a shortstop who played asinglegame for the Louisville Colonels in their final Na..tional League season, 1899. But from 1890.to 1905 hehad a 15 ..year professional career with Memphis, NewOrleans, Mobile, Indianapolis, Milwaukee, andsev ..eral other clubs.
It was a freak accident while he was with the Mo..bile team that is thought to have contributed to hislater suicide. In 1894 or 1895, Mobile pitcher PatDaniels, another Louisville native, was warming upb.efore a game. One of Daniels' tosses got away andstruck his teammate on the left temple. Lankswertwas disabled for several weeks, and when he returned
Bob Bailey is a frequent contributor to SABR publications. He lives inGoshen, Kentucky.
he found that· he had sustained a severe hearing losswhich·would worsen over the years. Through the restof his baseball career,. he was also reported to displaybrief periods of irrational behavior.
Returning to Louisville at the end of his playingdays, he took a job ata tannery across the river inNew Albany, Indiana. The head injury caused him tobe hospitalized several times over the next year. Hehad just been released from a four..week stay at CityHospital and was being prepared by his brother andsister to be admitted to St. Anthony Hospital whenhe was found unconscious. in his· boarding house roomon January 10, 1907.
The formerplayerhud complained that the headinjury would not allow him to sleep more than twentyminutesata. time. He would occasionally go into a"daze," dllring which he would not comprehend any..thing going()n about him or understand anything saidto him.
His family felt sure. that it was during one of theseperiods of irrationality that the 41 .. year..old formershortstop swallowed some carbolic acid in his room.Still alive when found by a fellow roomer, he wasrushed to City Hospital, but died as he entered thehospital. He was buried in Cave Hill Cemetery,wherehe lies in an unmarked grave.
Harry Clay Pulliam had risen rapidly throughbaseball's executive ranks to the position of Presidentof the National League in 1903, when he was only 34.He was born in Scottsville in south central Kentucky,but early in his life his father moved the family to

THE BASEBALL RESEARCH JOURNAL
Harry Pulliam
Louisville to enter the tobacco business.In the late 1880s, Pulliam joined the Louisville
Commercial as a reporter after several years of workingon newspapers in California. At the same time hestudied law at the Louisville Law School and theremet Zach Phelps, prominent local attorney and Presi,dent of the Louisville ball club. Phelps and Pulliamdeveloped a close friendship, and in 1890 Pulliam leftthe Commercial, where he had risen to become CityEditor, and joined the ball club as secretary.
In 1897, Pulliam became club President and waselected to the Kentucky legislature. In 1899, BarneyDreyfuss raised his stake in the ball club and assumedthe title of President. Late that year, knowing thatLouisville was a leading candidate to be dropped fromthe National League,Dreyfuss purchased acontrolling interest inthe Pittsburgh franchise.Pulliam went with himas club secretary. Fouryears later, he waselected league president.
Pulliam, who nevermarried, was apparentlya quiet, moody, but lik,able person. He wasgiven to periods of de,pression. Friends neverknew what was thecause of this depressionbut speculated that itsomehow related to hisfamily.
Early in 1909 he suf,fered what was describedas a nervous breakdownduring a league meetingin Chicago. He took aleave and returned tohis office in early June.
On the evening ofJuly 28 he left his officeand went to his apart,ment at the New YorkAthletic Club. Afterhaving dinner at theClub, he returned to his room. At 9:30, a light on theclub switchboard flashed, indicating that Pulliamwished to place a call. The operator was unable to getany response when he answered the light and sent upa porter with a pass key to investigate. He found a
blood,spattered room with the President of,the Na~
tional League slumped on the divan, a bullet hole inhis temple and a revolver next to him. Pulliam hadapparently staggered about the room after the shotand knocked over the telephone.
A doctor was summoned. Pulliam was still alive,but was given no chance of survival. He died in hisroom the next morning.
No note was left, but Pulliam had posted severalletters before retiring that evening. One of the lettersis presumed to have been his resignation. Only specu~
lations about the weight of his duties and the effectsof his earlier breakdown were given as reasons for thesuicide. The pressures had certainly increased in theprevious year. Pulliam had long been on the wrong
side of Giants owner JohnBrush. This enmity mani,fested itself in Brush'sconsistently annually vot,ing against Pulliam'sreelection as league presi,dent. On top of this wasthe ongoing feud betweenBrush's manager, JohnMcGraw, and Pulliam'smentor, Barney Dreyfuss.With these battle linedrawn, when Pulliam up'held umpire HankO'Day's decision in theMerkle affair that ulti,mately led to the Giantslosing the 1908 pennant,it is not difficult to imag,ine the fury that fell onHarry from Brush,McGraw and the NewYork press.
The shocked familymade arrangements tohave the body brought toLouisville, where an esti,mated 1,300 people
...J attended the burial ser,coZ vices at Cave Hill
CemeteryDan McGann, a native
of Shelbyville, Kentucky, had a 13,year major leaguecareer, starting with Louisville in 1895. In 1898, hejoined the Baltimore squad as a teammate of JohnMcGraw. He shifted to Brooklyn in 1899, when theBaltimore,Brooklyn syndicate franchise loaded up the

THE BASEBALL RESEARCH JOURNAL
Brooklyn roster with the best of the two teams. In1900, he rejoined McGraw on the St. Louis NationalLeague team, then followed McGraw to Baltimore ofthe American League and finally the New York Gi,ants in 1903. McGann played six seasons in NewYork, and participated in the 1905 World Series. Hewas traded to the Boston Braves in 1908, was releasedafter the season, and played the next two years withMilwaukee of the American Association.
Following the 1910 season McGann had taken upresidence at the Bosler Hotel at -Second and Jeffersonin Louisville. It was reported that arrangements werein progress to secure his services for the Louisvilleclub for 1911.
McGann was well known around Louisville fromhis earlier playing days and the fact that his home,town was just 30 miles east of the city. The day beforehis death, he was seen around town by several ac,quaintances who reported that he was in good spiritsand looking forward to playing for Louisville in theupcoming season. Guests at his hotel agreed.
Nevertheless, on the afternoon of December 13,1910, the hotel maid had to call the manager whenshe was unable to get into McGann's room. A hotelemployee crawled through the transom and foundMcGann's lifeless body in a pool of blood on his bed.He had been shot through the chest. A .32 calibreSmith & Wesson revolver was nearby.
The coroner determined that the 39,year,oldballplayer had died of a gunshot through the heart,and declared the death a suicide. While a ring wasmissing from the player's room, other pieces of jewelryand a small amount of cash remained.
There was no note and no one, family or friend,could provide a reason for the act. McGann was thesecond brother in the family to commit suicide thatyear. During the summer, his brother Dan (theballplayer's given name was Dennis, but he alwaysplayed under his brother's given name, Dan), a rail,road agent for the L & N Railroad at Midway,Kentucky, had also shot himself to death for no appar,ent reason.
McGann's body was taken by train to Shelbyvillewhere he was buried next to his brother in Grove HillCemetery.
The fourth of the Kentucky suicides occurred inCovington, Kentucky, on March 28, 1916. EddieHohnhorst had been a slugging first baseman formany local teams before he spent two seasons withCleveland in 1910 and 1912. Most recently he had
played for the Covington Federals in 1913.In 1914, he had ended his baseball career and
joined the Covington police force as a patrolman.During 1915, he was involved in a shoot,out in thedischarge of his responsibilities. As a result,Hohnhorst had killed one of the suspects involved inthe gun battle. Apparently this event weighed heavilyon his mind. On March 27,1916, he was working thelate shift out of the South Covington station. At mid,night, he tendered his badge and club to hislieutenant and announced he was quitting. The lieu,tenant told him to go home, think things over andcome back the next day.
A fellow patrolman walked out of the station withHohnhorst and offered to take him home. Hohnhorstrefused and started walking down the street. He waswearing his patrolman's helmet and still had his re,volver. The friend returned to the station where thelieutenant told him to stay with his depressed col,league. The officer caught up with Hohnhorst at thecorner of Park and South Avenue. He found the 31,year,old Hohnhorst with a bullet wound in his righttemple.
The victim was rushed to St. Elizabeth's Hospital,where he soon died. He is buried in Highland Cern,etery, Fort Mitchell, Kentucky.
To these four major league suicide was added onefrom the minor leagues in 1921. Despondent over notmaking the Louisville club, 25,year,old pitcher ClayDaily of Frankfort went to Pepper's Cave outside thecity and shot himself with a revolver.
The Bill James Historical Abstract notes that thereappeared to be more suicides in the baseball world inthe first 25 years of the twentieth century. Twentysuicides are catalogued there in a list that is acknowl,edged to be incomplete. James speculates that thereason for this might have been rooted in the growthand expansion of American society. Men had greatambitions and lofty hopes of hard work and true gritproviding a platform upon which they might riseabove their stations in life. When this expectationcollapsed, a certain number of the disappointed tookthe seemingly easy way out via suicide. Maybe. In theend, though, all we can do is speculate about suchtragedies-and also about why a relatively small placelike Kentucky would have such a disproportionatelylarge number of occurrences. We can only speculate,and sense the terrible pain that must lie behind sucha tragic step.

Correlating Fielding andBatting Position
A careful study
Randy Klipstein
American League by Total Appearances
American League shortstops batted last 51 percentof the time. No catcher in the American League ledoff. These were the extremes. More surprising wasthat the designated hitter batted last in 161ineups!
37 481 113 188 332 306
81 450 19 58 340
266 495 39 33 156 332
403 361 44 32 244 278
585 213 123 61 320 227
688 79 389 299 387 80
173 12 415 1160 119 59
American League by Percentages
9 4
8 3
12
20 32
12 21
16 17
16 10
9
10
7
7
4
9
22
17
17
CF RF DH
CF RF DH
389 159 261
150 453 714
216 261 468
164 356 384
153 362 222
91 201 52
208 104 16
LF
LF
20
8
14
15
15
12
10
4
3
11
14
17
13
16
15
3
13
51
6
15
8
88 3B
88 3B
140 291 464 503 193 90
334 359 180 392 177 59
o2
2
17
18
2B
24
26
2BIB
IB
2
6
21
20
22
16
9
3
38 547
137 595
C
o
C
o33
4
12
18
26
30
8
8
9
6
3
4
3
4
6
8
9
Thought of the batting order brings to mind manystereotypes: the centerfielder or second baseman batslead..off; the cleanup hitter is usually the first basemanor an outfielder; the shortstop bats at the bottom ofthe order.
To better understand the relationship betweenfielding position and batting position, I undertook thefollowing study. For every regular season major leaguegame played in 1990, I recorded the fielding positionfor each batting position in each starting lineup. Ithen summed the data by league. The result is a ma..trix for each league,. with rows for each spot in thebatting order and columns for each fielding position.Each cell represents the total appearances where afielding position coincides with a batting position.
For the National League, this meant the first eightbatting order spots. For the American League, all ninebatting order positions were used. I assumed thatpitchers always hit ninth in the NL, and treated theDH as a 'null' fielding position. Thus batters hittingeighth in the NL and ninth in the AL are consideredto be batting last.
There are two basic questions which this study at..tempts to answer:
1. Where do fielders bat?2. Where do hitters field?
The same data, analyzed from different perspec..tives, is used to answer each of the questions.
Randy Klipstein is a systems analyst who lives in Tarrytown, New York.

THE BASEBALL RESEARCH JOURNAL
Similarity-One would expect that second basemenand shortstops would show similar characteristics .interms of where in the order they bat. Also, one wouldexpect that the fourth and fifth spots in the battingorder would be manned by fielders playing the sameset of positions most of the time. To measure the de ...gree of similarity between two fielding or battingpositions, I summed the absolute differences of thetotal appearances of the positions being compared.The lower the difference, the more similar the posi ...tions.
What fielding positions are most similar?Dissimilar?In the National League, the two most similar pairs
were first base/right field, and third base/left field. Inthe American League, this right and left similaritywas not evident; the most similar pairs were first baseldesignated hitter and the outfield corners.
In the NL, catchers and centerfielders were themost dissimilar.
In the AL, it was designated hitters and middle in....fielders.
National League by Total Appearances
National League by Percentages
22 398 519
159 441 130
355 212 97
RF
2702
1158
CF
2334
1966
1492 1152
2196
LF
1330 1086 1308 2216
988 984 1232
1718 2210
1196
2786
958
3B
2400
SS2BIB
2490 2026 1356 2024 2846 2986 2538
2868 2884 1290 1302 2194 558
1040 2068 2396 1878 2686
C
3B
LF
CF
RF
National League Defensive Similarity
C
IB
2B
SS
3B
LF
CF
American League Offensive Similarity
What batting positions are most similar / dissimilar?In both leagues, the middle batting order spots, par...
ticularly consecutive pairs,were generally the mostsimilar.
The last two spots were very similar in the NL, butnot in the AL. American League catchers rarely batlast in the order.
The first two positions were much more similar inthe American League. In the NL, an outfielder wastwice as likely to bat lead...off than an infielder; and aninfielder was twice as likely to bat second than anoutfielder. In the AL, the pattern is there, but toamuch lesser degree. Here is an explanation:
In the AL, the two weakest hitters will generallybat at the bottom of the order. In the NL, a managermight be reluctant to do the same, as that wouldmean there would be three weak hitters in a row(with the pitcher batting ninth). A National Leaguemanager may choose to bat one of the weak hitterssecond, using that spot to advance the base runners;thus avoiding three consecutive weak hitters. Theweak hitters are likely to be a catcher or middle in...fielders. The middle infielder is the more likely choiceto bat second, as catchers frequently ground intodouble plays, the last thing one wants from a numbertwo hitter.
Cleanup and the last spot were the most dissimilar,in both leagues.
24
9
14
30
25
15
58
17
18
6
4
4
4
3
CF RF
44 2
CF RF
846 31
333 166
346 264
109 588
87 482
86 300
79 89
32
LF
20
4
22
14
27
7
5
2
LF
388
71
430
277
85
3
10
14
20
23
11
4
o
8
18
4,0
22
SS 3B
15
SS 3B
97 285
427 67
97 190
5 266
782
17
18
2B
13
37
9
o
2B
255
711
172
8
14
97
333
354
20
35
15
18
4
o
IB
IB
38
99
394
675
301
355
73
9
C
o4
3
6
19
36
31
C
4
70
51
16
121
376
706
600
2
3
4
5
6
8
2
3
4
5
6
8
2754 2338
2904 2472
1650 1156
892
2366 2180 1984 2386
2392 2046 1414 1932
1372 1522 2270 2820
1156 1866 3208 3532
650 1392 2538 3006
744 2080 3086
American League Defensive Similarity
C IB 2B SS 3B
C 2368 2854 3158 1824
1B 3360 3334 1994
2B 1676 1580
SS 2082
LF
2410
1062
2326
2948
CF RF DH
2636 1662 2350
1856 1122 704
1504 2542 3458
2320 2680 3432
2
3
4
5
6
2
884
3
1480
1352
4 5 6 7 8 9

THE BASEBALL RESEARCH JOURNAL
Standard Deviation of Batting Positions
235 155
247 194
147 199 341
205 282
8
National League Offensive Similarity
1348 2892
2008
AL 197
NL 263
2
171
217
3
133
130
4 5 6
135
132
7 8 9
2 3 4 5 6 7 8
2096 1356 2412 2150 2352 2262 2760
1776 2806 2696 2258 1614 1806
3 1362 1170 1348 2192 2832
4 1004 1556 2730 3414
1144 2474 3158
6 1524 2208
896
What is·the standard deviation of each batting po..sition?
Or, which spots in the lineup are generally associ ..ated with one or a few fielding positions, and whichare not? In each league, the spots that were most con..stant were: first, cleanup, and the bottom of the order.This indicates that managers conform to ideas aboutwhich fielders should bat in these positions. The mostvariation is at the third position in the batting order,in each league. This reflects the variety of offensiveskills required to be a number three hitter. There is nodominant characteristic for these hitters. Speed,power, and the ability to reach base are all valued at..tributes for the third spot in the order.
Standard Deviation-I derived the standard devia..tion for each fielding and batting position, in eachleague; and used it an indication of how strong thetendency is for a fielder to bat in a certain position, ora batter to field in a certain position. The higher thestandard deviation, the stronger the tendency.
What is the standard deviation of each fielding po ..sition?
In other words, which fielders have somewhat setbatting order positions and which are more likely tobat anywhere in the order? The ranking was similarfor each league. Catchers and middle infieldersshowed the least diversification. They were followedby designated hitters and first basemen. Outfieldersand third basemen were relatively ubiquitous, reflect..ing the variety of offensive roles expected from theseplayers.
Standard Deviation of Fielding Positions
Spectrums-This refers to rankings of defensive andoffensive positions according to the level of offensiveproduction that is expected. Certainly a DH is ex..peeted to produce more offense than a middleinfielder; but a complete ranking requires a morequantitative approach. One method is to rank eachfielding position based on where the fielders bat (ordon't bat) in the order. For instance, one could rankthe defensive positions by how often each fielder batscleanup or how infrequently each fielder bats last.
Similarly, a ranking of offensive positions could beconstructed based on how often certain fielders oc..cupy that spot. For instance, one could rank battingorder positions by how often an outfielder bats in thatspot.
How do the leagues differ?Excluding random chance, all of the differences be..
tween the American and National Leagues can beattributed to the former's use of the Designated Hit..ter Rule. The standard deviation of each fieldingposition and batting order spot are generally lower inthe American League. This is expected, as anotherhitter increases the number of permutations. It is par..ticularly true among first basemen and outfielders;and the middle batting positions that designated hit ..ters typically occupy. The rule adds not simplyanother hitter, but usually another good hitter to thelineup.
The last position in the batting order is affected inseveral ways.
1. In the NL, catchers generally bat in the last twospots (67 percent of the time in seventh or eighth). Inthe AL, the catcher seldom bats last (8 percent inninth), as managers are reluctant to have a slow..footed runner bat immediately ahead of the top of theorder.
2. Shortstops are more likely to bat last in the AL(51 percent vs 40 percent). This can be attributed tothe infrequency of catchers batting last.
3. Center fielders are three times more likely to batlast in the AL.
American League managers, freed of the burden ofplacing the pitcher in the batting order, view thelineup as a cycle. An AL center fielder who isa weakhitter will often bat last, where his speed can be uti ..lized as a 'secondary' lead..off hitter.
CF RF DH
133 108 221
253 194
LF
123
174
SS 3B
339 209
248 125
2BIB
186 221
216 216
C
AL 240
NL 242

THE BASEBALL RESEARCH JOURNAL
I used the offensive spectrums to establish the de ...fensive spectrums. Multiplying the number ofappearances by the corresponding offensive ranking,and then summing the resulting totals for each field ...ing position, yielded a ranking of defensive positions,again in terms of offensive importance. For instance,in the AL, the total appearances for each fielding po...sition in the first spot in the batting order wasmultiplied by four, as lead...off was fourth from the bot...tom in the offensive spectrum. I then summed thetotals for each fielding position. The defensive spec ...trums are:
The dilemma is that to generate an offensive spec...trum using this type of method, one needs to havesome idea of the defensive spectrum (and vice versa).Therefore, a starting assumption must be made.
The approach that I chose was to assume that forcatchers and middle infielders, offense is a secondaryconsideration; for first basemen, corner outfielders,and designated hitters, it is of primary importance.Each time a catcher or middle infielder batted in agiven spot, I subtracted a point from a total for thatplace in the order; when a fielder from the lattergroup batted in that spot, I added a point. Summingthe resulting totals for each batting order positionyielded a ranking of the batting order in terms of of...fensive importance. The offensive spectrums are:
Defensive Spectrums
Offensive Spectrums
Defensive Spectrums are similar to what one wouldhave predicted. They simply offer objective evidence.
Conclusion-Every fan knows that the relationshipbetween where a player bats and fields is not a ran...dom pairing. Using quantitative methods, I have triedto bring this relationship into a clearer view.
I believe that there are two rules that shape theserelationships:
1. The more demanding the defensive position, theless demanding the offensive roll. Shortstops bat lastmore often than outfielders. Since much of ashortstop's value is defense, a poor hitting shortstopcan remain on the team and in the lineup.
2. There are certain physical attributes that are as ...sociated with skills that are valued (or avoided) atoffensive and defensive positions. A fast player islikely to play centerfield and bat at the top of the or...der. A big, muscle ... bound player will generally batfourth or fifth, and not playa middle infield position.Offensive and defensive positions are linked by skills.
These rules imply that managers share perceptionsof what are the key batting order positions and whattype of offensive production is required from each.This evidence suggests that managers are in generalagreement on how to construct a lineup.
Finally an observation: it will not come as a surprisethat those who field in the middle generally bat at thebeginning or the end; and those that bat in themiddle generally field on the left or the right. Did youknow however, that players who field on the left arelikely to bat in odd positions in the batting order andplayers who field on the right are likely to bat in evennumbered spots?
98
82
6
6
3
35
4
4
AL
NL
AL DH
NL IB
IB
RF
LF
LF
RF CF
3B CF
3B
2B
C
C
2B SS
ss
------------------~~J--------------------

1894!
The modern game's greatest hitting explosion
David Q. Voigt
Over the long river of human time, some years jutout like sentinel rocks with their numerals vividlyrecalling the great events that transpired during theirdays. Certainly that part of the river we call Ameri..can history demonstrates this effect as one needmerely utter such dates as 1776, 1812, 1865, 1918 or1963 to summon up the memories of associatedevents. And in like manner the peak events of majorleague baseball history can readily be recalled by in..voking such salient dates as 1869,1876, 1919, 1941or 1969. But if most devout fans can recount the dia..mond dramas associated with these years, how manycan invoke the stirring events associated with thetouchstone date of 1894?
Indeed, that forgotten season of a century agomarked the onslaught of the greatest hitting explo ..sion in the modern history of the major league game.The great batting eruption of '94 occurred at a timewhen batters were taking full advantage of the mod..ern 60' 6" pitching distance that was introduced onlythe year before. Coupled with the rule confiningpitchers to a 12" by 4" slab mounted atop a pitchingmound, the extra five foot pitching distance had al ..ready boosted National League batting averages froma puny .245 overall mark in 1892 to .280 in 1893. Itwas an astonishing increase, and one astute observer,veteran outfielder Jim O'Rourke, rightly cited theconfining slab rather than the extra distance for rob ..bing pitchers of the deceptive mobility that they had
Historian David Q. Voigt is a professor at Albright College.
long enjoyed while hurling from the now discardedpitching boxes.
For harried pitchers, the 1893 season was a brutalexperience, but if hurlers expected some relief fromthe 1894 rule that counted foul bunts as strikes (ex..ceptwith two strikes), they were grasping at straws.Instead, what followed was the worst pounding thatpitchers suffered in the modern history of the game.
With the NL batting averages soaring 29 pointsover the previous year's mark, it was not surprisingthat the great hitting eruption of '94 produced arecord fallout of batting achievements. For openers,NL hitters set a modern record by averaging .309 atthe plate. And by leading that onslaught with a .349average, the hard..hitting Phillies set the enduringseasonal record for team batting. What's more, thePhillies mounted another team record (since broken)by scoring at least one run a game over a skein ofgames; when the streak 'ended in 1895, their markstood at 194 consecutive games.
The Phillies' lusty hitting only carried that pitch..ing..poor team to a fourth place finish. Championshiphonors went to the more versatile Baltimore Orioles,whose .343 hitting (still the second highest team av..erage in modern history) and gritty pitching enabledthem to dethrone the three .. timechampion BostonBeaneaters. And if playing manager John Ward's run..ner..up New York Giants soured the Oriole victory bythrashing the birds in the first of four post.. seasonTemple Cup playoffs, the Orioles extended their dy..nastic sway by winning the next two NL pennants.

HE BASEBALL RESEARCH JOURNAL
Sam Thompson
....J!IIZ
teams of 1894 batted.L .... L.L .. .L.LJ-. team, the Louis ...
dead last, 54 games.. .L ............ .LV, 1YY\n~n{"'C>.,"I to bat .269.
individual batting featsyear was outfielder
The little right ...handed batter's.438 averagestill stands asthe seasonalrecord at thenew distance,and his 18 hom...ers and 145RBIs also ledthe pack in1894. By mod...ern standards itwas a TripleCrown perfor...mance, butstatisticians ofthe time tookIittle notice ofRBIs, and anynotion of a Billy Hamilton
triple battingcrown was be... homer...hitting derby Duffy's output barely topped theyond their ken. 17 blasts poled by Bill Joyce and Bobby Lowe.Indeed, Duffy However, at this time neither fans nor statisticianswas hard were much impressed by homer hitting. In fact,pressed to beat throughout the nineteenth century and as late asout rival hitters 1920, the triple was the big blow of choice. And inin each cat... 1894, Heinie Reitz of the Orioles led the way with 31egory. His three ...baggers, which was not a record. Most hits dur...closest rivals for ing this explosive year were singles; indeed, duringthe batting title the 'nineties only Dan Brouthers, Sam Thompson andwere the four Ed Delahanty managed to top the .500 mark in slug..Phillies' out... ging percentage.fielders; Tuck Nevertheless, hitters of 1894 used their heavy batsTurner swatted to drive in runs at a record setting pace. Over the.416, Sam Th... course of the 132 ..game playing season Big Samompson .404, Thompson of the Phillies averaged 1.39 RBIs perEd Delahanty game, a feat that stands second to his 1895 mark of.400, and Billy 1.42 a game. What's more, in 1894 Pop Anson, Duffy,Hamilton .399. and Delahanty each averaged better than an RBI aIn RBIs, Sam game to rank among the top 20 all .. time leaders inThompson fin... this category.
~ ished four Such prodigious hitting also produced run scoringbehind the Bos... records. Despite' the short season, outfielder Billyton star. In the Hamilton plated an unsurPetssed 196 runs. And he set
------------------;-----~~~-------------------

THE BASEBALL RESEARCH JOURNAL
another all time mark by scoring at least one run agame over 24 consecutive contests. His closest rival
, in this department is Red Rolfe of the 1939 Yankees,who managed a skein of 18 games. What's more,"Sliding Billy" Hamilton burnished his reputation asthe nineteenth century's base stealing king by swipinga league~leading 99 sacks. Although that was norecord performance, Hamilton's seven steals during asingle 1894 game is unsurpassed.
The record fallout of 1894 also included a consecu~
tive game hitting streak by Chicago infielder BillDahlen. Before going hitless during an August 7slugfest, Dahlen had hit safely in 42 straight games.But like Duffy's unsung "Triple Crown" performance,Dahlen's feat was unheralded by the more innocentstatisticians of the day. Besides, Dahlen's achievementwas fleeting. In 1897, Willie Keeler hit in 44 consecu~
tive games, which also passed unnoticed until JoeDiMaggio approached the mark on his way to hisrecord 56 in 1941.
What happened to pitching standards in 1894, toyield such awesome hitting? Not since the 1887 sea~
son, when the rules allowed batters a fourth strike andwhen bases on balls officially counted as hits, was thepitching~battingequation so tilted in favor of thebatters. But unlike the 1887 "explosion" with its"phantom" base on balls hits, there was nothing arti~
ficial about the battering pitchers absorbed in '94.Obviously, pitchers had a devilish time adapting to
the modern distance and the confining pitchingslabs. As a result overall pitching ERA rose to a hor~
rendous 5.32, and bases on balls exceeded strikeoutsby nearly 2,500. Only the Giants' pitching corps man~aged to compile an ERA in the 3.00 range. In 1894,Amos Rusie and Jouette Meekin each won 36 games,with the doughty Rusie posting what would now becalled a Triple Crown performance by leading the NLin victories (36), strikeouts (195), and ERA (2.78).
But there were few such standouts among the har~
ried pitchers of '94. Indeed, all were overworked andit would take a few more seasons before managers re~
alized that hurlers could no longer shoulder theworkloads of the pre~1893 years. Mercifully, some re~
lief came in 1895, with a rule that increased the sizeof the pitching slab to 24" by 6". That made for moremobility, and another ruling that counted foul tips asstrikes afforded some slight relief. But not until 1901 ,when the NL adopted the modern foul strike system,did the pitching~battingequation tilt in favor of the
hurlers. By then clubs also deployed more pitcherswho learned to use more varied deliveries, including
Hugh Duffy
such doctored pitches as the spitter and the cut balLAnd above all, NL pitchers had learned to controltheir deliveries. Thus, after eight seasons duringwhich NL hurlers annually walked far more battersthan they fanned, beginning in 1901, 21 seasonswould pass before walks would again exceedstrikeouts.
By 1901, the hitting explosion of the 1890s wasover. Thereafter, seasonal batting averages in bothmajors seldom rose above the .270 mark. The singleexception, of course, was the 1930 season when NLhitters averaged .303. But if short~sighted fans areinclined to fix on that date as the epitome of seasonalhitting, they should peer further down the river ofbaseball history. For the touchstone date of 1894 wasthe year when batters staged the greatest eruption inthe modern history of the major league game.
.....lcoz
------------lII;~~-------

Waiting for the Hall to Call
Charting the years between retirement and induction
Nat Rosenberg
I was 15 years old when my parents and I arrived atCooperstown, New York on August 6, 1973. It wasHall Of Fame Game Day. The Texas Rangers beat thePittsburgh Pirates 6 ... 4. We sat next to Rich Hebner'smother at the game (a wonderful woman).
A few hours later at the lobby of the Hotel Otsego,my father was sitting and talking with Buck Leonardand Satchel Paige. My grandfather took my father tomany of the old Negro League baseball games in Chi...cago and Dad knew many friends of therecently...honored Negro Leaguers.
I was content to spend the day running from oneribboned elderly gentleman to the next asking themto sign my scorecard or any other piece of paper.There were probably only about 200 people in thelobby at anyone time. Most of the fans just wanted tospeak to the Pirates and Rangers.
My mother, however, had the conversation that ledto the writing of this paper. She sat with Mrs. CaseyStengel and Mrs. Stanley Coveleski for most of theafternoon.
In their conversation, Mrs. Coveleski elegantly toldmy mother and Mrs. Stengel that had Stanley notbeen inducted into the Hall Of Fame while he wasalive, she would not have accepted the honor once hehad died. They felt he deserved the honor and hadearned it as one of the greats of the early days.
Nat Rosenberg, 36 and happily married to wife Kathy, lives in Woodridge,Illinois. He is a fulltime sales manager and a nearly fulltime baseballarcheologist and collector.
Stan Coveleski retired in 1928. He was inductedinto the Hall in 1969, 33 years after voting for theHall began in 1936. Coveleski was born in 1890. Hewas 79 when he got the call from Cooperstown. Hedied in 1984, one of baseball's immortals.
Like most baseball fans, I wonder what made HalNewhouser better in 1992 (year of induction) than hewas in 1982, 1972, or 1962. I also am thrilled that thelikes of Enos Slaughter, Bobby Doerr, Tony Lazzeri,and Hal Newhouser have been honored. I know oth...ers disagree, but I feel empty inside when theVeterans Committee does not give me even onegolden player to reminisce about, as occurred in 1993and other years.
The purpose of this paper is not to compare induct ...ees to deserving players. It is also not to build a casefor those trying to crack the magic list. It is not evento comment con the commercialization of the Hall OfFame (no 15 ...year...old will ever again experience thejoy I did spending the afternoon just talking to thegreats and their families).
The purpose of this paper is to share my research ona subject I have found quite interesting. Just how longdoes it take for a player to get into the Hall Of Fame?How old will the players be once they get there? Whyit takes so long from player to player is an issue to beleft for another time.
Lou Gehrig and Roberto Clemente were honoredearly because of their tragic early deaths. Besidesthem, only Hubbell (4), Ott (4), DiMaggio (4), andHornsby (5) sneak in under the 6 year barrier. It was

THE BASEBALL RESEARCH JOURNAL
possible to induct a person into the Hall before a 5~ Player Retire HoF Yrs Born Age
year waiting period before 1954. In 1954, the 5~year Gehrig 1939 1939 0 1903 36
grace period became the accepted law. Koufax 1966 1972 6 1935 37
The average age at induction is just under 65 years Clemente 1972 1973 1 1934 39
(64.7), but Ed Walsh is the only player to actually beRuth 1935 1936 0 1895 41DiMaggio 1951 1955 4 1914 41
inducted at age 65. The average waiting time for a Hunter 1979 1987 8 1946 41
player is 15.5 years. Don Drysdale fits the bill at 15 Ott 1947 1951 4 1909 42
years. Lou Gehrig was the youngest player (36 years Bench 1983 1989 6 1947 42
old) inducted. If he had lived, Roger Connor would Dean 1947 1953 6 1911 42
have been 119 years old when he got the call.J Robinson 1956 1962 6 1919 43Mantle 1968 1974 6 1931 43Hubbell 1943 1947 4 1903 44
Key to column headings: Feller 1956 1962 6 1918 44
Player: No managers or executives. Foxx 1945 1951 6 1907 44
Retire: The year the player retired according to The Cochrane 1937 1947 10 1903 44
Baseball Encyclopedia and Only The Ball Was White. Palmer 1984 1990 6 1945 45
Years of experience in the major leagues are notMarichal 1975 1983 8 1938 45Greenberg 1947 1956 9 1911 45
counted for Negro Leaguers. Sisler 1930 1939 3 1893 46
HOF: Year of induction. Hornsby 1937 1942 5 1896 46
YRS: The number of years it took to be voted into Aaron 1976 1982 6 1934 46
the Hall Of Fame. 1936 is ground zero for white ma~B Gibson 1975 1981 6 1935 46
jor leaguers (this is why Babe Ruth, for example,B Robinson 1977 1983 6 1937 46Banks 1971 1977 6 1931 46
shows 0 instead of 1). Time begins for the Negro Brock 1979 1985 6 1939 46Leaguers in 1971. Carew 1985 1991 6 1945 46
Born: The year the player was born. Kaline 1974 1980 6 1934 46
Ind Age: Induction Age of the player. This is the dif~ Fingers 1985 1992 7 1946 46
ference between the year of the player's birth and the Ford 1967 1974 7 1928 46
year of his induction, even in the case of posthumousGehringer 1942 1949 7 1903 46F Robinson 1976 1982 6 1935 47
induction. Grove 1941 1947 6 1900 47Morgan 1984 1990 6 1943 47
Sources: R Jackson 1987 1993 6 1946 47
National Baseball Hall Of Fame Yearbook, 1994. N a~Stargell 1982 1988 6 1941 47
tional Baseball Hall Of Fame and Museum.Berra 1965 1972 7 1925 47
Spalding's Official Baseball Guide, 1938. AmericanDickey 1946 1954 8 1907 47Mathews 1968 1978 10 1931 47
Sports Publishing Company. Mays 1973 1979 6 1931 48
Daguerreotypes 8th Edition, 1990. The Sporting McCovey 1980 1986 6 1938 48
News. Seaver 1986 1992 6 1944 48
Players Of Cooperstown, 1992. Publications Interna~TWilliams 1960 1966 6 1918 48
tional Ltd.Jenkins 1983 1991 8 1943 48Killebrew 1975 1984 9 1936 48
The Baseball Encyclopedia 8th Edition, 1990. Campanella 1957 1969 12 1921 48
Macmillan. Drysdale 1969 1984 15 1936 48
Baseball's Hall Of Fame, 1973. Smith. W Johnson 1927 1936 0 1887 49
Reach Baseball Guide, 1939. American Sports Pub~Speaker 1928 1937 1 1888 49
lishing Company.Musial 1963 1969 6 1920 49
P Waner 1945 1952 7 1903 49National Baseball rlall Of Farne And Museum Year, B Williams 1976 1987 11 1938 49
book, 1973. National Baseball Hall Of Fame and Frisch 1937 1947 11 1898 49
Museum. Traynor 1937 1948 11 1899 49
Only The Ball Was White, 1970. Peterson Carlton 1988 1994 6 1944 50
Historical Baseball Abstract, 1988. James Cobb 1928 1936 0 1886 50
Yastrzemski 1983 1989 6 1939 50Bernard Rosenberg (my father). Roberts 1966 1976 10 1926 50
Apariciu 1973 1984 11 1934 50
Cronin 1945 1956 11 1906 50
Alexander 1930 1938 2 1887 51

THE BASEBALL RESEARCH JOURNAL
Simmons 1944 1953 9 1902 51 J Collins 1908 1945 9 1873 72
E Collins 1930 1939 3 1887 52 Chesbro 1909 1946 10 1874 72
Spahn 1965 1973 8 1921 52 Rixey 1933 1963 27 1891 72
Wynn 1963 1972 9 1920 52 M Brown 1916 1949 13 1876 73
Perry 1983 1991 8 1938 53 Rice 1935 1963 27 1890 73
Boudreau 1952 1970 18 1917 53 Averill 1941 1975 34 1902 73
Kiner 1955 1975 20 1922 53 Vaughan 1948 1985 37 1912 73
Irvin 1948 1973 2 1919 54 Dandridge 1949 1987 16 1913 74
Pennock 1934 1948 12 1894 54 Bottomley 1937 1974 38 1900 74
Snider 1964 1980 16 1926 54 Jennings 1918 1945 9 1870 75
Lyons 1946 1955 9 1900 55 McGinnity 1908 1946 10 1871 75
Hartnett 1941 1955 14 1900 55 Klein 1944 1980 36 1905 75
Mathewson 1916 1936 0 1880 56 Youngs 1926 1972 36 1897 75
Lemon 1958 1976 18 1920 56 J Johnson 1938 1975 4 1899 76
Terry 1936 1954 18 1898 56 Bresnahan 1915 1945 9 1879 76
Appling 1950 1964 14 1907 57 Burkett 1905 1946 10 1870 76
Medwick 1948 1968 20 1911 57 Faber 1933 1964 28 1888 76
Evers 1929 1939 3 1881 58 Crawford 1917 1957 21 1880 77
Heilmann 1932 1952 16 1894 58 Haines 1937 1970 33 1893 77
J Gibson 1946 1972 1 1911 61 GKelly 1932 1973 37 1896 77
L Waner 1945 1967 22 1906 61 Rizzuto 1956 1994 38 1917 77
Kell 1957 1983 26 1922 61 Delahanty 1903 1945 9 1867 78
Wagner 1917 1936 0 1874 62 Lombardi 1947 1986 39 1908 78
Lajoie 1916 1937 1 1875 62 Duffy 1906 1945 9 1866 79
Wilhelm 1972 1985 13 1923 62 Wallace 1918 1953 17 1874 79
Ruffing 1947 1967 20 1905 62 Coveleski 1928 1969 33 1890 79
Maranville 1935 1954 19 1891 63 Bancroft 1930 1971 35 1892 79
Schalk 1929 1955 19 1892 63 Ferrell 1947 1984 37 1905 79
Manush 1939 1964 25 1901 63 Sewell 1933 1977 41 1898 79
Vance 1935 1955 19 1891 64 Wilson 1934 1979 43 1900 79
Gomez 1943 1972 29 1908 64 T Jackson 1936 1982 46 1903 79
Paige 1950 1971 0 1906 65 Charleston 1950 1976 5 1896 80
Leonard 1950 1972 1 1907 65 Nichols 1906 1949 13 1869 80
Walsh 1917 1946 10 1881 65 Marquard 1925 1971 35 1889 82
Tinker 1916 1946 10 1880 66 Hooper 1925 1971 35 1887 84
Reese 1958 1984 26 1918 66 Radbourn 1891 1939 3 1853 86
Schoendienst 1963 1989 26 1923 66 T McCarthy 1896 1946 10 1864 86
Herman 194,7 1975 28 1909 66 Ansull 1897 1939 3 1852 87
Keeler 1910 1939 3 1872 67 Brouthers 1904 1945 9 1858 87
Hafey 1937 1971 34 1904 67 Ewing 1897 1946 10 1859 87
Mize 1953 1981 28 1913 68 Flick 1910 1963 27 1876 87
Goslin 1938 1968 30 1900 68 K Kelly 1893 1945 9 1857 88
Doerr 1951 1986 35 1918 68 Lazzeri 1939 1991 52 1903 88
Chance 1914 1946 10 1877 69 Spalding 1878 1939 3 1850 89
Bender 1925 1953 17 1884 69 Cummings 1877 1939 3 1848 91
Baker 1922 1955 19 1886 69 Lloyd 1931 1977 6 1884 93
Roush 1931 1962 26 1893 69 O'Rourke 1904 1945 9 1852 93
Slaughter 1959 1985 26 1916 69 Hamilton 1901 1961 25 1866 95
Cuyler 1938 1968 30 1899 69 Joss 1910 1978 42 1880 98
Young 1911 1937 1 1867 70 Kelley 1908 1971 35 1871 100
Waddell 1910 1946 10 1876 70 Foster 1926 1981 10 1879 102
Hoyt 1938 1969 31 1899 70 Clarkson 1894 1963 27 1861 102
Bell 1946 1974 3 1903 71 Ward 1894 1964 28 1860 104
Plank 1917 1946 10 1875 71 Beckley 1907 1971 35 1867 104
Wheat 1927 1959 23 1888 71 Rusie 1901 1977 41 1871 106
Carey 1Y2Y 1961 25 1890 71 Keefe 1893 1964 28 1857 107
Grimes 1934 1964 30 1893 71 Galvin 1892 1965 29 1856 109
Coombs 1935 1970 34 1899 71 Welch 1892 1973 37 1859 114
Lindstrom 1936 1976 40 1905 71 Thompson 1906 1974 38 1860 114
Dihigo 1945 1977 6 1905 72 Connor 1897 1976 40 1857 119

Do Lefties Mature Late?
An examination of the "Koufax Phenomenon"
Perry Sailor
The conventional wisdom in baseball has longheld that lefthanded pitchers are an essentially differ...ent breed from their "normal" righthandedcounterparts. Read widely about the game, and I'llguarantee you'll find plenty of statements like these:
"Lefties think screwy.""Typical wild lefty.""Lefties' pitches have better movement.""Lefties have more stuff.""Little lefties can sometimes be successful; little
righties can't."To my knowledge nobody has come up with a single
credible explanation for why any of these might betrue-for that matter, I've never seen hard evidencethat any of them are true. But among baseball men,"everybody knows" they're true.
One statement which I have read-most recentlyin USA Today on the day this is being written-hasparticularly intrigued me: "Lefties mature late." Nowthis is something which, if widely believed, couldhave a profound influence on certain pitchers' ca ...reers. Say a team has two 27 ... year... old pitchers, onelefthanded, the other righthanded. These two pitch ...ers have each spent time in. the majors, have goodarms and a lot of ability, but neither of them has man...aged to get command of his stuff and turn into a realpitcher. Which one will be released or traded, andwhich will get another year to try to turn it around?
Perry Sailor a lefty, is a data analyst at the Early Intervention ResearchInstitute at Utah State University in Logan, Utah.
My guess is that the lefthander will get that extrayear, because of the belief that lefties are late devel ...opers. I call this belief the "Koufax phenomenon,"because I think that Sandy Koufax's incredible suc...cess, after years of struggling to put it together, hascreated a powerful archetype in the minds of baseballpeople, which continues today to benefit young-andnot so young-lefties still trying to get over thehump. Is the Koufax phenomenon simply a vivid ex...ample of what is in fact a common pattern? Is theconventional wisdom true? Is there still hope forDavid West? This study is a report of my attempt tostudy the question objectively and systematically.
Definitions-There are two major issues to be re ...solved before we can begin a study of when pitchersreach maturity. First, we must come up with an objec...tive measure of pitching performance, preferably asingle number that will let us rate a pitcher's perfor...mance and rank the seasons of his career. Second, wemust define "maturity."
I used ERA as the measure of performance, withone small adjustment: I divided the pitcher's ERA foreach season by the league ERA (LERA) for thatleague in that season. For example, if a pitcher's ERAfor a given season was 3.75, while the league ERA forthe same season was 4.03, the pitcher's adjusted ERA(AERA) would be 3.75/4.03 = 0.93. This was done sothat pitchers seasons could be ranked even thoughhitting conditions may have changed over time. Forexample, here are two seasons in the career of a ficti ...
------------,----------~0~~ -------------------

THE BASEBALL RESEARCH JOURNAL
Average1.561.54
RighthandersLefthanders
RighthandersLefthanders
RighthandersLefthanders
suIt would have been very misleading. This can eas..ily happen with anyone individual, but over a largegroup, flukes tend to cancel out. All in all, I thinkthis method is an accurate indicator of when a pitcherhas developed to the limits of his ability.
The second definition of time to mature was theage at which the pitcher first reached the majors fora minimum of 30 innings. This defines maturity interms of a fixed standard, rather than the pitcher'sown eventual ability level.
The third definition of time to mature is the num..ber of years between reaching the majors and the firstpeak season. I derived this for each pitcher by simplysubtracting his age during his first season from his ageduring his first peak season.
The sample in this study was all pitchers born inthe 1930s who had at least three seasons of 30 ormore innings pitched. This included 201 pitchers142 righthanders and 59 lefthanders. I chose thisgroup because all of them have completed their ca..reers. Results are show in Tables 1..3 below.
Table 2. Age at Pitcher's First 30.. Inning SeasonNo. Average142 23.659 23.8
Table 1. Age at First Peak SeasonNo. Average142 25.259 25.4
For each definition of time to mature, the differ..ences between righthanders and lefthanders aretrivial and quite likely to occur by chance, accordingto a conventional statistical test called a "Student's t
test."Rather than focusing on averages, another way to
study the issue is to focus on those pitchers who didmature late. Are they more likely to be lefthanded?No, they are not. Twenty..nine percent of these pitch..ers (27 percent of righties, 34 percent of lefties) hadtheir first peak season at age 27 or later. Again, thedifference between right.. and lefthanders is verylikely to occur by chance. Only five, and only onelefty (Koufax himself), peaked after eight or more
Table 3. Number of Years Between Pitcher's First Sea..son and His First Peak Season
No.14259
tious pitcher:Season ERA LERA AERA
A 3.75 4.20 0.89B 3.65 3.50 1.04
Clearly, Season A was better in its context, eventhough the pitcher's ERA was lower in Season B.AERA reflects this. (This is similar in concept toThorn and Palmer's Normalized ERA (NERA), aspresented in The Hidden Game of Baseball. The differ..ence is that they use LERA divided by ERA, ratherthan the reverse, so a higher number reflects a betterperformance. They also remove the decimal. WithAERA, as with ERA, a lower number is better.)
The second issue to be resolved is to define whatconstitutes maturity. What might it mean to say"Lefties mature late"? Does it mean that they tend toreach their peak ability at a later age? That they tendto reach the majors at a later age? That the time be..tween reaching the majors and reaching peak abilityis longer? I chose to study the issue using each of theabove definitions in turn, reasoning that if all threepointed to the same conclusion, we could be veryconfident that it was correct. I defined each pitcher's"age at peak ability" as follows. First, I listed hisAERAs by season, along with his age. that year. ThenI found his best three seasons (with a minimum of 30innings). The age of his peak ability was the age atwhich he had the first of his three best seasons, or hisfirst "peak season." This was the age at which he wasessentially "as good as he ever got." For example,here's Sandy Koufax's career:
Age AERA19 0.7520 1.3021 1.0022 1.1323 1.0324 1.0425 0.8726 0.6427 0.5728 0.4929 0.5830 0.48
Atypically, Sandy's best season was his last, at age30, closely followed by the three previous seasons. Hisbest three were at ages 30, 28, and 27, so I define 27as his age at peak ability. In the remainder of thisstudy, this will be called the "first peak season."
This method is not perfect. Although it prettymuch confirms what we know about Koufax, we cansee that if he'd had a little more luck at age 19, the re..
-----------e~J-----------

HE BASEBA
....J!DZ
Ted Abernathy
seven seasons to mature, rathersame career pattern with two of
had their bestmany years as starters. The other
ro"t"Y"'r)1r'\C,rt starters and still had theirBob Gibson, and
are only seeming par...group of 201 pitchers.
however, none madequite that Koufax did. Perry's and Gibson's
years-except 1968-were not dramati ...several seasons early in their careers.
years in the majors.The conclusion
seems quite clear.This study found noevidence for differ...ences betweenlefthanded andrighthanded pitchersin average time tomature.
Individual CasesHow common is itfor pitchers, right ... orlefthanded, to showthe Koufax pattern?How many pitchersreach maturity, asdefined by the "firstpeak season"method, after eightyears in the bigleagues? Very fewin fact, only five ofthe 201 in this study.Besides Koufax, theothers wererighthanders TedAbernathy, DaveGiusti, MudcatGrant, and RonKline, all of whomposted peak AERAyears as relievers af...ter long careers asstarters.
Abernathy was inthe majors at 22,making 14 starts and26 relief appearancesfor the Senators, and getting hammered for a 5.96ERA. He got 20 more starts and 11 relief appearancesthe next two years, and was even worse. He then ba ...sically disappeared for five years, but came back at 30as a submarining relief ace and had his best years at34, 37, and 39. Giusti, Grant, and Kline show verysimilar patterns, except they were better as startersthan Abernathy. Grant, in fact, led the AL in victo ...ries and shutouts for the pennant ... winning Twins atage 29. But all three posted their best AERAs afterbecoming relief aces in their 30's.
If we relax the criterion a little and look at the

THE BASEBALL RESEARCH JOURNAL
Table 4. Age at First Peak Season, Among PitchersWith Long Careers
Table 6. Number of Years Between Pitcher's First Sea..son and His First Peak Season, Pitchers With LongCareers.
subsample-Koufax and the four righties describedabove in the analysis of the full sample of 201-ma..tured after eight or more big league seasons.
Average25.725.6
Average22.622.6
Average3.052.93
No.5627
No.5627
RighthandersLefthanders
RighthandersLefthanders
RighthandersLefthanders
Table 5. Age at Pitcher's First 30.. Inning Season,Pitchers With Long Careers.
No.5627
Summary-For this sample of 201 pitchers, and forthe subgroup of83 pitchers with long careers, therewas no evidence that the average time to mature wasany different for lefthanders than righthanders. Fur..thermore, the Koufax phenomenon-a big leapforward in ability after many years at a lower levelwas not especially characteristic of lefthanders, andwas in fact pretty much limited to Koufax. The veryfew other pitchers having their best ERA years late intheir careers were quality starters who converted torelief, much as Dennis Eckersley has done in recentseasons; or pitchers who were already quite good, butwere still able to improve somewhat. I wouldn't beton David West to make a breakthrough.
They were already fine pitchers who just got a bitbetter. Gibson reached the majors at 23 and won 28games with low ERAs at 25 and 26. Perry also reachedthe bigs at 23, and was a 21 ..game winner in his fifthseason. And Law makes the list only because he spent1950 and 1951 (age 20 and 21) getting shelled forthose awful Pirate teams, when he probably shouldhave been in the minors. He didn't come back to themajors until 1954, when he was 24, and had his firstpeak year at 27, although by far his best year was at35. Interestingly, Gibson, Perry, and Law were allrighthanded.
How Long Does it Take Most Pitchers to Peak?Based on this sample, pitchers-right.. andlefthanded-peak earlier than is commonly believed.Fully half of the 201 pitchers in this study had whatturned out to be one of their three best AERAs intheir first season. Of course, this finding may simply bean artifact of the fact that a lot of marginal pitchershave short careers. To check this possibility, I ana..lyzed the careers of the 83 pitchers in this group whohad at least 10 years between their first and last sea..sons in the majors. This eliminated anyone who couldbe considered a marginal talent. Even among thisgroup of pitchers who had long careers, 49 percent(52 percent of the righties, 44 percent of the lefties)had a peak season in one of their first three years.
I also examined this subsample of pitchers withlong careers for evidence of the Koufax phenomenon.There still appeared to be no average tendency forlefties to mature late, by any of the three definitionsof time to mature (Tables 4..6). Thirty..nine percent ofthe 83 pitchers with long careers matured at 27 orolder-36 percent of the righties, and 44 percent ofthe lefties. The small difference in favor of lefties islikely to occur by chance, as determined by a statisti..cal (chi ..square) test. Only five pitchers in the
-------------------~~r-------------------
Baseball's Amateur Draft
An abstract analysis
David C. Thomas
A major league team's amateur draft has alwaysbeen judged by how many of its signed picks make itto the majors. This abstract analysis focuses, not nec...essarily on a team's signed draft choices, but on all theplayers that a given team drafts, signed or unsigned,and ranks the team's drafting performance based onall the players' cumulative lifetime major league re ...suIts in key statistical categories. I've broken downthe rankings by draft years, decades, and for the over...all draft period of 1965 through 1989. I've thencompared the statistical rankings to post season per...formance to determine how each team's draftingcapabilities compares with its actual post ... season re ...suIts.
If the total number of draft signings is not the pri ...mary criterion for evaluating a given team's draft, howcan we determine the success of baseball drafts? Thisanalysis provided a balanced statistical weighting be ...tween career major league batting and pitchingstatistics that combines longevity (at bats and inningspitched) with performance (homeruns, RBIs, battingaverage and wins, won... loss percentage, ERA). Eachteam's draft year player statistics are added togetherby year, decade, and overall (1965 through 1989).Each of the eight statistical categories (four .battingand four pitching) are then ranked based on the num...ber of teams in the majors during that given draftperiod. These eight categorical rankings are then
David C. Thomas is a product manager for AMP Incorporated inGreensboro, North Carolina.
added together, by team, to determine a final rankingpoint total. Last, this point total is ranked to deter...mine each team's statistical performance for a givenperiod. These rankings are detailed in this analysis.
Having determined the statistical rankings, we nowwant to analyze actual team post ... season perfor...mances. Let's assume a team's post seasonparticipation, based on a point system, is a more ac ...curate measure of a team's performance than acumulative won... loss record. Given that the draft be ...gan in 1965 and that it usually takes a few years forplayers to develop before advancing to the majors, wecan conveniently track drafted players' performancesfrom the beginning of divisional playoffs in 1969through the 1992 playoffs. By setting up a point sys...tem that awards one point for divisional champions,three points for league champions, and five points forWorld Series winners, we are able to calculate andrank a team's post season performance that can thenbe compared against the previously determined statis ...tical rankings.
Reviewing the results of this analysis, we find thatthe best drafting teams of the 1960s, 1970s, and 1980swere the Dodgers, the Expos, and the Mets, respec ...tively, with the Dodgers holding the best overallresults during the entire draft period despite a signifi...cant fall ... off in the 1980s. It is interesting to point outonly one American League team is listed in the topseven overall. Even more significant, with the excep'"tion of the batting rankings of the 1970s when playerssuch as Brett, Yount, Molitor, Boggs, Murray, Rice,
~------------------...,..c0r-------------------

THE BASEBALL RESEARCH JOURNAL
Lynn, Baines, Henderson, and Willie Wilson were Other interesting findings also stand out whendrafted by American League teams, the National comparing overall team statistical draft rankings andLeague has dominated statistically, based on the ca~ actual post~seasonperformance rankings. The Pirates,reer results of their draftees. This is clearly indicated Reds, Royals, Mariners, White Sox, and Dodgers wereby the overall (1965~1989) average rankings by very close to their statistical versus actualrankings.league, even when factoring out the two 1977 Ameri~ The A's, Blue Jays, Orioles, and Phillies, significantlycan League expansion teams. With the exclusion of outperformed their statistical rankings, while thethese two teams, the statistical average ranking of the Angels, Expos, Red Sox, Giants, Rangers, Cubs, andremaining 24 teams is 12.5, providing there are no Cardinals were clearly underperformers.ties at a given ranking. In comparing the overallrankings,we find the National League to have a 10.83 Other highlights of this draft research study:average ranking and the American League a 13.75 The Blue Jays, who only started drafting in 1977,ranking. This difference is so impressive that we had the fifth best draftee pitching results in thewould naturally assume the actual post~seasonresults 1980s.to favor the National League. In fact, though, the The Pirates have made the most draft selectionsAmerican League has won 14 of the 25 World Series (1628) in the history of the amateur draft. Roundingsince divisional playoffs began in 1969. out the top five are the Mets (1598), the Orioles and
OVERALL
1965,1969 1970,1979 1980,1989 1965,1989
TEAM TEAM TEAM TEAM
RANKINGS RANKINGS RANKINGS RANKINGS
Team Bat Pitch Comb. Bat Pitch Comb. Team Bat Pitch Comb. Bat Pitch Comb.
Angels 19 4 13 7 9 4 Angels 16 8 13 12 6 8
Athletics 3 18 10 3 24 17 Athletics 6 21 10 2 25 15
Blue Jays Blue Jays 21 5 17 26 14 24
Brewers 10 22 18 Brewers 12 13 12 18 24 22
Indians 17 9 17 22 21 24 Indians 17 17 18 22 16 21
Mariners Mariners 4 16 6 25 26 26
Orioles 3 17 9 16 f7 18 Orioles 25 23 25 7 20 14
Rangers 10 16 15 11 16 15 Rangers 19 7 19 16 18 16
Red Sox 2 11 4 4 19 11 Red Sox 10 8 9 1 14 5
Royals 9 4 2 Royals 6 2 2 15 4 8
Tigers 20 13 18 5 14 6 Tigers 24 26 26 19 13 17
Twins 6 7 5 20 20 23 Twins 8 8 5 9 12 11
White Sox 16 19 20 11 8 10 White Sox 22 18 22 21 19 20
Yankees 13 11 13 7 12 6 Yankees 9 15 11 8 9 8
AVE. 10.9 12.5 12.4 10.4 15.5 12.8 AVE. 14.2 13.4 13.9 14.4 15.7 15.4*
Astros 15 15 16 21 18 21 Astros 18 25 24 22 23 25
Braves 14 5 7 15 23 22 Braves 22 11 20 17 17 17
Cardinals 9 8 7 1 13 3 Cardinals 12 3 6 3 8 2
Cubs 18 3 11 24 2 14 Cubs 2 20 8 24 3 13
Dodgers 1 1 1 18 1 4 Dodgers 20 22 22 4 1 1
Expos 1 3 1 Expos 14 12 15 12 11 12
Giants 7 10 6 13 6 9 Giants 3 24 13 6 10 7
Mets 8 2 3 22 7 20 Mets 1 1 1 10 2 4
Padres 14 11 13 Padres 14 18 16 20 22 23
Phillies 12 20 19 5 15 8 Phillies 26 13 21 10 21 19
Pirates 10 13 11 17 5 12 Pirates 11 4 4 12 4 6
Reds 5 6 2 19 10 16 Reds 4 6 3 5 7 2
AVE. 9.9 8.3 8.3 14.2 9.5 11.9 AVE. 12.3 13.3 12.8 12.1 10.8 10.9*
*Overall rankings without expansion teams; AL,13.75, NL,10.83
-------------<0J--·---------

THE BASEBALL RESEARCH JOURNAL
OVERALL ACTUAL OVERALL
STATISTICAL 1965~1992 VS.
1965~1989 POST~SEASON ACTUAL
RANKINGS RANKINGS RANKING
Angels 8 19 ~ 11
Athletics 15 1 +14
Blue Jays 24 12 +12
Brewers 22 17 +5
Indians 21 24 ~3
Mariners 26 24 +2
Orioles 14 3 +11
Rangers 16 24 ~8
Red Sox 5 14 ~9
Royals 8 9 ~ 1
Tigers 17 13 +4
Twins 11 7 +4
White Sox 20 22 ~2
Yankees 8 5 +3
Astros 25 20 +5
Braves 17 14 +3
Cardinals 2 9 ~ 7
Cubs 13 20 ~7
Dodgers 1 3 ~2
Expos 12 22 ~10
Giants 7 16 ~9
Mets 4 6 ~2
Padres 23 17 +6
Phillies 19 11 +8
Pirates 6 7 ~ 1
Reds 2 2 0
Yankees (1597), and the Indians (1573).The Mets have had the most signed and unsigned
draft picks make it to the majors (197) followed bythe Rangers (196), the Angels (193), the Giants(191), and the Cardinals (176) . With the exceptionof the Mets, the other top five teams sending draftedplayers to the majors happen to also be theunderperforming teams mentioned earlier. Draw yourown conclusions.
Of the non,expansion teams, the Cubs sent theleast number of drafted players (148) to the majors.
The highest percentages of total signed and un,signed drafted players making it to the majors versustotal players drafted were the Padres and Red Soxwith 16.37 percent and 16.1 percent, respectively.The lowest percentages were the Pirates (10.09 per,cent) and the Orioles (10.54 percent). Given theseteams' better than average post,season performances,it could be suggested that drafting in quantity mayhave its benefits.
The Rangers have had the most overall higher than20th round draft picks (38 selections over 28 years ofdrafting) that made it to the majors.
The next table shows team statistical bests andworsts by decade and the overall period of 1965
through 1989The Expos high team batting average in the 1970s
was a result of drafting the likes of Andre Dawson,Gary Carter, Warren Cromartie, Tim Wallach, HubieBrooks, and Tim Raines in the same decade.
The Red Sox had the highest percentage (12.41percent) of signed players only, versus total playersdrafted to make it to the majors. The Padres were sec..ond (11.81 percent) and the Rangers third (10.12percent). The Pirates and Orioles had the lowest per..centages with 5.21 percent and 6.27 percentrespectively. As mentioned previously, the Pirates andOrioles were in the top five of total players draftedand actually had more players make it to the majorsthan the Red Sox despite having a "signed" playerpercentage of roughly half that of the Red Sox.
Twenty,nine last round draft choices have made itto the majors. Some of the better known players, andthe teams that drafted them in which year and round:
Doug Griffin Angels 1965 21Dick Billings Senators 1965 25Steve Hovley Angels 1966 35John Wockenfuss Senators 1967 42Andy McGaffigan Reds 1974 36
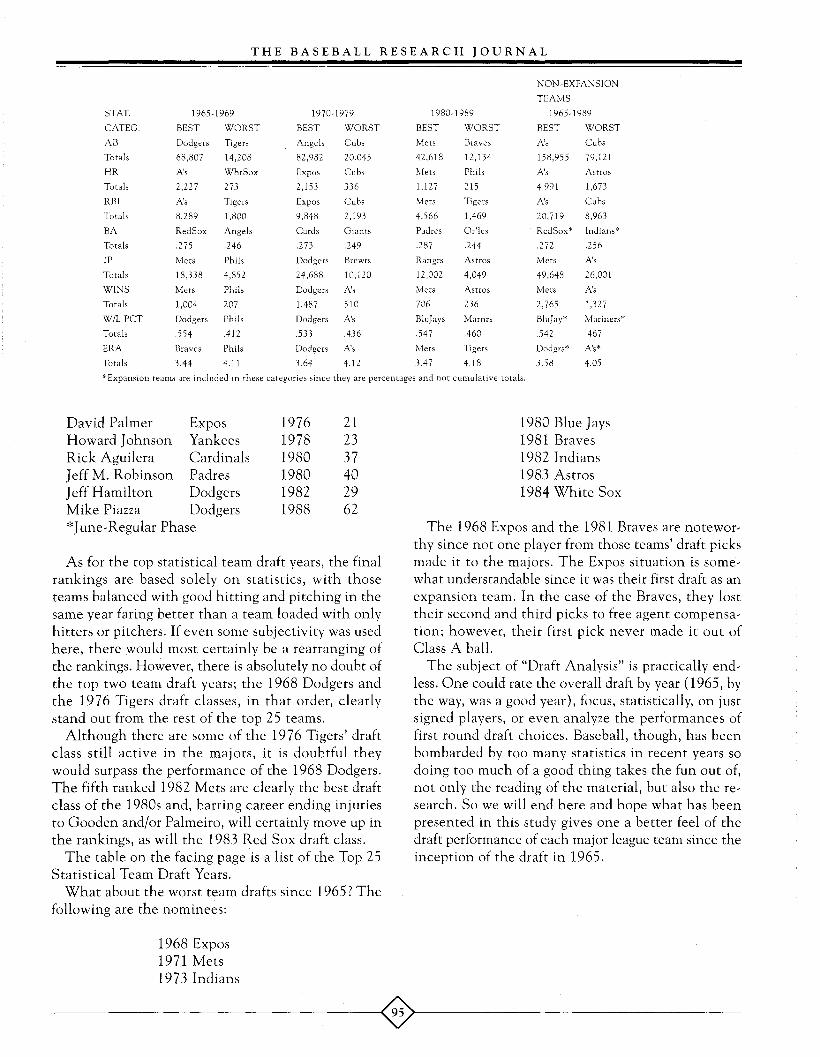
THE BASEBALL RESEARCH JOURNAL
NON,EXPANSION
TEAMS
STAT. 1965,1969 1970,1979 1980,1989 1965,1989
CATEG. BEST WORST BEST WORST BEST WORST BEST WORST
AB Dodgers Tigers Angels Cubs Mets Braves A's Cubs
Totals 68,807 14,208 82,982 20.045 42,618 12,134 158,955 79,121
HR A's WhtSox Expos Cubs Mets Phils A's Astros
Totals 2,227 273 2,153 336 1,127 215 4,991 1,673
RBI A's Tigers Expos Cubs Mets Tigers A's Cubs
Totals 8,289 1,800 9,848 2,193 4,566 1,469 20,719 8,963
BA RedSox Angels Cards Giants Padres Or'les RedSox* Indians*
Totals .275 .246 .273 .249 .287 .244 .272 .256
IP Mets Phils Dodgers Brewrs Rangrs Astros Mets A's
Totals 18,338 4,852 24,688 10,120 12,002 4,049 49,648 26,001
WINS Mets Phils Dodgers A's Mets Astros Mets A's
Totals 1,004 207 1,487 510 706 236 2,765 1,327
W/L PCT Dodgers Phils Dodgers A's BluJays Marnrs BluJay* Mariners*
Totals .554 .412 .533 .436 .547 .460 .542 .467
ERA Braves Phils Dodgers A's Mets Tigers Dodgrs* A's*
Totals 3.44 4.11 3.64 4.12 3.47 4.18 3.58 4.05
*Expansion teams are included in these categories since they are percentages and not cumulative totals.
As for the top statistical team draft years,the finalrankings are based solely on statistics, with thoseteams balanced with good hitting and pitching in thesame year faring better than a team loaded with onlyhitters or pitchers. If even some subjectivity was usedhere, there would most certainly be a rearranging ofthe rankings. However, there is absolutely no doubt ofthe top two team draft years; the 1968 Dodgers andthe 1976 Tigers draft classes, in that order, clearlystand out from the rest of the top 25 teams.
Although there are some of the 1976 Tigers' draftclass still active in the majors, it is doubtful theywould surpass the performance of the 1968 Dodgers.The fifth ranked 1982 Mets are clearly the best draftclass of the 1980s and, barring career ending injuriesto Gooden and/or Palmeiro, will certainly move up inthe rankings, as will the 1983 Red Sox draft class.
The table on the facing page is a list of the Top 25Statistical Team Draft Years.
What about the worst team drafts since 1965? Thefollowing are the nominees:
David Palmer ExposHoward Johnson YankeesRick Aguilera CardinalsJeff M. Robinson PadresJeff Hamilton DodgersMike Piazza Dodgers*June..Regular Phase
197619781980198019821988
212337402962
1980 Blue Jays1981 Braves1982 Indians1983 Astros1984 White Sox
The 1968 Expos and the 1981 Braves are notewor...thy since not one player from those teams' draft picksmade it to the majors. The Expos situation is some...what understandable since it was their first draft as anexpansion team. In the case of the Braves, they losttheir second and third picks to free agent compensa...tion; however, their first pick never made it out ofClass A ball.
The subject of "Draft Analysis" is practically end..less. One could rate the overall draft by year (1965, bythe way, was a good year), focus, statistically, on justsigned players, or even analyze the performances offirst round draft choices. Baseball, though, has beenbombarded by too many statistics in recent years sodoing too much of a good thing takes the fun out of,not only the reading of the material, but also the re ..search. So we will end here and hope what has beenpresented in this study gives one a better feel of thedraft performance of each major league team since theinception of the draft in 1965.
1968 Expos1971 Mets1973 Indians

THE BASEBALL RESEARCH JOURNAL
TOP 25 STATISTICAL TEAMDRAFT YEARS
PLAYERS
TO
RANK TEAM YEAR MAJORS KEY PLAYERS
1 Dodgers 1968 15 Garvey, Cey, Buckner, Lopes, Zahn
2 Tigers 1976 13 Morris, Kemp, Trammell, Petry, O. Smith
3 Reds 1969 9 Grimsley, Gullet, Griffey, Grubb
4 Red Sox 1968 5 Cooper, Ogilvie, Curtis, Lee, McGlothen
5 Mets 1982 17 Gooden, Palmeiro, Daniels, R. Myers
5 Pirates 1972 10 Candelaria, W. Randolph, J. Morrison
7 Royals 1971 10 Brett, Wathan, Littell, Busby
8 Athletics 1967 8 Blue, Soderholm, Dar. Evans
9 Cardinals 1971 9 K. Hernandez, Herndon, Mumphrey, Langford
9 Dodgers 1977 7 Welch, M. Hatcher
11 Twins 1969 5 Blyleven, Burleson
12 Red Sox 1971 10 Smalley, Rice, E. Rasmussen, Kuiper
12 Orioles 1967 7 Grich, Baylor, Oates, Rau, Montague
12 Red Sox 1983 9 Clemens, Burks, Manwaring, M. Brumley
15 Reds 1965 5 Bench, Carbo, McRae, P. Reuschel
16 Braves 1966 6 Seaver, F. Duffy, G. Ross
17 Indians 1972 10 Kuiper, Manning, Eckersley, Dauer
18 Giants 1968 6 G. Maddox, G. Foster, G. Matthews, Goodson
19 Dodgers 1979 5 Howe, G. Brock, Welch
20 Reds 1967 9 W. Simpson, Kendall, Chambliss
21 Dodgers 1981 8 Bream, S. Fernandez, D. Anderson
22 Angels 1966 12 K. Forsch, Messersmith, Barr, Hovley
23 Athletics 1965 10 Monday, Bando, Tenace
24 Mets 1965 10 N. Ryan, K. Boswell, Renko, McAndrew
25 Dodgers 1965 5 Seaver, A. Foster
The Buck Stops HerePhillies pitcher Bucky Walters lost both ends of a doubleheader to the Cardinals in 1937, 10~3 and 18~10. Si]ohnson
won both games. Walters and]ohnson were the starters in the opener, relievers in the 1O~inning nightcap.
A Gone GooseGoose Goslin of the Tigers hit into four straight double plays in a game with the Indians in 1934.
It's Lonesome at FirstPhillies first baseman Dolph Camilli tied a major league record by playing a nine~inning game in 1937 without a putout.
The Phils lost to the Reds, 1~O .
Doubles Yes, Double Plays NoAugie Galan of the Cubs hit 41 doubles in 1935, but didn't hit into a single double play. He played all 154 games.
-Don Nelson

A Brief History ofthe Complete Game
An endangered species
Dennis Stegmann
N umbers. Some are memorable, some aren't.Some astound us, some amuse us, and some do both.I can't tell you what I paid for my first new car but Ican recall other numbers with razorlike precision.Certain historical dates, for example, or familybirthdates. It's all a matter of priorities. To almost anybaseball fan, numbers are not just a priority, they arethe heart and soul and measuring stick of the game.Certain numbers have a nearly magical quality aboutthem-.367, 511, 61, 56, 714-or 755 to fans of morerecent vintage-, 190, 749.
The 749, of course, refers to Cy Young's lifetimecomplete games total. And if there are unbreakablebaseball records, this must be at or near the top ofthelist. This is an astonishing record. Pitchers of todayprobably get arm cramps simply on hearing of it.
Before taking a closer look at complete games, theirdecline, and its consequent affect on the game I mustmake two disclaimers: first of all, the old completegame records may look unbreakable at the presenttime, but there may come a time, in future centuries,when human evolution will have created super..ath..letes capable of pitching all day every day-mytongue is firmly in my cheek-or when player de ..lays-coffee breaks for batters between pitches,homerun trots that last longer than some SouthAmerican governments, pitchers who reason that ifthey don't throw the ball the batter can't possibly hitit, among others-will have created the necessity for
Dennis Stegmann lives in St. Louis.
three inning games. Secondly, I recognize that all ofCy Young's complete games were thrown in thepitcher..friendly dead ..ball days, the days when entireteams hit fewer homeruns in a season than some re ..serve infielders do today. But dead baIlor not, 749complete games is still a lot of pitches.
Why the decline?-Let us step back in time and ex..amine some numbers. In professional baseball'searliest days complete games were the rule, ratherthan the exception. Many pitchers-good ones andbad-completed 90 to 95 percent of their starts, andcompleting 50,60, even 70 or more games in a seasonwas not rare.
There are many reasons for the large number ofcomplete games-short schedules, shorter pitchingdistances, small rosters with room for only one, two,or three pitchers, and rules that regulated and dis ..couraged substitution. As time went on, scheduleslengthened, rosters were expanded, and the pitchingdistance stretched out. After 1893, we find teams us ..ing three or four regular starters. There were stillnearly as many complete games, percentage ..wisethey were just spread among more pitchers. No longerwould one pitcher throw 74 complete games in a sea..son as Will White did in 1879 (only a handful ofpitchers since 1900 have thrown 40 complete gamesin a season, none since 1920), but some amazing to ..tals were compiled in the first decade of the twentiethcentury, with 1904 being the year when the completegame cup truly ran over. The Boston Pilgrims (Red

THE BASEBALL RESEARCH JOURNAL
Sox) set the all .. time record that year with 148 com.. figure had more than tripled to 155. A third influenc..plete games out of a total of 157, while the St. Louis ing factor may be that pitchers threw more pitches inCardinals set the National League record with 146 1915 than in 1905. There were, for example, 1289out of 155. The New York Highlanders (Yankees), de.. more walks issued in 1915 than in 1905. Before leav..spite 48 complete games from Jack Chesbro-the ing the decade that saw the beginning of the declinemost in this century-and 38 from Jack Powell, fin.. of the complete game, we should also note Cy Young'sished last in the major leagues with 123 complete last complete game, in 1911.games in 155 chances. The two leagues combined After seeing such a drop in complete games be ..for-hold on, now-2,187 complete games, both tween the first and second decades of the century, weleagues establishing records that, not surprisingly, still would expect to see a drastic drop in the heavy..hit ..stand. The 16 Major League teams averaged 137 com.. ting 1920s. But a look at the numbers fails to confirmplete games per team. Chesbro led the majors with 48 this. There was a drop ..off, yes, but a less drastic onewhile Jack Taylor of the Cardinals completed 39 than that in the previous decade. The AL team leaderstraight starts between April 15 and October 6. Actu.. averaged 90 complete games per year from 1921 .. 1930,ally, this was not much more than a normal season for a drop of 13 per year from the 'teens, while the NLTaylor, who holds the modern record for percentage leader averaged 89, a drop of 10 games from the pre ..of complete games in a career and who completed all vious decade. In again taking a random year forof his starts in 1898, 1899, 1902, 1903, 1904, and comparison, in 1925 all AL teams averaged 72 com..1905. No doubt suffering from a tired arm, he slipped plete games vs. 83 in 1915 and the NL averagebadly in 1906, completing only 32 of 33 starts. dropped to 79 from 85.
The complete game mentality of those days also 1920 saw Grover Cleveland Alexander andcarried over to World Series play with nine complete Burleigh Grimes each complete 33 starts, the most-games being pitched in the five ..game Series of 1905, along with Robin Roberts' 33 in 1953-,-for a Nationaland with Deacon Phillippe tossing five in the 1903 League pitcher since then. There were three otherseries alone. significant complete game achievements in the 1920s,
The team leader in both the National and Ameri.. two of them occurring in World Series play. In thecan Leagues averaged 129 complete games per season 1928 Series, a ho ..hum four game sweep of the Cardi..between 1901 and 1910. Surprisingly, we see a huge nals by the mighty Ruth..Gehrig Yankees, threedrop ..off, percentage..wise, in complete games between Yankee pitchers-Pipgras and Zachary with onethe first and second decades of this century. The apiece, Hoyt with two-combined for four completeAmerican League team leader dropped from an aver.. games. In Game Six of the 1926 Series, Groverage of 129 complete games from 1901 .. 1910 to 103 per Cleveland Alexander became, and remains, the old..year from 1911 .. 1920, while the National League est (39) pitcher to throw a World Series completeleader dropped from 129 to 99. In 1905, American game. Finally, in a game that neatly wrapped up theLeague teams averaged 122 complete games and Na.. whole dead..ball era, on May 1, 1920, pitchers Joetional League teams averaged 125, but by 1915, AL Oeschger of Boston and Leon Cadore of Brooklynteams averaged 83 and NL teams averaged 85. each nearly pitched the equivalent of three complete
There are a few apparent reasons for the drop ..off. games in one in the course of their epic 26 .. inningFor one thing, increases in roster size meant there duel. (As an aside, not only would one more inningwere more pitchers around. In 1906, the average have given both pitchers the equivalent of three com..pitchers used per team in the majors was just over plete games each, but it would have given Oeschgernine, while in 1915 the average was 14. In 1905, 300 innings pitched for the season and, perhaps, athere were 67 major league pitchers with 20 or more bargaining chip for his 1921 contract. As it is, he re ..decisions, in 1915 the total falls to 56. With more mains forever perched at 299. Too bad all around.)pitchers around-in 1905 there were 146 pitchers in The 1930s and '40s show a general, gradual, de ..the majors, as opposed to 224 in 1915-pitchers crease in complete games, with the AL team leaderdidn't have to complete games simply because there dropping from 90 in the 1920s to 86 the '30s and 87was no one else available to pitch. '40s and the NL team leader falling off from 89 to 85
Another important factor was the increased use of to 82 over the same time. The only significant com..relief pitchers in what we would now call save situa.. plete game record to come out of those years was thetions. Applying our modern stat retroactively, in 36 complete games tossed in 1946 by Bob Feller, still1905, there were 44 saves in the majors. By 1915 the the best in baseball since Grover Cleveland
-------- ----------~~J--:--.----------- ------

..Jco2
the drop is the greaterin close game save
save totals increased from. The save was here to stay.
enter the picture in theAL in 1961 and the NL in
contributed to surges in com..in years; and 3. decade long
r\'IT'T1"Y',rY averages which surely contributedcomplete game. For ex--
Cy Young and Bob Feller
Alexander had 38and Walter Johnsonhad 36 in 1916.
The 1950s con..tinue the decline ofcomplete games, butin a more dramaticfashion. We see a de ..crease in theAmerican Leagueteam leader averageof 19 between the1940s and '50s, and aNational League de ..crease of 13 betweenthe decades. An ob..vious reason is thegreater use of a reliefpitcher to close outvictories, with an in..crease in saves from218 in 1945 to 356in 1955. The numberof pitchers with tenor more saves wasthree times greaterin 1955, and it is ob..vious that more andmore managers nolonger expected nineinnings out of theirstarters. Old habitsdie hard, and it isalso obvious fromthe complete gametotals that manytired pitchers werestill being allowed tostagger through nineinnings, but we cansee the idea of usingmore than onepitcher, no matter the score, "--'''-'>""'' '""''
in this decade, an idea that r-"".--...r "/>rI
the 1960s and '70s, and then vL"l>..I-/.L'--''-.... v
The 1960s saw another drop in r-"r"'r'\ICl.rCl.
team leader average falling infrom 67 in the 1950s to 55 into 61 in the NL over the sameAmerican League teams averaged 4.5in 1965 the average fell to 32.not as great: from 48 in 1955 to

THE BASEBALL RESEARCH JOURN AL
ample, in 1968, the San Francisco Giants set themodern-post 162..game schedule-NL record of 77complete games. Another factor which probably con..tributed to the complete game surge in theNL-which was to continue until 1973-was anabundance of power pitchers who-along withknucklebailers-seem to contribute a large share ofcomplete games in any given season. Pitchers such asBob Gibson, Juan Marichal, Fergie Jenkins, TomSeaver, Steve Carlton regularly threw 20 to 30 com..plete games per season. In the World Series between1965 and 1968, the winning pitcher pitched a com..plete game in 22 of the 25 games played.
As noted above, the complete game resurgencecontinued in the National League until 1973, atwhich point it leveled off to an average of nearly 50per year for the rest of the decade. The AmericanLeague in the 1970s saw one dramatic rule changewhich, on the surface, would seem to have been amajor factor in the AL's team leader average increas..ing from 55 in the 1960s to 70 in the 1970s. (In theNL the leader average dropped from 61 in the '60s to52 in the '70s.) The rule change, of course, was theDesignated Hitter rule, and in its first year the ALleader, the California Angels, had 72 completegames-the most for an AL team since 1954.
For the rest of the '70s the AL leader averaged 67complete games per season. Yet in the three seasonspreceding the DH, 1970.. 1972, the leader averaged 64complete games per season. Strangely, the DH seemsto have had less effect on AL hurlers than NL pitch..ers-or, perhaps, on NL managers, who may have feltpressured to resort to all manner of measures in orderto contrast with their AL counterparts. Whatever thecase, in the five years prior to 1973 the NL leagueleader averaged 69 complete games per season, andfrom 1973 .. 1977 the leader averaged 48 completegames per season. However, there is no doubt thatoverall the DH did increase complete games in theAL. In 1975, for example, AL teams averaged 52complete games, in contrast to the 1965 average of 32per team, and in contrast also to the 1975 NL averageof 36 per team.
The complete game numbers for the seasons of1980 and '81 are skewed. In 1980, Billy Martin's ap ..parent attempt to destroy the young arms on hisOakland Ns pitching staff resulted in their tossing themodern (162 game schedule) record total of 94 com..plete games. In 1981, the strike played havoc with thecomplete game totals, though percentage..wise they
were above normal thanks to Martin and his Oaklandrubber..arms.
The rest of the '80s showed another great decreasein complete games, with AL seasonal leaders down 27per season from the '70s and the NL leader down 19per year. And, DH or no D'H, by 1990 a NationalLeague team led the majors for the first time since1972. In 1985, AL teams averaged 26 complete gameseach as opposed to 52 in 1975 and the NL was downto 22 from 36 in 1975. Also, in the '80s we begin tosee entire teams with fewer than 10 per season. Nodoubt the increase use of "stoppers" to finish closegames played a part in this, but a more important rea..son for the near disappearance of complete games inthe '80s was-and remains-free agency, which beganin the mid.. '70s and which resulted in salaries in thestratosphere by the '80s.
It is quite possible that complete game totals wouldhave fallen more drastically 10, 20, even 30 years ear..lier except that pitchers needed complete games aspart of their salary argument, something not as nee..essary today. In fact the opposite may be truetoday-why risk a sore arm and the loss of a fortunefor a higher complete game total? Economics, in base..ball as elsewhere in our society, is often thedetermining factor.
In the '90s we continue to see a decrease in com..plete games, to the point where in 1991 the NLleaders (Glavine, Martinez) fell below 10 for the firsttime, and the 1991 New York Yankees established anew team low with three. We may soon see a teamcomplete a season without a complete game.
Will we see a change, a resurgence of completegames? I think not. Few power pitchers even throwthem now, and there are only a couple ofknuckleballers. Complete games are a rarity even inLittle League, high school, Legion, college or minorleague ball today, and a number of those are six.. orseven.. inning games, hardly preparation for a nine.. in..ning major league game. If pitchers are not throwingcomplete games at lower levels they are not likely tobegin throwing them at the major league level. Addi..tionally, many coaches and managers establish pitchlimits for pitchers, which virtually assure that theywill not pitch nine innings. So while more completegames might mean some positive things for baseballobservers-quicker games, cleaner scorecards and in..creased offense-Cy Young's 749 seems safe for theforeseeable future.
-------------------~~r--------------------

On Batting Order
The Monte Carlo approach
Steven Seifert, M.D.
The 1992 BRJ article by Mark Pankin proposedthe Markov model (MM) as the way to determine abetter batting order. This model uses matrix algebraon "transition probabilities" based on assumptionsmade regarding batters' baseline performance. For aparticular team, he computed the expected runs pergame for 1800 randomly generated batting orderswhich allowed him to evaluate each player batting ineach position 200 times. He then determined theoptimal lineup from the results by extrapolating opti ...mal offensive values and characteristics for eachbatting position. He gave two examples, the 1991Minnesota Twins and the 1991 Toronto Blue Jays andcompared their conventional wisdom (CW) orderwith that determined by the MM. The mathematicalbasis of the Markov model is logical and elegant, butbecause there is no way to actually test the resultantorder, the Markov model is incomplete and, as I willshow, its results fall somewhat short of the goal of anoptimal batting order.
I have developed a Monte Carlo Simulation(MCS )which can evaluate the run production of anyproposed batting order. With this model I can dem ...onstrate first, that the conventional wisdom (CW) isdefinitely not the optimal batting order (OBO); sec ...ond, that the Markov model, as described for the
Steven Seifert, M.D. lives in Tucson, Arizona, is a lifelong baseball fan, andcoaches Little League. He has been interested in the question of batting ordersince 1966, and developed this model in 1990 using an IBM ...compatible80486 computer and programming in BASIC. He encourages comments viaCompuServe (ID# 73237,100).
1991 Minnesota Twins and Toronto Blue Jays, is bet...ter than the CW but it does not yield the optimalorder for those teams; third, that the Monte CarloSimulation model allows a determination of the OBOfor any collection of nine players, although no onesimple rule applies, and fourth, that such an approachhas other implications for the analysis of offensivestrategy in general.
Computer Model-How does a Monte Carlo Simula...tion work? For our example, let's use the 1991Minnesota Twins cited by Pankin. We specify all ofthe relevant offensive statistics for each batter in thelineup (based on his full season data, which we willcall his baseline performance) and then enter theplayers into the simulation in the conventional wis ...dom order (Gladden, Knoblauch, Puckett, Hrbek,Davis, Harper, Mack, Pagliarulo, Gagne). As withthe Markov model, base advancement occurs accord ...ing to major league average probabilities. We assumethat batters will/ perform similarly to their baselineperformance and use that performance to determinetheir results at the plate as follows.
The leadoff batter, Gladden, comes to bat. Thegame simulation generates a random number betweenoand 1 and compares it with his on...base percentage(OBP) of 0.303. Since the number generated is ran...dom, there is a 0.303 chance that the number will beequal to or less than that number. If the randomnumber generated is less than or equal to 0.303, thenGladden is assumed to have gotten on base. If we
------------------_---.:~~-------------------

THE BASEBALL RESEARCH JOURNAL
have determined that Gladden has gotten on base(that is, the random number was less than or equal to.303), we next look to see what portion of Gladden'son,base at,bats have resulted in walks, singles,double, triples, home runs, and so forth. A new ran,dom number would be generated and compared withthese various probabilities to determine the result ofthis plate appearance.
Likewise, if the original random number had beengreater than 0.303, this plate appearance would bedetermined to have resulted in an out. Further ran,dom numbers would tell us whether this was a simpleout, a sacrifice or a ground,into,double,play (GIDP).If Gladden reached first base, further random numbergenerations compared with actual performance woulddetermine if he attempted a stolen base and whetherhe was successfuL Strict percentages, correspondingto major league averages, would govern the advance,ment of runners and the occurrence of fielding errors.The game would continue thus until nine inningswere over and the total number of runs scored wouldbe recorded.
One structural aspect of the Monte Carlo Simula,tion program, which, I believe, corrects a flaw in theMarkov model, needs to be addressed here. A batterwill face a different proportion of offensive opportu,nities if he is placed in a different batting slot than hisusual one-different frequencies of finding men onbase ahead of him, for example.
Strict adherence to a batter's baseline performancewould require you to allow a GIDP (when the randomnumbers generated indicated this result) regardless ofwhether there was a man on,base. This would resultin a final performance of this batter identical to hisbaseline performance. A more flexible (and realistic)approach allows the program to have him, at the ex,pense of strict statistical results, hit into a double playonly when there is another man on base. Thus, if weallow the program to accept the situations created bya new batting order and to react in a realistic manner,a batter's performance may vary ·slightly from hisbaseline performance. The elements affected includesacrifices, steals, intentional walks and GIDP's Thiscontext,sensitive approach seems to more accuratelyreflect how changing the batting order would alteroffensive performance, which is a great advantage.
Remember, there is no other team against whichour hypothetical team is playing. There is no provi,sion for what sort of pitcher it is facing or how thepitcher is performing. No strategy is employed ingame situations either offensively or defensively.Every event is otherwise rigidly determined by these
pre,set rules and the probabilities of the actual play..ers. The result is the score that this particular teamproduced under those rules batting in that particularorder.
In any single game under these circumstances, thenumber of runs scored can be 0 or 20. Gladden whohad a batting average of 0.247, can go 0,for,4 or hecan go 4,for,4 because, in anyone game, the nature ofusing random numbers results in performances whichmay be significantly different from an individual'saverage performance.
But let us not stop at one game. Let us use thissame hypothetical team batting in the same battingorder and play another game. In fact, let us have thisteam play one million games just like this (it takesthis many games to achieve statistically significant re ..suIts). At this point, Gladden is batting very close to0.247, because over time the random numbers gener..ated to determine his performance average out to thisvalue. Likewise, all of the other batters will performvery close to their real,life probabilities. Now if welook at the average number of runs scored for such ateam we discover that, batting in this order, it aver..ages 5.1468 runs per game.
Now we have a tool by which we can test hypoth..eses about batting order. If we change the battingorder of our hypothetical team, we can see what effectthat has on the run production. By varying the bat..ting order we can try to find orderings that producemore runs per game, on average, than the conven..tional wisdom.
What about the Markov model order proposed byPankin (Hrbek, Davis, Mack, Puckett, Harper,Gagne, Gladden, Pagliarulo, Knoblauch)? If we runthe MCS in this order we find an average of 5.1952runs per game (a season increase of 8 runs over theCW-exactly what Pankin predicted). Is this, then,the optimal batting order?
Basic principles of the Optimal Batting Order(OBO)-From analysis of the MCS model usingmany different teams in a variety of batting orders,the primary principle that emerges is that if the stron...ger batters (let's call it run producing ability) get upto bat more times than the weaker batters, the teamwill produce more runs. We can demonstrate this bylooking at our team batting in the exact opposite ofthe Markov model order. Knoblauch, whom the MMchooses to bat ninth, instead now leads off, followedby Pagliarulo, Gladden, etc. If we now play one mil,lion games with this lineup we discover that this teamonly scores 5.115 runs per game on average, resulting

THE BASEBALL RESEARCH JOURNAL
Bases, TBB=Total Walks, IBB=Intentional Walks, SF=Sacrifice Flies,
Where: H=Hits, W=Walks, CS=Caught Stealing, HBP=Hit By Pitch, TB=Total
(RC). If our batter hits a home run, for example, he"creates" 4 runs. Every time he draws a walk he "cre ..ates" 1.26 runs, and so on. Hitting home runs is theeasiest way to increase RC.
Now, if we divide the number of "runs created" bythe total number of plate appearances we have theratio "runs created per plate appearance" (RCPPA).The RCPPA formula takes all offensive actions intoaccount and tells you who creates more runs per tripto the plate. (J ames argues that we should look at"runs created per out" [RCPO], but the Monte CarloSimulation model demonstrates that RCPPA is morepowerfuL)
Power hitters, in general, have the highestRCPPA's. To find our optimal batting order, battersshould initially be ordered by descending RCPPA.This rule works best when there is a clear and consis ..tent decrease in offensive production from one playerto the next. We make adjustments to this rule byplacing (if possible without trading off RCPPA) bat ..ters with higher OBP's in the batting slots with highliklihoods of leading off innings. The leadoff slot isthe most important, and can tolerate a lower RCPPAfor a sufficiently high OBP. The leadoff batter's OBPneed not be higher than the number two batter'sjust high enough to increase run production in thoseinnings that he leads off more than he decreases runproduction (relative to a batter with a higherRCPPA) in those innings that he doesn't. Because abatter's actual performance in the simulation willchange slightly from his baseline performance (be ..cause we have allowed the simulation to take contextinto account) we actually have to run the simulationand experiment with orders to find the optimal orderfor any given team.
(AB+W +HBP+SF+SH)
(H+W~CS+HBP~GIDP)x (TB+(.26 x (TBB~IBB+HBP)+
(.55 x (SF+SH+SB))RC =
Table 1. Runs Created Formula.
SH =Sacrifice Bunts, SB=Stolen Bases
in 13 fewer runs over the course of the season. Weshould not be surprised. We have our weaker hittersgetting up to bat more often, and our best run produc..ers are near the end of the batting order, where theyget up to bat the least. The seasonal difference innumber of at .. bats is not triviaL In fact, from manyrunnings of various lineups, the computer model canpredict the percentage that each batting slot gets ofthe total number of plate appearances. Over thecourse of a 162 game season, the first hitter gets about140 more plate appearances than the ninth hitter, orabout 17.5 extra at bats for each notch up in the bat..ting order. So the overriding basic principle is this: Ifwe have our better run producers getting up to batmore frequently over the year we will produce moreruns.
A baseball game is limited by the number of outs inan inning and the number of innings in a game. In..creased plate appearances increase run scoringopportunities. So there is an advantage to havingplayers with high on.. base percentages higher in thelineup when possible. The trick is determining whenthe increase in runs produced by this move exceedsthe decrease in runs caused by moving a weaker runproducer (a table setter) ahead of a stronger one (apower hitter).
Finally, we need to look at specific batting slots.The one characteristic that the Monte Carlo Simula..tion identifies as important is the percentage of timesthat each batting slot leads off an inning, since thesimulation verifies the principle that having runnerson base at the beginning of an inning is a desirableoccurrence. The first batting slot has the distinctionof leading off an inning more than twice as often asany other batting slot. In fact, about 40 percent ofthe leadoff batter's plate appearances will lead off aninning. Batting slots four and five also have a slightlyhigher than average rate of leading off innings butthis is much less significant.
Specific batting attributes other than run produc..ing ability and OBP do not appear to be ofsignificance in matching a batter to a slot.
What determines the relative run producing po ..tency of a batter? Bill James, in his Baseball HistoricalAbstract, has developed a formula that he uses to com.. Discussion-The 1991 Minnesota Twins was a fairlypare the relative offensive worth of two players or two typical team in terms of distribution ofbatting talentteams. This is his Runs Created formula. and conventional wisdom ordering. In the Monte
In this formula (Table 1), each of a player's offen.. Carlo Simulation we find the conventional wisdomsive parameters contributes a weighted amount to the produces 5.1468 runs per game, the MM producesnumber of runs he "creates" at the plate. By limiting 5.1952 runs per game and the OBO (straight descend..a player to one at bat, we can see the effect of each ing RCPPA) produces 5.2219 runs per game, anpossible result at the plate in terms of runs created improvement with the OBO over the course of the
----------------------e~~-------------------

THE BASEBALL RESEARCH JOURNAL
season of 12 runs over the CW and 4 runs over theMM.
Notice that the OBO leads off with Davis, theteam's homerun leader. When there is nothing to begained by placing a high OBP/lower RCPPA player inthe number one slot, (because the highest RCPPA
ment of Alomar and White ahead of Carter in theOBO requires explanation. Because of context ... sen'"sitive changes in performance in that order, theRCPPA's of those players change to produce the or...dering used. The difference between this orderingand using a straight descending RCPPA (from slots
Table 2. Conventional v. Markov Model v. Optimal Batting Order and player RCPPA's and OBP's, 1991 Minnesota Twins
Conventional Wisdom Markov Model Optimal Batting Order Optimal Batting Order
5.1468 rig, 834 r/seas. 5.1952 rig, 842 r/seas. 5.2219 rig, 846 r/seas. RCPPA OBP
1. Gladden 1. Hrbek 1. Davis .1694 .3849
2. Knoblauch 2. Davis 2. Mack .1671 .3620
3. Puckett 3. Mack 3. Hrbek .1469 .3708
4. Hrbek 4. Puckett 4. Puckett .1371 .3480
5. Davis 5. Harper 5. Harper .1321 .3348
6. Harper 6. Gagne 6. Knoblauch .1167 .3502
7. Mack 7. Gladden 7. Pagliarulo .1102 .3206
8 Pagliarulo 8. Pagliarulo 8. Gagne .1015 .3065
9 Gagne 9. Knoblauch 9. Gladden .0952 .3033
player also has the highest OBP), you don't need tomodify a straight descending RCPPA. You may la ...ment a Davis solo leadoff homer in the first inning,but he'll get up to bat 70 more times over the courseof the season than in his CW slot. In the end, it re ...suIts in more runs being scored.
On the other hand, the 1991 Blue Jays are an ex ...ample of a team with a very narrow range of offensiveability, with the top six or seven players being veryclosely bunched. Also, the CW order used by theBlue Jays was mucQ closer to the OBO than is typical.Using a modified descending RCPPA and comparingits results with the CW and MM in the Monte CarloSimulation, we find that the OBO produces three ad...
two to nine) is one run per season. The Markovmodel uses three players with lower RCPPA's in thefirst three slots, but note that they have high OBP's.This partially compensates for the loss of RCPPA butnot enough. I believe that the difference of only onerun between the CW order and the MM order (in...stead of the nine runs predicted by Pankin) isexplained by the closeness of the CW order to theOBO and the fact that the Monte Carlo Simulationmodel takes into account offensive context ratherthan just strict adherence to baseline performance.
Although the 1991 Blue Jays had uncommon uni ...formity of performance from their top six or sevenbatters, which results in a very small benefit for the
Table 3. Conventional v. Markov Model v. Optimal Batting Order and player RCPPA's, OBP's, 1991 Toronto Blue Jays.
Conventional Wisdom Markov Model Optimal Batting Order
4.7517 rig, 770 r/seas. 4.7594 rig, 771 r/seas. 4.7747 rig, 774 r/seas.
Optimal Batting Order
RCPPA OBP
1. White 1. Mulliniks
2. Alomar 2.0lerud
3. Carter 3. Maldonado
4.0lerud 4. White
5. Gruber 5. Alomar
6. Maldonado 6. Carter
7. Mulliniks 7. Gruber
8 Borders 8. Borders
9 Lee 9. Lee
ditional runs per year over the MM and four runs overthe CW model.
Notice the placement of Mulliniks at the top of theorder in both the MM and the OBO. This is becauseof his high OBP despite a low RCPPA. The place ...
1. Mulliniks .1068 .3636
2. Alomar .1494 .3463
3. White .1462 .3399
4. Carter .1523 .33
5.0lerud .1339 .3512
6. Maldonado .1305 .3423
7. Gruber .1217 .3059
8. Borders .0852 .266
9. Lee .0725 .268
OBO, the use of the OBO for the 1990 Blue Jayswould have resulted in eight additional runs. I don'tthink I need to remind Blue Jays fans that that teamfinished only two games out of first place. The teamswhich would benefit the most from adoption of the

THE BASEBALL RESEARCH JOURNAL
OBO are those with one or two particularly potentbatters with high RCPPA's who are not batting earlyin the lineup (the 1991 Minnesota Twins, 1990 De ...troit Tigers and 1989 Mets). The teams which wouldbenefit least from this approach are those with rela...tive uniformity of RCPPA's among its batters or whoare already using their high RCPPA batters in theearly batting slots (the 1991 Dodgers and TorontoBlue Jays).When tested against real team lineups overthe course of the last three seasons, the difference be ...tween theOBO and the conventional wisdom isusually projected to be between six and 12 runs perseason.
Pankin's achievement in analyzing offensive strat ...egy through the Markov model is impressive. TheMonte Carlo Simulation model verifies most of hisfindings: Stolen base ability in the leadoff batter isnot relevant; putting a weak hitter in the second slotis indeed "a prescription for a lower... scoring battingorder," and most of the difference in expected runsbetween batting orders shows in the first inning.
Other findings suggested by the Monte Carlo Simu...lation model are that (1) base running speed addsonly about one run per season per exceptional runner;(2) RBIs and runs scored are more a function of wherein the order a batter hits than as an indicator of bat...ting proficiency; and (3) that intentional walks inalmost any context result in additional runs. (Usingthe computer's game simulation, if we increase thenumber of walks various batters receive in differentdegrees and game situations-to reflect both inten...tional walks and more cautious pitching-we alwayssee an increase in the average number of runs per
game. This implies that pitchers can't "pitch around"the stronger hitters to defeat a descending RCPPAapproach.)
Pankin also raises the question of loss of "protec...tion" that the CW leadoff and second batters now getfrom batting ahead of the power hitters in the third,fourth and fifth slots. However, it seems as likely asnot that any changes in performance produced bychanges in batting order protection will cancel outwith some batters having decreased run creating pro ...ductivity because of the loss of protection while otherbatters will improve their run creating productivitybecause of new ...found protection.
Finally, we have been talking only of using year... to ...date (or full ...year), averaged data. In actual practice,an OBO would use performance against right/left ...handed pitching, a moving average RCPPA (thistakes into account players who are on streaks andslumps) and have a few other enhancements. I esti ...mate that these modifications could increase theactual efficiency of the OBO by another 50 percent to100 percent, up to 25 runs per year over current con...ventional wisdom. This level of increased runproduction would: (1) maximize offensive output; (2)be statistically demonstrable in a relatively short time(we could also use predicted changes in runs per in...ning to validate the model); (3) provide a significantincrease in victories (if adopted by only a few teams),and (4) would lend some scientific precision to whatis currently a collection of generally erroneous beliefsand archaic practices. As Pankin suggests, "math...ematical and statistical techniques can be useful toolsfor designing higher... scoring batting orders."
56,511 ....Don't forget Whitey Ford and his World Series achievements when you think of records that may just last forever. Ford
is No.1 in:Decisions: 18Wins: 10Games: 22Starts: 22Innings pitched: 146Strikeouts: 94.
On the flip side, he also leads. in:Losses: 8Hits: 132Bases on Balls: 34.
-Jim Murphy
-----------------------i~J--------------------
The True Triple Crown
A better measurement?
Mark Simon
In the aborted season just past, Frank Thomas andJeff Bagwell were making exciting runs at the TripleCrown. While the Triple Crown is a measure of greathitting ability in its own right, a more accurate way tomeasure hitting greatness is available. It is what I call"The True Triple Crown".
The True Triple Crown (henceforth referred to asthe TTC), like its counterpart, requires winning threeprestigious titles. To win this crown, though, a hittermust lead the league in Batting Average, On.,BasePercentage and Slugging Percentage. As opposed tothe Triple Crown, which relies too much on luck(RBIs) and power hitting (HRs), the true crownshows all three assets that demonstrate outstandinghitting ability. Batting Average demonstrates the abil.,ity to hit the ball, on.,base percentage shows that thehitter was selective in what he chose to swing at,while slugging percentage shows a hitter's ability tohit for power. Since 1900, the TTC has been won 39times, including once in the Federal League. How.,ever, it has only been taken five times in the past 40seasons, and no one has come remotely close to win.,ning it since George Brett's incredible season in 1980.
The first post., 1900 TTC was accomplished in 1901by Hall.,of.,Famer Napoleon Lajoie of the Philadel.,phia Athletics. Lajoie went on to win it again in 1904with the Cleveland Indians. The 1900s was the mostprosperous decade for TTC winners, producing 10. By
Mark Simon, son of SABR member Richard Simon, is a sophomorejournalism major at Trenton State College. He is currently sports editor of hiscollege paper, The Signal.
contrast, during the the 70s no hitter was able to wintheTTC.
The two hitters who dominated the TTC in theireras were Rogers Hornsby and Ted Williams. Hornsbywon the crown an amazing six years in a row andseven times overall, while winning the real TripleCrown twice. Williams, who also won two TripleCrowns, not only won the TTC six times, he was alsothe oldest to win it, taking it in 1957 at the age of 38.
Several TTC's have been denied by the slimmest ofmargins. Ty Cobb lost the award twice by .001-inbatting average in 1910 (although he was mistakenlycredited with this title for many years, and many stillthink he deserves it because of the way NapoleonLajoie was "given" hits by the Browns on the last dayof the season), and in slugging percentage in 1911.Ted Williams was denied a tying seventh crown by.00016 in the batting race of 1949. (Williams wouldhave won in 1954, t~o, if his bases on balls hadcounted as official at bats for purposes of the battingtitle. But in those days, they didn't.) In 1970, CarlYastrzemski lost a chance at a second TTC by .00037to Alex Johnson in the batting race.
Strangely enough, players who have won the TTChave had a tough time getting into the World Seriesthe year in which they won. Of the 36 times since1903 that the award has been won, only seven of theirteams made it to the World Series, while only two ofthem won it. Of the four years in which the honorwas achieved in both leagues, only once, in 1909, didthe two winners meet in the World Series. In that fall
-------------------~~)----------------------

THE BASEBALL RESEARCH JOURNAL
classic Hanus Wagner's Pirates bested Ty Cobb's Ti ..gers four games to three with Wagner falling one hitshy of winning the World Series TTC.
George Brett opened the 80s by winning theAmerican League TTC with a .390 BA a .461 SA anda .664 OBA. This broke baseball's longest TTCdrought-13 years. Brett's TTC gave the AmericanLeague a 20 .. 17 edge in TTC winners over the N a..
tional League, which has not had a TTC winner sinceStan Musial in 1948.
Why is the TTC so rare today? Over the last 20years, batting titles have been soaked up by singleshitters like Rod Carew, Wade Boggs, and TonyGwynn, while the slugging title generally goes to.250... 280 hitters like Cecil Fielder, Mark McGwireand Fred McGriff.
TTC Winners
Yr Player Team BA
1901 Nap Lajoie Phi (AL) .426
1902 Ed Delahanty Was .376
1904 Honus Wagner Pit .349
1905 Cy Seymour Cin .377
1906 George Stone StL (AL) .358
1907 Honus Wagner Pit .350
1908 Honus Wagner Pit .354
1909 Honus Wagner Pit .339
1909 TyCobb Det .377
1910 Sherry Magee* Phi (NL) .331
1915 Benny Kauff Bkl (Fe) .342
1916 Tris Speaker Cle .386
1917 Ty Cobb Det .383
1918 Ty Cobb Det .382
1966 Frank Robinson Bal
1967 Carl Yasztremski Bos
Rogers Hornsby Stl
Rogers Hornsby Stl
Rogers Hornsby Stl
Rogers Hornsby Stl
Rogers Hornsby Stl
Babe Ruth NY
Rogers Hornsby Stl
Rogers Hornsby Bos (NL)
Chuck Klein Phi
Lou Gehrig NY
Arky Vaughan Pit
SA
.643
.590
.520
.559
.501
.513
.542
.489
.517
.507
.509
.502
.571
.515
.559
.639
.722
.627
.696
.739
.756
.632
.602
.706
.607
.704
.735
.648
.562
.634
.702
.615
.731
.637
.622
.664
OBA
.451
.449
.419
.427
.411
.403
.410
.420
.431
.445
.440
.470
.444
.440
.431
.458
.459
.459
.507
.513
.489
.498
.422
.465
.491
.462
.551
.499
.425
.499
.450
.497
.528
.415
.421
.461
.370
.397
.401
.384
.424
.378
.403
.387
.368
.363
.385
.349
.406
.356
.357
.343
.376
.369
.388
.316
.326
.390
Bos
Bos
Bos
KC
Bos
Bos
Bos
Stl
Stl
1920
1921
1922
1923
1924
1924
1925
1928
1933
1934
1935
1938 Jimmie Foxx
1941 Ted Williams
1942 Ted Williams
1943 Stan Musial
1947 Ted Williams
1948 Stan Musial
1948 Ted Williams
1957 Ted Williams
1980 George Brett

Al Kermisch is an original member of SABR.
Jim Corbett almost an Oriole in 1894In January 1894, Ned Hanlon, manager and presi,
dent of the Baltimore club of the National League,made an effort to sign Heavyweight Champion JamesJ. Corbett as a member of the Orioles. After Corbetthad successfully defended his title by knocking outEnglishman Charley Mitchell at Jacksonville, Floridaon January 25, 1894, Hanlon offered Corbett the thenexorbitant sum of $10,000 for the season or $1,000 aweek for the months of July and August. Corbett, whohad theatrical commitments, expressed interest in thetwo month deal.
Following is an excerpt from an article that ap,peared in the Baltimore Sun on January 31, 1894:
"A special dispatch to THE SUN from Boston lastnight says that champion 'Jim' Corbett will probablyplay ball with the Baltimore Base,Ball Club duringJuly and August of 1894. He said yesterday to THESUN's correspondent: 'If manager Hanlon wants meduring those two months I shall seriously consider theoffer of $1,000 a week which he made me. I shall bedisengaged for that period. My company will be idleand you may say I will come very near accepting.'
"Mr. Hanlon, who returned from New York yester,day, said when asked about his offer to Corbett: 'I firstoffered Corbett $10,000 for the season, which he re,
From A Researcher's Notebook
Al Kermisch
fused. I then telegraphed him I would pay him $1,000a week during July and August. The offer was made ingood faith, and I shall be glad to sign him at theseterms. Although the public doesn't seem to know it,Corbett is an excellent ball,player. He was noted forhis heavy batting, and both Van Haltren and "Fred"Carroll, who have played with him in the CaliforniaLeague, say he is a good outfielder and a fair pitcher.I hope he is in earnest about becoming an Oriole. Myoffer is still open to him and will remain so. '"
The next day Hanlon's offer to Corbett was de,nounced in New York by the directors andstockholders of the New York and Brooklyn clubs.They declared that if the Baltimore club insisted onit, the affair would be taken before the NationalLeague at the convention to be held in New York onFebruary 26. Since the league frowned on it, the offerwas quietly withdrawn.
As things turned out the Orioles got along verywell without Corbett and surprised the baseball worldby winning the first of their three successive pen,nants. In 1893 they had finished eighth in the12,club league.
While Corbett did not get a chance to play in themajors, he did playa lot of minor league baseball,starting in 1895. He travelled from city to city, play,ing first base for the home team. He continued to playin the bushes for five years and showed a handsomeprofit for his barnstorming.
As Joe Murphy detailed on page 102 of last year'sBaseball Research Journal, Jim's younger brother, Joe,
-------.--------------~~1-~---.------------------.--

THE BASEBALL RESEARCH JOURNAL
was a pitcher with the Orioles for two years. In 1897,his only full season in the big leagues, he won 24games and lost only eight. He was a holdout in 1898and never pitched for the Orioles again. Ironically, itwas Jim Corbett who urged Joe to hold out. He didnot like the way Hanlon had treated his brother as faras salary was concerned.
Big swing by Pete Gray cost him a hitHits were hard to come by for one..armed Pete Gray
in 1945-his only big league season for the St. LouisBrowns. He wound up with 51 hits in 234 times at batfor a .218 average. Gray made his only visit to GriffithStadium in Washington on May 30, 1945, when theBrowns met the Senators in a Memorial Day doubleheader.
In the second game little Marino Pieretti blankedSt. Louis 5 ..0 on five hits. In the sixth inning, Graywas sent up to bat for Nelson Potter, and the crowd of22,021 greeted him with a thunderous ovation. Grayswung lustily at the first pitch and hit a drive towardsecond base. First baseman Joe Kuhel knocked theball down but apparently had no play. But fate wasagainst Gray. He had swung so hard at the pitch thebat hit him in the knee and pained him so much thathe could not run to first base. Kuhel was able to makethe play and Gray had to be satisfied with morecheers as he limped back to the dugout. That one hitcould have raised his season (and major league ca..reer) average to .222.
heard from the next day and said: "Sure, I'll take it."When certain factions made accusations that theboom for Waddell was not sincere, the North Ameri..can offered to put up $10,000 that if Waddell got thenomination for lieutenant governor he would beelected.
Several days later the Republicans did pick Tenerfor governor, but a veteran politician, John W.Reynolds, was picked for the other spot. Officially, itwas announced that Waddell's acceptance was re ..ceived after the slate had already been picked. WhenWaddell heard of his rejection he went berserk andtook it out on Mrs. Waddell. He said his wife had puthim under a spell and that he was only playing crack..the ..whip with her when the landlady interrupted andcalled the police. A charge of cruelty was enteredagainst Waddell and he was released on bail. At thetime of his arrest, Rube's capital consisted of 25 cents,four pairs of cuff buttons, two letters, and a canopener.
On June 27, Waddell appeared in Police Court andwas fined $150, but when he said he had no moneythe judge allowed him to sign a pledge promising toabstain from the use of liquor for one year and, if hebroke the pledge, he would spend a year in the work..house. Waddell signed the papers while his wifemaintained a chilly and ominous silence. By AugustWaddell had drifted to the minors and never pitchedin the majors again. In November, Tener was electedgovernor of Pennsylvania.
Waddell once touted for Lt. Governor of PA Eddie Cicotte had sore arm in 1919George Edward "Rube" Waddell was a great major In recent years there has been much speculation as
league pitcher, but the southpaw was one of the most to why Eddie Cicotte, White Sox pitching ace,eccentric players in history. Considering Waddell's pitched only several times after September 5, 1919.reputation, imagine the surprise when the Philadelphia One theory, highly publicized, was that White SoxNorth American, in a front page story on June 20, owner Charley Comiskey kept him out of games so1910, stated that a boom had been started to name that he would not qualify for a bonus for winning 30Waddell for the position of lieutenant governor of games. Probably a better answer is that Cicotte had aPennsylvania. What probably inspired the announce.. sore arm and was rested so that he would be at his bestment was that it was almost a certainty that another for the World Series. The Cleveland Plain Dealer ex..former major league pitcher, John Tener, then a con.. panded on that theory in the following story ongressman, would receive the Republican nomination September 17, 1919:for governor. The North American commented: "It is "Philadelphia, September 16-The mystery haspointed out that the two would make most harmoni.. been solved. The Indians have discovered why it isous running mates. Both have won fame as baseball that Eddie Cicotte, the star pitcher of the White Sox,players, and both are popular with the liquor inter.. has not worked since Sept. 5, when he beat the Indi ..ests. How Rube has distinguished himself at times by ans. His arm, which bothered him in that game,acting as a bar tender is a matter of history." causing him to pass six batsmen, an unusually large
Efforts to contact Waddell proved unsuccessful. -At number for him, has troubled him ever since.the time he was under suspension by the St. Louis "He thought yesterday that it was nearly right andBrowns for breaking training rules. But the Rube was planned to pitch against the Athletics, but after
-------------------~~>-~-------------------

THE BASEBALL RESEARCH JOURNAL
Pitchers usually were expected to finish what theystarted. For Walter Johnson, Washington's greathurler, it also meant working a great deal of overtime.
Johnson started 29 games and finished them all,winning 20 and losing nine. No fewer than nine of his29 games went into extra innings, Johnson winningsix and losing three. He won games of 18, 15, 14, 13,11, and 10 innings. He lost games of 18,11, and 10innings. Walter won three of four extrao# inning gamesat home and three of five on the road. His only Wash..ington loss in overtime came when Boston's BabeRuth hit a twoo#run home run in the 10th inning tobeat him 30#1.
Johnson's extra inning games as starting pitcher in1918:
May IS-At Washington. Defeated White Sox 10#0in 18 innings.
June 2-At Cleveland. Lost to Indians 10#0 in 11innings.
June 21-At New York. Defeated Yankees 30#2 in 13innings.
June 30-At Washington. Lost to Red Sox 30#1 in10 innings.
July 16-At Washington. Defeated Indians 40#3 in11 innings.
July 25-At St. Louis. Defeated Browns 10#0 in 15innings.
July 31-At Chicago. Defeated White Sox 30#2 in10 innings.
August 4-At Detroit. Lost to Tigers 70#6 in 18 in..nings.
August 19-At Washington. Defeated Browns 30#2in 14 innings.
warming up he declared it did not feel good enough towarrant his going in.
"He told friends it was not lame, but very tired.Gleason is confident his big winner will be restedenough when the World Series starts."
On September 19, Cicotte defeated the Red Sox 30#2 on seven hits at Boston. After the game, he wasallowed to go to his home in Detroit for five days. Hecame back to Chicago on September 24 and startedthe game in which the White Sox clinched the peno#nant by defeating the St. Louis Browns 80#5. Cicottegave up ten hits and five runs in seven innings, andthe Browns led 50#4 when he departed. Chicago ralliedto win the game and little Dickie Kerr was the wino#ning pitcher.
On Sunday, September 28, the final day of the seao#son, Cicotte started against Detroit and gave up threehits and one run in two innings, and was ahead 20# 1when he left the game. The Tigers won the game 100#9, with Roy Wilkinson taking the loss. It is likely thatif there had been a big bonus riding on Cicotte's wino#ning one more game to give him 30 victories, hewould have continued pitching in the games of Sepo#tember 24 and 28, since he was only one run behindin the first and had a 20# 1 lead in the second.
Orioles' Lefty Grove sparkled against big leaguersDuring his four and a half years with Jack Dunn's
International League Orioles, Robert Moses (Lefty)Grove won 109 games against only 36 defeats for apercentage of .752. Baltimore won seven straight pen..nants from 1919 through 1925, and Dunn was able tokeep his star players because he successfully foughtthe major league draft and satisfied his players withtop salaries. After the 1924 season, Dunn finally soldGrove to Connie Mack's Athletics for $100,600. Nodoubt, Grove's performance in exhibition gamesagainst major league opposition during his last threeseasons with the Orioles convinced Mack that Leftyhad the stuff to eventually become a big winner in themajors.
Walter Johnson worked overtime in 1918 On September 28, 1922, Grove was impressive inIn 1918 there were no long relievers, short relievo# losing to the New York Giants 40#3 at Oriole Park. He
ets, seto#up men or closers in major league baseball. gave up seven hits and fanned 12. Then on Septem..
~--~--------------_-e:~r-~ ~------------------
Pitcher George Cobb walked five times in gameGeorge W. Cobb pitched just one year in the majors
and posted a mediocre 100#37 record with the lastplace Baltimore Orioles of the National League in1892. One of Cobb's infrequent victories came onAugust 10, 1892, when he defeated Washington 70#2on seven hits in a game in Baltimore. But Cobb aco#complished something that afternoon that shouldhave won him a spot in the record book for most baseson balls in a game by a pitcher. Cobb came to bat fivetimes and walked all five times. He was passed onceby Alex Jones and four times by Frank Killen.
Not much is known about Cobb. His record in thebaseball encyclopedias doesn't show much personalinformation other than to state that he was born inSan Francisco. Cobb pitched for San Francisco andOakland before he joined the Orioles, and latersettled in California. It's more likely, however, that hewas born in Iowa, where he graduated from college.He died in Pomona, California on August 2, 1926, atage 63. At the time of his death he was secretary ofthe Los Angeles County Fair Association.

THE BASEBALL RESEARCH JOURNAL
ber 27, 1923, the Giants again visited Oriole Park andLefty defeated them 4~3 in 10 innings, allowing ninehits while fanning nine. Four days later, the Yankeesvisited Baltimore and were blanked by the Orioles4~0. Grove pitched the first three innings and heldthe Yanks hitless, striking out six while walking onlyone. Two days later at the Polo Grounds, New York,the Giants caught up with Grove as they defeated theOrioles 9~3 in a benefit game for John B. Day and JimMutrie, owner and manager of the first team in NewYork bearing the name Giants. Lefty gave up fiveruns, four hits and three bases on balls in the threeinnings he worked, including home runs to EmilMeusel and George Kelly. The Oriole defense wasshaky as Dick Porter, playing short in place of JoeBoley, committed three errors. The Giants were aug~
mented for this game by Babe Ruth, Aaron Ward, andElmer Smith of the Yankees. After Grove left thegame, Ruth homered off Jack Ogden. In the Giantlineup were eight players who made the Hall of Fameas players or managers-Ruth, Dave Bancroft, TravisJackson, Frank Frisch, Hack Wilson, Casey Stengel,Kelly and Bill Terry. Grove faced Ruth eleven timesin exhibitions and fanned the home run king ninetimes.
In 1924, Grove had two great games against·the bigleaguers in Baltimore. On August 19, he defeated theChicago White Sox 9~3 on eight hits and 14strikeouts. And on September 3, he shut out theAth~letics 5~0 on two hits, fanning 13 and not walking abatter. After the game, Mack stated that Grove wasone of the best southpaws he had ever seen.
For his entire minor league career and also his firstmajor league season Lefty was "Groves" in all boxscores and league records. It was not until the springtraining session of 1926 that James C. Isaminger,baseball writer for the Philadelphia Inquirer, discoveredthat the "s" in Lefty's name was superfluous and in hisstory of February 22, 1926, he included the following:
"Fans, proof readers and copy readers, lend me yourears! A great injustice has been inflicted on a nation~
ally known southpaw by misspelling his name. Thecorrect moniker is Robert Moses Grove and "s" is su~
perfluous and incorrect. Grove not Groves. Let thissink in. Grove is meeting with the same experience ofMathewson, Dolan, Harriss and several others whowere in the game·a long time before their names wereprinted the way it is spelled in the family bible."
Louisville's Long of 1888 was not DannyDanny Long, a fleet~footed outfielder in his playing
days, mostly on the Pacific Coast, played briefly inthe majors with the Baltimore American Associationclub in 1890. Long's record in the baseball encyclope~dias also includes one game for Louisville, AmericanAssociation, on August 29, 1888. On that day, how"ever, Long was playing for Oakland in the CaliforniaLeague.
Then who was the player named Long in the Lou"isville lineup in the first game of a double headeragainst the Athletics at Philadelphia that afternoon?The Philadelphia Press noted that "Long, late of theAthletic Reserves, guarded left field for Louisville."On March 15, 1889, the Philadelphia Inquirer, com"menting on the strong team that the Chester BaseBall Association had put together, included amongthe players signed "Tom and Harry Long, late of theAthletic Reserves, who played with the team last sea"son." Since Harry was an outfielder he could havebeen the Long who played with Louisville on August29, 1888.
Getting back to Danny Long, he became an out~
standing scout after his days as player and minorleague manager were over. He scouted for the Chi~
cago White Sox for many years. He discovered FrankChance on the sandlots of Fresno. Among the othershe recommended to the majors were Hal Chase, PingBodie, Buck Weaver, Duffy Lewis, Oscar Vitt, SwedeRisberg, Gavvy Cravath and Willie Kamm. Long wascrushed to death by a commuter train at Sausalito,California on the evening of April 30, 1929. He was61 years old when he died.
---,--------------------~~~.-------------------

For more than 20 years, the Society for American Baseball Research has published unique,insightful, entertaining literature. In addition to SABR's annual publications, BaseballResearch Journal and The National Pastime, special issues have focused on specific aspectsofbaseballhistory. For further reading enjoyment, consider obtaining other SABRpublications.
* - out of print
Minor League BaseballStarsVolume 1,1978 (132 pp).........$5.00Year-by-year record of170 minorleague greatsVolume 11,1984 (158 pp)........$5.0020 managers and 180 playersVolume III, 1992 (184 pp)......$9.95250 players
Minor League History Journala publication o/SABR's Minor League Committee
Volume 1 (40 pp) $6.00Volume 2 (54 pp) $6.00Volume 3 (72 pp) $7.00
Texas is Baseball Country1994 Convention Publication(48 pp) $5.00
Award Voting1988 (72 pp) $7.00History &listing ofMVP, Rookieof the Year & Cy Young Awards
Run, Rabbit, RunTales o/Walter "Rabbit" Maranville
1991 (96 pp) $9.95
Baseball: How to Become a Playerby John Montgomery Ward (reprint of 1889)
1993 (149pp) $9.95
Saint Louis's Favorite Sport1992 Convention Publication(64 pp) $7.50
A History ofSan Diego Baseball1993 Convention Publication(40 pp) $7.50
*
*
*
The National Pastime#1 Fall, 1982 (88 pp) $5.00#2 Fall, 1983 (88 pp)#3 Spring 1984 (88 pp)19th Century Pictorial. $7.00#4 Spring 1985 (88 pp) $6.00#5 Winter, 1985 (88 pp) $6.00#6 Spring, 1986 (88 pp)Dead Ball Era Pictorial. $8.00#7 Winter, 1987 (88 pp) $6.00#8 Spring, 1988 (80 pp)Nap Lajoie Biography $8.00#9 1989 (88 pp)#10 Fall, 1990 (88 pp) ~ $8.00#11 Fall, 1991 (88 pp) $7.95#12 Summer, 1992 (96 pp)The International Pastime $7.95#13 Summer, 1993 (96 pp) $7.95#14 Summer, 1994 (112 pp) $9.95
The Federal League of1914-151989 (64 pp) $12.00Baseball's Third Major League Cooperstown Corner
Columns Froln The Sporting News by Lee Allen1990 (181 pp) $10.00
Nineteent!, Century Stars1988 (144 pp) $10.00Bios of America's First Heroes(Non-Hall of Fame players)
Baseball in the Nineteenth Century1986 (26 pp) An Overview......$2.00
SABR Review ofBooksArticles 0/Baseball Literary Criticism
Volume 1, 1986 $6.00Volume 2, 1987 $6.00Volume 3, 1988 $6.00Volume 4, 1989 $7.00Volume 5, 1990
1994 (382 pp, hardcover)........$49.95 BaseballRecords Update 19931993 $4.95
BaseballResearch Journals1975 (112 pp) $3.001976 (128 pp) $4.001977 (144 pp) $4.001978 (160 pp) $4.001979 (160 pp) $5.001980 (180 pp) $5.001981 (180 pp) $5.00
* 1982 (184 pp)* 1983 (188 pp)
largerformat1984(88 pp) $6.001985 (88 pp) $6.001986 (88 pp) $6.001987 (88 pp) $6.001988 (88 pp) $7.001989 (88 pp) $8.001990 (88 pp) $8.001991 (88 pp) $8.001992 (96 pp) $7.951993 (112 pp) $9.95
BaseballHistoricalReview1981; Best of '72-'74Baseball Research Journals $6.00
The Negro Leagues Book1994 (382pp, softcover) $29.95Themostextensiveresearchpublishedon the Negro Leagues, illustrated withmany never before published photos.
Index to SABR Publications1987 (58 pp) $3.00The National Pastime, BRJ &SABR Review of Books I
Shipping & HandlingPlease add $1.50 for 1 book, $2.50 for 2 or 3books, and $5.00 for 4 -5 books. For morethan 5 books, add $.50 for each book over 5.Ohio residents, please add 7% sales tax.Foreign delivery, add an additional $1 ineach category. Allow 3-5 weeks for delivery.Visa and Master and Discover Card accepted.
Make checks payable to:SABRPO Box 93183Cleveland OR 44101
Occ: _
Allow 3-4 weeks for delivery ~
-------------------~~)--------------------
Birthdate: _
Name:, _
Address:, _
City,State,Zip: _
Home Phone: WorkPhone: _
D Yes, I want to join SABR ($35 US, $45 Canada/Mexico, $50 Overseas). Please send me mymembership materials and/or book order ASAP.
D No, I do not want to join SABR at this time, but send me my book order ASAP.
Ship to:


![Optimizing SABR delivery for synchronous multiple lung ... · have been treated radically using stereotactic ablative radio-therapy (SABR) [1–3]. SABR to multiple lung targets has](https://img.pdfslide.us/doc/110x75/602978eef386213e667256eb/optimizing-sabr-delivery-for-synchronous-multiple-lung-have-been-treated-radically.jpg)