Embed Size (px)
Citation preview

The Aspiration-Poverty Trap: Why do Students from Low
Social Background Limit their Ambition? Evidence from
France ∗
Nina Guyon†and Elise Huillery‡
February 18, 2014
Abstract
The paper studies the reasons why students who have the same academic abilities have
di�erent educational aspirations depending on whether their parents are low educated and
whether they live in a disadvantaged neighbourhood. We propose a model of how educational
aspirations develop in order to clarify how social background in�uences aspirations. We then
provide an empirical test for the social and psychological factors exposed in the model. We �nd
three reasons for the social gap in aspirations: low background students have limited option
set in mind, they fear peer sanction, and they underestimate their academic pro�ciency. We
do not �nd evidence that students like to conform to their peers.
JEL Codes: I24, D81
1 Introduction
Despite equal test scores at school, students from low social background exhibit lower aspirations
than students from high social background. The inequality in schooling aspirations has been �rst
quanti�ed by sociologists in what is known as the �Wisconsin Model� using US data: at similar
score of academic aptitude and grades in 11th grade, students whose father has a high education
level, occupation level and income are more likely to declare that they want to attend a four-year
college than those whose father's education, occupation level and income is low (Jenck, Crouse
and Mueser, 1983). The e�ect of father's education and occupation is not driven by di�erences in
∗We wish to acknowledge the support of the LIEPP (Interdisciplinary Research Center for the Evaluation ofPublic Policies), the Sciences Po Scienti�c Advisory Board, and the Direction de l'évaluation, de la prospectiveet de la performance in the French Ministry of Education. We are grateful to Séverine Chauvel, Denis Cogneau,Marie Duru-Bellat, Marc Gurgand and Eric Maurin for helpful comments and discussions. We are deeply indebtedto Sébastien Bauvet for excellent project management, as well as Cécile Ballini, Mbayi Mukendi, Rokhya Konate,Nicolas Hovart and Rabeh Mbaigoto for excellent data collection. We also thank Alexandre Naud for his assistancewith data entry and Cécile Ballini for her help with data management. Finally, we gratefully acknowledge the schoolsta� and students for the time and information they gave. All errors remain our own.†National University of Singapore, Department of Economics ([email protected])‡Sciences Po, Department of Economics ([email protected])
1

education a�ordability since it holds at similar level of father's income. Using data on French 7th
graders in the early 1980s, Duru-Bellat (1988) showed that children of senior executives were more
likely to continue junior high school after grade 7 than children of blue collar workers despite similar
grades1. More recently, Hoxby and Avery (2012) show that the vast majority of very high-achieving
students who are low-income do not apply to any selective college or university despite the fact
that selective institutions would often cost them less. Using original data on French nineth graders,
we also �nd that French students' family background in�uences their aspirations after controlling
for their academic aptitude: students whose parents are low educated are 11 percentage points less
likely to declare that they want to attend academic high schools2, and 16 percentage points less
likely to declare that they want to attend at least 3-year college, than students of the same academic
aptitude (measured by an independent acamedic test3) whose parents are educated4 at least one
parent has a high school degree (Appendix Tables 1 and 2. For more details see Guyon and Huillery,
2014). In this companion paper, we also �nd that students in Priority Education zones (French
Zones d'Education Prioritaire) are less likely to have a preference for academic high schools and 3
or more-year higher education, irrespectively of their parents' education. Despite similar academic
ability, both parents' education and social environnement thus in�uence student aspirations.
The economic issue with the inequality in aspirations is that aspirations determine where stu-
dents apply to, and therefore their actual human capital accumulation. Hoxby and Avery (2012)
provides direct evidence that students from low social background do not apply to selective col-
lege. Jenck et al. (1983) also show that education plans in eleventh grade are a strong predictor
of the number of years of education completed at the adult age, after controlling for academic
aptitudes and grades as well as parents' characteristics5. Aspirations are therefore important since
they in�uence future real schooling choices. Moreover, aspirations and academic performances
might be endogeneously co-determined: low aspirations are likely to result in lower e�ort at school,
1An important critic that was made to this result is that grades are contaminated by school-to-school di�erencesin grading standards. High grades in low-performing schools do not re�ect the same academic ability than thesame grades in a high-performing school. The di�erence in grading standard is taken into account by teachers andeducational professionals when assessing the academic level of students (Broccolichi, 2014).
2Lycée Général et Technologique. It is the top level high school in France, among other options including vocationalhigh school and apprenticeship (also vocational but without high school diploma).
3In order to measure academic aptitute without any contamination by di�erences in grading standards, we ad-ministered the same math test to all students in our sample and graded it ourselves.
4Hereafter, �low educated parents� means that both parents have no high school degree, or one parent does nothave any high school degree and the other has a vocational high school degree. �educated parents� refers to all othercases, meaning that both parents have a vocational high school degree, or at least one parent has at least an academichigh school degree.
5Parent characteristics include income, education of the father and the mother, father's occupation and parents'preference for college education.
2

translating into lower academic performances. In turn, low academic performances translate into
low aspirations since students are aware that selection into higher education is based on academic
performances. In fact, Jenck et al (1983) provides evidence that grades and academic ability are
both strong predictors of educational aspirations. Given the (potential) in�uence of aspirations
on academic performances (empirical evidence is still needed here), and the in�uence of academic
performances on aspirations, aspirations are able to generate a poverty trap. In this perspective,
the fact that social background undermines aspirations creates an important reinforcer of inequali-
ties at school: in the hypothetical situation where disadvantaged students would start with similar
academic aptitudes as advantaged students, they would still end up at di�erent human capital
accumulation levels because of lower aspirations.
This paper contributes to the literature by exploring the reasons for the social gap in aspirations.
Building on the economic and sociological literatures, it �rst provides a theoretical framework
that formalizes how schooling aspirations develop in order to clarify what factors play a role in
students' ambition level. We consider three categories of factors: economic factors, social factors,
and psychological factors, and in each category we hypothesize a causal e�ect of each factor on
aspirations. Second, we use a lab-in-the-�eld experiment to provide empirical evidence on the role
of the social and psychological factors: taste for conformity to peers, fear for peer sanction, limited
set of education options in mind, and lack of self-esteem as a consequence of social stereotypes.
Despite qualitative evidence provided in the sociological literature, this paper is the �rst attempt
to provide a comprehensive theory of how aspirations develop and to assess whether the social and
psychological factors are indeed at work for a large proportion of individuals and are su�ciently
important to contribute to the social gap in aspiration.
In October-November 2012, we conducted a survey on 6,000 nineth graders in three French
academic divisions (Versailles, Paris and Créteil). In France, grade 9 is the last grade in junior high
school so at the end of the year students have to decide whether to apply to high school or not, and,
if so, to which type of high school. Half of the sampled schools are labelled �Priority Education�
(French Zones d'Education Prioritaire, a program that channels additional resources to schools in
disadvantaged areas), while the other half schools are classic schools enrolling students from more
advantaged social background. The survey was conducted in two steps. First, the students took a
30-minute math test in order to assess their academic ability. One week after, the students took a
questionnaire which asked about which education options they know, which they judge accessible,
3

and �nally which they prefer. We can thus distinguish the set of options that students have in mind
(which options they know) from aspirations (which options they prefer). The three questions were
asked �rst for high school education, then for higher education. The questionnaire also entailed
questions to measure student self-esteem and parental characteristics, in particular father's and
mother's education. Importantly, we introduced variations in the questionnaire in order to test the
role of social factors -fear of peer sanction and taste for conformity to peers- as well as psychological
factors -limited set of options in mind and stereotype threat to self-esteem. Students of the same
class were randomly assigned to the di�erent versions of the questionnaire.
We �nd evidence that both social and psychological factors in�uence student aspirations. First,
students in Priority Education and students whose parents are low educated have a more limited
set of options in mind than the others. For students in Priority Education with educated parents,
providing the set of existing options is enough to close the gap and make aspirations similar to those
of students out of Priority Education. However, students with low-educated parents still exhibit
lower aspirations than their educated-parent counterparts even when the existing set of options is
available, revealing a more profound e�ect of parents' education on children's aspirations.
Second, students exhibit a strong fear of peer sanction. Actually, making their aspirations visible
by classmates changes substantially students' apirations. It reduces dramatically the proportion of
students who prefer academic high school, as well as the proportion of students who prefer 5 or
more-year higher education. Instead of revealing these ambitious preferences to classmates, students
abstain or exhibit less ambitious preferences. This �nding gives clear evidence that peer pressure
is an important factor when students form their aspirations.
Third, our results provide some support for the idea that students like to conform to their
peers, although our test could reveal only a moderate taste for conformity. Students who are given
a school-speci�c reference point are more likely to declare the reference point as their preferred
option than students who do not have this information. Conformity to the reference point remains
small and statistically insigni�cant for high school options, whereas it proved larger and signi�cant
for higher education. This �nding suggests that conformity to peers might play a role when students
are more uncertain about their preferences, although it does not seem to be extremely present for
less uncertain choice. Finally, we do not �nd support for the idea that social stereotypes have an
depressing e�ect on self-esteem and aspirations.
There are three key policy implications of our �ndings. First, while the cost of education and
4

the lower returns to education might also play a role in the social gap in aspirations, social and
psychological factors should receive attention and be taken into account in the design of possible
interventions addressing this issue. Second, making the set of existing options salient (as it is the
case when nineth graders have to �ll out an administrative wish-list form later in the year) closes
the gap when parents are educated, but not when parents are low-educated. Third, one promising
avenue for public policies is to decrease peer pressure and make students more confortable with
individual preferences that might di�er from peers' preferences, especially when it comes with
ambitious preferences.
The remainder of the paper is organized as follows. Section 2 presents a simple theory of the
way aspirations develop. Section 3 presents the context in which the experiment was set up, the
research questions it seeks to address, and the experimental design. Section 4 presents the data.
Section 5 presents the results, and Section 6 concludes.
2 The Theoretical Framework
To the best of our knowledge, Sewell, Haller and Portes (1969) provides the �rst theoretical frame-
work of how educational aspirations develop. It assumes that educational aspirations are determined
by signi�cant others' in�uence (friends). They also assume that signi�cant others are determined
by academic performances and socioeconomic status, while academic performances are determined
by mental ability and socioeconomic status. So academic performances, mental ability and so-
cioeconomic status play an indirect role on educational aspirations through friends' characteristics
and in�uence. Sewell, Haller and Olhendorf (1970) then enriched the model by allowing academic
performances for having a direct in�uence on educational aspirations, in addition to its indirect
in�uence through friends' characteristics.
This approach needs to be revisited since it does not take into account the direct e�ect of the
cost of education and perceived returns to education on aspirations. Moreover, friends' in�uence is
taken into account but the mechanisms behind their in�uence are not clear. In this paper, we thus
propose a more comprehensive view of how aspirations develop starting from a standard utility
maximizing approach. We then enrich the framework by considering non-standard factors that
could also play a role in the formation of aspirations.
5

Standard Utility Maximizing Approach
We consider a self-interested student. She faces a set of education options S and chooses the option
s∗ which maximizes her utility. We posit that options are more or less academically ambitious and
can be ranked on a scale of ambition. If option s is less ambitious than option s′, we will write for
simplicity s < s′. Here, ambition is used in the narrow sense of academic ambition, and by no way
refers to the more general motivation that students put in succeeding in their life. Student's utility
associated to each option s ∈ S is the di�erence between the bene�t she would extract from option
s and the cost of option s. Cost and bene�t include �rst an economic component. The economic
bene�t of option s is given by the return to education rs of option s, conditional on the fact that
she succeeds in this option which happens with the probability θs. The economic cost of option s
is the aggregated cost cs of tuition fees, transportation costs and any other costs that would occur
if option s is chosen, like rent (if the student has to move away from home) or credit repayment (if
the student has to borrow).
Cost and bene�t of option s also include a social component. The social bene�t of s depends
on the distance between option s and the options chosen by friends. As modelized by Akerlof
and Kranton (2000) and (2002), and discussed by Perier (2004) and Millet and Thin (2005) and
(2007), students like to conform to their friends (or their social category) because it gives them
the opportunity to enjoy being in the same school as their friends and avoid the e�ort required to
make new friends. We thus assume that they have a direct utility of choosing the same option as
their peers. Let us denote s̄ the most popular option among friends and ν the utility gain that
the student gets from having the same aspirations as her friends (the intensity of her taste for
conformity to peers). The social bene�t of s is ν if s = s̄ and 0 if s 6= s̄. In addition to the social
bene�t of choosing the same option as friends, we allow the student for supporting a social cost
for being ambitious due to potential peer sanction (mocking, booing or bullying) (Herpin, 1996;
Austen-Smith and Fryer 2005). This e�ect would take the form of an additional cost π that would
be incurred only for ambitious options , let say s such that s > s.
For any s 6= s̄, the utility associated to option s is:
θsrs − cs − π if s > s
θsrs − cs if s ≤ s
For s = s̄, the utility associated to option s is:
θsrs + ν − cs − π if s̄ > s
6

θsrs + ν − cs if s̄ ≤ s
We consider that students are heterogenous in their academic performances a. Academic per-
formances in�uence the probability that the student succeeds in option s, higher performances
resulting in a higher θs (so θs = θs(a) with θ′s(a) > 0). Since more ambitious options yield higher
returns to education (s < s′ ⇒ rs < rs′), high-performing students should be more likely to prefer
ambitious options than low-performing students holding all other factors constant.
Broadening the Pscyhological Base of Aspirations
In this framework, we allow students for being simultaneously self-interested and in�uenced by psy-
chological factors. First, we assume that students have di�erent set of options in mind depending
on the information they received from teachers, friends and relatives (Oyserman et al. 2006, Masson
1997, Van Zanten 2009). More precisely, we hypothetize that the set of options in their mind is
loosely in�uenced by o�cial information provided by school sta� on existing options, and strongly
in�uenced by more tangible information provided by friends and relatives (or more generally role
models). Role models transform abstract information into salient and tangible one. As a conse-
quence, students might not think of option s if nobody among their friends and relatives personi�es
this option and is able to share experience about it. We assume that abstract knowledge about an
option is not su�cient to make this option present in student's mind.
Second, we hypothetize that aspirations depends on the level of self-esteem and that self-esteem
is not only determined by objective performances (grades), but also by social stereotypes. Many
lab or lab-in-the-�eld experiments show that activating social stereotypes associated with gender
or ethnic group has a depressing e�ect on immediate individual performances (Steele and Aronson
1995, 1999, Croizet and al. 2001, 2004, Ho� and Pandey 2004, Dee, 2009). The reason for this
e�ect is the fact that stereotypes make students less con�dent in their ability to perform than
equally performing students who are not subject to negative stereotype. In our model, we thus
incorporate the idea that students from low social background may be less con�dent in their ability
to perform at school than their socially advantaged counterparts, even at similar performances.
This can be re�ected in the probability to succeed θs = θs(δa) with δ ∈ [0, 1] representing the
academic stereotype associated with student's social category.
7

Explaining the Social Aspiration Gap
In this framework, we can understand why students with low social background (low-educated
parents or disadvantaged social environnment as re�ected by the fact that they attend a school in
Priority Education) have lower aspirations than students with educated parents and students out
of Priority Education.
First, low social background students might anticipate lower returns to education rs of ambitious
options s due to discrimination by employers (Aeberhardt et al. 2011, Adida et al. 2010), or less
complementarity between their social capital and jobs that demand skills of option s (Gobillon et
al. 2011): their social network o�ers less connections to workers in the sectors that demand skills
of option s so it is more di�cult for them to take advantage of these skills. Moreover, low social
background is likely to decrease θs of ambitious options s because the probability to succeed also
depends on potential discrimination by teachers, as well as complementarity between social capital
and option s's curriculum: relatives are less able to help students in their homework if they do not
have the skills to help and cannot a�ord extra-class courses. Broccolichi (2014) looks at students
with similar test scores in grade 6 and shows that those whose parents are blue collar workers have
a lower probability to pass High School �nal exam (Baccalauréat) than students whose parents are
senior executives, suggesting a smaller θs even at the same initial level of academic performances a.
Second, low social background students might face higher cs for ambitious options if those
options are located far from home (concentration of academic high-schools and universities in ad-
vantaged neighborhoods), and if parents cannot a�ord the cost of option s (the student has to
borrow and support additional �nancial costs) (see Palheta 2011).
Third, high-performing students who have low-performing peers face a lower reference point s̄
so they have a lower utility to prefer ambitious options than high-performing students who have
high-performing peers because they would more often deviate from s̄ and loose ν.
Fourth, peers might sanction ambitious students more heavily if peers have low performances
and low ambitions. In this case, the cost π that would be incurred for ambitious options would
be larger in Priority Education compared to advantaged neighbourhoods. Moreover, peer sanction
π would be attenuated if teachers and parents encourage and support the student in ambitious
aspirations. The importance of peer sanction would thus be larger when students bene�t less from
parents' and teachers' support.
Fifth, all options might not be in the mind of all students because students consider di�erent
8

subsets of educational options S̃ ⊂ S depending on the speci�c role models available in their social
network. Low social background students would tend to consider less ambitious subsets of options
than advantaged students.
Finally, the stereotype associated with low social categories is that students are academically
less e�cient so they would internalize a low δ, whereas high social categories are stereotyped aca-
demically e�cient and internalize a high δ. It means that despite similar academic performances,
students in low social categories anticipate a lower θs than students in high social categories.
3 The Experiment
Research Questions
As proposed in our model, we think of aspirations as the result of economic, social and psycho-
logical factors. This paper proposes a lab-in-the-�eld experiment to test the role of the social and
psychological factors. We do not investigate the role of economic factors for two reasons : �rst,
our sample size was limited by budget constraints so we chose to test a few factors in order to
keep enough statistical power for each factor. Second, it seemed more di�cult to reveal the role of
economic costs and bene�ts of education through a lab-in-the-�eld experiment because introducing
variations in perceived �nancial cost and bene�t of education in the lab environnment seems too
unrealistic.
However, we �nd suggestive evidence that the cost of education is not the main driver of the
social gap in aspiration. First, it is worthy to note that our sampling strategy was designed to
make geographical distance to any education options equal from schools in and out of Priority
Education so that geographical access to educational plans does not di�er across high and low social
backgrounds. In our sample, 11% of students think that they should move out of their parenst's
home to pursue some of the options they know at the High School level (29% at the higher education
level) and these proportions are similar for students in and out of Priority Education, as well as
for students with low-educated and educated parents. Access being similar for all students, we
then investigated students' perception of the cost of the options they know (including tuition fees,
transportation cost, relocation cost). In France the vast majority of high schools and universities
are public and free6. In our sample, students in Priority Education and students with low-educated
6Universities charge very small tuition fees -about 200 euros per year. Only selective colleges, the �GrandesEcoles�, charge substantial tuition fees (from 2,000 for ingeneer schools to 12,000 euros for business schools).
9
parents estimate a rather lower cost of education for the options they know than the others: 33%
estimate that the options they know would cost more than 1,000 euros per year, while 40% among
students out of Priority Education and among students whose parents are educated. Importantly,
a lower proportion of students in Priority Education than out of Priority Education anticipate that
some options they know would require to borrow money (22% versus 25%, p-value<0.01), and this is
exactly the same for students whose parents are low-educated compared to students whose parents
are educated (22% versus 25%, p-value<0.01).
As for returns to education, we asked students to estimate the probability to succeed in one's
educational plans for a high-achieving student under two conditions: the students lives in an advan-
taged neighbourhood, and the student lives in a disadvantaged neighbourhood. In our sample, the
probability to succeed was estimated 85% for the student living in the advantaged neighborhood,
whereas 52% for the equally performing student living in the disadvantaged neighborhood. This
result reveals that students attribute a very important role of social background on θs. One reason
for the social gap in aspirations is thus likely to be that students from disadvantaged neighbour-
hood or from low-educated families are discouraged because they internalize a huge di�erence in
the probability to succeed. However, this result is based on self-reported information. Since we
are not con�dent that students are fully aware of the factors that drive their aspirations, we take
this evidence as only suggestive and do not draw any conclusion on the role of economic factors in
determining educational aspirations. In contrast, we propose some tests providing evidence on the
role of the social and psychological factors.
Treatment arms
Control group In the control group, students took a 50-minute individual questionnaire in class,
in the presence of a enumerator and, except in few cases, a teacher. The questionnaire consists in
three main sections took in the following order:
• The Harter Self-Perception Pro�le for Adolescents scale, which provides a measure for four
dimensions of self-esteem (school pro�ciency, social acceptance, behavior and overall value).
• A set of questions on educational aspirations: the options they know at the High School level,
the options they think possible, and the options they prefer. Then the same questions were
asked at the higher education level. Finally, they were asked abouy elements that in�uenced
their educational aspirations: sources of information, distance, cost, role models, familial
10

network, peer desirability and peer sanctions.
• A set of questions on their social background: father and mother's citizenship, education and
job, and whether their middle school is in Priority Education or not.
In this version of the questionnaire, no information was provided about existing options and the
questions on the options they know/they think possible/they prefer were left open so as to not
induce any particular response.
Limited Set of Options in Mind (T1) Students in this treatment arm had the same ques-
tionnaire as the control group except that they were given a list of all existing options at the high
school level and at the higher education level instead of asking them which options they know. At
the beginning of the section on aspirations, they had the list of options and could con�rm they read
the list of options (91% con�rmed). Then they were asked which options they think are possible,
and which options they prefer. Compared to the control group, these students are reminded about
the di�erent options right before taking questions on orientation. If the reason why low social
background students have lower aspirations is that they do not think about the complete set of
options and have less ambitious options in mind, then we expect that this treatment would enlarge
the set of options they have in mind and reduce the social gap in aspirations as measured in the
immediately subsequent questions.
Taste for Conformity to Peers (T2) In this treatment arm, students took the same question-
naire as in the control group except that they were informed about the most frequent option chosen
by students who attend their middle school (based on school level information from the headmas-
ter). Three categories of middle schools were made based on the most frequent option: �academic
high school� (group A), �vocational high school� (group B), and �dual education7� (group C). This
reference point was mentioned at the beginning of the section on educational aspirations in order
to make it salient before students were asked about the options they know, they think possible,
and they prefer. However, mentionning an option in the questionnaire is likely to result in a higher
proportion of students choosing this option not because they like to conform to peers, but because
the option is more salient. In order to di�erentiate these two e�ects, the questionaire not only men-
tionned the school-speci�c reference point, but also another option, referred to as the �example�
7�Centre de Formation par l'Apprentissage�, or apprenticeship
11

option, that was not labelled as particularly popular in their middle school8. This way, the salience
e�ect should work for both mentionned options, whereas taste for conformity to peers would work
only for the reference point option. 93% of students con�rmed that they read the paragraph pro-
viding information on the reference point and �example� options. If students like to conform to
their peers, we expect that this treatment would increase the proportion of students who prefer the
reference point option.
Fear of Peer Sanctions (T3) In this treatment arm, students took the same questionnaire as
the control group except that they were informed that a discussion of aspirations will be held in the
class at the end of the survey and that all educational aspirations will be shared with classmates
in order to evaluate educational aspirations in the class. The di�erence with the control group is
thus that students anticipate that peers will be informed about their aspirations. 92% of students
con�rmed that they were aware of the collective discussion. If students take care about peers'
opinion and fear about peer sanction, we expect that this treatment will decrease the proportion
of students who prefer ambitious options.
Stereotype Threat (T4) Students in this treatment took the question set on social background
�rst, then the Harter scale, and �nally the section on educational aspirations. This group thus
di�ers from the control group in that the social stereotype is activated before students take the
Harter scale and questions on aspirations. If stereotypes associated with low social categories make
students feel that they are academically less e�cient, we expect that they would exhibit lower
self-esteem levels and lower aspirations when the stereotype is activated.
4 Data
Sampling Strategy
We sampled 59 middle schools to take part of the study. The sampling strategy was done along
four criteria. First, the headmaster of the middle school had to accept to participate in the study,
which means that the middle schools in our sample are headed by persons who are more concerned
by the topic of the study, and more open to accept the constraints imposed by the study, than
the average middle schools. Second, the middle schools should be clearly advantaged or clearly
8For instance in type A schools, the questionnaire said: �One option is vocational high school. In your middleschool, students typically enroll in academic high schools.�
12

disadvantaged based on parents' socio-economic background data provided by the education district
(Académies): we excluded middle schools whose population was intermediate in terms of social
characteristics (neither advantaged nor disadvantaged) because the evaluation of the importance
of peers' in�uence requires some heterogeneity in average students' social charateristics. Third, we
wanted an equal number of students from advantaged and disadvantaged schools in order to have
the largest statistical power in our subgroup analysis. Finally, to enter the sample, a disadvantaged
middle school should be close to an advantaged middle school (and vice-versa) so that students
from both advantaged and disadvantaged social backgrounds have a similar geographical access to
any education options at the High School and at the higher education levels.
As a result, the sample entails 6 middle schools from Paris (3 in Priority Education and 3 out
of Priority Education), 15 from Créteil (8 in Priority Education and 7 out of Priority Education)
and 38 from Versailles (23 in Priority Education and 15 out of Priority Education9).
Data Collection
The survey was taken in two parts. First, students took a 30-minute math test to approximate their
academic achievement. Grades are contaminated by school-to-school di�erences in grading stan-
dards so we created a test to measure academic performances independently from teacher grading
di�erences. The math test consisted in 7 di�erent exercises covering grade 8's math curriculum.
This test was administered in class by a math teacher. However, students and teachers were in-
formed that the math test would be graded by independent researchers and not by the teacher. They
were also informed that the purpose of the study was not to evaluate their personal performance
and that their score won't be transmitted to anybody (parents, teachers, school sta�).
Second, the week after, students took the 50-minute questionnaire described in the previous
section. The survey took place from mid-October to early December 2012. An important constraint
was to administer the questionnaire to students early in grade 9 because from January on, students
receive information and advices about educational options at the High School level from specialized
school sta� and teachers. Since we were interested in students' aspirations itself, we wanted to
survey students before this information was provided in order to avoid contamination by teachers'
opinion.
From the 6,903 students registered in the 270 classes of our sample, 6,382 students took at least
9In this académie, the number of classes and class size are larger in non-Priority Education schools so a fewernumber of middle schools out of Priority Education could provide the same number of pupils.
13

one part of our questionnaire (3,181 in Priority Education and 3,201 out of Priority Education).
Among these students, 6,005 took the math test, 6,049 took the questionnaire, and 5,672 took both.
The vast majority of the students who did not took one part of the survey were not present the day
when that part was administered (only a few students refused to answer the survey). Attendance
rate was found 87% in the �rst visit and 88% in the second visit.
Variables of interest
Our main outcome of interest is the level of education re�ected in students' preferred option. At
the High School level, we distinguish 5 groups of preferred options:
• No preferred option is mentionned: this category groups the students who responded that
they did not know which option they preferred (�none�, �I don�t know�), or did not write any
answer to this question.
• No education: this category entails students whose preferred options do not require any
education: �footballer�, �singer�, �actress�, �model�, among others.
• Dual education: this category corresponds to the students whose preferred option is tech-
nical education without no high school diploma: apprenticeship and aptitude certi�cate for
worker/employee positions (French CAP and BEP).
• Vocational High School: this category corresponds to the students whose preferred option
is vocational Hish School (French lycée professionnel). In vocational High School, students
typically prepare technical high school diploma (�bac professionnel�) and those who pass it
can either work or access to some higher education options.
• Academic High School: this category corresponds to the students whose preferred option
is academic Hish School (�lycée général et technologique�). Students prepare academic high
school diploma (�bac général et technologique�) with the aim to achieve some higher education.
For each of these levels of education, we present an indicator of whether student's preferred options
include responses in that category. Students were asked about one preferred options, but some
of them gave several preferred options in which case they are counted in all the corresponding
categories10. Since the number of responses per student is important to interpret the variations in
10Students responded from 0 to 3 preferred options. 22% gave no preferred option, 67% exactly one, 10% two, and1% three.
14

the proportion of students in each level category, we also present the number of preferred options
as an outcome.
At the higher education level, we present the following level categories: no preferred option,
no higher education11, one and two-year college education (French IUT, BTS, bac+1 and bac+2
diploma), three and four-year college education (Licence, bac+3 and bac+4 diploma), master de-
gree, and more than 5 years (graduate studies or jobs like �doctor�, �architect�, �researcher�, etc).
Our independent variables of interest are the treatment group, and the treatment group inter-
acted with the Priority Education dummy, a dummy �low-educated parents� indicating that both
parents are low-educated (at most one vocational high school diploma), as well as the interaction
between those two variables. Actually, we allow for heterogenous e�ect of the treatments for stu-
dents in and out of Priority Education, for students whose parents are low-educated, as well as
for students who have low-educated parents in Priority Education and students with low-educated
parents out of Priority Education. Finally, we include indicators of math test score quantiles (stu-
dents are classi�ed in 20 groups according to their score at the math test) in order to capture
heterogeneity in educational aspirations and improve the precision of the estimates.
Finally, we use a measure of self-esteem both as a dependent and as an independent variable in
some speci�cations. The Harter scale consists in a serie of 20 questions divided in 4 categories: 5
questions on school pro�ciency, 5 on social acceptance, 5 on behavior, and 5 on one's overall value.
Questions in each category are used to construct a category-speci�c score, and the 20 questions
altogether are used to construct a global score of self-esteem. Each score ranges between 1 and 4,
4 being the highest level of self-esteem.
5 Results
Do Low Social Background Students Have Limited Option Sets in Mind?
Table 1 presents the options students know at the High School level, while Table 2 presents the
options they know at the higher education level. In these tables, we consider only students in
the control group in order to evaluate the option sets students have in mind in absence of any
manipulation. Both tables show that students in Priority Education are less likely to mention the
11corresponding to students whose preferred option is a job that does not require higher education, like again�athlet�, �singer�, �musician�, �writer�, �photograph�, etc. If the student responded a job that requires higher education,like �doctor� or architect�, she was put in the corresponding level category. For education levels associated to anyjob, we used the website of ONISEP, a French institute specialized in student information and orientation.
15

most ambitious options among the options they know: while 88% of students mention academic
high school and 21% mention master degree out of Priority Education, 83% and 13% mention
these options in Priority Education (the di�erences are statistically signi�cant at respectively the
10 and 5 percent levels). In addition to this e�ect of being in Priority Education, fewer students
whose parents are low educated mention these options. A student in Priority Education whose
parents are low educated is 10 percentage points less likely to mention academic high school and
17 percentage points less likely to mention master degree than a student out of Priority Education
whose parents are educated. Note that the option set that disadvantaged students have in mind
does not only entail less often ambitious options, it also entails less often options that do not require
any education (Table 1-column 4 and Table 2-column 5). So disadvantaged students are more likely
to not mention any option known (Table 1-column 5 and Table 2-column 6), and mention a smaller
number of options (Table 1-column 6 and Table 2-column 7).
How much does the di�erence in option sets contribute to the di�erence in aspirations? Compar-
ing students from di�erent social background with similar option sets in mind provides an answer.
For each level of education, Tables 3 and 4 present the proportion of students who prefer this level
of education at similar math test score and similar presence of this level of education in mind (we
control by quantile of math test score and by an indicator of whether this level of education is in
the option set). At both the High School and higher education levels, we �nd that, despite similar
option sets in mind and similar academic performances, students in Priority Education and students
whose parents are low educated are less likely to prefer ambitious options and more likely to prefer
less ambitious options (vocational High School and options that do not require any education at
the High School level, and options that do not require any higher education at the higher education
level). Comparing the social gap in aspirations with (Tables 3 and 4) and without (Appendix tables
1 and 2) taking into account the di�erence in option set in mind, we can conclude that di�erences
in option set in mind do explain part of the social gap in aspirations, but not all of it.
The question now is whether T1 is able to enlarge the set of options they have in mind in a way
that reduces the social gap in aspirations as measured in the immediately subsequent questions.
As for aspirations at the High School level, providing the list of existing options does not change
anything for students whose parents are educated (neither in nor out of Priority Education). For
students whose parents are low-educated, providing the list of existing options closes the gap in
the number of preferred options, but in favor of less ambitious options (no education and dual
16

education), not in favor of ambitious ones (the gap in the proportion of students who prefer academic
high school remains the same).
As for aspirations at the higher education level, the general e�ect of T1 is a decrease in the
proportion of students who do not mention any preferred option (and consequently the average
number of preferred options) and an increase in the proportion of students who prefer the master
degree level. This e�ect re�ects a general enlargement of students' option sets (probably related
to the fact that students know less about higher education than about High School education)
whatever students' social background. We also �nd that T1 closes some social gaps in aspirations:
students whose parents are educated are no longer more likely to prefer options that do not require
higher education in Priority Education compared to their counterparts out of Priority Education.
Moreover, students out of Priority Education are no longer less likely to prefer 3-4 years of college
when their parents are low educated compared to those whose parents are educated.
To conclude, low social background students have more limited option sets in mind, which
explains some but not all of the social gap in aspirations. Providing the list of options just before
they are asked about the options they prefer reduces the gap in aspirations along some dimensions
at the higher education level but does not close it, especially at the High School level (when the
initial level of information among all students is better). This result suggests that students need
more than just abstract information in order to enlarge their option set.
Do Students like to Conform to Their Peers?
If students like to conform to their peers, we expect that students in T2 respond more often that
they prefer the reference point option than the other options (after substracting the salience e�ect
re�ected in the preference for the �example� option). Tables 7 and 8 present the e�ect of T2 on
students' preferences respectively at the High School and at the higher education levels in B-type
schools (Appendic tables 3-6 present the e�ect in type-A and type-C schools, which is qualitatively
similar). In this type of schools, the reference point option is �vocational High School� while the
example option is �academic High School�. All type-B schools are in Priority Education so we look
at the heterogenous e�ect of the treatment by parent education level only. We do not observe any
change in students' preferences in response to the reference point at the High School level (Table 7).
At the higher education level, we observe that students whose parents are educated are less likely
to prefer master degrees and options that do not require any higher education in T2 (Table 8).
17

However, it seems that they do not prefer the reference point option more often but rather reduced
the number of options they prefer. So the e�ect of T2 is limited to those students with educated
parents who tend to give more than one preferred option and limit their preferences to the reference
point and the example options due to the treatment. Since this e�ect cannot be distinguished from
a pure salience e�ect, we conclude that T2 did not give evidence of any taste for conformity to peers
neither for students whose parents are low-educated, nor for students whose parents are educated.
This absence of e�ect of T2 on preferences is not due to the fact that the treatment was not e�ective
since 93% of the students con�rmed that they have read the information about the reference point
and the example options.
Do Students Fear Peers' Sanction?
In T3, students anticipate that their peers will observe their educational aspirations. Table 9
presents the e�ect of this treatment on aspirations at the High School level. Advantaged students
(out of Priority Education and whose parents are educated) proved 11 percentage points less likely
to declare that they prefer academic High School. Instead, they were 3 percentage points more
likely to declare that they prefer vocational High School and 9 percentage points more likely to not
declare any preferred option. So advantaged students clearly tend to hide ambitious aspirations to
their peers. Students in Priority Education whose parents are educated had the same response to
T3, except that they were less likely to express a preference not only for academic High School but
also for vocational High School. This tendency to hide educational aspirations to peers was even
a little bit more pronounced among students whose parents are low-educated, as re�ected in the 9
percentage point increase in the proportion of students who do not declare any preferred option.
The picture is very similar at the higher education level (Table 10). In T3, students proved
less likely to declare ambitious aspirations (master degrees and more than 5-year education). The
proportion of students who do not give any preferred option does not increase, while the number
of options decreased by 28% (from 0.82 down to 0.59), suggesting that the e�ect comes from those
students who would have given several preferred options in the absence of the treatment. It is
striking that students hide ambitious aspirations much more than the less ambitious ones. This
e�ect is similar on all students, except on those in Priority Education whose parents are low-
educated: those students are not only less likely to declare ambitious aspirations, but they are also
17 percentage points more likely to declare that they prefer options that do not require any higher
18

education12.
Overall, these �ndings suggest that students care a lot about peers' opinion and fear about peer
sanction. Fear for peer sanction decreases the proportion of students who prefer ambitious options
and increases, for the most disadvantaged students, the proportion of them who prefer the least
ambitious options.
Do Low Social Background Students lack Self-Esteem?
To explore whether stereotypes associated with low social categories make students feel less con�dent
at school, Table 11 presents the correlation between students' level of self-esteem and their social
background, controlling for their academic performances. Students whose parents are educated have
similar levels of self-esteem (along all dimensions) in and out of Priority Education. However, we
�nd that students whose parents are low-educated have a lower esteem of their school pro�ciency,
despite similar academic abilities. The lack of self-esteem in school pro�ciency is less pronounced
in Priority Education than out of Priority Education, which suggests that the lack of self-esteem in
school pro�ciency due to one's parent education depends on peers' parent education (although the
di�erence is not statistically signi�cant)13. Since self-esteem along the school pro�ciency dimension
captures how students perceive their academic performances, it seems plausible that the lower self-
esteem in that dimension among students whose parents are low-educated contributes to their lower
aspirations.
In order to evaluate how much the social gap in students' perception of their school pro�ciency
contribute to the social gap in aspirations, we compare aspirations of students from di�erent social
background with similar levels of school pro�ciency perception and similar academic performances
(Tables 12 and 13). Self-esteem in school pro�ciency is a good predictor of students' aspirations at
both the High School and higher education levels, and taking it into account reduces a little bit the
social gap in aspirations, although most of the gap remains (we observe only small changes in the
coe�cients on the low educated parent indicator).
In order to provide evidence on the role of the social stereotype on aspirations, the stereotype
is activated in T4. Table 14 presents the e�ect of activating the social stereotype on the levels of
12On average those students declare the same number of preferred options as in the control group. Since thetreatment induced a 20 percentage point increase in the proportion of students who declared at least one preferredoption, it means that it also induced a smaller number of responses from those students who would have providedseveral preferred options.
13Note that the global score of self-esteem for students whose parents are low educated in Priority Education islarger than for the other students, which is due to higher esteem along the social acceptance dimension. This suggeststhat social background does not decrease self-esteem in general.
19
self-esteem. We do not see any signi�cant impact of stereotype activation on self-esteem in school
pro�ciency (the e�ect is negative for students whose parents are low-educated but it is very small
and not signi�cant).
6 Conclusion
This paper explores the reasons why students who have the same academic abilities have di�erent
educational aspirations depending on whether their parents are low educated and whether they
attend a school in Priority Education. We propose a model of how educational aspirations develop
in order to clarify how social background (both family and friends) can in�uence aspirations. We
then provide an empirical test for the social and psychological factors exposed in the model.
We �nd evidence of three reasons for the social gap in aspirations. First, students whose parents
are low educated and those who attend a school in Priority Education have di�erent set of options
in mind. Providing abstract information about the full set of options does not reduce the gap, which
suggests that students need concrete exposure to the di�erent options in order to enlarge their option
set. Second, we �nd that students care a lot about peers' opinion and that peer pressure makes
them less ambitious. In contexts where parents and teachers have a weak preference for ambitious
options, peer pressure might lower actual aspirations. Third, we �nd that students whose parents
are low educated have a lower self-esteem in their school pro�ciency, although the di�erence is small
and accounts for only a small part of the social gap in aspirations. Equally important, we do not
�nd evidence that students like to conform to peers in the absence of peer sanction.
In terms of policy implications, this paper provides support to three types of interventions to
reduce the social gap in aspirations. A �rst type of interventions would be to expose students who
have low social background to a variety of experiences and life stories to serve as role models and
enlarge their option set. A second type of interventions would consist in improving students' ability
to cope with peer sanction and be comfortable with ambition. A third type of interventions could
focus on self-esteem so that students from low social background do not underestimate their school
pro�ciency and objectivize their actual academic potential.
20

References
[1] Akerlof and Kranton. 2000. �Economics and Identity�, the Quarterly Journal of Eco-
nomics, 65(3): 715-753.
[2] Akerlof, George and Rachel Kranton. 2002. �Identity and Schooling: Some Lessons for
the Economics of Education�, Journal of Economic Literature, 40(4): 1167-1201.
[3] Austen-Smith and Fryer. 2005. �An Economic Analysis of �Acting White��, the Quar-
terly Journal of Economics, 120(2): 551-583.
[4] Bénabou, Roland and Jean Tirole. 2011. �Identity, Morals and Taboos: Beliefs as
Assets�, The Quarterly Journal of Economics, 126 (2): 805-855.
[5] Broccolichi Sylvain and Rémi Sinthon. 2011. �Comment s'articulent les inégalités
d'acquisition scolaire et d'orientation ? Relations ignorées et recti�cations tardives�,
Revue française de pédagogie, 175: 15-38.
[6] Croizet, Jean-Claude, Michel Désert, Marion Dutrévis and Jacques-Philippe Leyens.
2001. �Stereotype threat, social class, gender, and academic under-achievement: when
our reputation catches up to us and takes over�, Social Psychology of Education, 4,
295-310
[7] Croizet, Jean-Claude, Gérard Després, Marie-Eve Gauzins, Pascal Huguet, Jacques-
Philippe Leyens, Alain Méot. 2004. �Stereotype Threat Undermines Intellectual Per-
formance by Triggering a Disruptive Mental Load�, Personality and Social Psychology
Bulletin, 30, 721-732.
[8] Dee, Thomas S. 2009. �Stereotype threat and the student-athlete�, NBER Working
Papers 14705, National Bureau of Economic Research.
[9] Duru-Bellat. 1988. Le fonctionnement de l'orientation. Genèse des inégalités sociales
à l'école. Lausanne, Editions Delachaux et Niestlé.
[10] Jenck, Crouse and Mueser. 1983. "The Wisconsin Model of Status Attainment: A
National Replication with Improved Measures of Ability and Aspirations," Sociology
of Education (January 1983): pp. 3-19.
21

[11] Guyon and Huillery. 2014.
[12] Herpin Nicolas. 1996. �Les amis de classe : du collège au lycée�. Economie et statis-
tiques, 293: 125-136.
[13] Ho�, Karla & Pandey, Priyanka, 2004. �Belief systems and durable inequalities: an
experimental investigation of Indian caste�, Policy Research Working Paper Series
3351, The World Bank.
[14] Hoxby and Avery. 2012.
[15] Masson, Philippe. 1997. �Elèves, parents d'élèves et agents scolaires dans le processus
d'orientation�, Revue française de sociologie, 38(1): 119-142.
[16] Millet Mathias and Daniel Thin. 2005. Ruptures scolaires : l'école à l'épreuve de la
question sociale. Collection Le lien social, PUF, Paris.
[17] Millet Mathias and Daniel Thin. 2007. �Ecole, jeunes de milieux populaires et groupes
de pairs�, In : Marwan Mohammed et Laurent Mucchielli, Les bandes de jeunes. Des
� blousons noirs � à nos jours, La découverte, Paris.
[18] Oyserman, Bybee, Terry. 2006. �Possible Selves and Academic Outcomes: How and
When Possible Selves Impel Action�, Journal of Personality and Social Psychology,
91(1): 188-204
[19] Périer Pierre. 2004. �Adolescences populaires et socialisation scolaire. Les épreuves
relationnelles et identitaires du rapport pédagogique et identitaires du rapport péda-
gogique�. L'orientation scolaire et professionnelle, 33(2): 227-248.
[20] Sewell, Haller and Olhendorf. 1970.
[21] Steele, Claude and Joshua Aronson. 1995. �Stereotype Threat and the Intellectual Test
Performance of African Americans�, Journal of Personality and Social Psychology,
69(5): 797-811.
[22] Spencer Steven, Claude Steele and Diane Quinn. 1999. �Stereotype threat and women's
math performance�, Journal of Experimental Social Psychology, 35: 4-28.
22

[23] Van Zanten, Agnès. 2009. Choisir son école : stratégies familiales et médiations locales.
Collection � Le lien social �, PUF, Paris.
23

Table 1:
(1) (2) (3) (4) (5) (6)
VARIABLESAcademic Vocational Dual No education No response
Number of options
Priority Education (PE) -0.05* -0.00 0.02 -0.04** 0.06** -0.29(0.027) (0.039) (0.042) (0.020) (0.024) (0.201)
Both parents low educated -0.05* -0.01 0.06 -0.04* 0.04* -0.59***(0.027) (0.039) (0.043) (0.020) (0.024) (0.202)
PE * Parents low educated 0.02 -0.01 -0.02 0.08*** -0.04 0.58**(0.037) (0.054) (0.059) (0.028) (0.034) (0.281)
Constant 0.86*** 0.66*** 0.37*** 0.06* 0.14*** 3.74***(0.041) (0.060) (0.065) (0.031) (0.037) (0.309)
Math Test Score yes yes yes yes yes yes
Mean of dep. Variable 0.885 0.717 0.412 0.0591 0.0899 3.852Number of observations 1235 1235 1235 1235 1235 1235Adjusted R2 0.0734 0.00315 0.00471 0.00196 0.0513 0.0480
Among her options known for high school, the student mentions...
Table 2:
(1) (2) (3) (4) (5) (6) (7)
VARIABLESMore than 5
years5 years 3 or 4 years 1 or 2 years
No higher education
No responseNumber of
options
Priority Education (PE) -0.00 -0.08** -0.03 -0.04 0.02 0.08** -0.25(0.023) (0.034) (0.041) (0.037) (0.038) (0.041) (0.175)
Both parents low educated -0.05** -0.09*** -0.07 -0.04 -0.09** 0.13*** -0.71***(0.023) (0.034) (0.041) (0.038) (0.038) (0.041) (0.176)
PE * Parents low educated 0.03 0.04 -0.05 -0.00 -0.01 0.02 0.09(0.032) (0.047) (0.057) (0.052) (0.053) (0.057) (0.244)
Constant 0.07** 0.19*** 0.33*** 0.19*** 0.28*** 0.42*** 1.97***(0.035) (0.052) (0.063) (0.057) (0.058) (0.062) (0.269)
Math Test Score yes yes yes yes yes yes yes
Mean of dep. Variable 0.0753 0.206 0.377 0.256 0.264 0.387 1.847Number of observations 1235 1235 1235 1235 1235 1235 1235Adjusted R2 0.0133 0.0769 0.0505 0.0171 0.00620 0.0731 0.0777
Among her options known for higher education, the student mentions...
24

Table 3:
(1) (2) (3) (4) (5) (6)
VARIABLESAcademic Vocational Dual No education No response
Number of options
Priority Education (PE) -0.05 0.04* -0.02 0.02* 0.01 -0.02(0.036) (0.024) (0.016) (0.010) (0.031) (0.046)
Both parents low educated -0.08** 0.02 0.02 -0.01 0.03 -0.09**(0.037) (0.024) (0.016) (0.010) (0.031) (0.046)
PE * Parents low educated 0.02 -0.01 0.00 0.00 -0.00 0.01(0.051) (0.033) (0.022) (0.013) (0.043) (0.064)
The option is among options known 0.10 -0.07 0.05 0.00 -0.03 -0.03(0.108) (0.070) (0.047) (0.028) (0.091) (0.137)
Constant 0.13* 0.08** -0.00 -0.02 0.15*** 0.55***(0.065) (0.038) (0.025) (0.015) (0.047) (0.075)
Math Test Score yes yes yes yes yes yes
Mean of dep. Variable 0.662 0.0891 0.0372 0.0138 0.209 0.907Number of observations 1235 1235 1235 1235 1235 1235Adjusted R2 0.214 0.0828 0.0525 0.0865 0.236 0.163
Among her preferred options for high school, the student mentions...
Table 4:
(1) (2) (3) (4) (5) (6) (7)
VARIABLESMore than 5
years5 years 3 or 4 years 1 or 2 years
No higher education
No responseNumber of
options
Priority Education (PE) -0.02 -0.01 -0.02 0.00 0.08** -0.05 0.02(0.015) (0.022) (0.029) (0.025) (0.038) (0.038) (0.062)
Both parents low educated -0.02 -0.02 -0.06** 0.01 0.08** 0.02 -0.07(0.016) (0.023) (0.030) (0.025) (0.038) (0.039) (0.062)
PE * Parents low educated 0.02 0.01 0.03 -0.03 -0.11** 0.03 -0.08(0.021) (0.031) (0.041) (0.035) (0.053) (0.053) (0.086)
The option is among options known 0.05 0.11* -0.10 -0.02 0.01 0.06 0.07(0.045) (0.066) (0.087) (0.075) (0.112) (0.113) (0.182)
Constant 0.05** 0.01 0.06 0.02 0.28*** 0.18*** 0.58***(0.024) (0.034) (0.046) (0.039) (0.059) (0.060) (0.097)
Math Test Score yes yes yes yes yes yes yes
Mean of dep. Variable 0.0340 0.0874 0.189 0.121 0.321 0.410 0.815Number of observations 1235 1235 1235 1235 1235 1235 1235Adjusted R2 0.0357 0.165 0.244 0.198 0.118 0.190 0.190
Among her preferred options for higher education, the student mentions...
25

Table 5:
(1) (2) (3) (4) (5) (6)
VARIABLESAcademic Vocational Dual No education No response
Number of options
T1 0.01 -0.01 0.02 0.01 -0.02 0.01(0.031) (0.019) (0.016) (0.009) (0.027) (0.041)
T1*PE -0.01 0.02 0.03 -0.01 -0.03 0.04(0.053) (0.034) (0.028) (0.015) (0.047) (0.071)
T1*Parents low educated -0.00 0.01 0.04 0.02 -0.01 0.18**(0.054) (0.034) (0.028) (0.015) (0.047) (0.072)
T1*PE*Parents low educated -0.01 -0.02 -0.02 -0.02 0.05 -0.14(0.077) (0.048) (0.039) (0.022) (0.067) (0.102)
Priority Education (PE) -0.07* 0.04 -0.02 0.01 0.04 -0.05(0.038) (0.024) (0.019) (0.011) (0.033) (0.050)
Parents low educated -0.11*** 0.02 0.02 -0.01 0.06* -0.15***(0.038) (0.024) (0.020) (0.011) (0.033) (0.051)
PE * Parents low educated 0.03 -0.01 0.00 0.01 -0.03 0.06(0.053) (0.034) (0.028) (0.015) (0.047) (0.071)
Constant 0.59*** 0.14*** 0.02 0.02 0.24*** 0.88***(0.044) (0.028) (0.023) (0.012) (0.039) (0.059)
Math Test Score yes yes yes yes yes yes
Mean of dep. Variable 0.662 0.0891 0.0372 0.0138 0.209 0.907Number of observations 2443 2443 2443 2443 2443 2443Adjusted R2 0.109 0.0396 0.0274 0.00171 0.0360 0.0270
Among her preferred options for high school, the student mentions...
Table 6:
(1) (2) (3) (4) (5) (6) (7)
VARIABLESMore than 5
years5 years 3 or 4 years 1 or 2 years
No higher education
No responseNumber of
options
T1 -0.04*** 0.14*** -0.04 0.03 -0.04 -0.14*** 0.18***(0.011) (0.024) (0.027) (0.025) (0.031) (0.032) (0.056)
T1*PE 0.03 -0.03 0.02 0.04 -0.10* 0.05 -0.12(0.019) (0.041) (0.047) (0.043) (0.054) (0.056) (0.097)
T1*Both parents low educated 0.03 -0.05 0.09* -0.01 -0.02 0.01 0.02(0.019) (0.042) (0.048) (0.044) (0.054) (0.057) (0.098)
T1*EP*Both parents low educated -0.02 0.04 -0.02 0.04 0.15** -0.12 0.27*(0.027) (0.059) (0.067) (0.062) (0.077) (0.080) (0.139)
Priority Education (PE) -0.02* -0.03 -0.02 -0.01 0.09** -0.01 -0.02(0.013) (0.029) (0.033) (0.030) (0.038) (0.039) (0.068)
Parents low educated -0.03** -0.04 -0.08** -0.01 0.05 0.07* -0.19***(0.013) (0.029) (0.034) (0.031) (0.038) (0.040) (0.069)
PE * Parents low educated 0.03 0.02 0.02 -0.03 -0.12** 0.04 -0.05(0.019) (0.041) (0.047) (0.043) (0.054) (0.056) (0.097)
Constant 0.06*** 0.08** 0.13*** 0.12*** 0.40*** 0.38*** 0.92***(0.015) (0.034) (0.039) (0.036) (0.044) (0.046) (0.080)
Math Test Score yes yes yes yes yes yes yes
Mean of dep. Variable 0.0340 0.0874 0.189 0.121 0.321 0.410 0.815Number of observations 2443 2443 2443 2443 2443 2443 2443Adjusted R2 0.00649 0.0717 0.0176 0.00894 0.0347 0.0305 0.0344
Among her preferred options for higher education, the student mentions...
26

Table 7:
GROUP B(1) (2) (3) (4) (5) (6)
VARIABLESAcademic Vocational Dual No education No response
Number of options
T2 -0.04 -0.02 0.02 0.01 0.00 -0.03(0.050) (0.035) (0.022) (0.015) (0.044) (0.060)
T2*Parents low educated 0.06 0.04 -0.02 -0.02 -0.03 0.02(0.064) (0.045) (0.028) (0.019) (0.057) (0.077)
Parents low educated -0.10** -0.01 0.03 0.02 0.06 -0.11**(0.045) (0.032) (0.019) (0.013) (0.040) (0.054)
Constant 1.00*** 0.13 0.01 -0.01 -0.14 1.28***(0.151) (0.107) (0.065) (0.045) (0.135) (0.182)
Math Test Score yes yes yes yes yes yes
Mean of dep. Variable 0.584 0.127 0.0402 0.0211 0.243 0.869Number of observations 933 933 933 933 933 933Adjusted R2 0.0928 0.0212 0.00674 0.000152 0.0289 0.0251
Among her preferred options for high school, the student mentions...
Table 8:
GROUP B(1) (2) (3) (4) (5) (6) (7)
VARIABLESMore than 5
years5 years 3 or 4 years 1 or 2 years
No higher education
No responseNumber of
options
T2 0.00 -0.04* 0.01 0.02 -0.18*** 0.05 -0.21***(0.015) (0.022) (0.037) (0.033) (0.049) (0.052) (0.073)
T2*Parents low educated -0.01 0.05* -0.03 0.02 0.18*** -0.11* 0.25***(0.020) (0.028) (0.048) (0.043) (0.063) (0.067) (0.094)
Parents low educated -0.01 -0.03 -0.05 -0.05* -0.10** 0.14*** -0.28***(0.014) (0.020) (0.033) (0.030) (0.044) (0.047) (0.066)
Constant 0.10** 0.13* 0.33*** 0.12 0.22 0.30* 0.99***(0.046) (0.066) (0.113) (0.102) (0.149) (0.158) (0.223)
Math Test Score yes yes yes yes yes yes yes
Mean of dep. Variable 0.0233 0.0507 0.152 0.0951 0.366 0.429 0.740Number of observations 933 933 933 933 933 933 933Adjusted R2 0.00879 0.0223 0.0139 -0.00487 0.0367 0.00776 0.0118
Among her preferred options for higher education, the student mentions...
27

Table 9:
(1) (2) (3) (4) (5) (6)
VARIABLESAcademic Vocational Dual No education No response
Number of options
T3 -0.11*** 0.03* -0.00 -0.00 0.09*** -0.10**(0.032) (0.019) (0.012) (0.008) (0.030) (0.042)
T3*PE 0.02 -0.07** -0.01 -0.00 0.05 -0.09(0.054) (0.033) (0.020) (0.013) (0.051) (0.071)
T3*Parents low educated -0.04 -0.03 -0.02 0.01 0.09* -0.05(0.056) (0.034) (0.021) (0.014) (0.053) (0.074)
T3*PE*Parents low educated 0.02 0.06 0.01 -0.01 -0.08 0.09(0.079) (0.048) (0.029) (0.019) (0.074) (0.104)
Priority Education (PE) -0.07* 0.04 -0.01 0.01 0.04 -0.04(0.039) (0.024) (0.014) (0.009) (0.036) (0.051)
Parents low educated -0.11*** 0.02 0.03* -0.01 0.06 -0.15***(0.040) (0.024) (0.015) (0.010) (0.037) (0.052)
PE * Parents low educated 0.03 -0.02 -0.01 0.01 -0.02 0.05(0.056) (0.034) (0.020) (0.013) (0.052) (0.073)
Constant 0.71*** 0.22*** 0.08** 0.03 0.00 1.17***(0.094) (0.057) (0.034) (0.023) (0.088) (0.123)
Math Test Score yes yes yes yes yes yes
Mean of dep. Variable 0.662 0.0891 0.0372 0.0138 0.209 0.907Number of observations 2441 2441 2441 2441 2441 2441Adjusted R2 0.103 0.0312 0.0130 0.000995 0.0580 0.0486
Among her preferred options for high school, the student mentions...
Table 10:
(1) (2) (3) (4) (5) (6) (7)
VARIABLESMore than 5
years5 years 3 or 4 years 1 or 2 years
No higher education
No responseNumber of
options
T3 -0.03*** -0.05*** -0.03 -0.02 -0.04 0.02 -0.23***(0.011) (0.018) (0.026) (0.022) (0.031) (0.034) (0.050)
T3*PE 0.03 0.03 -0.03 0.00 -0.08 0.07 -0.04(0.019) (0.030) (0.044) (0.038) (0.053) (0.058) (0.085)
T3*Parents low educated 0.03 0.02 -0.03 -0.02 -0.04 0.08 0.01(0.020) (0.031) (0.046) (0.039) (0.055) (0.060) (0.088)
T3*PE*Parents low educated -0.05 -0.00 0.10 0.04 0.17** -0.20** 0.25**(0.028) (0.044) (0.065) (0.055) (0.077) (0.084) (0.124)
Priority Education (PE) -0.02 -0.04* -0.03 -0.02 0.08** -0.00 -0.04(0.014) (0.022) (0.032) (0.027) (0.038) (0.042) (0.061)
Parents low educated -0.03** -0.05** -0.09*** -0.01 0.05 0.08* -0.19***(0.014) (0.022) (0.032) (0.027) (0.039) (0.042) (0.062)
PE * Parents low educated 0.03 0.02 0.01 -0.03 -0.12** 0.04 -0.05(0.019) (0.031) (0.045) (0.038) (0.054) (0.059) (0.087)
Constant 0.00 -0.01 0.26*** 0.19*** 0.30*** 0.38*** 0.82***(0.033) (0.052) (0.076) (0.065) (0.091) (0.100) (0.146)
Math Test Score yes yes yes yes yes yes yes
Mean of dep. Variable 0.0340 0.0874 0.189 0.121 0.321 0.410 0.815Number of observations 2441 2441 2441 2441 2441 2441 2441Adjusted R2 0.0130 0.0525 0.0220 0.00197 0.0358 0.00870 0.0310
Among her preferred options for higher education, the student mentions...
28
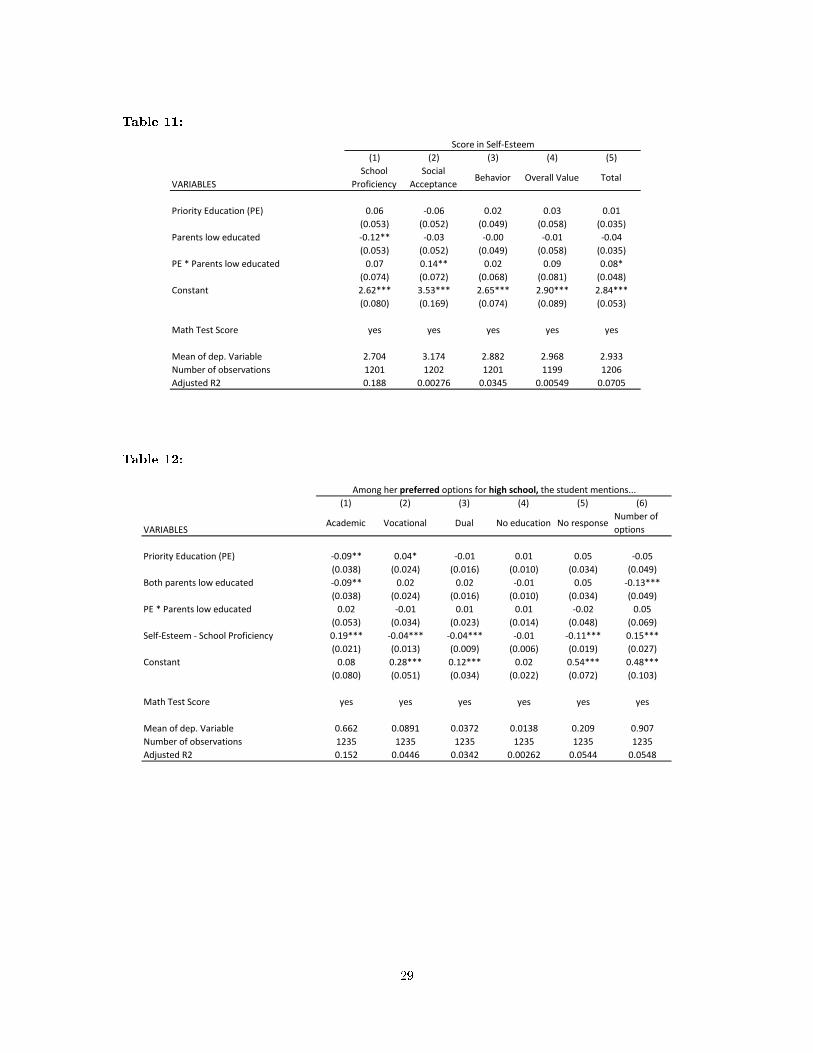
Table 11:
(1) (2) (3) (4) (5)
VARIABLESSchool
ProficiencySocial
AcceptanceBehavior Overall Value Total
Priority Education (PE) 0.06 -0.06 0.02 0.03 0.01(0.053) (0.052) (0.049) (0.058) (0.035)
Parents low educated -0.12** -0.03 -0.00 -0.01 -0.04(0.053) (0.052) (0.049) (0.058) (0.035)
PE * Parents low educated 0.07 0.14** 0.02 0.09 0.08*(0.074) (0.072) (0.068) (0.081) (0.048)
Constant 2.62*** 3.53*** 2.65*** 2.90*** 2.84***(0.080) (0.169) (0.074) (0.089) (0.053)
Math Test Score yes yes yes yes yes
Mean of dep. Variable 2.704 3.174 2.882 2.968 2.933Number of observations 1201 1202 1201 1199 1206Adjusted R2 0.188 0.00276 0.0345 0.00549 0.0705
Score in Self-Esteem
Table 12:
(1) (2) (3) (4) (5) (6)
VARIABLESAcademic Vocational Dual No education No response
Number of options
Priority Education (PE) -0.09** 0.04* -0.01 0.01 0.05 -0.05(0.038) (0.024) (0.016) (0.010) (0.034) (0.049)
Both parents low educated -0.09** 0.02 0.02 -0.01 0.05 -0.13***(0.038) (0.024) (0.016) (0.010) (0.034) (0.049)
PE * Parents low educated 0.02 -0.01 0.01 0.01 -0.02 0.05(0.053) (0.034) (0.023) (0.014) (0.048) (0.069)
Self-Esteem - School Proficiency 0.19*** -0.04*** -0.04*** -0.01 -0.11*** 0.15***(0.021) (0.013) (0.009) (0.006) (0.019) (0.027)
Constant 0.08 0.28*** 0.12*** 0.02 0.54*** 0.48***(0.080) (0.051) (0.034) (0.022) (0.072) (0.103)
Math Test Score yes yes yes yes yes yes
Mean of dep. Variable 0.662 0.0891 0.0372 0.0138 0.209 0.907Number of observations 1235 1235 1235 1235 1235 1235Adjusted R2 0.152 0.0446 0.0342 0.00262 0.0544 0.0548
Among her preferred options for high school, the student mentions...
29

Table 13:
(1) (2) (3) (4) (5) (6) (7)
VARIABLESMore than 5
years5 years 3 or 4 years 1 or 2 years
No higher education
No responseNumber of
options
Priority Education (PE) -0.02 -0.03 -0.03 -0.01 0.10** -0.02 -0.01(0.016) (0.024) (0.034) (0.029) (0.040) (0.043) (0.069)
Both parents low educated -0.03* -0.03 -0.07** -0.00 0.03 0.08* -0.17**(0.016) (0.024) (0.034) (0.029) (0.040) (0.043) (0.068)
PE * Parents low educated 0.02 0.01 0.01 -0.04 -0.10* 0.04 -0.08(0.022) (0.033) (0.047) (0.040) (0.056) (0.060) (0.095)
Self-Esteem - School Proficiency 0.02** 0.05*** 0.08*** 0.03* -0.12*** 0.01 0.06*(0.009) (0.013) (0.019) (0.016) (0.022) (0.024) (0.038)
Constant 0.01 -0.08 -0.03 0.02 0.67*** 0.35*** 0.72***(0.033) (0.050) (0.071) (0.060) (0.084) (0.090) (0.143)
Math Test Score yes yes yes yes yes yes yes
Mean of dep. Variable 0.0340 0.0874 0.189 0.121 0.321 0.410 0.815Number of observations 1235 1235 1235 1235 1235 1235 1235Adjusted R2 0.0162 0.0730 0.0361 0.00472 0.0490 0.00714 0.0290
Among her preferred options for higher education, the student mentions...
Table 14:
(1) (2) (3) (4) (5)
VARIABLESSchool
ProficiencySocial
AcceptanceBehavior Overall Value Total
T4 0.01 0.02 -0.01 -0.02 0.00(0.043) (0.042) (0.039) (0.047) (0.029)
T4*PE 0.08 0.10 0.07 0.11 0.09*(0.073) (0.071) (0.067) (0.081) (0.049)
T4*Parents low educated -0.05 0.04 0.05 -0.06 0.00(0.074) (0.072) (0.067) (0.082) (0.049)
T4*PE*Parents low educated -0.05 -0.17* -0.09 -0.08 -0.11(0.105) (0.102) (0.096) (0.116) (0.070)
Priority Education (PE) 0.06 -0.09* 0.03 0.03 0.01(0.052) (0.051) (0.048) (0.058) (0.035)
Parents low educated -0.13** -0.05 0.00 -0.01 -0.05(0.052) (0.051) (0.048) (0.058) (0.035)
PE * Parents low educated 0.09 0.15** 0.01 0.10 0.09*(0.074) (0.072) (0.067) (0.082) (0.049)
Constant 2.40*** 3.40*** 2.70*** 2.84*** 2.87***(0.129) (0.126) (0.056) (0.068) (0.086)
Math Test Score yes yes yes yes yes
Mean of dep. Variable 2.704 3.174 2.882 2.968 2.933Number of observations 2363 2365 2362 2361 2373Adjusted R2 0.182 0.00395 0.0361 0.00755 0.0575
Score in Self-Esteem
30

Table 15:
(1) (2) (3) (4) (5) (6)
VARIABLES Academic Vocational Dual No education No responseNumber of
options
T4 0.03 0.02 -0.01 -0.01 -0.03 -0.01(0.031) (0.020) (0.014) (0.007) (0.028) (0.040)
T4*PE -0.00 -0.06* 0.02 0.01 0.03 -0.03(0.053) (0.034) (0.024) (0.012) (0.047) (0.067)
T4*Parents low educated -0.06 0.02 0.03 0.01 0.01 0.08(0.054) (0.035) (0.024) (0.012) (0.048) (0.068)
T4*PE*Parents low educated 0.00 0.04 -0.03 -0.03 0.00 -0.07(0.076) (0.049) (0.034) (0.017) (0.068) (0.096)
Priority Education (PE) -0.07* 0.04 -0.01 0.01 0.04 -0.05(0.038) (0.024) (0.017) (0.009) (0.033) (0.047)
Parents low educated -0.11*** 0.02 0.03 -0.01 0.06* -0.15***(0.039) (0.025) (0.017) (0.009) (0.034) (0.048)
PE * Parents low educated 0.03 -0.01 -0.00 0.01 -0.02 0.06(0.054) (0.035) (0.024) (0.012) (0.048) (0.068)
Constant 0.64*** 0.12*** 0.04** -0.00 0.21*** 0.90***(0.045) (0.029) (0.020) (0.010) (0.040) (0.057)
Math Test Score yes yes yes yes yes yes
Mean of dep. Variable 0.662 0.0891 0.0372 0.0138 0.209 0.907Number of observations 2429 2429 2429 2429 2429 2429Adjusted R2 0.110 0.0344 0.0199 0.00404 0.0410 0.0336
Among her preferred options for high school, the student mentions...
Table 16:
(1) (2) (3) (4) (5) (6) (7)
VARIABLESMore than 5
years5 years 3 or 4 years 1 or 2 years
No higher education
No responseNumber of
options
T4 -0.02 -0.02 -0.02 -0.05** -0.03 -0.02 -0.20***(0.011) (0.019) (0.027) (0.022) (0.032) (0.034) (0.051)
T4*PE 0.01 0.03 -0.01 0.02 -0.13** 0.12** -0.05(0.019) (0.032) (0.046) (0.037) (0.054) (0.059) (0.086)
T4*Parents low educated 0.01 0.00 -0.02 0.01 0.02 0.01 0.10(0.020) (0.032) (0.046) (0.037) (0.054) (0.059) (0.087)
T4*PE*Parents low educated -0.02 -0.02 0.06 0.02 0.11 -0.11 0.11(0.028) (0.045) (0.065) (0.053) (0.077) (0.084) (0.123)
Priority Education (PE) -0.02 -0.04* -0.02 -0.01 0.08** -0.01 -0.03(0.014) (0.022) (0.032) (0.026) (0.038) (0.041) (0.061)
Parents low educated -0.03** -0.05** -0.08** -0.01 0.05 0.07* -0.19***(0.014) (0.023) (0.033) (0.027) (0.039) (0.042) (0.062)
PE * Parents low educated 0.03 0.02 0.01 -0.03 -0.12** 0.04 -0.05(0.020) (0.032) (0.046) (0.037) (0.054) (0.059) (0.087)
Constant 0.05*** 0.07*** 0.19*** 0.12*** 0.35*** 0.40*** 0.88***(0.016) (0.027) (0.038) (0.031) (0.045) (0.049) (0.073)
Math Test Score yes yes yes yes yes yes yes
Mean of dep. Variable 0.0340 0.0874 0.189 0.121 0.321 0.410 0.815Number of observations 2429 2429 2429 2429 2429 2429 2429Adjusted R2 0.00969 0.0568 0.0257 0.00338 0.0335 0.0124 0.0302
Among her preferred options for higher education, the student mentions...
31

Appendix Table 1: Aspirations at the High School Level
(1) (2) (3) (4) (5) (6)
VARIABLESAcademic* Vocational Dual No education No response
Number of options
Priority Education (PE) -0.08** 0.04* -0.01 0.01 0.05 -0.05(0.039) (0.024) (0.016) (0.010) (0.035) (0.049)
Parents low educated -0.11*** 0.02 0.02 -0.01 0.06* -0.15***(0.039) (0.024) (0.016) (0.010) (0.035) (0.050)
PE * Parents low educated 0.03 -0.02 -0.00 0.01 -0.03 0.06(0.054) (0.034) (0.023) (0.014) (0.048) (0.069)
Constant 0.58*** 0.17*** 0.02 -0.01 0.25*** 0.89***(0.060) (0.037) (0.025) (0.015) (0.053) (0.076)
Math Test Score yes yes yes yes yes yes
Mean of dep. Variable 0.662 0.0891 0.0372 0.0138 0.209 0.907Number of observations 1235 1235 1235 1235 1235 1235Adjusted R2 0.0934 0.0392 0.0178 0.00114 0.0333 0.0331Source: Guyon and Huillery (2014)
*This category entails 2 percentage points of students whose preferred option is "High School" or "High School Diploma" without precision
about the type of high school and high school diploma.
Among her preferred options for high school, the student mentions...
Appendix Table 2: Aspirations at Higher Education Level
(1) (2) (3) (4) (5) (6) (7)
VARIABLESMore than 5
years5 years 3 or 4 years 1 or 2 years
No higher education
No responseNumber of
options
Priority Education (PE) -0.02 -0.03 -0.03 -0.01 0.09** -0.01 -0.02(0.016) (0.024) (0.033) (0.028) (0.040) (0.042) (0.068)
Parents low educated -0.03* -0.04* -0.09** -0.01 0.05 0.07* -0.18***(0.016) (0.024) (0.034) (0.028) (0.040) (0.043) (0.068)
PE * Parents low educated 0.02 0.02 0.01 -0.03 -0.12** 0.04 -0.06(0.022) (0.033) (0.047) (0.039) (0.056) (0.059) (0.094)
Constant 0.06** 0.05 0.18*** 0.09** 0.37*** 0.36*** 0.89***(0.024) (0.036) (0.051) (0.043) (0.061) (0.065) (0.104)
Math Test Score yes yes yes yes yes yes
Mean of dep. Variable 0.0340 0.0874 0.189 0.121 0.321 0.410 0.815Number of observations 1235 1235 1235 1235 1235 1235 1235Adjusted R2 0.0144 0.0651 0.0245 5.88e-05 0.0249 0.00795 0.0267Source: Guyon and Huillery (2014)
Among her preferred options for higher education, the student mentions...
32
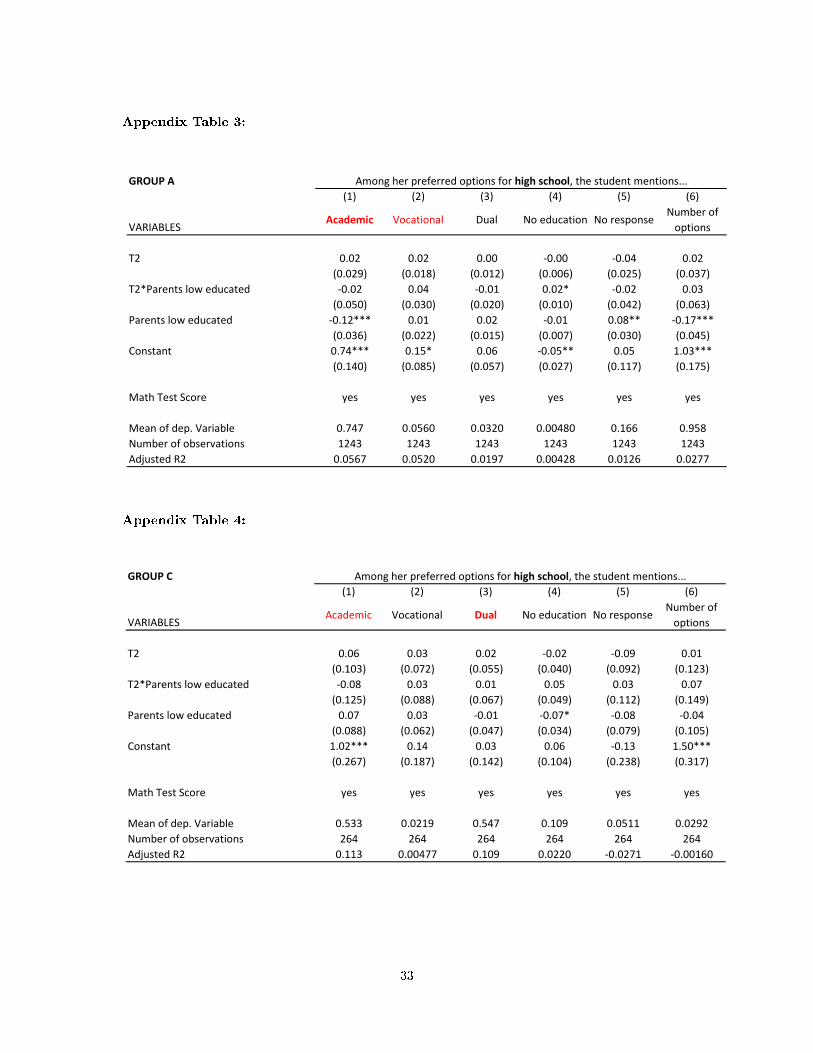
Appendix Table 3:
GROUP A(1) (2) (3) (4) (5) (6)
VARIABLESAcademic Vocational Dual No education No response
Number of options
T2 0.02 0.02 0.00 -0.00 -0.04 0.02(0.029) (0.018) (0.012) (0.006) (0.025) (0.037)
T2*Parents low educated -0.02 0.04 -0.01 0.02* -0.02 0.03(0.050) (0.030) (0.020) (0.010) (0.042) (0.063)
Parents low educated -0.12*** 0.01 0.02 -0.01 0.08** -0.17***(0.036) (0.022) (0.015) (0.007) (0.030) (0.045)
Constant 0.74*** 0.15* 0.06 -0.05** 0.05 1.03***(0.140) (0.085) (0.057) (0.027) (0.117) (0.175)
Math Test Score yes yes yes yes yes yes
Mean of dep. Variable 0.747 0.0560 0.0320 0.00480 0.166 0.958Number of observations 1243 1243 1243 1243 1243 1243Adjusted R2 0.0567 0.0520 0.0197 0.00428 0.0126 0.0277
Among her preferred options for high school, the student mentions...
Appendix Table 4:
GROUP C(1) (2) (3) (4) (5) (6)
VARIABLESAcademic Vocational Dual No education No response
Number of options
T2 0.06 0.03 0.02 -0.02 -0.09 0.01(0.103) (0.072) (0.055) (0.040) (0.092) (0.123)
T2*Parents low educated -0.08 0.03 0.01 0.05 0.03 0.07(0.125) (0.088) (0.067) (0.049) (0.112) (0.149)
Parents low educated 0.07 0.03 -0.01 -0.07* -0.08 -0.04(0.088) (0.062) (0.047) (0.034) (0.079) (0.105)
Constant 1.02*** 0.14 0.03 0.06 -0.13 1.50***(0.267) (0.187) (0.142) (0.104) (0.238) (0.317)
Math Test Score yes yes yes yes yes yes
Mean of dep. Variable 0.533 0.0219 0.547 0.109 0.0511 0.0292Number of observations 264 264 264 264 264 264Adjusted R2 0.113 0.00477 0.109 0.0220 -0.0271 -0.00160
Among her preferred options for high school, the student mentions...
33

Appendix Table 5:
GROUP B(1) (2) (3) (4) (5) (6) (7)
VARIABLESMore than 5
years5 years 3 or 4 years 1 or 2 years
No higher education
No responseNumber of
options
T2 0.00 -0.04* 0.01 0.02 -0.18*** 0.05 -0.21***(0.015) (0.022) (0.037) (0.033) (0.049) (0.052) (0.073)
T2*Parents low educated -0.01 0.05* -0.03 0.02 0.18*** -0.11* 0.25***(0.020) (0.028) (0.048) (0.043) (0.063) (0.067) (0.094)
Parents low educated -0.01 -0.03 -0.05 -0.05* -0.10** 0.14*** -0.28***(0.014) (0.020) (0.033) (0.030) (0.044) (0.047) (0.066)
Constant 0.10** 0.13* 0.33*** 0.12 0.22 0.30* 0.99***(0.046) (0.066) (0.113) (0.102) (0.149) (0.158) (0.223)
Math Test Score yes yes yes yes yes yes yes
Mean of dep. Variable 0.0233 0.0507 0.152 0.0951 0.366 0.429 0.740Number of observations 933 933 933 933 933 933 933Adjusted R2 0.00879 0.0223 0.0139 -0.00487 0.0367 0.00776 0.0118
Among her preferred options for higher education, the student mentions...
Appendix Table 6:
GROUP C(1) (2) (3) (4) (5) (6) (7)
VARIABLESMore than 5
years5 years 3 or 4 years 1 or 2 years
No higher education
No responseNumber of
options
T2 -0.01 -0.00 -0.13* 0.08 -0.01 -0.05 -0.12(0.027) (0.045) (0.078) (0.071) (0.105) (0.111) (0.154)
T2*Parents low educated 0.01 0.01 0.15 -0.12 0.00 0.07 0.05(0.033) (0.054) (0.094) (0.086) (0.127) (0.134) (0.187)
Parents low educated 0.01 -0.05 -0.15** 0.03 -0.01 0.07 -0.16(0.023) (0.038) (0.066) (0.061) (0.089) (0.095) (0.132)
Constant 0.00 0.13 0.43** -0.15 0.53* 0.21 0.92**(0.070) (0.115) (0.200) (0.183) (0.270) (0.286) (0.398)
Math Test Score yes yes yes yes yes yes yes
Mean of dep. Variable 0.0219 0.0365 0.161 0.124 0.343 0.438 0.737Number of observations 264 264 264 264 264 264 264Adjusted R2 -0.0108 -0.0229 0.0202 0.00792 -0.00354 -0.0266 -0.0196
Among her preferred options for higher education, the student mentions...
34