Embed Size (px)
Citation preview
1
The 2018 CPA-Zicklin Index of Corporate Political Disclosure and Accountability
S&P 500 Commitment to Political Disclosure and Accountability Remains Strong Despite Attacks
2 3
ABOUT THE CENTER FOR POLITICAL ACCOUNTABILITY
The Center for Political Accountability (CPA) is a non-profit, non-partisan organization working to bring transparency and accountability to corporate political spending. It was formed to address the secrecy that cloaks much of the political activity engaged in by companies and the risks this poses to shareholder value. Collaborating with more than a dozen shareholder advocates, CPA is the only group directly engaging companies to improve disclosure and oversight of their election-related spending. This includes soft money contributions and payments to trade associations and other tax-exempt organizations that are used for political purposes. The Center aims to encourage responsible corporate political activity, protect shareholders, and strengthen the integrity of the political process. As a result of the efforts of CPA and its partners, more than 160 leading public companies have adopted political disclosure and oversight.
ABOUT THE ZICKLIN CENTER FOR BUSINESS ETHICS RESEARCH AT THE WHARTON SCHOOL OF THE UNIVERSITY OF PENNSYLVANIA
The Carol and Lawrence Zicklin Center for Business Ethics Research was established in 1997. The mission of the Center is to sponsor and disseminate leading-edge research on critical topics in business ethics. It provides students, educators, business leaders, and policy makers with research to meet the ethical, governance, and compliance challenges that arise in complex business transactions. The Zicklin Center supports research that examines those organizational incentives and disincentives that promote ethical business practices, along with the firm-level features, processes, and decision-making associated with failures of governance, compliance, and integrity.
Published October 2, 2018
Copyright © 2018 by the Center for Political Accountability. All rights reserved. No portion of this material may be reproduced in any form or medium whatsoever without the express, written, prior permission of the copyright holder. For information, please contact:
Bruce F. FreedCenter for Political Accountability
1233 20th St. NW, Suite 205Washington, DC 20036
(202) 464-1570 Ext. 102 (voice)(202) 464-1575 (fax)
4 5
TABLE OF CONTENTSForeword 7
Acknowledgments 9
2018 CPA-Zicklin Trendsetters 10
Executive Summary 12
Introduction 15
Scoring of the Index 17
I. Comparison of Companies Since 2015 18
II. Full S&P 500 Results 20 a. Trendsetters in Political Disclosure and Accountability 21 b. Most Improved Companies This Year 22 c. Backsliding Companies 23 d. Corporate Political Spending Disclosure 24 e. Political Spending Policies 27
f. Oversight of Political Spending 28 g. Prohibitions on Political Spending 29 h. Index Performance by Company Size 31 i. Index Performance by Sector 32
III. Voluntary Disclosure and Shareholder Engagement 33
Appendix A: Methodology 34
Appendix B: Glossary 35
Appendix C: Scoring Key 37
Appendix D: Scoring Guidelines 38
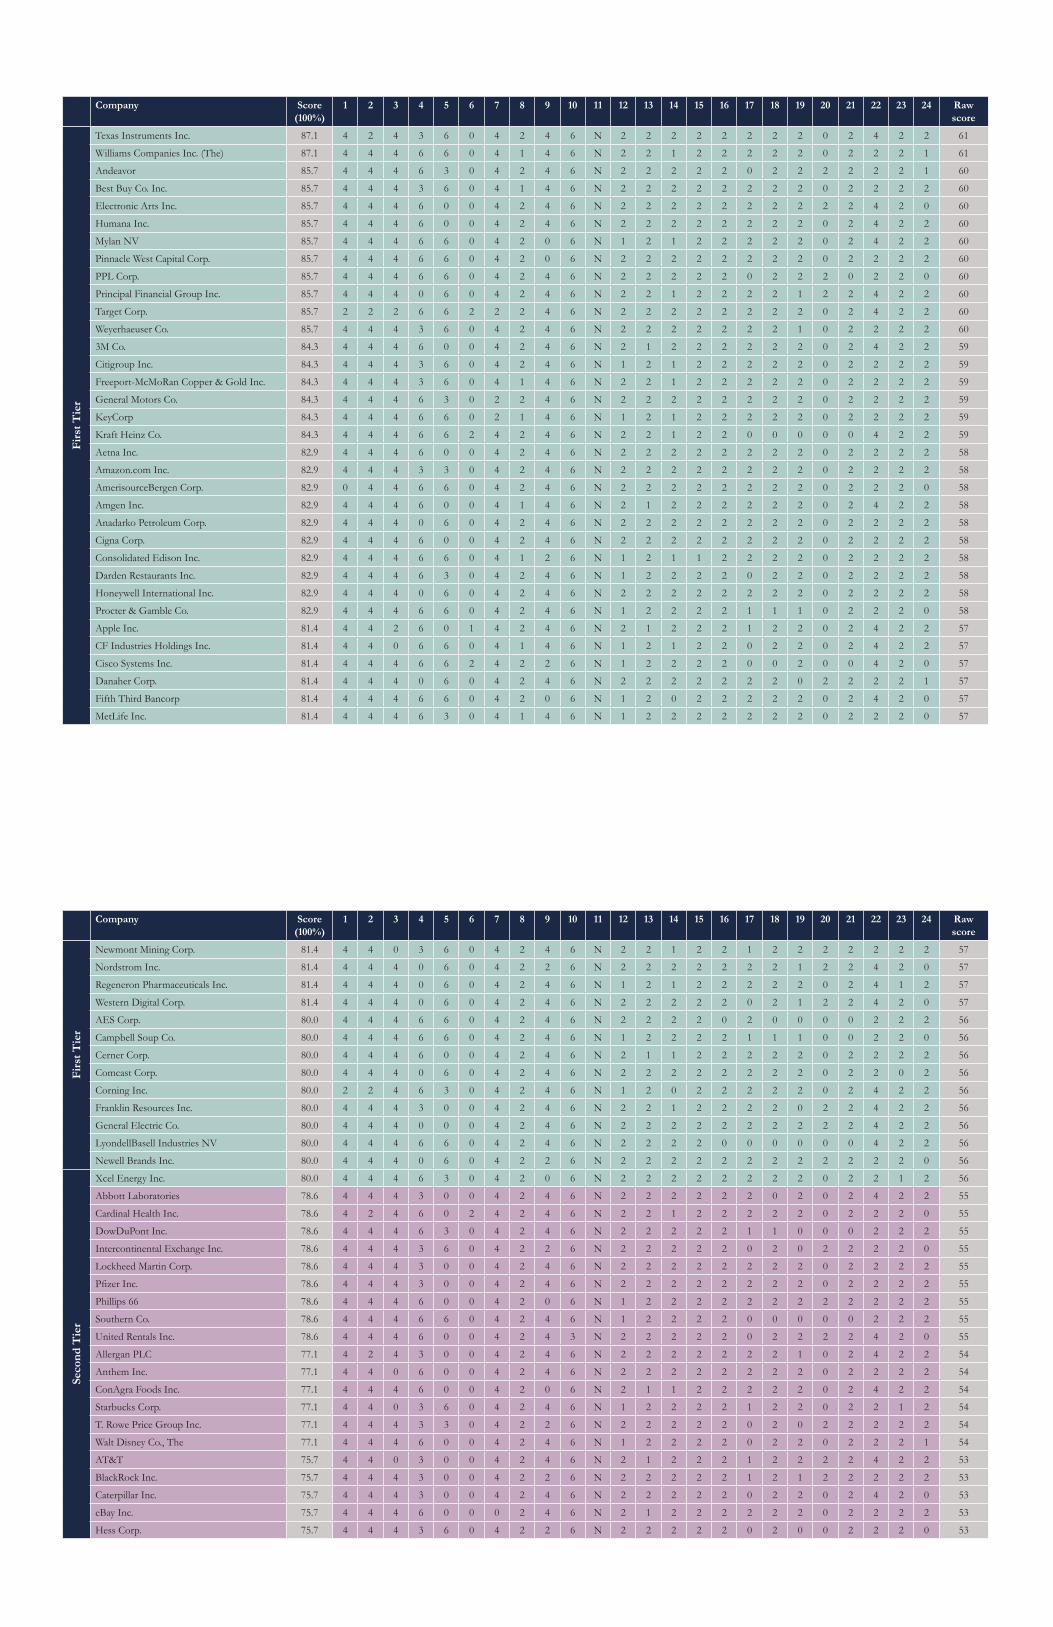
Appendix E: Scored Ranking of All Companies 40
Appendix F: Scores of Companies That Do Not Spend 55
6 7
FOREWORD
While we don’t know precisely how much will be spent in the 2018 midterm elections, an educated guess places it at a record-breaking $4 billion. Because a significant part of political spending is hidden from public view, it’s impossible to document how much of this will come from publicly held corporations. As a result, shareholders are prevented from knowing exactly where their money is going. In addition, the public is in the dark about who’s funding our politics and shaping public policy.
At a time when transparency is encouraged in every facet of our economy, political spending must not be exempted. When shareholders are secretly forced to support candidates or positions in conflict with their personal beliefs, it is wrong in principle and unacceptable in practice. Yet this is exactly what happens when a publicly held company conceals its use of shareholder funds to support candidates or actions that may be contrary to shareholders’ wishes or to a company’s long-term interest.
At the Center for Political Accountability, we believe that when companies disclose their political spending, they are forced to consider the gamut of their political responsibilities more seriously. These companies recognize that shareholders and other stakeholders will hold them accountable. They will be more likely to adopt thoughtful policies governing political spending and not simply leave decisions to a company functionary who might acquiesce to a powerful politician or accede to the promise of later personal gain.
We also are convinced that when both management and directors are involved in seriously weighing corporate policies, it is the most powerful weapon a company can deploy to ensure that its business interests and reputation are more highly valued than a single individual’s political preferences. As Warren Buffett once said: “It takes 20 years to build a reputation and five minutes to ruin it.” Transparency is one way to preserve it, and an upcoming academic article in the Journal of Corporate Finance affirms that companies increasingly agree.1
I don’t arrive at these conclusions lightly. As former chairman of a leading institutional investor and as a long-concerned citizen, I can attest first hand to the paramount importance of political disclosure and accountability to protect not only companies and investors, but also to protect our republic.
A CPA board member, Mr. Zicklin is a former Chairman of the Board of investment management firm Neuberger Berman. He is currently a Clinical Professor at The Stern School of Business at New York University and teaches courses at Stern and NYU Law School.
1 Lisa Goh, Xuejiao Liu, & Albert Tsang, Voluntary Disclosure of Corporate Political Spending, J. Corp. Fin. (forthcoming), available at https://ssrn.com/abstract=3243149.
Lawrence Zicklin
8 9
ACKNOWLEDGMENTSThe 2018 CPA-Zicklin Index was written by the Center for Political Accountability team, comprised of Bruce Freed, CPA President; Karl Sandstrom, CPA Counsel and Senior Counsel with Perkins Coie; Dan Carroll, CPA Director of Programs; Caitlin Moniz, CPA Assistant Director; and Peter Hardin, CPA Writer and Editor;.
Preliminary company data was collected by Sophie Adelman, Garrett Bellows, Truman Derrick, Ethan Johnston, Nora Sussman, and Brittany Zhang, CPA research analysts.
The Center is grateful to the Carol and Lawrence Zicklin Center for Business Ethics Research of the Wharton School of the University of Pennsylvania. CPA and the Zicklin Center first announced in 2007 a collaborative effort on corporate governance and corporate poiltical accountability.
CPA thanks Lawrence Zicklin, whose wise counsel and generosity made the CPA-Zicklin Index possible; Professor William S. Laufer of the Wharton School and director of its Zicklin Center, who first proposed the Index to CPA in July 2009; and Peter Kinder, former president of KLD Research & Analytics Inc., who helped develop the original list of indicators used in compiling the Index and worked closely with CPA in testing and finalizing the indicators.
CPA thanks its advisory committee, created to develop an objective system for scoring companies’ policies and practices on political disclosure and accountability. Advisory committee members include: Julia Fox Gorte, Ph.D., Senior Vice President for Sustainable Investing; Lloyd Kurtz, Chief Investment Officer, Senior Portfolio Manager, Nelsen Capital Management; William S. Laufer, Professor of Legal Studies and Business Ethics, Sociology, and Criminology, and Director, The Carol and Lawrence Zickling Center for Business Ethics Research; and Blaine Townsend, Senior Vice President, Director, Sustainable, Responsible and Impact Investing Group, Bailard Inc.
CPA thanks Bailard Inc., a majority employee-owned institutional asset management and wealth advisory firm headquartered in Foster City, California, for its support for the Index.
10 11
2018 CPA-ZICKLIN TRENDSETTERS
The companies above gave permission for their logos to be displayed. For a full list of Trendsetters, see page 21.
12 13
EXECUTIVE SUMMARYThe CPA-Zicklin Index has been published annually since 2011. This is the first Index to report data from a full year of the Trump presidency and a Republican majority Congress, between May 2017 and mid-September 2018.
Data from the 2018 Index show a pattern of large public U.S. companies holding steady in accepting and practicing disclosure and accountability with regard to their election-related spending, despite counter-pressures from Washington and certain elements of the corporate trade association community.2 (In several key categories, more companies are letting in sunlight.)
Overall, there is a hostile environment for disclosure.
Quietly, these companies are resisting it.
“Core” S&P 500 Companies
The average Index score evaluating overall political disclosure and accountability for the 414 companies that have remained constant members of the S&P 500 since 2015 has continued to climb, from 41.6 in 2015 to 49.7 in 2018.3 These core companies have maintained an unyielding commitment to political disclosure and accountability, establishing it as a corporate governance norm.
In addition, the number of core companies fully disclosing or prohibiting election-related spending has increased in all five categories of spending since last year, and since 2015. Similarly, there were increases in the number of core companies with elements of political spending oversight and accountability.
All S&P 500 Companies
AVERAGE SCORE: For all companies in the S&P 500 studied in the 2018 Index, the average total score is 44.1 percent, holding steady from 43.1 percent a year earlier.
CPA-ZICKLIN TRENDSETTERS: Fifty-seven companies in the S&P 500 received scores of 90 percent or higher and earned the designation of CPA-Zicklin Trendsetters. This number rose from 50 in 2017. In 2015, the first year that the Index benchmarked the S&P 500, there were 28 Trendsetters. Trendsetter companies in 2018 span every sector of the U.S. economy. In addition, three companies scored 100 percent, up from one in 2017 and zero in previous indexes.
2 Andrew Ross Sorkin, What’s Behind a Pitch for the Little-Guy Investor? Big Money Interests, n.Y. Times: Dealbook (July 24, 2018), https://www.nytimes.com/2018/07/24/business/dealbook/main-street-investors-coalition.html.3 The composition of the S&P 500 fluctuates, and the list of S&P companies to be evaluated on the Index is pulled annually in April. Because of this fluctuation, only 414 of the 493 companies evaluated in 2018 have remained constant members of the S&P 500 since 2015.
MORE TOP-TIER COMPANIES: 197 companies scored in the top two tiers (80-100 percent and 60-79 percent), an increase from 189 in 2017, 180 in 2016 and 174 in 2015.
DISCLOSURE OR PROHIBITION: 294 S&P 500 companies disclosed some or all of their election-related spending, or prohibited such spending in 2018, compared with 295 for 2017.
When these numbers are broken down further, 232 companies disclosed some or all election-related spending in 2018, compared to 236 such companies in 2017. Turnover in the S&P 500 influenced this fluctuation significantly.
In 2018, 176 companies prohibit at least one category of corporate election-related spending, a sizable increase from 158 companies in 2017, 143 companies in 2016 and 125 companies in 2015.
MOST-IMPROVED COMPANIES: These eight companies are rated “most-improved” for gains in their overall scores of 50 percentage points or more: Public Storage; United Rentals Inc.; Regeneron Pharmaceuticals Inc.; Franklin Resources; Excel Energy Inc.; Quest Diagnostics Inc.; BorgWarner Inc.; and Lincoln National Corp.
COMPANIES PROHIBITING OR ABSTAINING FROM ALL POLITICAL SPENDING: Ten companies prohibited the use of corporate assets to influence elections and asked third parties not to use company payments for election-related purposes. Eight companies did so in 2017.
IMPACT OF SHAREHOLDER ENGAGEMENT: For all four years that the Index has evaluated the S&P 500, there has been a strong positive correlation between shareholder engagement with a company and the company’s Index score.
The above trends indicate that in a time of upheaval and political polarization, many leading U.S. public companies remain steadfast in recognizing the importance of disclosure, accountability, and oversight of their political spending. These are among the largest, most influential public companies in the nation. They set the best practices for American business.
On the eve of a high-spending election to determine control of Congress and numerous statehouses and potentially set the future of the Trump presidency, these trends are relevant and timely. They emerge despite the administration’s prizing secrecy and Congress having passed legislation to fend off a proposed federal rule for public companies to disclose their political spending.
In our fiercely divided era, when company political spending or engagement can result in a conflict with core company values and positions, adverse publicity, and public blowback or boycotts, these trends also matter greatly to shareholders. CPA’s “Collision Course” report in June 2018 documented these issues and the heightened risks of corporate political expenditures in such a volatile climate.4
4 CenTer For poliTiCal aCCounTabiliTY, Collision Course: The risks Companies FaCe When Their poliTiCal spenDing anD Core Values ConFliCT anD hoW To aDDress Them 7 (June 9, 2018), http://files.politicalaccountability.net/reports/cpa-reports/Final_Draft_Collision_Report.pdf.
14 15
INTRODUCTIONTo appreciate the importance of public companies holding steady to disclosure of and accountability for their political spending in 2018, it’s necessary to spotlight the multiple pressures they are facing.
PRESSURE TO GIVE POLITICAL MONEY, MUCH OF IT ‘DARK’: The 2018 mid-term elections often are described as second only to a presidential election in their potential impact. Accordingly, spending is soaring. It could become the most expensive mid-term election in history.5 Corporations are under pressure to give money through channels that are legal for them. In states, too, some elections are attracting multi-million dollar spending, whether they are to flip control of a state legislature (North Carolina is a prime example6) or to pass or to block ballot initiatives (this spending by corporations and interest groups could top $1 billion according to a recent analysis7).
Today, “dark money” from undisclosed donors is pouring into elections across America.8 It is on the rise, it can have a highly corrosive effect, and the sums are sometimes staggering. Missouri Gov. Eric Greitens’ resignation in June was seen by some analysts as forced by allegations of dark money improperly financing his campaign bid.9 Nationally, an August report said dark money groups had accounted for more than 50 percent of all outside group spending on broadcast TV ads so far in the 2018 election cycle.10 A separate report in September said the single top spender of anonymous cash on federal elections between 2010 and 2016 was the U.S. Chamber of Commerce, drawing heavily on corporate payments, at about $130 million.11 Dark money has even become a major source for national advertising and lobbying on both sides of the battle over confirming Supreme Court nominee Brett M. Kavanaugh.12
HOSTILITY TO TRANSPARENCY: Secrecy has become a hallmark of the national Administration and Congress.13 It is notable that despite vows to clean the Washington “swamp,”
1 Robert Schroeder, More money will probably be spent on this year’s midterm elections than it cost to produce all 19 Marvel superhero movies, markeT-WaTCh (May 11, 2018, 10:52 AM), https://www.marketwatch.com/story/why-spending-on-this-years-midterm-elections-should-shat-ter-records-2018-05-10.6 Amy Gardner, Voter backlash to Trump and bathroom law has put conservative N.C. legislature in play, Wash. posT (Sept. 11, 2018), https://www.washingtonpost.com/politics/voter-backlash-to-trump-bathroom-law-have-put-conservative-nc-legislature-in-play/2018/09/10/346e3190-b1f5-11e8-a20b-5f4f84429666_story.html?utm_term=.30e4bc2a4b0c.7 Reid Wilson, Corporations, interest groups spend fortunes on ballot measures, hill (Sept. 1, 2018, 4:16 PM), http://thehill.com/busi-ness-a-lobbying/404555-corporations-interest-groups-spend-fortunes-on-ballot-measures.8 Maggie Koerth-Baker, How Money Affects Elections, FiVeThirTYeighT (Sept. 10, 2018, 5:56 AM), https://fivethirtyeight.com/fea-tures/money-and-elections-a-complicated-love-story/ (“Dark money — flowing to political action committees from undisclosed donors — is up 26 percent.”).9 Ciara C. Torres-Spelliscy, Missouri’s dark money scandal, explained, salon (June 2, 2018, 12:29 PM), https://www.salon.com/2018/06/02/missouris-dark-money-scandal-explained_partner/.10 Jordan Muller and Robert Maguire, Report: Secretive nonprofits remain a major player in 2018, openseCreTs neWs (Aug. 3, 2018), https://www.opensecrets.org/news/2018/08/report-secretive-nonprofits-remain-a-major-player-in-2018/.11 issue one, Dark moneY illuminaTeD 5-6 (2018), https://www.issueone.org/wp-content/uploads/2018/09/Dark-Money-Illumi-nated-Report.pdf.12 Editorial, Who is paying for the next Supreme Court justice?, Wash. posT (July 15, 2018), https://www.washingtonpost.com/opinions/who-is-paying-for-the-next-supreme-court-justice/2018/07/15/8894e4d8-8538-11e8-8553-a3ce89036c78_story.html?utm_term=.0f1a2d1be953.13 Editorial, Trump administration unfurls a veil of secrecy, usa ToDaY (Mar. 19, 2018, 1:09 PM), https://www.usatoday.com/story/opin-ion/2018/03/09/trump-administration-unfurls-veil-secrecy-sunshine-week/407900002/.
BASEMENT-DWELLERS AND BACK-SLIDERS: Meanwhile, the 2018 Index data show 62 companies in the S&P 500 residing solidly in the basement (with scores of zero). Fourteen companies backslid with overall scores declining 10 points or more (they are Waters Corp., Lowe’s Companies, Kinder Morgan, CSX, Boston Scientific, Valero Energy, Eversource, eBay, Emerson Electric, Masco, Mondelez International, FMC, Acuity Brands, and IDEXX Laboratories). Six companies that had reached disclosure agreements in the past failed to make any disclosure (they are PulteGroup, Kroger, Boston Scientific, CSX, Delta Air Lines, and FMC). More work lies ahead to educate basement-dwellers and backsliders alike and to elevate them in the Index’s ranks, where political disclosure and accountability are in the American mainstream.
16 17
there’s been no movement on various bills to reform campaign funding.14 Regarding disclosure specifically, the Internal Revenue Service adopted a rule that 501(c) organizations, with the exception of 501(c)(3) public policy groups, will no longer be required to disclose their major donors to the agency15; prior to the rule, contributors were reported to the IRS but not made public. And the President signed into law an appropriations bill with a provision, contained in federal spending bills since 2016, blocking the Securities and Exchange Commission from mandating that public companies disclose their political spending.16
PRESSURE TO TAKE A STAND, AND HEIGHTENED RISK ENSUES: “At the intersection of business and politics in America, a new era has dawned, bringing hyper-charged, partisan and passionate division over political and social issues to the fore. The warp-like speed of digital news and social media inflames passions. In this fraught climate, and ahead of this fall’s mid-term elections, corporations are in the cross-hairs.”17 That’s how CPA’s “Collision Course” report summed up the new operating environment for companies. It also identified emerging threats:
“When more companies shift from avoiding the hottest issues of the day to taking a stand, and public passions over political and social issues often boil over into outrage, it leads to a heightened risk for companies: Will their actions align with their core values and brands? Increasingly, this question is being raised publicly about scores of U.S. corporations whose underwriting of political groups and trade associations contributes to outcomes that appear to conflict with core company values and messaging.”18
U.S. companies are navigating uncharted political waters. For the first time, the 2018 CPA-Zicklin Index rates companies’ performances during a full year of the Trump presidency and a Republican-majority Congress. It shows that leading U.S. companies have not cast overboard disclosure and oversight of their political spending. Indeed, the number of top scoring companies and the number of S&P 500 companies tracked by the Index since 2015 that are strengthening their disclosure or restricting their spending continues to increase. They are holding fast to these principles as they seek to preserve profit, their reputation, and their service to the nation at large.
14 Dave Levinthal, Actions, not words, tell Trump’s political money story, CenTer For pub. inTegriTY (Jan. 19, 2018, 5:00 AM), https://www.publicintegrity.org/2018/01/19/21480/actions-not-words-tell-trumps-political-money-story.15 Charles S. Clark, Treasury and IRS Move to Protect Donor Anonymity, goV’T exeC. (July 17, 2018), https://www.govexec.com/manage-ment/2018/07/treasury-and-irs-move-protect-donor-anonymity/149800/.16 Marianne Lavelle, $1.3 Trillion Omnibus Spending Bill Passes After GOP Drops Anti-Environment Riders, insiDe ClimaTe neWs, (Mar. 23, 2018), https://insideclimatenews.org/news/22032018/congress-omnibus-spending-bill-environment-clean-energy-riders-campaign-fi-nance-dark-money.17 CenTer For poliTiCal aCCounTabiliTY, Collision Course: The risks Companies FaCe When Their poliTiCal spenDing anD Core Values ConFliCT anD hoW To aDDress Them 7 (June 9, 2018), http://files.politicalaccountability.net/reports/cpa-reports/Final_Draft_Collision_Report.pdf.18 Id. at 8.
Box 1. SCORING OF THE INDEX
Interpretation and Scoring. The Index’s accuracy depends upon consistency and fairness in scoring. In order to analyze companies accurately and consistently across 24 indicators, we must adhere closely to our rigorous scoring guidelines.
CPA scores each company based solely on the information that is publicly available on the company’s website and without regard to how the company was scored in previous years. This ensures that companies are scored on their current disclosure practices and policies. CPA consults with its Scoring Advisory Committee in order to be as consistent, fair, and accurate as possible. Companies are also given the opportunity to speak with CPA about the Index scoring process and their individual scores before the Index is published.
CPA’s practice is to announce any revisions to the Index’s 24 indicators or their interpretations one year in advance.
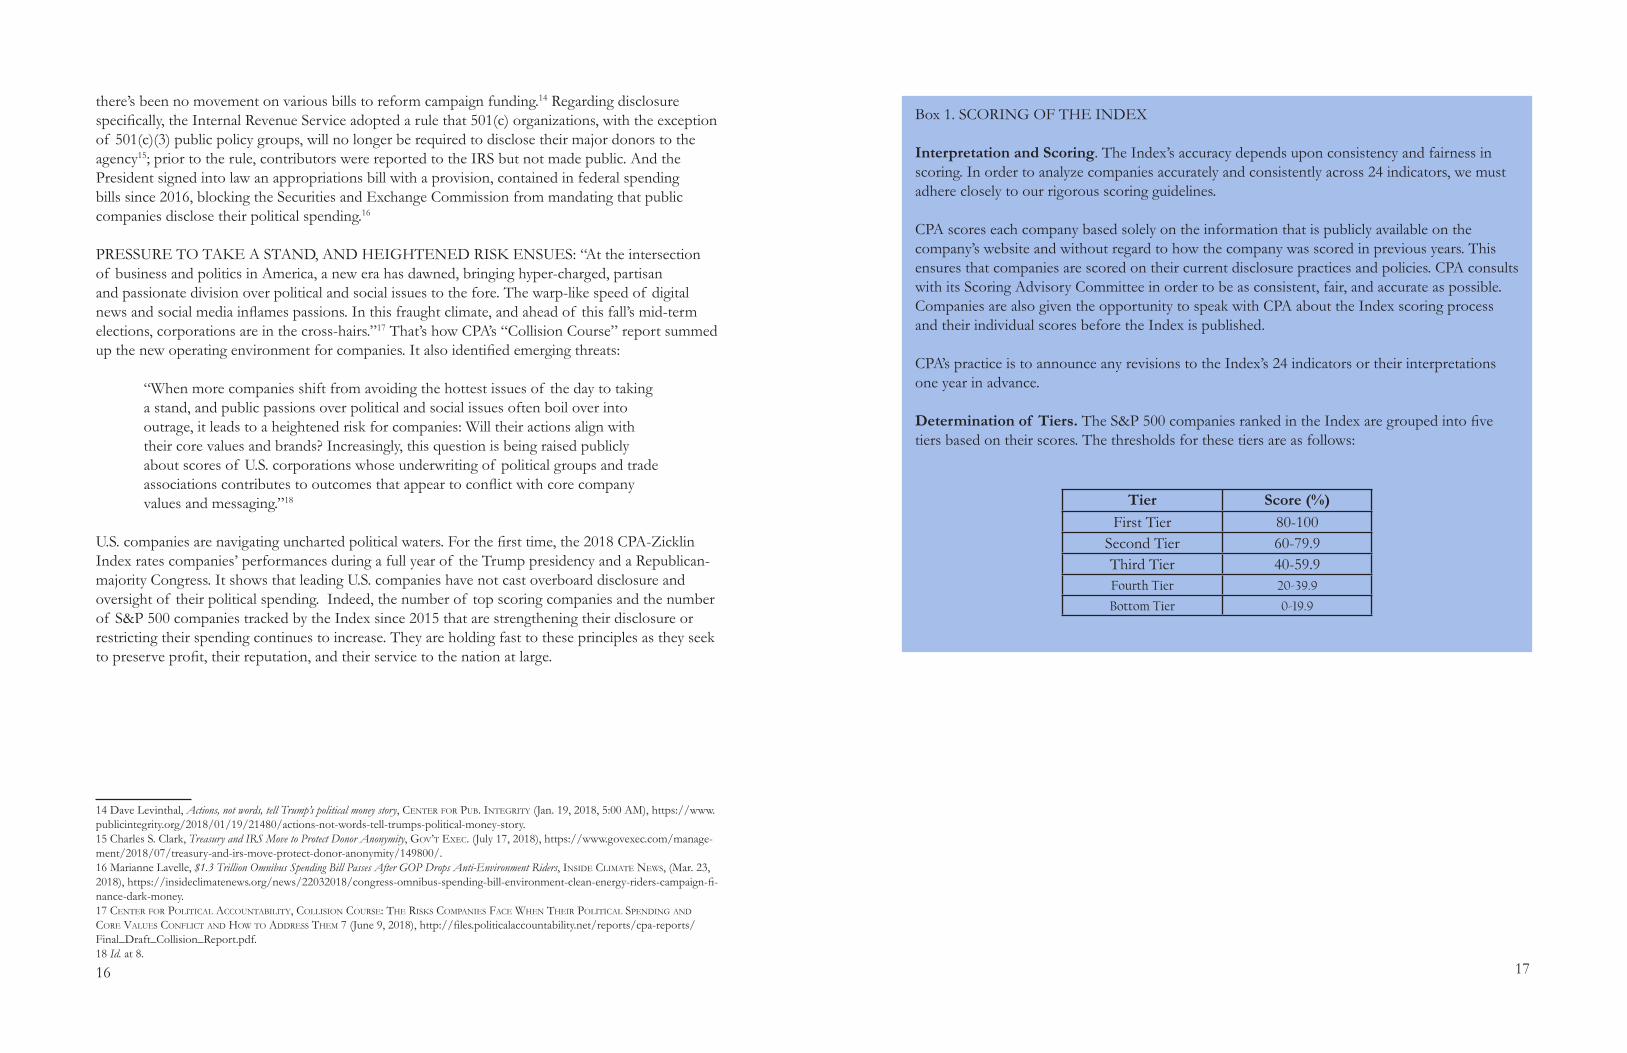
Determination of Tiers. The S&P 500 companies ranked in the Index are grouped into five tiers based on their scores. The thresholds for these tiers are as follows:
Tier Score (%)First Tier 80-100
Second Tier 60-79.9Third Tier 40-59.9Fourth Tier 20-39.9
Bottom Tier 0-19.9
18 19
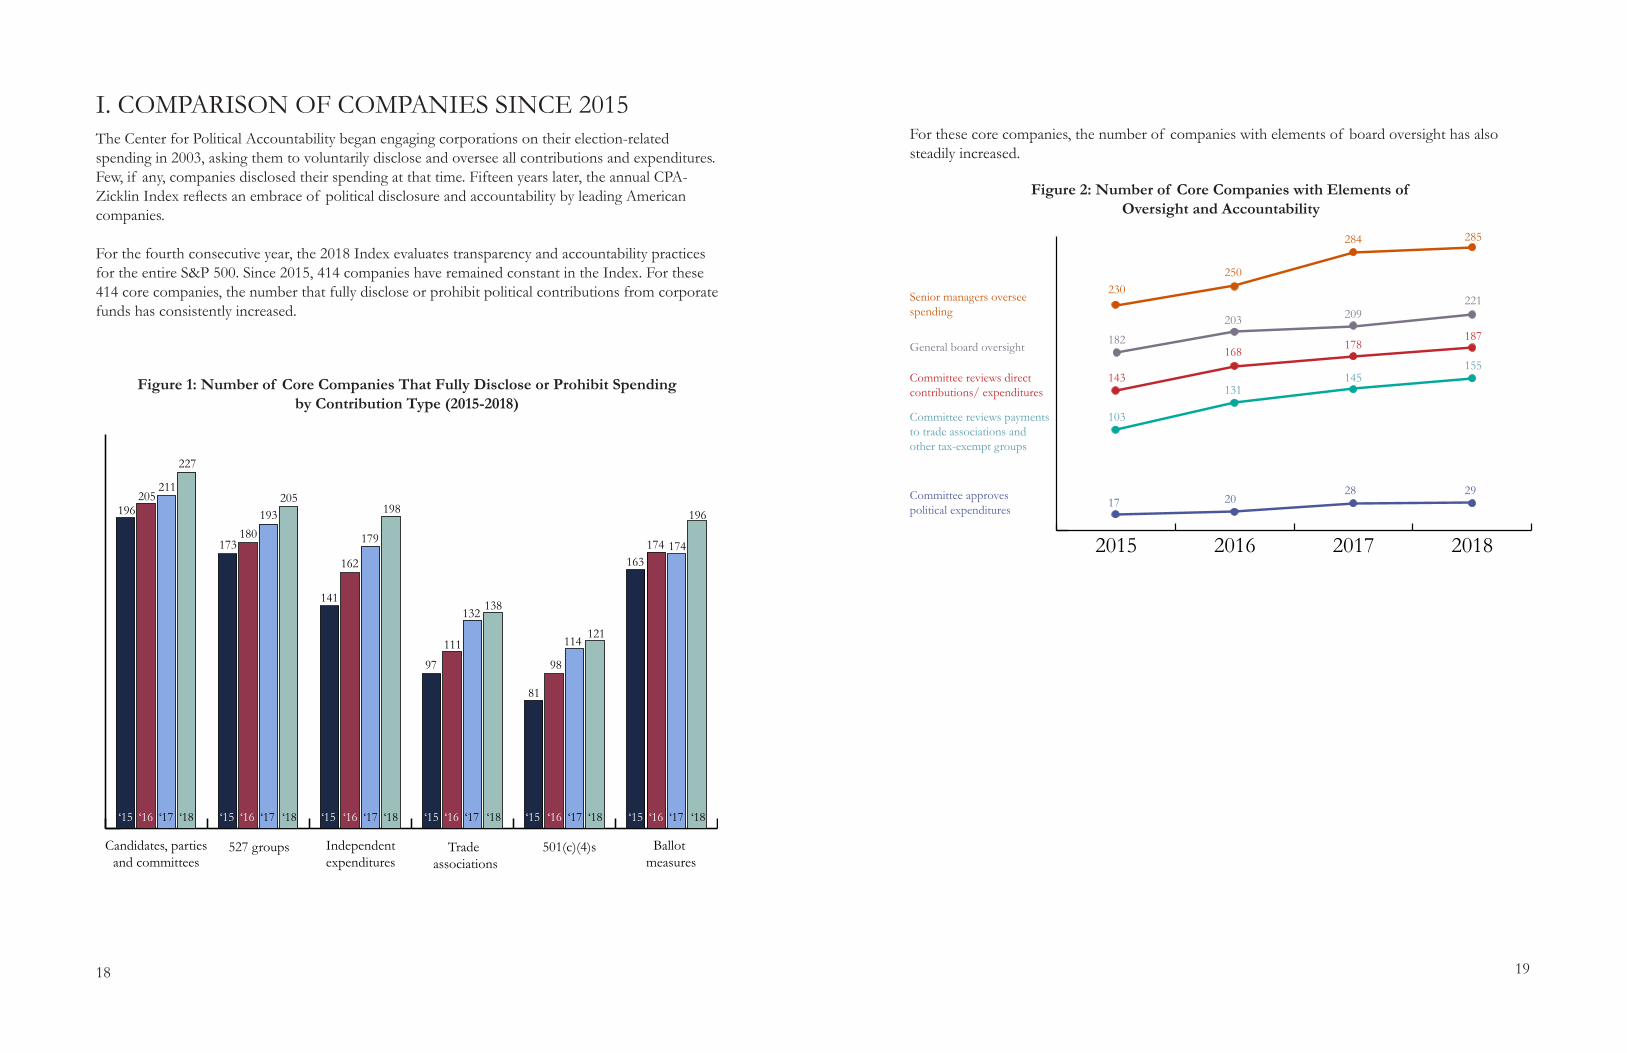
I. COMPARISON OF COMPANIES SINCE 2015The Center for Political Accountability began engaging corporations on their election-related spending in 2003, asking them to voluntarily disclose and oversee all contributions and expenditures. Few, if any, companies disclosed their spending at that time. Fifteen years later, the annual CPA-Zicklin Index reflects an embrace of political disclosure and accountability by leading American companies. For the fourth consecutive year, the 2018 Index evaluates transparency and accountability practices for the entire S&P 500. Since 2015, 414 companies have remained constant in the Index. For these 414 core companies, the number that fully disclose or prohibit political contributions from corporate funds has consistently increased.
Figure 1: Number of Core Companies That Fully Disclose or Prohibit Spendingby Contribution Type (2015-2018)
Ballot measures
501(c)(4)sTrade associations
Independent expenditures
527 groupsCandidates, partiesand committees
196205
‘15 ‘15 ‘15 ‘15 ‘15 ‘15‘16 ‘16 ‘16 ‘16 ‘16 ‘16‘17 ‘17 ‘17 ‘17 ‘17 ‘17‘18 ‘18 ‘18 ‘18 ‘18 ‘18
211
227
173180
193205
141
162
179
198
97
111
132 138
81
98
114 121
163174 174
196
Figure 2: Number of Core Companies with Elements of Oversight and Accountability
For these core companies, the number of companies with elements of board oversight has also steadily increased.
2018201720162015
Senior managers overseespending
General board oversight
Committee reviews directcontributions/ expenditures
Committee reviews paymentsto trade associations andother tax-exempt groups
Committee approves political expenditures
230250
284 285
182
203 209221
143
168 178187
103
131145
155
17 2028 29
20 21
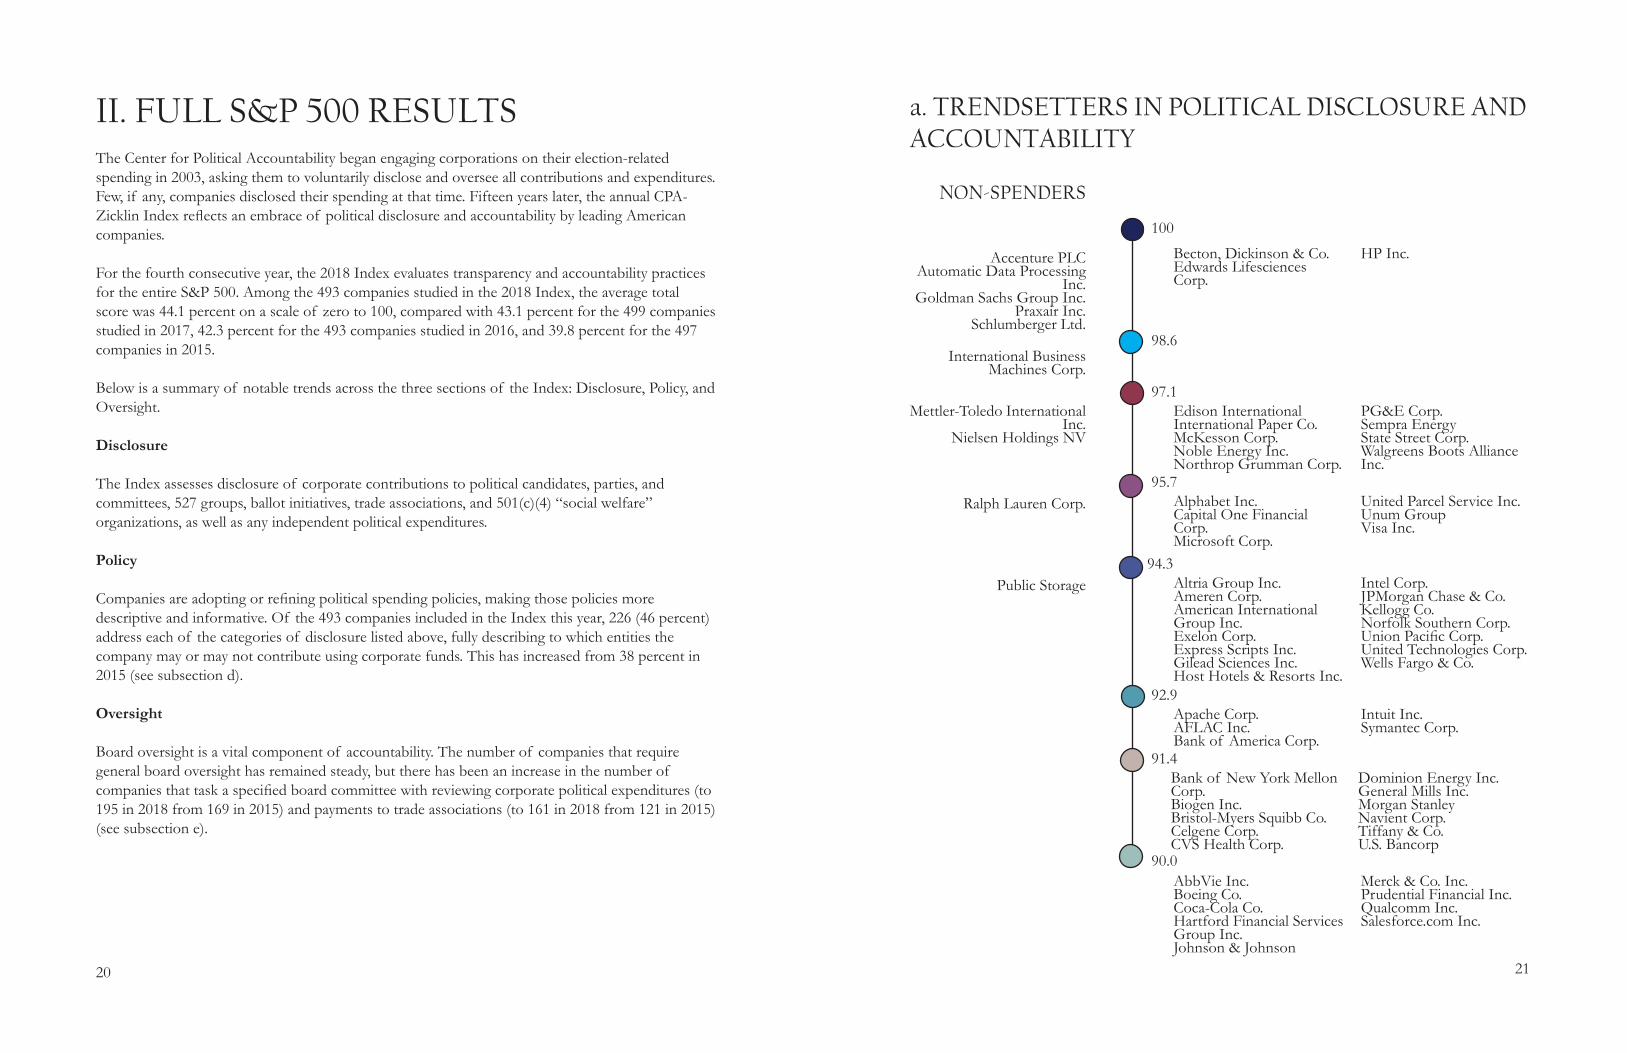
II. FULL S&P 500 RESULTSThe Center for Political Accountability began engaging corporations on their election-related spending in 2003, asking them to voluntarily disclose and oversee all contributions and expenditures. Few, if any, companies disclosed their spending at that time. Fifteen years later, the annual CPA-Zicklin Index reflects an embrace of political disclosure and accountability by leading American companies. For the fourth consecutive year, the 2018 Index evaluates transparency and accountability practices for the entire S&P 500. Among the 493 companies studied in the 2018 Index, the average total score was 44.1 percent on a scale of zero to 100, compared with 43.1 percent for the 499 companies studied in 2017, 42.3 percent for the 493 companies studied in 2016, and 39.8 percent for the 497 companies in 2015. Below is a summary of notable trends across the three sections of the Index: Disclosure, Policy, and Oversight. Disclosure The Index assesses disclosure of corporate contributions to political candidates, parties, and committees, 527 groups, ballot initiatives, trade associations, and 501(c)(4) “social welfare” organizations, as well as any independent political expenditures. Policy Companies are adopting or refining political spending policies, making those policies more descriptive and informative. Of the 493 companies included in the Index this year, 226 (46 percent) address each of the categories of disclosure listed above, fully describing to which entities the company may or may not contribute using corporate funds. This has increased from 38 percent in 2015 (see subsection d). Oversight Board oversight is a vital component of accountability. The number of companies that require general board oversight has remained steady, but there has been an increase in the number of companies that task a specified board committee with reviewing corporate political expenditures (to 195 in 2018 from 169 in 2015) and payments to trade associations (to 161 in 2018 from 121 in 2015) (see subsection e).
a. TRENDSETTERS IN POLITICAL DISCLOSURE AND ACCOUNTABILITY
Becton, Dickinson & Co. Edwards Lifesciences Corp.
HP Inc.
97.1Edison InternationalInternational Paper Co.McKesson Corp.Noble Energy Inc.Northrop Grumman Corp.
PG&E Corp.Sempra EnergyState Street Corp.Walgreens Boots Alliance Inc.
95.7Alphabet Inc.Capital One Financial Corp.Microsoft Corp.
United Parcel Service Inc. Unum GroupVisa Inc.
94.3Altria Group Inc.Ameren Corp.American International Group Inc. Exelon Corp.Express Scripts Inc.Gilead Sciences Inc.Host Hotels & Resorts Inc.
Intel Corp.JPMorgan Chase & Co.Kellogg Co.Norfolk Southern Corp. Union Pacific Corp.United Technologies Corp.Wells Fargo & Co.
Apache Corp.AFLAC Inc.Bank of America Corp.
Intuit Inc.Symantec Corp.
91.4Bank of New York Mellon Corp.Biogen Inc.Bristol-Myers Squibb Co.Celgene Corp.CVS Health Corp.
Dominion Energy Inc.General Mills Inc.Morgan StanleyNavient Corp.Tiffany & Co.U.S. Bancorp
90.0AbbVie Inc.Boeing Co.Coca-Cola Co.Hartford Financial Services Group Inc.Johnson & Johnson
Merck & Co. Inc.Prudential Financial Inc.Qualcomm Inc.Salesforce.com Inc.
92.9
Accenture PLCAutomatic Data Processing
Inc.Goldman Sachs Group Inc.
Praxair Inc.Schlumberger Ltd.
98.6International Business
Machines Corp.
100
Mettler-Toledo International Inc.
Nielsen Holdings NV
Ralph Lauren Corp.
Public Storage
NON-SPENDERS
22 23
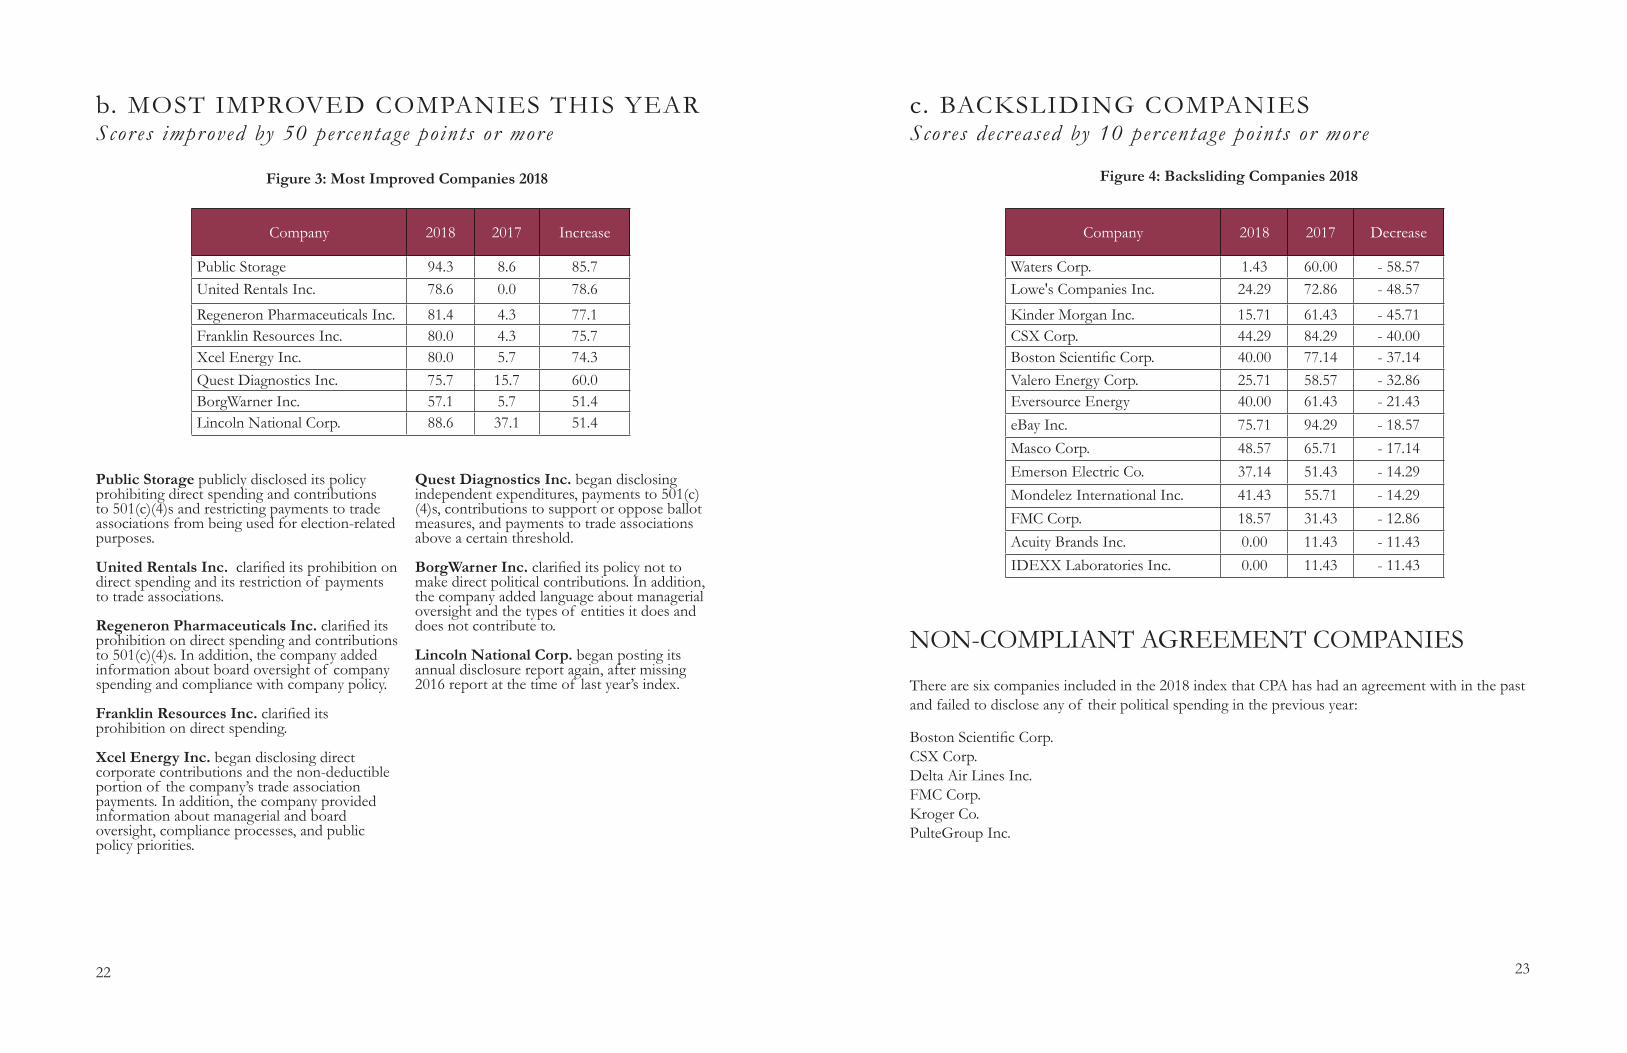
b. MOST IMPROVED COMPANIES THIS YEAR Scor es improved by 50 per centage points or mor e
Figure 3: Most Improved Companies 2018
Company 2018 2017 Increase
Public Storage 94.3 8.6 85.7 United Rentals Inc. 78.6 0.0 78.6
Regeneron Pharmaceuticals Inc. 81.4 4.3 77.1 Franklin Resources Inc. 80.0 4.3 75.7 Xcel Energy Inc. 80.0 5.7 74.3 Quest Diagnostics Inc. 75.7 15.7 60.0 BorgWarner Inc. 57.1 5.7 51.4 Lincoln National Corp. 88.6 37.1 51.4
Public Storage publicly disclosed its policy prohibiting direct spending and contributions to 501(c)(4)s and restricting payments to trade associations from being used for election-related purposes.
United Rentals Inc. clarified its prohibition on direct spending and its restriction of payments to trade associations.
Regeneron Pharmaceuticals Inc. clarified its prohibition on direct spending and contributions to 501(c)(4)s. In addition, the company added information about board oversight of company spending and compliance with company policy.
Franklin Resources Inc. clarified its prohibition on direct spending.
Xcel Energy Inc. began disclosing direct corporate contributions and the non-deductible portion of the company’s trade association payments. In addition, the company provided information about managerial and board oversight, compliance processes, and public policy priorities.
Quest Diagnostics Inc. began disclosing independent expenditures, payments to 501(c)(4)s, contributions to support or oppose ballot measures, and payments to trade associations above a certain threshold.
BorgWarner Inc. clarified its policy not to make direct political contributions. In addition, the company added language about managerial oversight and the types of entities it does and does not contribute to.
Lincoln National Corp. began posting its annual disclosure report again, after missing 2016 report at the time of last year’s index.
c. BACKSLIDING COMPANIESScor es decr eased by 10 per centage points or mor e
NON-COMPLIANT AGREEMENT COMPANIES
Company 2018 2017 Decrease
Waters Corp. 1.43 60.00 - 58.57Lowe's Companies Inc. 24.29 72.86 - 48.57
Kinder Morgan Inc. 15.71 61.43 - 45.71CSX Corp. 44.29 84.29 - 40.00Boston Scientific Corp. 40.00 77.14 - 37.14Valero Energy Corp. 25.71 58.57 - 32.86Eversource Energy 40.00 61.43 - 21.43eBay Inc. 75.71 94.29 - 18.57Masco Corp. 48.57 65.71 - 17.14Emerson Electric Co. 37.14 51.43 - 14.29Mondelez International Inc. 41.43 55.71 - 14.29FMC Corp. 18.57 31.43 - 12.86Acuity Brands Inc. 0.00 11.43 - 11.43IDEXX Laboratories Inc. 0.00 11.43 - 11.43
Figure 4: Backsliding Companies 2018
Boston Scientific Corp.CSX Corp.Delta Air Lines Inc. FMC Corp. Kroger Co.PulteGroup Inc.
There are six companies included in the 2018 index that CPA has had an agreement with in the past and failed to disclose any of their political spending in the previous year:
24 25
d. CORPORATE POLITICAL SPENDING DISCLOSURE
The Supreme Court strongly endorsed disclosure in Citizens United:
“With the advent of the Internet, prompt disclosure of expenditures can provide shareholders and
citizens with the information needed to hold corporations and elected officials accountable for their
positions and supporters. Shareholders can determine whether their corporation’s political speech
advances the corporation’s interests in making profits, and citizens can see whether elected officials
are ‘in the pocket’ of so-called moneyed interests.”19
19 Citizens United v. FEC, 558 U.S. 310, 352 (2010).
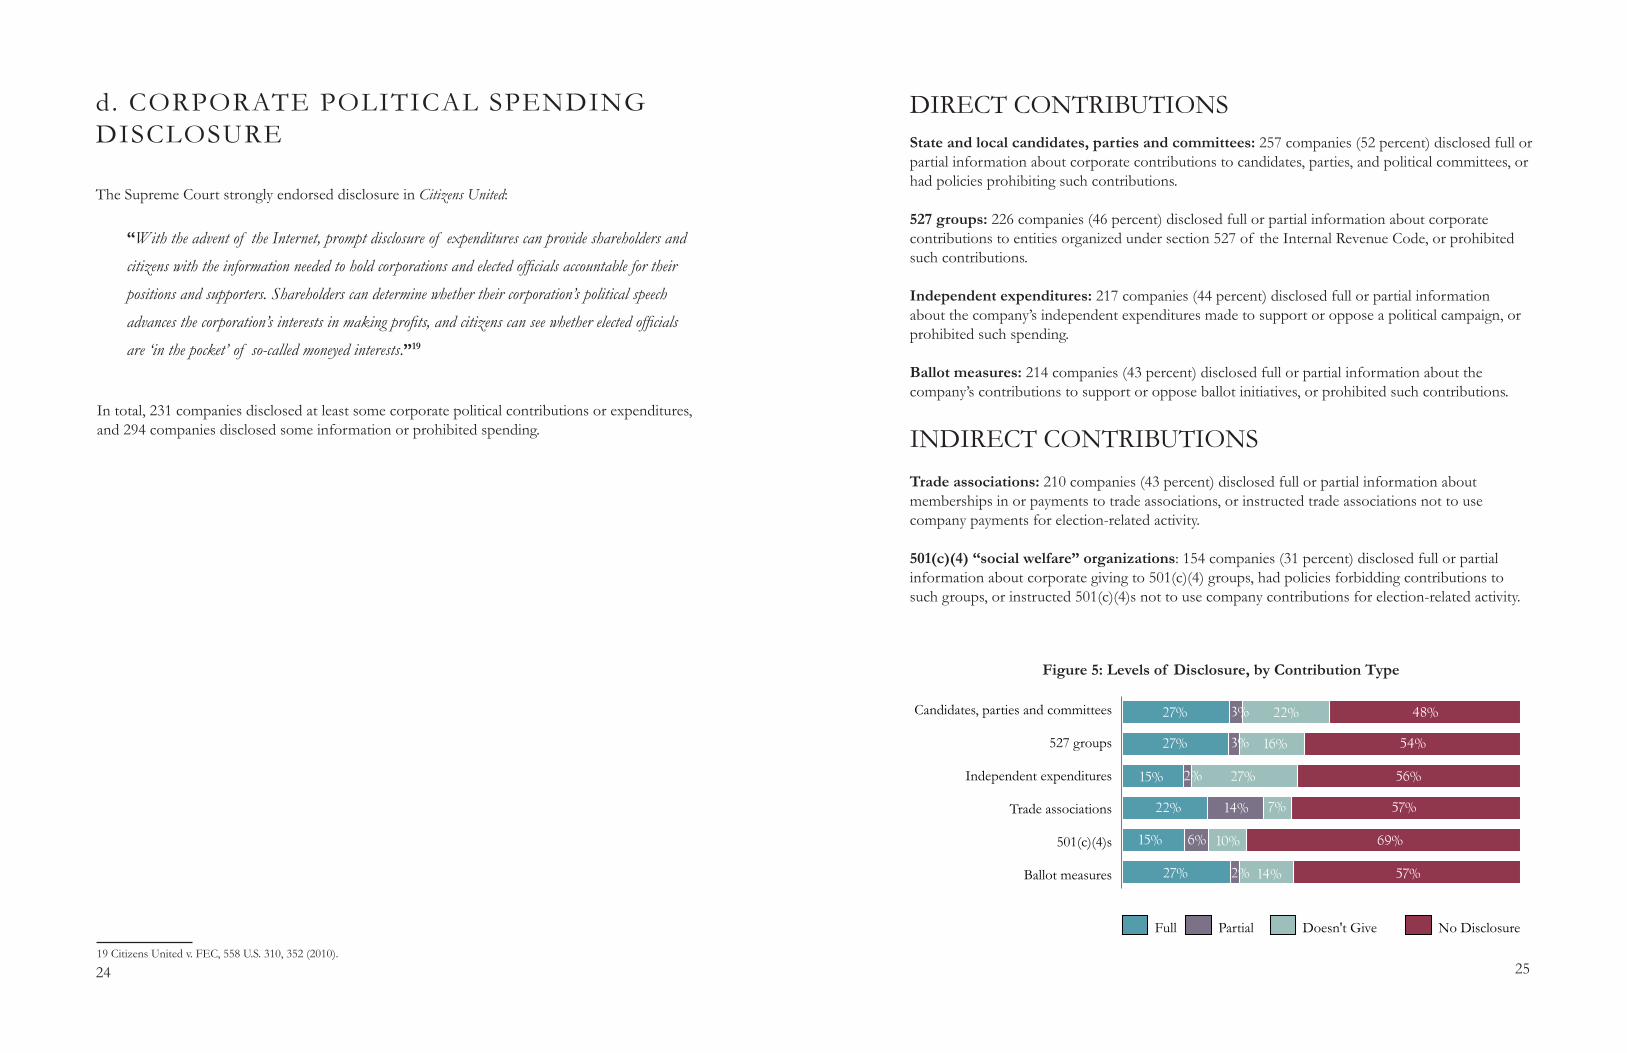
In total, 231 companies disclosed at least some corporate political contributions or expenditures, and 294 companies disclosed some information or prohibited spending.
Figure 5: Levels of Disclosure, by Contribution Type
DIRECT CONTRIBUTIONS
INDIRECT CONTRIBUTIONS
State and local candidates, parties and committees: 257 companies (52 percent) disclosed full or partial information about corporate contributions to candidates, parties, and political committees, or had policies prohibiting such contributions.
527 groups: 226 companies (46 percent) disclosed full or partial information about corporate contributions to entities organized under section 527 of the Internal Revenue Code, or prohibited such contributions.
Independent expenditures: 217 companies (44 percent) disclosed full or partial information about the company’s independent expenditures made to support or oppose a political campaign, or prohibited such spending.
Ballot measures: 214 companies (43 percent) disclosed full or partial information about the company’s contributions to support or oppose ballot initiatives, or prohibited such contributions.
Trade associations: 210 companies (43 percent) disclosed full or partial information about memberships in or payments to trade associations, or instructed trade associations not to use company payments for election-related activity.
501(c)(4) “social welfare” organizations: 154 companies (31 percent) disclosed full or partial information about corporate giving to 501(c)(4) groups, had policies forbidding contributions to such groups, or instructed 501(c)(4)s not to use company contributions for election-related activity.
27%
27%
15%
22%
15%
27%
3%
3%
2%
14%
6%
2%
22%
16%
27%
7%
10%
14%
48%
54%
56%
57%
69%
57%Ballot measures
501(c)(4)s
Trade associations
Independent expenditures
527 groups
Candidates, parties and committees
No DisclosureDoesn't GivePartialFull
26 27
Box 2. BEST PRACTICE EXAMPLES: DISCLOSING PAYMENTS TO TRADE ASSOCIATIONS
Companies that have demonstrated best practice provide clear language about what information they disclose and make timely reports. Most companies disclose the non-deductible portion (used for election-related or lobbying activities) of their payments, including dues and special assessments, to trade associations in a given year. Many companies use a threshold that triggers disclosure (e.g. $25,000 a year) to reduce the burden of reporting and focus on politically active trade associations.
Edwards Lifesciences Corp. “Edwards Lifesciences is a member of several industry and trade groups, including organizations that engage in lobbying activities. Edwards believes that membership in these organizations is consistent with the interests of patients, employees, the company and shareholders. The following table lists the amount of Edwards dues spent on federal-related lobbying activities. *Includes trade association memberships with total annual dues greater than $50,000.”
Microsoft Corp. “We publicly disclose and update annually a list of those trade associations to which Microsoft pays dues and makes other expenditures through our Legal & Community Affairs. Each year, Microsoft inquires and makes a reasonable effort to obtain from those associations where our dues and other expenditures total $25,000 or more and what portion of the company’s dues or payments were used for lobbying expenditures or political contributions. This information is publically disclosed and updated annually.”
Box 3. DISTINGUISHING 501(c)(4) ORGANIZATIONS THAT ENGAGE IN POLITICAL ACTIVITIES
Internal Revenue Code section 501(c)(4) exempts certain civic groups and nonprofit organizations whose primary purpose is to promote social welfare from federal income tax obligations. Even though such groups have always existed in varying forms, the U.S. Supreme Court’s decision in Citizens United gave rise to a new wave of 501(c)(4) groups that actively engage in election-related activities. Many of them make independent expenditures to advocate for a position in elections, and some raise secret funds for their sister super PACs.
In order to determine which 501(c)(4) contributions to disclose, companies can look at the organization’s activities to see if it engages in any political activity as defined by the Internal Revenue Service. Using current regulatory definitions, including the IRS’s definition of “political intervention,” political spending comprises:
• any direct or indirect contributions or expenditures on behalf of a candidate for public office or referenda, • any payments made to trade associations or tax-exempt entities used for intervening in a political campaign, and • any direct or indirect political expenditure that must be reported to the Federal Election Commission, Internal Revenue Service or state disclosure agency.
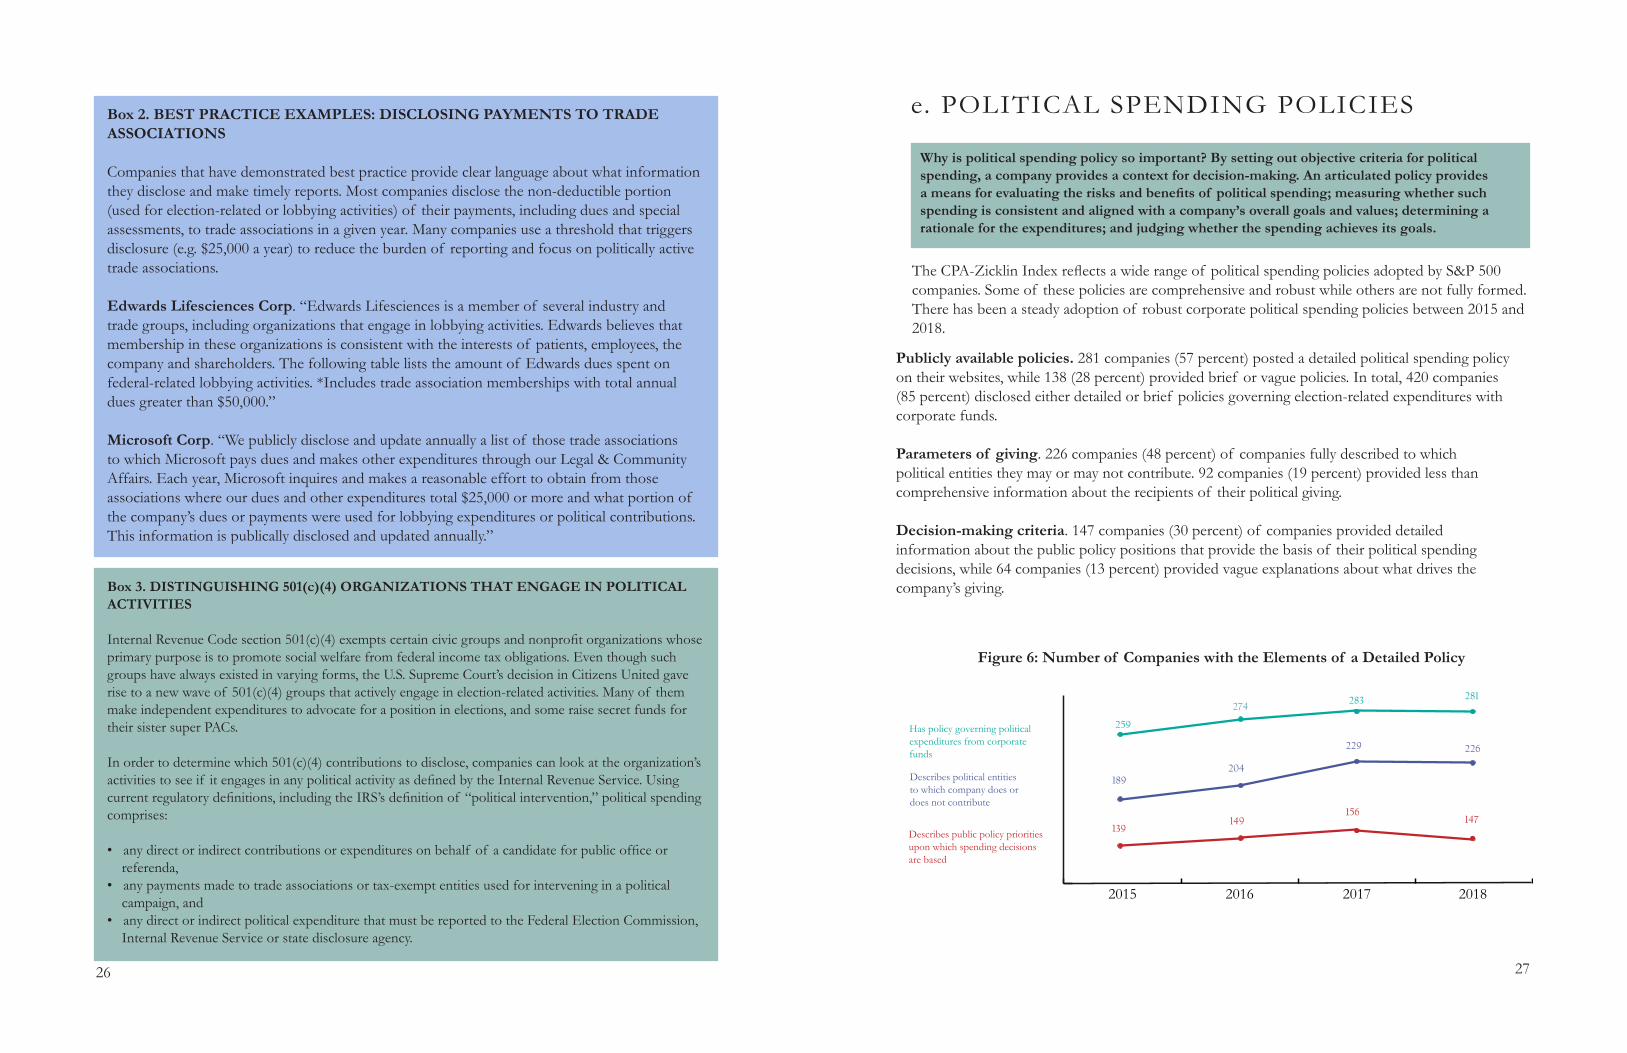
e. POLITICAL SPENDING POLICIES
Why is political spending policy so important? By setting out objective criteria for political spending, a company provides a context for decision-making. An articulated policy provides a means for evaluating the risks and benefits of political spending; measuring whether such spending is consistent and aligned with a company’s overall goals and values; determining a rationale for the expenditures; and judging whether the spending achieves its goals.
The CPA-Zicklin Index reflects a wide range of political spending policies adopted by S&P 500 companies. Some of these policies are comprehensive and robust while others are not fully formed. There has been a steady adoption of robust corporate political spending policies between 2015 and 2018.
Publicly available policies. 281 companies (57 percent) posted a detailed political spending policy on their websites, while 138 (28 percent) provided brief or vague policies. In total, 420 companies (85 percent) disclosed either detailed or brief policies governing election-related expenditures with corporate funds.
Parameters of giving. 226 companies (48 percent) of companies fully described to which political entities they may or may not contribute. 92 companies (19 percent) provided less than comprehensive information about the recipients of their political giving.
Decision-making criteria. 147 companies (30 percent) of companies provided detailed information about the public policy positions that provide the basis of their political spending decisions, while 64 companies (13 percent) provided vague explanations about what drives the company’s giving.
Figure 6: Number of Companies with the Elements of a Detailed Policy
Describes public policy priorities upon which spending decisions are based
Describes political entities to which company does or does not contribute
Has policy governing political expenditures from corporate funds
201720162015
259
274283
189204
229
139149
156
2018
147
226
281
28 29
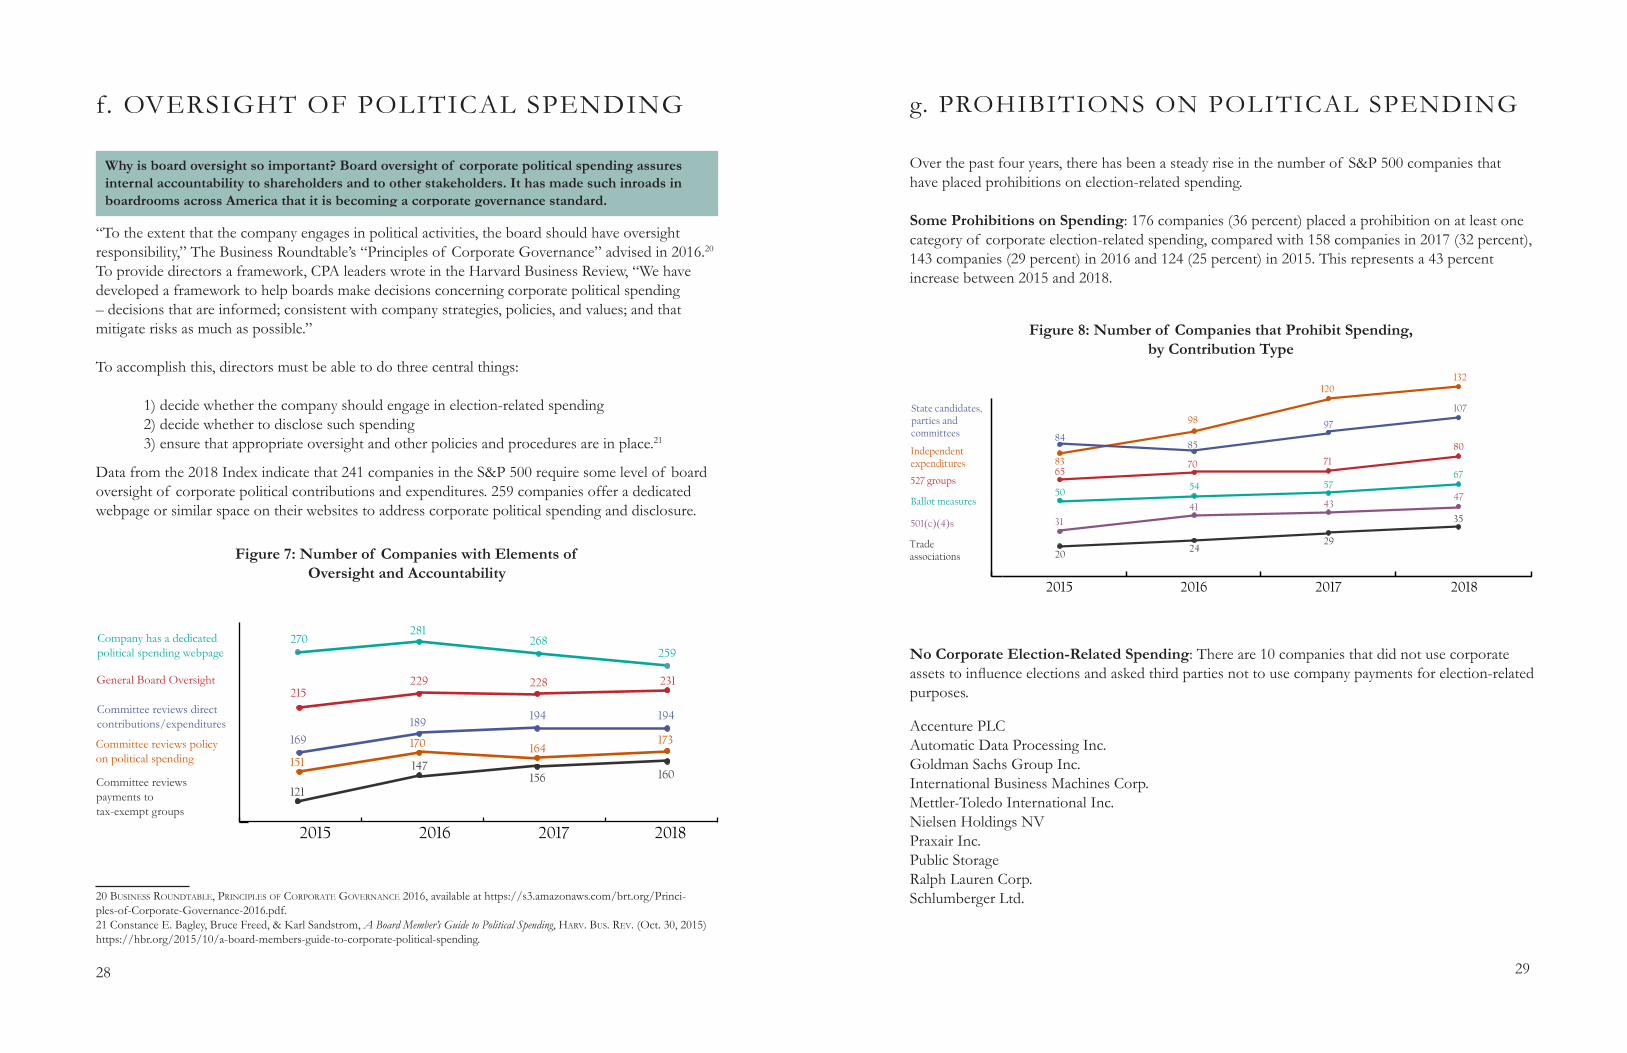
f. OVERSIGHT OF POLITICAL SPENDING
Why is board oversight so important? Board oversight of corporate political spending assures internal accountability to shareholders and to other stakeholders. It has made such inroads in boardrooms across America that it is becoming a corporate governance standard.
Data from the 2018 Index indicate that 241 companies in the S&P 500 require some level of board oversight of corporate political contributions and expenditures. 259 companies offer a dedicated webpage or similar space on their websites to address corporate political spending and disclosure.
“To the extent that the company engages in political activities, the board should have oversight responsibility,” The Business Roundtable’s “Principles of Corporate Governance” advised in 2016.20 To provide directors a framework, CPA leaders wrote in the Harvard Business Review, “We have developed a framework to help boards make decisions concerning corporate political spending – decisions that are informed; consistent with company strategies, policies, and values; and that mitigate risks as much as possible.”
To accomplish this, directors must be able to do three central things:
1) decide whether the company should engage in election-related spending 2) decide whether to disclose such spending 3) ensure that appropriate oversight and other policies and procedures are in place.21
Figure 7: Number of Companies with Elements of Oversight and Accountability
20 business rounDTable, prinCiples oF CorporaTe goVernanCe 2016, available at https://s3.amazonaws.com/brt.org/Princi-ples-of-Corporate-Governance-2016.pdf.21 Constance E. Bagley, Bruce Freed, & Karl Sandstrom, A Board Member’s Guide to Political Spending, harV. bus. reV. (Oct. 30, 2015) https://hbr.org/2015/10/a-board-members-guide-to-corporate-political-spending.
Company has a dedicated political spending webpage
Committee reviews payments to tax-exempt groups
Committee reviews direct contributions/expenditures
Committee reviews policy on political spending
General Board Oversight
201720162015
270281
268
215229 228
169
189194
151
170 164
121
147156
2018
259
231
194
173
160
g. PROHIBITIONS ON POLITICAL SPENDING
Over the past four years, there has been a steady rise in the number of S&P 500 companies that have placed prohibitions on election-related spending.
Some Prohibitions on Spending: 176 companies (36 percent) placed a prohibition on at least one category of corporate election-related spending, compared with 158 companies in 2017 (32 percent), 143 companies (29 percent) in 2016 and 124 (25 percent) in 2015. This represents a 43 percent increase between 2015 and 2018.
No Corporate Election-Related Spending: There are 10 companies that did not use corporate assets to influence elections and asked third parties not to use company payments for election-related purposes.
Accenture PLCAutomatic Data Processing Inc.Goldman Sachs Group Inc.International Business Machines Corp.Mettler-Toledo International Inc.Nielsen Holdings NVPraxair Inc.Public StorageRalph Lauren Corp.Schlumberger Ltd.
Figure 8: Number of Companies that Prohibit Spending, by Contribution Type
Ballot measures
501(c)(4)s
Trade associations
Independent expenditures
527 groups
State candidates, parties and committees
201720162015
83
98
120
8485
97
6570 71
5054 57
31
41 43
2024
29
2018
132
107
80
67
47
35
30 31
Restrictions on Indirect Political Spending: Companies engage in trade and industry associations for a variety of reasons and may not always agree with political positions taken by those associations. Likewise, company contributions to politically active 501(c)(4) organizations may be used for election-related purposes not supported by the company. To avoid such conflicts, some companies prohibit the recipients of company funds from using those funds for election-related purposes.
44 companies restricted payments to either trade associations or 501(c)(4)s:
AbbVie Inc.American International Group Inc.Aon PLCApple Inc.Archer Daniels Midland Co.Bank of America Corp.Bank of New York Mellon Corp.Becton, Dickinson and Co.Biogen Inc.Booking Holdings Inc.Cardinal Health Inc.Clorox Co.Colgate-Palmolive Co.Comcast Corp.
Costco Wholesale Corp.Danaher Corp.Edwards Lifesciences Corp.Estée Lauder Companies Inc.FedEx Corp.Fluor Corp.General Dynamics Corp.General Mills Inc.Hartford Financial Services Group Inc.Hormel Foods Corp.Host Hotels & Resorts Inc.Intercontinental Exchange Inc.Intuitive Surgical Inc.JPMorgan Chase & Co.Kraft Heinz Co.
McDonald’s Corp.Morgan StanleyNational Oilwell Varco Inc.Navient Corp.Newell Brands Inc.Nordstrom Inc.Regeneron Pharmaceuticals Inc.Regions Financial Corp.State Street Corp.SunTrust Banks Inc.Texas Instruments Inc.United Rentals Inc.United Technologies Corp.Unum GroupWestern Digital Corp.
19 companies restricted payments to both trade associations and 501(c)(4)s:
Accenture PLCAlphabet Inc.Automatic Data Processing Inc.Boeing Co.Cisco Systems Inc.Goldman Sachs Group Inc.HP Inc.
International Business Ma-chines Corp.International Paper Co.Kansas City SouthernMcKesson Corp.Mettler-Toledo International Inc.
Nielsen Holdings NVPraxair Inc.Public StorageRalph Lauren Corp.Schlumberger Ltd.Target Corp.Wells Fargo & Co.
Accenture PLCAFLAC Inc.Colgate-Palmolive Co.
Goldman Sachs Group Inc.Nielsen Holdings NVPraxair Inc.
United Technologies Corp.Vulcan Materials Co.
PAC Spending Only: 8 companies had policies whereby direct and indirect political expenditures may only be made through an employee-funded Political Action Committee (PAC).
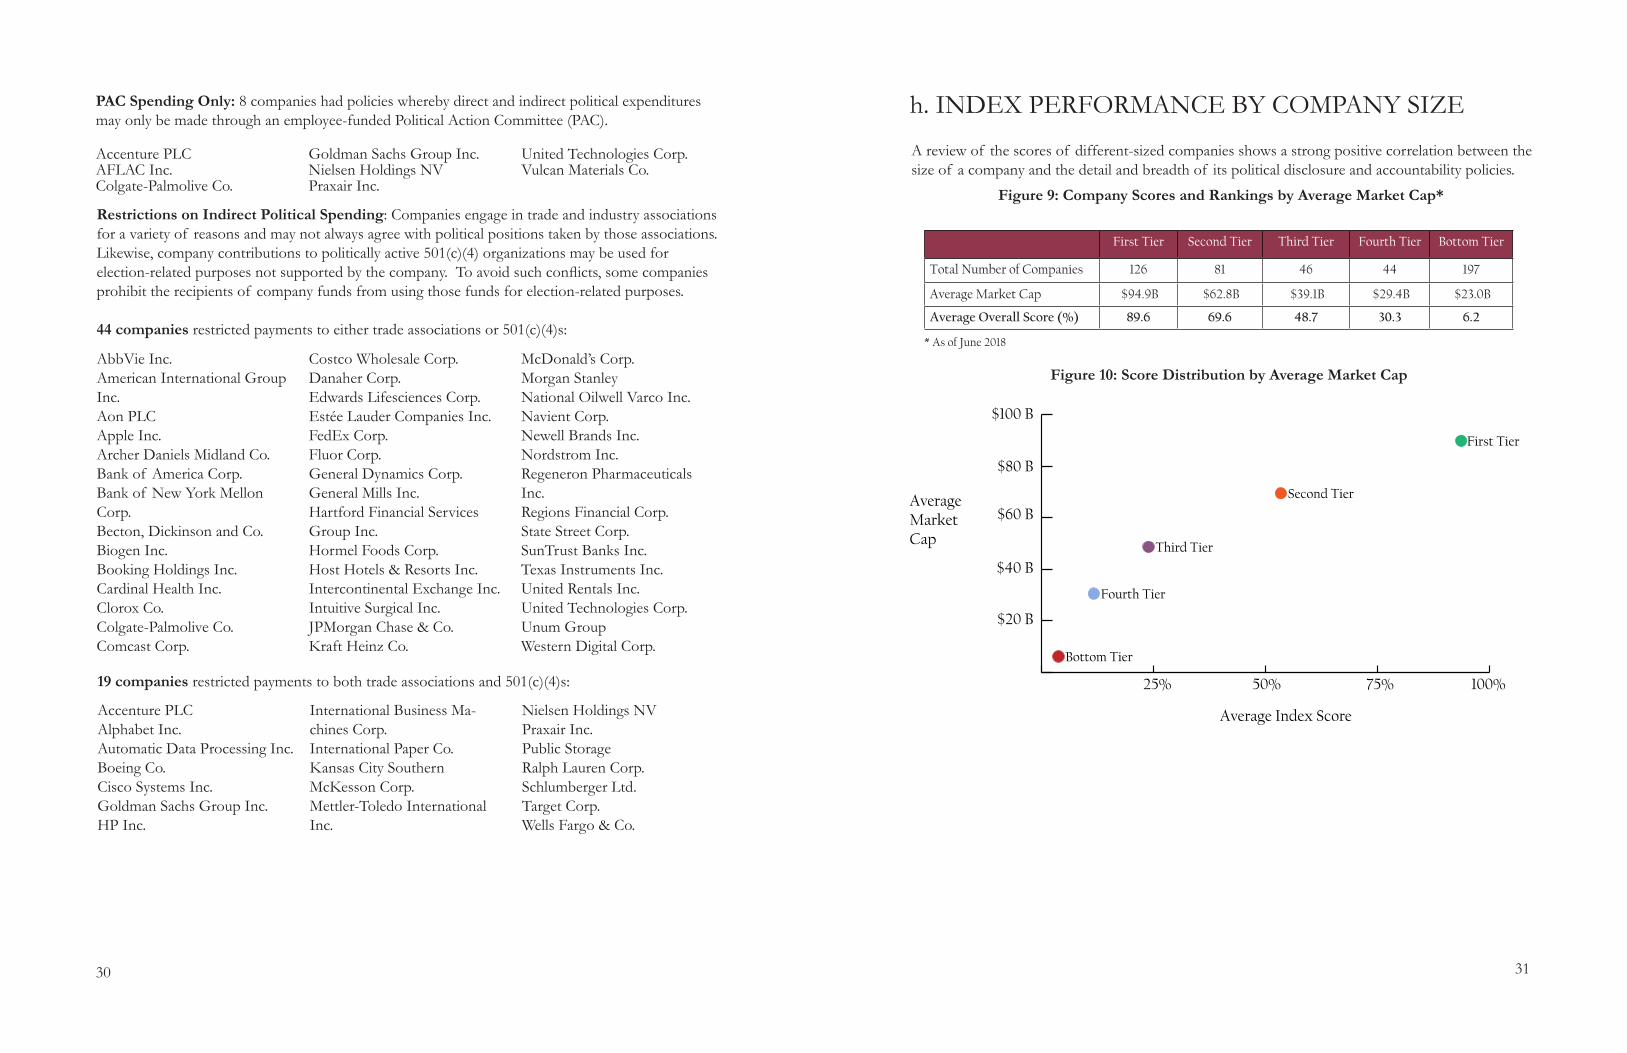
h. INDEX PERFORMANCE BY COMPANY SIZE
A review of the scores of different-sized companies shows a strong positive correlation between the size of a company and the detail and breadth of its political disclosure and accountability policies.
First Tier Second Tier Third Tier Fourth Tier Bottom Tier
Total Number of Companies 126 81 46 44 197
Average Market Cap $94.9B $62.8B $39.1B $29.4B $23.0B
Average Overall Score (%) 89.6 69.6 48.7 30.3 6.2
Figure 9: Company Scores and Rankings by Average Market Cap*
* As of June 2018
Figure 10: Score Distribution by Average Market Cap
First Tier
Second Tier
Third Tier
Fourth Tier
Bottom Tier
AverageMarket Cap
$20 B
$40 B
$60 B
$80 B
$100 B
Average Index Score
25% 50% 75% 100%
32 33
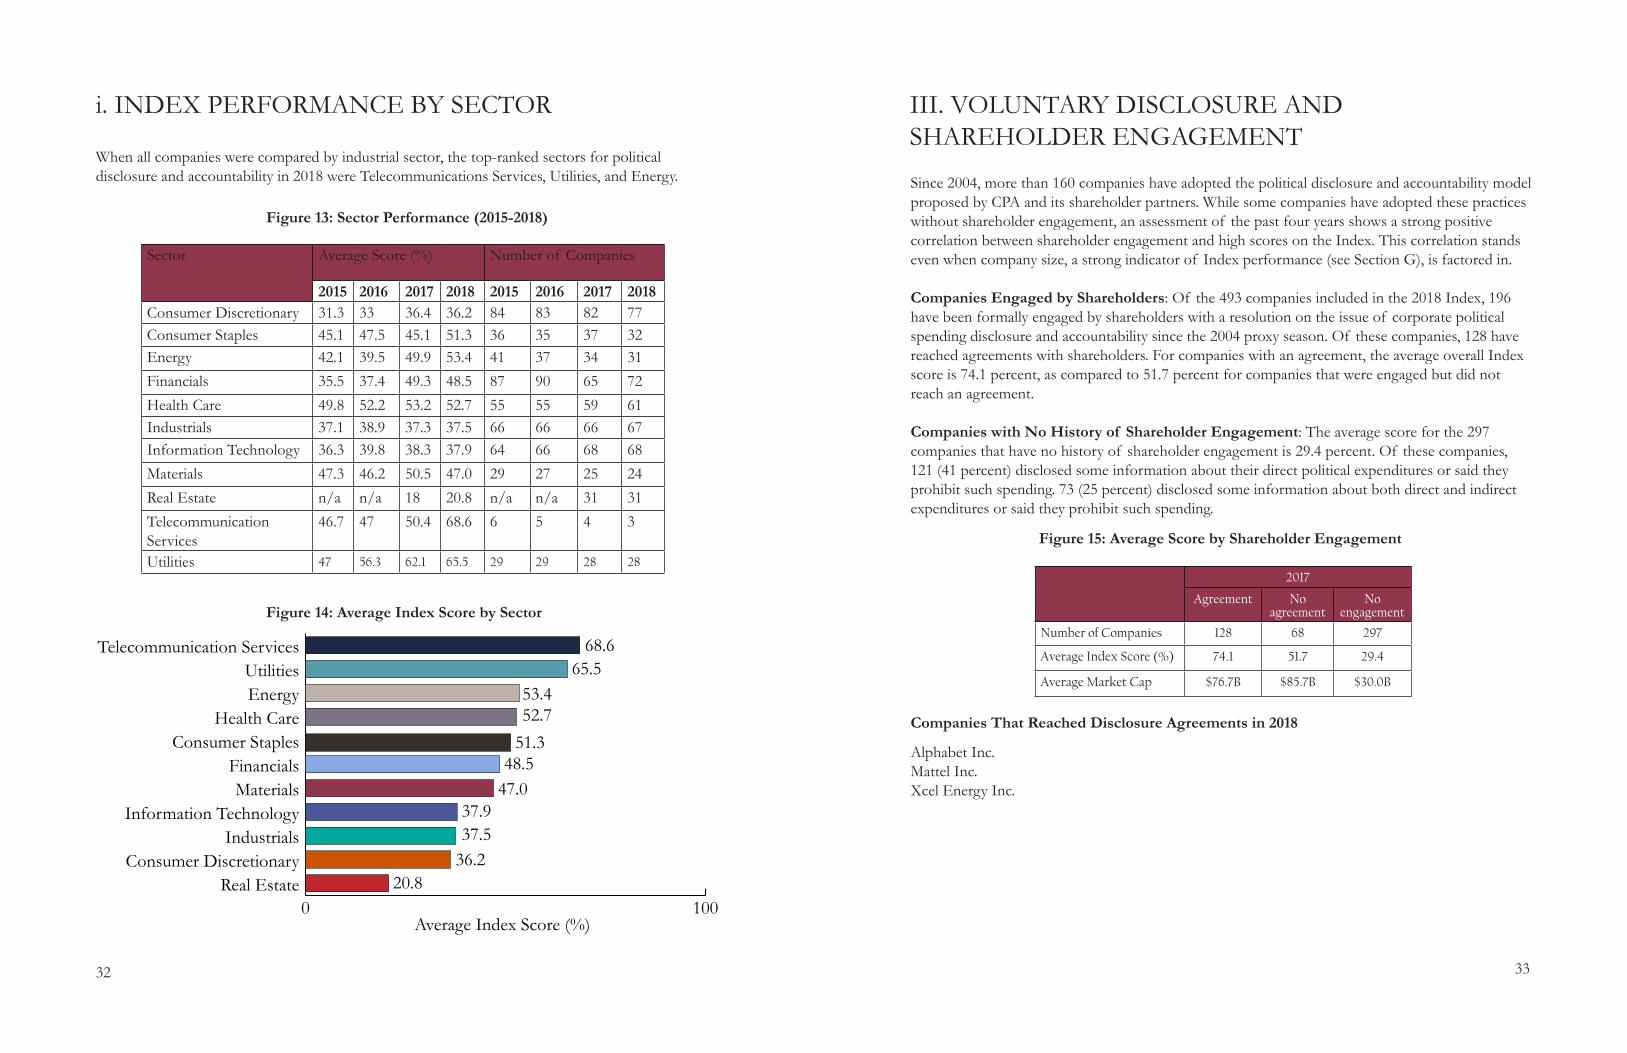
i. INDEX PERFORMANCE BY SECTOR
Sector Average Score (%) Number of Companies
2015 2016 2017 2018 2015 2016 2017 2018Consumer Discretionary 31.3 33 36.4 36.2 84 83 82 77Consumer Staples 45.1 47.5 45.1 51.3 36 35 37 32Energy 42.1 39.5 49.9 53.4 41 37 34 31Financials 35.5 37.4 49.3 48.5 87 90 65 72Health Care 49.8 52.2 53.2 52.7 55 55 59 61Industrials 37.1 38.9 37.3 37.5 66 66 66 67Information Technology 36.3 39.8 38.3 37.9 64 66 68 68Materials 47.3 46.2 50.5 47.0 29 27 25 24Real Estate n/a n/a 18 20.8 n/a n/a 31 31Telecommunication Services
46.7 47 50.4 68.6 6 5 4 3
Utilities 47 56.3 62.1 65.5 29 29 28 28
When all companies were compared by industrial sector, the top-ranked sectors for political disclosure and accountability in 2018 were Telecommunications Services, Utilities, and Energy.
Figure 13: Sector Performance (2015-2018)
Figure 14: Average Index Score by Sector
0 100Real Estate
Consumer DiscretionaryIndustrials
Information TechnologyMaterials
FinancialsConsumer Staples
Health CareEnergyUtilities
Telecommunication Services
Average Index Score (%)
68.665.5
53.452.7
51.348.5
47.037.937.5
36.220.8
III. VOLUNTARY DISCLOSURE AND SHAREHOLDER ENGAGEMENT
Since 2004, more than 160 companies have adopted the political disclosure and accountability model proposed by CPA and its shareholder partners. While some companies have adopted these practices without shareholder engagement, an assessment of the past four years shows a strong positive correlation between shareholder engagement and high scores on the Index. This correlation stands even when company size, a strong indicator of Index performance (see Section G), is factored in.
Companies Engaged by Shareholders: Of the 493 companies included in the 2018 Index, 196 have been formally engaged by shareholders with a resolution on the issue of corporate political spending disclosure and accountability since the 2004 proxy season. Of these companies, 128 have reached agreements with shareholders. For companies with an agreement, the average overall Index score is 74.1 percent, as compared to 51.7 percent for companies that were engaged but did not reach an agreement.
Companies with No History of Shareholder Engagement: The average score for the 297 companies that have no history of shareholder engagement is 29.4 percent. Of these companies, 121 (41 percent) disclosed some information about their direct political expenditures or said they prohibit such spending. 73 (25 percent) disclosed some information about both direct and indirect expenditures or said they prohibit such spending.
2017
Agreement No agreement
No engagement
Number of Companies 128 68 297
Average Index Score (%) 74.1 51.7 29.4
Average Market Cap $76.7B $85.7B $30.0B
Companies That Reached Disclosure Agreements in 2018
Figure 15: Average Score by Shareholder Engagement
Alphabet Inc. Mattel Inc.Xcel Energy Inc.
34 35
APPENDIX A: METHODOLOGY
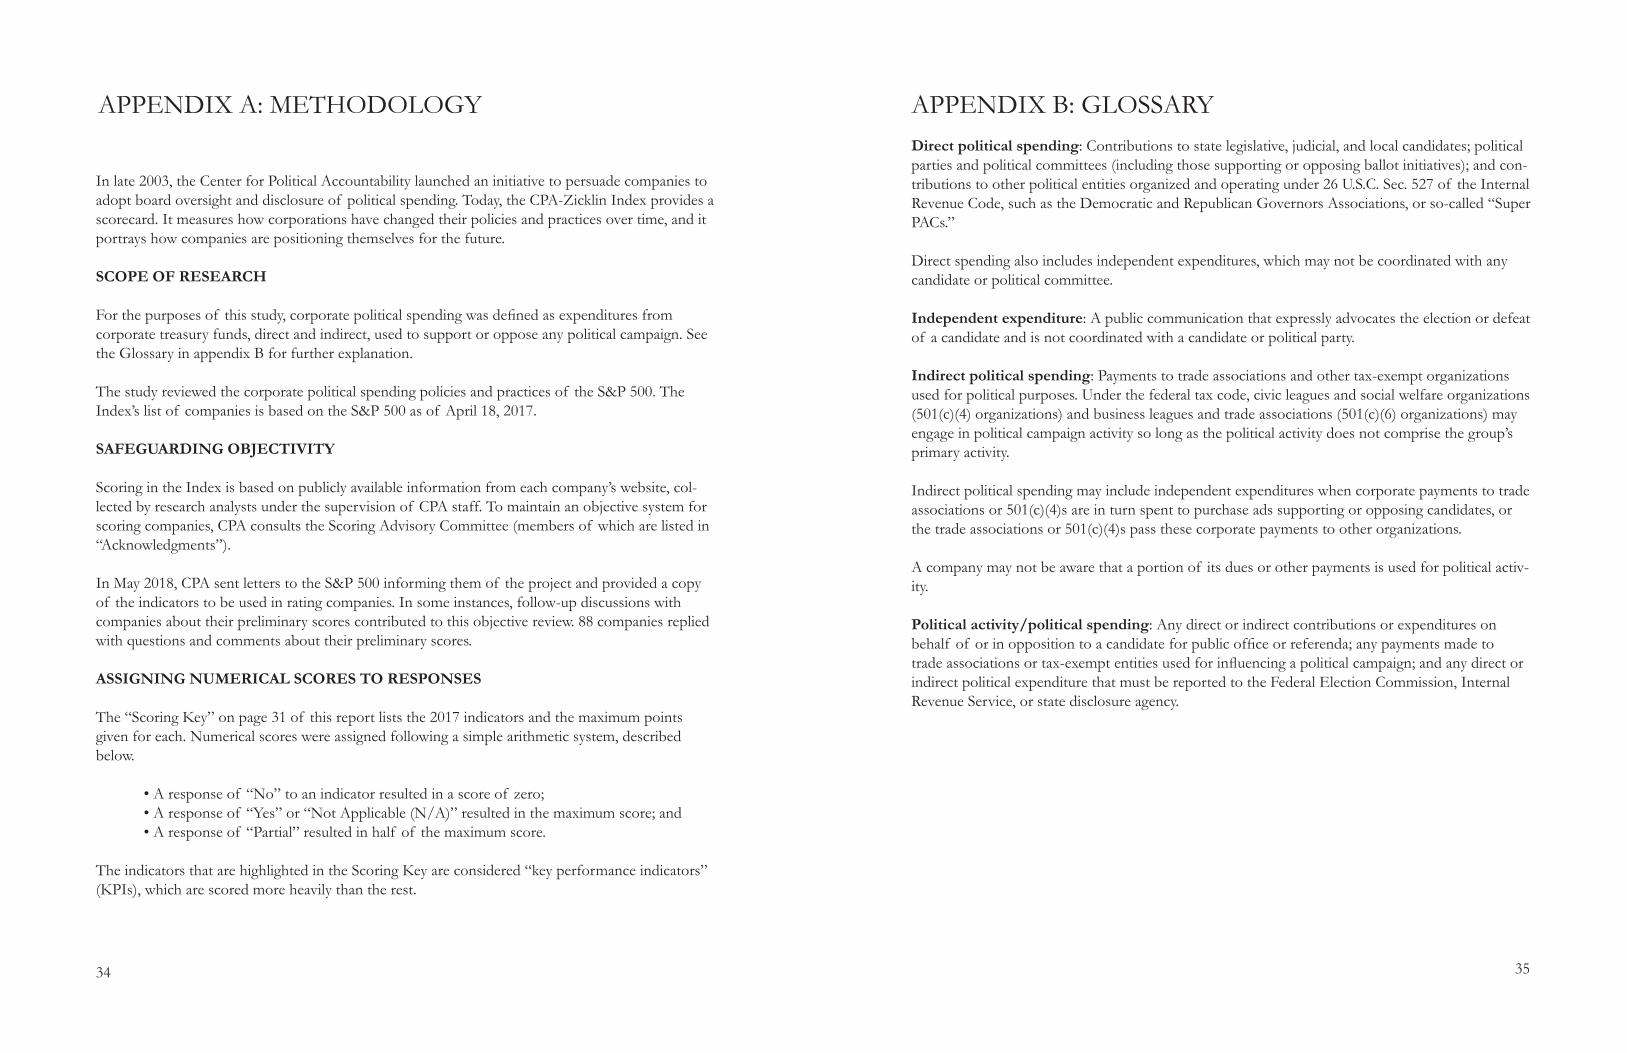
In late 2003, the Center for Political Accountability launched an initiative to persuade companies to adopt board oversight and disclosure of political spending. Today, the CPA-Zicklin Index provides a scorecard. It measures how corporations have changed their policies and practices over time, and it portrays how companies are positioning themselves for the future.
SCOPE OF RESEARCH
For the purposes of this study, corporate political spending was defined as expenditures from corporate treasury funds, direct and indirect, used to support or oppose any political campaign. See the Glossary in appendix B for further explanation.
The study reviewed the corporate political spending policies and practices of the S&P 500. The Index’s list of companies is based on the S&P 500 as of April 18, 2017.
SAFEGUARDING OBJECTIVITY
Scoring in the Index is based on publicly available information from each company’s website, col-lected by research analysts under the supervision of CPA staff. To maintain an objective system for scoring companies, CPA consults the Scoring Advisory Committee (members of which are listed in “Acknowledgments”).
In May 2018, CPA sent letters to the S&P 500 informing them of the project and provided a copy of the indicators to be used in rating companies. In some instances, follow-up discussions with companies about their preliminary scores contributed to this objective review. 88 companies replied with questions and comments about their preliminary scores.
ASSIGNING NUMERICAL SCORES TO RESPONSES
The “Scoring Key” on page 31 of this report lists the 2017 indicators and the maximum points given for each. Numerical scores were assigned following a simple arithmetic system, described below.
• A response of “No” to an indicator resulted in a score of zero; • A response of “Yes” or “Not Applicable (N/A)” resulted in the maximum score; and • A response of “Partial” resulted in half of the maximum score.
The indicators that are highlighted in the Scoring Key are considered “key performance indicators” (KPIs), which are scored more heavily than the rest.
APPENDIX B: GLOSSARYDirect political spending: Contributions to state legislative, judicial, and local candidates; political parties and political committees (including those supporting or opposing ballot initiatives); and con-tributions to other political entities organized and operating under 26 U.S.C. Sec. 527 of the Internal Revenue Code, such as the Democratic and Republican Governors Associations, or so-called “Super PACs.”
Direct spending also includes independent expenditures, which may not be coordinated with any candidate or political committee.
Independent expenditure: A public communication that expressly advocates the election or defeat of a candidate and is not coordinated with a candidate or political party.
Indirect political spending: Payments to trade associations and other tax-exempt organizations used for political purposes. Under the federal tax code, civic leagues and social welfare organizations (501(c)(4) organizations) and business leagues and trade associations (501(c)(6) organizations) may engage in political campaign activity so long as the political activity does not comprise the group’s primary activity.
Indirect political spending may include independent expenditures when corporate payments to trade associations or 501(c)(4)s are in turn spent to purchase ads supporting or opposing candidates, or the trade associations or 501(c)(4)s pass these corporate payments to other organizations.
A company may not be aware that a portion of its dues or other payments is used for political activ-ity.
Political activity/political spending: Any direct or indirect contributions or expenditures on behalf of or in opposition to a candidate for public office or referenda; any payments made to trade associations or tax-exempt entities used for influencing a political campaign; and any direct or indirect political expenditure that must be reported to the Federal Election Commission, Internal Revenue Service, or state disclosure agency.
36 37
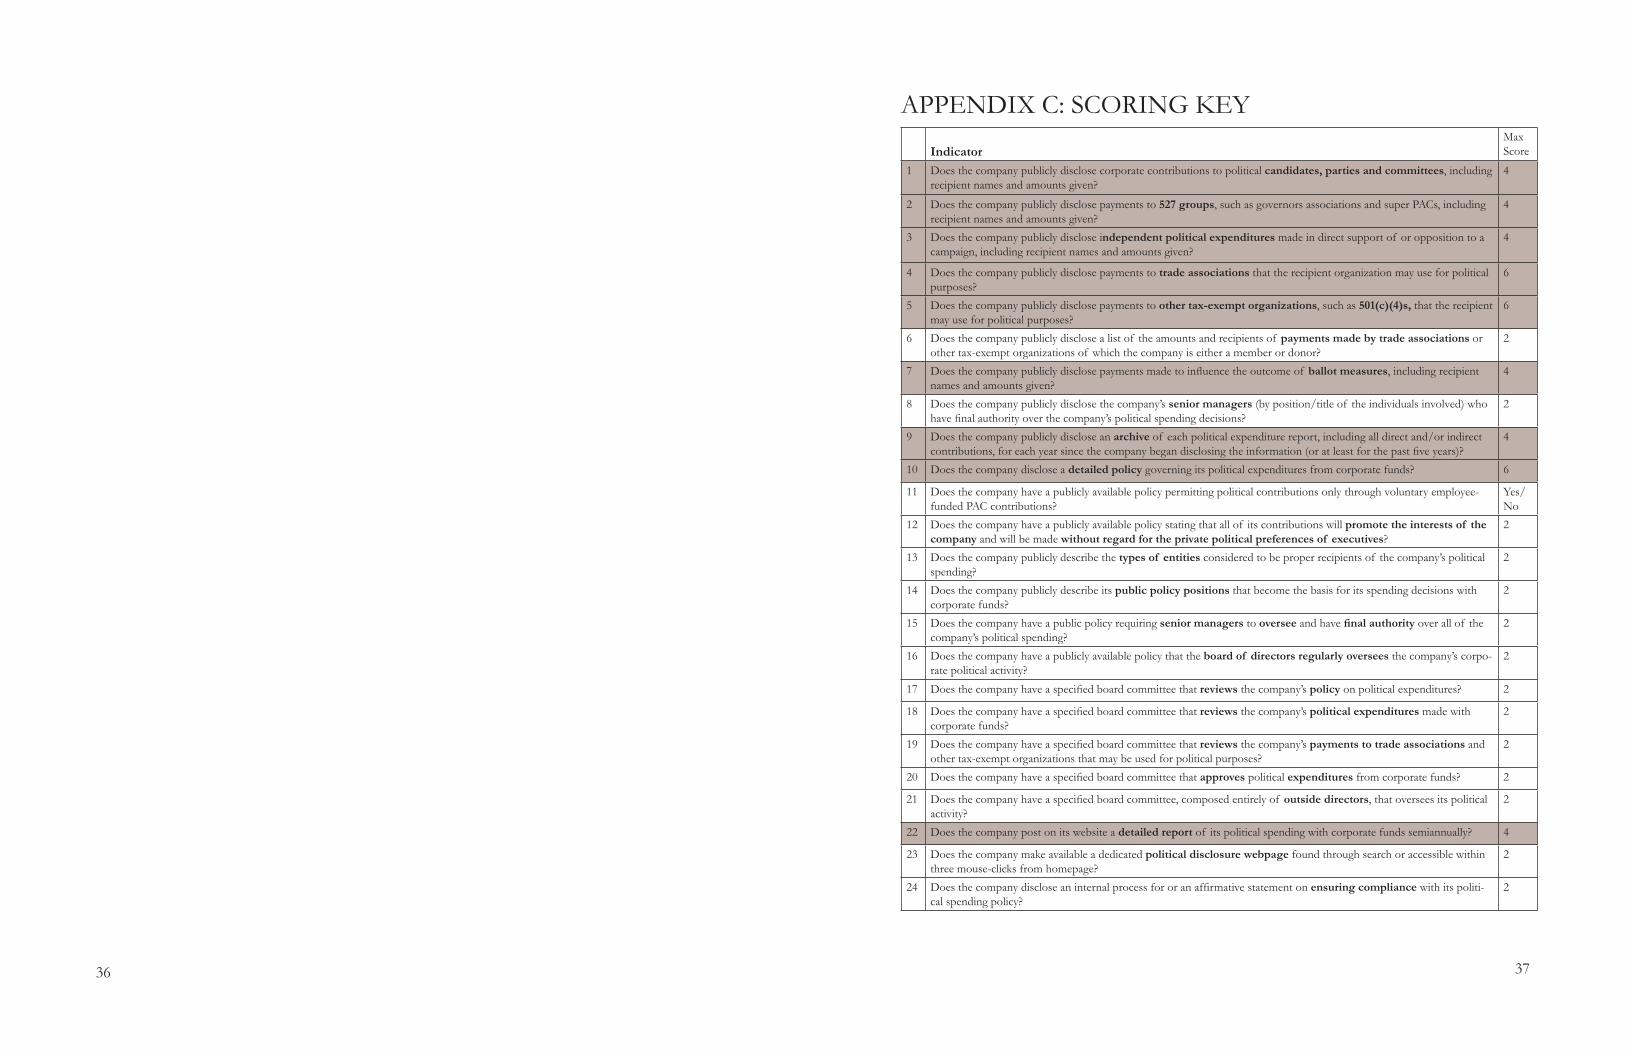
APPENDIX C: SCORING KEY
IndicatorMax Score
1 Does the company publicly disclose corporate contributions to political candidates, parties and committees, including recipient names and amounts given?
4
2 Does the company publicly disclose payments to 527 groups, such as governors associations and super PACs, including recipient names and amounts given?
4
3 Does the company publicly disclose independent political expenditures made in direct support of or opposition to a campaign, including recipient names and amounts given?
4
4 Does the company publicly disclose payments to trade associations that the recipient organization may use for political purposes?
6
5 Does the company publicly disclose payments to other tax-exempt organizations, such as 501(c)(4)s, that the recipient may use for political purposes?
6
6 Does the company publicly disclose a list of the amounts and recipients of payments made by trade associations or other tax-exempt organizations of which the company is either a member or donor?
2
7 Does the company publicly disclose payments made to influence the outcome of ballot measures, including recipient names and amounts given?
4
8 Does the company publicly disclose the company’s senior managers (by position/title of the individuals involved) who have final authority over the company’s political spending decisions?
2
9 Does the company publicly disclose an archive of each political expenditure report, including all direct and/or indirect contributions, for each year since the company began disclosing the information (or at least for the past five years)?
4
10 Does the company disclose a detailed policy governing its political expenditures from corporate funds? 6
11 Does the company have a publicly available policy permitting political contributions only through voluntary employee-funded PAC contributions?
Yes/No
12 Does the company have a publicly available policy stating that all of its contributions will promote the interests of the company and will be made without regard for the private political preferences of executives?
2
13 Does the company publicly describe the types of entities considered to be proper recipients of the company’s political spending?
2
14 Does the company publicly describe its public policy positions that become the basis for its spending decisions with corporate funds?
2
15 Does the company have a public policy requiring senior managers to oversee and have final authority over all of the company’s political spending?
2
16 Does the company have a publicly available policy that the board of directors regularly oversees the company’s corpo-rate political activity?
2
17 Does the company have a specified board committee that reviews the company’s policy on political expenditures? 2
18 Does the company have a specified board committee that reviews the company’s political expenditures made withcorporate funds?
2
19 Does the company have a specified board committee that reviews the company’s payments to trade associations and other tax-exempt organizations that may be used for political purposes?
2
20 Does the company have a specified board committee that approves political expenditures from corporate funds? 2
21 Does the company have a specified board committee, composed entirely of outside directors, that oversees its political activity?
2
22 Does the company post on its website a detailed report of its political spending with corporate funds semiannually? 4
23 Does the company make available a dedicated political disclosure webpage found through search or accessible within three mouse-clicks from homepage?
2
24 Does the company disclose an internal process for or an affirmative statement on ensuring compliance with its politi-cal spending policy?
2
38 39
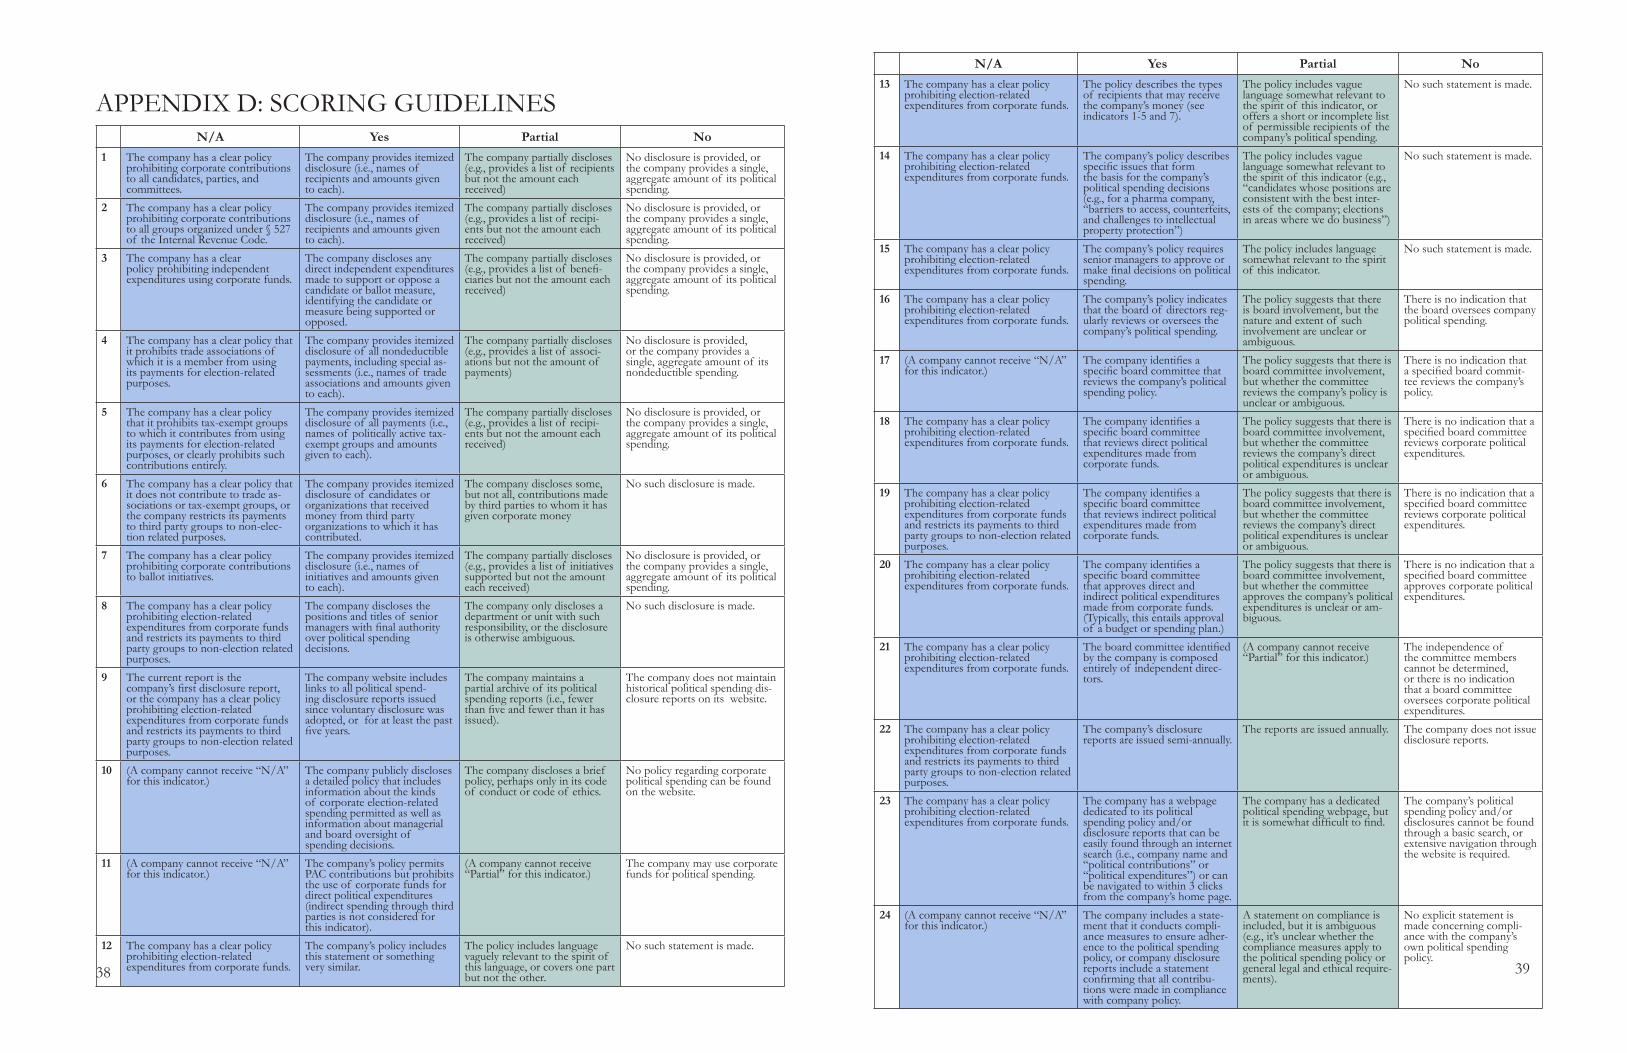
APPENDIX D: SCORING GUIDELINESN/A Yes Partial No
1 The company has a clear policy prohibiting corporate contributions to all candidates, parties, and committees.
The company provides itemized disclosure (i.e., names of recipients and amounts given to each).
The company partially discloses (e.g., provides a list of recipients but not the amount each received)
No disclosure is provided, or the company provides a single, aggregate amount of its political spending.
2 The company has a clear policy prohibiting corporate contributions to all groups organized under § 527 of the Internal Revenue Code.
The company provides itemized disclosure (i.e., names of recipients and amounts given to each).
The company partially discloses (e.g., provides a list of recipi-ents but not the amount each received)
No disclosure is provided, or the company provides a single, aggregate amount of its political spending.
3 The company has a clear policy prohibiting independent expenditures using corporate funds.
The company discloses any direct independent expenditures made to support or oppose a candidate or ballot measure, identifying the candidate or measure being supported or opposed.
The company partially discloses (e.g., provides a list of benefi-ciaries but not the amount each received)
No disclosure is provided, or the company provides a single, aggregate amount of its political spending.
4 The company has a clear policy that it prohibits trade associations of which it is a member from using its payments for election-related purposes.
The company provides itemized disclosure of all nondeductible payments, including special as-sessments (i.e., names of trade associations and amounts given to each).
The company partially discloses (e.g., provides a list of associ-ations but not the amount of payments)
No disclosure is provided, or the company provides a single, aggregate amount of its nondeductible spending.
5 The company has a clear policy that it prohibits tax-exempt groups to which it contributes from using its payments for election-related purposes, or clearly prohibits such contributions entirely.
The company provides itemized disclosure of all payments (i.e., names of politically active tax-exempt groups and amounts given to each).
The company partially discloses (e.g., provides a list of recipi-ents but not the amount each received)
No disclosure is provided, or the company provides a single, aggregate amount of its political spending.
6 The company has a clear policy that it does not contribute to trade as-sociations or tax-exempt groups, or the company restricts its payments to third party groups to non-elec-tion related purposes.
The company provides itemized disclosure of candidates or organizations that received money from third party organizations to which it has contributed.
The company discloses some, but not all, contributions made by third parties to whom it has given corporate money
No such disclosure is made.
7 The company has a clear policy prohibiting corporate contributions to ballot initiatives.
The company provides itemized disclosure (i.e., names of initiatives and amounts given to each).
The company partially discloses (e.g., provides a list of initiatives supported but not the amount each received)
No disclosure is provided, or the company provides a single, aggregate amount of its political spending.
8 The company has a clear policy prohibiting election-related expenditures from corporate funds and restricts its payments to third party groups to non-election related purposes.
The company discloses the positions and titles of senior managers with final authority over political spending decisions.
The company only discloses a department or unit with such responsibility, or the disclosure is otherwise ambiguous.
No such disclosure is made.
9 The current report is the company’s first disclosure report, or the company has a clear policy prohibiting election-related expenditures from corporate funds and restricts its payments to third party groups to non-election related purposes.
The company website includes links to all political spend-ing disclosure reports issued since voluntary disclosure was adopted, or for at least the past five years.
The company maintains a partial archive of its political spending reports (i.e., fewer than five and fewer than it has issued).
The company does not maintain historical political spending dis-closure reports on its website.
10 (A company cannot receive “N/A” for this indicator.)
The company publicly discloses a detailed policy that includes information about the kinds of corporate election-related spending permitted as well as information about managerial and board oversight of spending decisions.
The company discloses a brief policy, perhaps only in its code of conduct or code of ethics.
No policy regarding corporate political spending can be found on the website.
11 (A company cannot receive “N/A” for this indicator.)
The company’s policy permits PAC contributions but prohibits the use of corporate funds for direct political expenditures (indirect spending through third parties is not considered for this indicator).
(A company cannot receive “Partial” for this indicator.)
The company may use corporate funds for political spending.
12 The company has a clear policy prohibiting election-related expenditures from corporate funds.
The company’s policy includes this statement or something very similar.
The policy includes language vaguely relevant to the spirit of this language, or covers one part but not the other.
No such statement is made.
N/A Yes Partial No13 The company has a clear policy
prohibiting election-related expenditures from corporate funds.
The policy describes the types of recipients that may receive the company’s money (see indicators 1-5 and 7).
The policy includes vague language somewhat relevant to the spirit of this indicator, or offers a short or incomplete list of permissible recipients of the company’s political spending.
No such statement is made.
14 The company has a clear policy prohibiting election-related expenditures from corporate funds.
The company’s policy describes specific issues that form the basis for the company’s political spending decisions (e.g., for a pharma company, “barriers to access, counterfeits, and challenges to intellectual property protection”)
The policy includes vague language somewhat relevant to the spirit of this indicator (e.g., “candidates whose positions are consistent with the best inter-ests of the company; elections in areas where we do business”)
No such statement is made.
15 The company has a clear policy prohibiting election-related expenditures from corporate funds.
The company’s policy requires senior managers to approve or make final decisions on political spending.
The policy includes language somewhat relevant to the spirit of this indicator.
No such statement is made.
16 The company has a clear policy prohibiting election-related expenditures from corporate funds.
The company’s policy indicates that the board of directors reg-ularly reviews or oversees the company’s political spending.
The policy suggests that there is board involvement, but the nature and extent of such involvement are unclear or ambiguous.
There is no indication that the board oversees company political spending.
17 (A company cannot receive “N/A” for this indicator.)
The company identifies a specific board committee that reviews the company’s political spending policy.
The policy suggests that there is board committee involvement, but whether the committee reviews the company’s policy is unclear or ambiguous.
There is no indication that a specified board commit-tee reviews the company’s policy.
18 The company has a clear policy prohibiting election-related expenditures from corporate funds.
The company identifies a specific board committee that reviews direct political expenditures made from corporate funds.
The policy suggests that there is board committee involvement, but whether the committee reviews the company’s direct political expenditures is unclear or ambiguous.
There is no indication that a specified board committee reviews corporate political expenditures.
19 The company has a clear policy prohibiting election-related expenditures from corporate funds and restricts its payments to third party groups to non-election related purposes.
The company identifies a specific board committee that reviews indirect political expenditures made from corporate funds.
The policy suggests that there is board committee involvement, but whether the committee reviews the company’s direct political expenditures is unclear or ambiguous.
There is no indication that a specified board committee reviews corporate political expenditures.
20 The company has a clear policy prohibiting election-related expenditures from corporate funds.
The company identifies a specific board committee that approves direct and indirect political expenditures made from corporate funds. (Typically, this entails approval of a budget or spending plan.)
The policy suggests that there is board committee involvement, but whether the committee approves the company’s political expenditures is unclear or am-biguous.
There is no indication that a specified board committee approves corporate political expenditures.
21 The company has a clear policy prohibiting election-related expenditures from corporate funds.
The board committee identified by the company is composed entirely of independent direc-tors.
(A company cannot receive “Partial” for this indicator.)
The independence of the committee members cannot be determined, or there is no indication that a board committee oversees corporate political expenditures.
22 The company has a clear policy prohibiting election-related expenditures from corporate funds and restricts its payments to third party groups to non-election related purposes.
The company’s disclosure reports are issued semi-annually.
The reports are issued annually. The company does not issue disclosure reports.
23 The company has a clear policy prohibiting election-related expenditures from corporate funds.
The company has a webpage dedicated to its political spending policy and/or disclosure reports that can be easily found through an internet search (i.e., company name and “political contributions” or “political expenditures”) or can be navigated to within 3 clicks from the company’s home page.
The company has a dedicated political spending webpage, but it is somewhat difficult to find.
The company’s political spending policy and/or disclosures cannot be found through a basic search, or extensive navigation through the website is required.
24 (A company cannot receive “N/A” for this indicator.)
The company includes a state-ment that it conducts compli-ance measures to ensure adher-ence to the political spending policy, or company disclosure reports include a statement confirming that all contribu-tions were made in compliance with company policy.
A statement on compliance is included, but it is ambiguous (e.g., it’s unclear whether the compliance measures apply to the political spending policy or general legal and ethical require-ments).
No explicit statement is made concerning compli-ance with the company’s own political spending policy.
4041
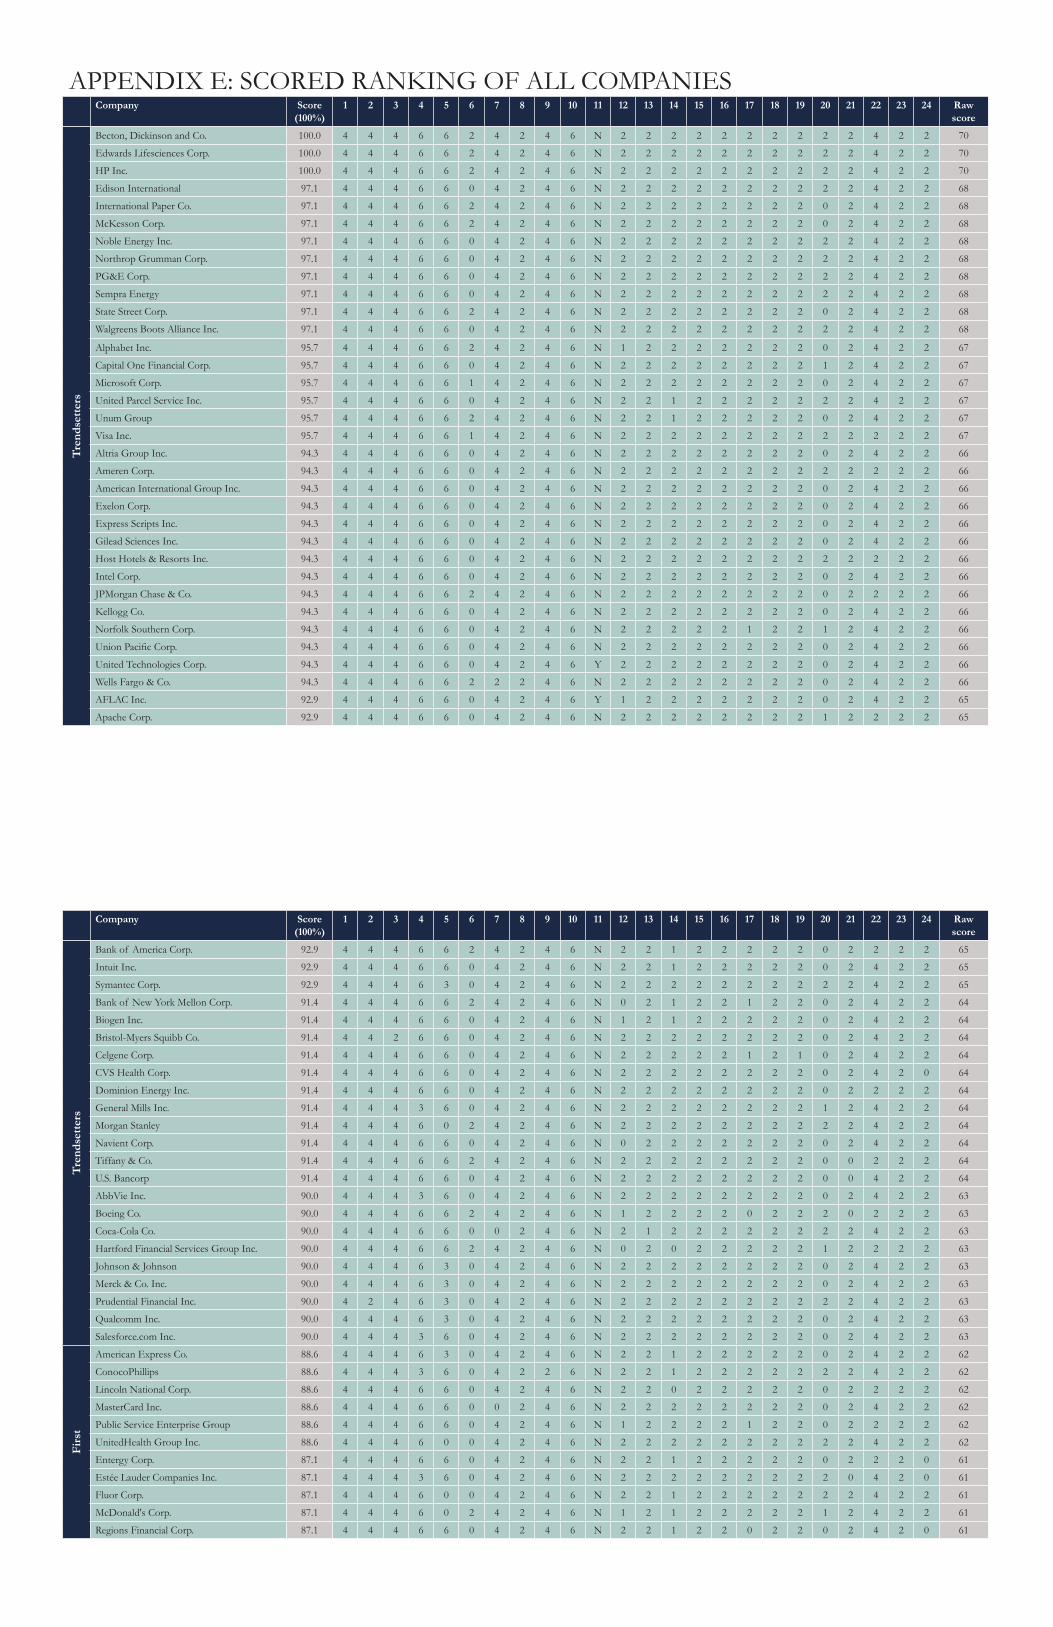
Company Score(100%)
1 2 3 4 5 6 7 8 9 10 11 12 13 14 15 16 17 18 19 20 21 22 23 24 Raw score
Tren
dset
ters
Becton, Dickinson and Co. 100.0 4 4 4 6 6 2 4 2 4 6 N 2 2 2 2 2 2 2 2 2 2 4 2 2 70
Edwards Lifesciences Corp. 100.0 4 4 4 6 6 2 4 2 4 6 N 2 2 2 2 2 2 2 2 2 2 4 2 2 70
HP Inc. 100.0 4 4 4 6 6 2 4 2 4 6 N 2 2 2 2 2 2 2 2 2 2 4 2 2 70
Edison International 97.1 4 4 4 6 6 0 4 2 4 6 N 2 2 2 2 2 2 2 2 2 2 4 2 2 68
International Paper Co. 97.1 4 4 4 6 6 2 4 2 4 6 N 2 2 2 2 2 2 2 2 0 2 4 2 2 68
McKesson Corp. 97.1 4 4 4 6 6 2 4 2 4 6 N 2 2 2 2 2 2 2 2 0 2 4 2 2 68
Noble Energy Inc. 97.1 4 4 4 6 6 0 4 2 4 6 N 2 2 2 2 2 2 2 2 2 2 4 2 2 68
Northrop Grumman Corp. 97.1 4 4 4 6 6 0 4 2 4 6 N 2 2 2 2 2 2 2 2 2 2 4 2 2 68
PG&E Corp. 97.1 4 4 4 6 6 0 4 2 4 6 N 2 2 2 2 2 2 2 2 2 2 4 2 2 68
Sempra Energy 97.1 4 4 4 6 6 0 4 2 4 6 N 2 2 2 2 2 2 2 2 2 2 4 2 2 68
State Street Corp. 97.1 4 4 4 6 6 2 4 2 4 6 N 2 2 2 2 2 2 2 2 0 2 4 2 2 68
Walgreens Boots Alliance Inc. 97.1 4 4 4 6 6 0 4 2 4 6 N 2 2 2 2 2 2 2 2 2 2 4 2 2 68
Alphabet Inc. 95.7 4 4 4 6 6 2 4 2 4 6 N 1 2 2 2 2 2 2 2 0 2 4 2 2 67
Capital One Financial Corp. 95.7 4 4 4 6 6 0 4 2 4 6 N 2 2 2 2 2 2 2 2 1 2 4 2 2 67
Microsoft Corp. 95.7 4 4 4 6 6 1 4 2 4 6 N 2 2 2 2 2 2 2 2 0 2 4 2 2 67
United Parcel Service Inc. 95.7 4 4 4 6 6 0 4 2 4 6 N 2 2 1 2 2 2 2 2 2 2 4 2 2 67
Unum Group 95.7 4 4 4 6 6 2 4 2 4 6 N 2 2 1 2 2 2 2 2 0 2 4 2 2 67
Visa Inc. 95.7 4 4 4 6 6 1 4 2 4 6 N 2 2 2 2 2 2 2 2 2 2 2 2 2 67
Altria Group Inc. 94.3 4 4 4 6 6 0 4 2 4 6 N 2 2 2 2 2 2 2 2 0 2 4 2 2 66
Ameren Corp. 94.3 4 4 4 6 6 0 4 2 4 6 N 2 2 2 2 2 2 2 2 2 2 2 2 2 66
American International Group Inc. 94.3 4 4 4 6 6 0 4 2 4 6 N 2 2 2 2 2 2 2 2 0 2 4 2 2 66
Exelon Corp. 94.3 4 4 4 6 6 0 4 2 4 6 N 2 2 2 2 2 2 2 2 0 2 4 2 2 66
Express Scripts Inc. 94.3 4 4 4 6 6 0 4 2 4 6 N 2 2 2 2 2 2 2 2 0 2 4 2 2 66
Gilead Sciences Inc. 94.3 4 4 4 6 6 0 4 2 4 6 N 2 2 2 2 2 2 2 2 0 2 4 2 2 66
Host Hotels & Resorts Inc. 94.3 4 4 4 6 6 0 4 2 4 6 N 2 2 2 2 2 2 2 2 2 2 2 2 2 66
Intel Corp. 94.3 4 4 4 6 6 0 4 2 4 6 N 2 2 2 2 2 2 2 2 0 2 4 2 2 66
JPMorgan Chase & Co. 94.3 4 4 4 6 6 2 4 2 4 6 N 2 2 2 2 2 2 2 2 0 2 2 2 2 66
Kellogg Co. 94.3 4 4 4 6 6 0 4 2 4 6 N 2 2 2 2 2 2 2 2 0 2 4 2 2 66
Norfolk Southern Corp. 94.3 4 4 4 6 6 0 4 2 4 6 N 2 2 2 2 2 1 2 2 1 2 4 2 2 66
Union Pacific Corp. 94.3 4 4 4 6 6 0 4 2 4 6 N 2 2 2 2 2 2 2 2 0 2 4 2 2 66
United Technologies Corp. 94.3 4 4 4 6 6 0 4 2 4 6 Y 2 2 2 2 2 2 2 2 0 2 4 2 2 66
Wells Fargo & Co. 94.3 4 4 4 6 6 2 2 2 4 6 N 2 2 2 2 2 2 2 2 0 2 4 2 2 66
AFLAC Inc. 92.9 4 4 4 6 6 0 4 2 4 6 Y 1 2 2 2 2 2 2 2 0 2 4 2 2 65
Apache Corp. 92.9 4 4 4 6 6 0 4 2 4 6 N 2 2 2 2 2 2 2 2 1 2 2 2 2 65
APPENDIX E: SCORED RANKING OF ALL COMPANIES
Company Score(100%)
1 2 3 4 5 6 7 8 9 10 11 12 13 14 15 16 17 18 19 20 21 22 23 24 Raw score
Tren
dset
ters
Bank of America Corp. 92.9 4 4 4 6 6 2 4 2 4 6 N 2 2 1 2 2 2 2 2 0 2 2 2 2 65
Intuit Inc. 92.9 4 4 4 6 6 0 4 2 4 6 N 2 2 1 2 2 2 2 2 0 2 4 2 2 65
Symantec Corp. 92.9 4 4 4 6 3 0 4 2 4 6 N 2 2 2 2 2 2 2 2 2 2 4 2 2 65
Bank of New York Mellon Corp. 91.4 4 4 4 6 6 2 4 2 4 6 N 0 2 1 2 2 1 2 2 0 2 4 2 2 64
Biogen Inc. 91.4 4 4 4 6 6 0 4 2 4 6 N 1 2 1 2 2 2 2 2 0 2 4 2 2 64
Bristol-Myers Squibb Co. 91.4 4 4 2 6 6 0 4 2 4 6 N 2 2 2 2 2 2 2 2 0 2 4 2 2 64
Celgene Corp. 91.4 4 4 4 6 6 0 4 2 4 6 N 2 2 2 2 2 1 2 1 0 2 4 2 2 64
CVS Health Corp. 91.4 4 4 4 6 6 0 4 2 4 6 N 2 2 2 2 2 2 2 2 0 2 4 2 0 64
Dominion Energy Inc. 91.4 4 4 4 6 6 0 4 2 4 6 N 2 2 2 2 2 2 2 2 0 2 2 2 2 64
General Mills Inc. 91.4 4 4 4 3 6 0 4 2 4 6 N 2 2 2 2 2 2 2 2 1 2 4 2 2 64
Morgan Stanley 91.4 4 4 4 6 0 2 4 2 4 6 N 2 2 2 2 2 2 2 2 2 2 4 2 2 64
Navient Corp. 91.4 4 4 4 6 6 0 4 2 4 6 N 0 2 2 2 2 2 2 2 0 2 4 2 2 64
Tiffany & Co. 91.4 4 4 4 6 6 2 4 2 4 6 N 2 2 2 2 2 2 2 2 0 0 2 2 2 64
U.S. Bancorp 91.4 4 4 4 6 6 0 4 2 4 6 N 2 2 2 2 2 2 2 2 0 0 4 2 2 64
AbbVie Inc. 90.0 4 4 4 3 6 0 4 2 4 6 N 2 2 2 2 2 2 2 2 0 2 4 2 2 63
Boeing Co. 90.0 4 4 4 6 6 2 4 2 4 6 N 1 2 2 2 2 0 2 2 2 0 2 2 2 63
Coca-Cola Co. 90.0 4 4 4 6 6 0 0 2 4 6 N 2 1 2 2 2 2 2 2 2 2 4 2 2 63
Hartford Financial Services Group Inc. 90.0 4 4 4 6 6 2 4 2 4 6 N 0 2 0 2 2 2 2 2 1 2 2 2 2 63
Johnson & Johnson 90.0 4 4 4 6 3 0 4 2 4 6 N 2 2 2 2 2 2 2 2 0 2 4 2 2 63
Merck & Co. Inc. 90.0 4 4 4 6 3 0 4 2 4 6 N 2 2 2 2 2 2 2 2 0 2 4 2 2 63
Prudential Financial Inc. 90.0 4 2 4 6 3 0 4 2 4 6 N 2 2 2 2 2 2 2 2 2 2 4 2 2 63
Qualcomm Inc. 90.0 4 4 4 6 3 0 4 2 4 6 N 2 2 2 2 2 2 2 2 0 2 4 2 2 63
Salesforce.com Inc. 90.0 4 4 4 3 6 0 4 2 4 6 N 2 2 2 2 2 2 2 2 0 2 4 2 2 63
Firs
t
American Express Co. 88.6 4 4 4 6 3 0 4 2 4 6 N 2 2 1 2 2 2 2 2 0 2 4 2 2 62
ConocoPhillips 88.6 4 4 4 3 6 0 4 2 2 6 N 2 2 1 2 2 2 2 2 2 2 4 2 2 62
Lincoln National Corp. 88.6 4 4 4 6 6 0 4 2 4 6 N 2 2 0 2 2 2 2 2 0 2 2 2 2 62
MasterCard Inc. 88.6 4 4 4 6 6 0 0 2 4 6 N 2 2 2 2 2 2 2 2 0 2 4 2 2 62
Public Service Enterprise Group 88.6 4 4 4 6 6 0 4 2 4 6 N 1 2 2 2 2 1 2 2 0 2 2 2 2 62
UnitedHealth Group Inc. 88.6 4 4 4 6 0 0 4 2 4 6 N 2 2 2 2 2 2 2 2 2 2 4 2 2 62
Entergy Corp. 87.1 4 4 4 6 6 0 4 2 4 6 N 2 2 1 2 2 2 2 2 0 2 2 2 0 61
Estée Lauder Companies Inc. 87.1 4 4 4 3 6 0 4 2 4 6 N 2 2 2 2 2 2 2 2 2 0 4 2 0 61
Fluor Corp. 87.1 4 4 4 6 0 0 4 2 4 6 N 2 2 1 2 2 2 2 2 2 2 4 2 2 61
McDonald's Corp. 87.1 4 4 4 6 0 2 4 2 4 6 N 1 2 1 2 2 2 2 2 1 2 4 2 2 61
Regions Financial Corp. 87.1 4 4 4 6 6 0 4 2 4 6 N 2 2 1 2 2 0 2 2 0 2 4 2 0 61
4243
Company Score(100%)
1 2 3 4 5 6 7 8 9 10 11 12 13 14 15 16 17 18 19 20 21 22 23 24 Raw score
Firs
t Tie
r
Texas Instruments Inc. 87.1 4 2 4 3 6 0 4 2 4 6 N 2 2 2 2 2 2 2 2 0 2 4 2 2 61
Williams Companies Inc. (The) 87.1 4 4 4 6 6 0 4 1 4 6 N 2 2 1 2 2 2 2 2 0 2 2 2 1 61
Andeavor 85.7 4 4 4 6 3 0 4 2 4 6 N 2 2 2 2 2 0 2 2 2 2 2 2 1 60
Best Buy Co. Inc. 85.7 4 4 4 3 6 0 4 1 4 6 N 2 2 2 2 2 2 2 2 0 2 2 2 2 60
Electronic Arts Inc. 85.7 4 4 4 6 0 0 4 2 4 6 N 2 2 2 2 2 2 2 2 2 2 4 2 0 60
Humana Inc. 85.7 4 4 4 6 0 0 4 2 4 6 N 2 2 2 2 2 2 2 2 0 2 4 2 2 60
Mylan NV 85.7 4 4 4 6 6 0 4 2 0 6 N 1 2 1 2 2 2 2 2 0 2 4 2 2 60
Pinnacle West Capital Corp. 85.7 4 4 4 6 6 0 4 2 0 6 N 2 2 2 2 2 2 2 2 0 2 2 2 2 60
PPL Corp. 85.7 4 4 4 6 6 0 4 2 4 6 N 2 2 2 2 2 0 2 2 2 0 2 2 0 60
Principal Financial Group Inc. 85.7 4 4 4 0 6 0 4 2 4 6 N 2 2 1 2 2 2 2 1 2 2 4 2 2 60
Target Corp. 85.7 2 2 2 6 6 2 2 2 4 6 N 2 2 2 2 2 2 2 2 0 2 4 2 2 60
Weyerhaeuser Co. 85.7 4 4 4 3 6 0 4 2 4 6 N 2 2 2 2 2 2 2 1 0 2 2 2 2 60
3M Co. 84.3 4 4 4 6 0 0 4 2 4 6 N 2 1 2 2 2 2 2 2 0 2 4 2 2 59
Citigroup Inc. 84.3 4 4 4 3 6 0 4 2 4 6 N 1 2 1 2 2 2 2 2 0 2 2 2 2 59
Freeport-McMoRan Copper & Gold Inc. 84.3 4 4 4 3 6 0 4 1 4 6 N 2 2 1 2 2 2 2 2 0 2 2 2 2 59
General Motors Co. 84.3 4 4 4 6 3 0 2 2 4 6 N 2 2 2 2 2 2 2 2 0 2 2 2 2 59
KeyCorp 84.3 4 4 4 6 6 0 2 1 4 6 N 1 2 1 2 2 2 2 2 0 2 2 2 2 59
Kraft Heinz Co. 84.3 4 4 4 6 6 2 4 2 4 6 N 2 2 1 2 2 0 0 0 0 0 4 2 2 59
Aetna Inc. 82.9 4 4 4 6 0 0 4 2 4 6 N 2 2 2 2 2 2 2 2 0 2 2 2 2 58
Amazon.com Inc. 82.9 4 4 4 3 3 0 4 2 4 6 N 2 2 2 2 2 2 2 2 0 2 2 2 2 58
AmerisourceBergen Corp. 82.9 0 4 4 6 6 0 4 2 4 6 N 2 2 2 2 2 2 2 2 0 2 2 2 0 58
Amgen Inc. 82.9 4 4 4 6 0 0 4 1 4 6 N 2 1 2 2 2 2 2 2 0 2 4 2 2 58
Anadarko Petroleum Corp. 82.9 4 4 4 0 6 0 4 2 4 6 N 2 2 2 2 2 2 2 2 0 2 2 2 2 58
Cigna Corp. 82.9 4 4 4 6 0 0 4 2 4 6 N 2 2 2 2 2 2 2 2 0 2 2 2 2 58
Consolidated Edison Inc. 82.9 4 4 4 6 6 0 4 1 2 6 N 1 2 1 1 2 2 2 2 0 2 2 2 2 58
Darden Restaurants Inc. 82.9 4 4 4 6 3 0 4 2 4 6 N 1 2 2 2 2 0 2 2 0 2 2 2 2 58
Honeywell International Inc. 82.9 4 4 4 0 6 0 4 2 4 6 N 2 2 2 2 2 2 2 2 0 2 2 2 2 58
Procter & Gamble Co. 82.9 4 4 4 6 6 0 4 2 4 6 N 1 2 2 2 2 1 1 1 0 2 2 2 0 58
Apple Inc. 81.4 4 4 2 6 0 1 4 2 4 6 N 2 1 2 2 2 1 2 2 0 2 4 2 2 57
CF Industries Holdings Inc. 81.4 4 4 0 6 6 0 4 1 4 6 N 1 2 1 2 2 0 2 2 0 2 4 2 2 57
Cisco Systems Inc. 81.4 4 4 4 6 6 2 4 2 2 6 N 1 2 2 2 2 0 0 2 0 0 4 2 0 57
Danaher Corp. 81.4 4 4 4 0 6 0 4 2 4 6 N 2 2 2 2 2 2 2 0 2 2 2 2 1 57
Fifth Third Bancorp 81.4 4 4 4 6 6 0 4 2 0 6 N 1 2 0 2 2 2 2 2 0 2 4 2 0 57
MetLife Inc. 81.4 4 4 4 6 3 0 4 1 4 6 N 1 2 2 2 2 2 2 2 0 2 2 2 0 57
Company Score(100%)
1 2 3 4 5 6 7 8 9 10 11 12 13 14 15 16 17 18 19 20 21 22 23 24 Raw score
Firs
t Tie
r
Newmont Mining Corp. 81.4 4 4 0 3 6 0 4 2 4 6 N 2 2 1 2 2 1 2 2 2 2 2 2 2 57
Nordstrom Inc. 81.4 4 4 4 0 6 0 4 2 2 6 N 2 2 2 2 2 2 2 1 2 2 4 2 0 57
Regeneron Pharmaceuticals Inc. 81.4 4 4 4 0 6 0 4 2 4 6 N 1 2 1 2 2 2 2 2 0 2 4 1 2 57
Western Digital Corp. 81.4 4 4 4 0 6 0 4 2 4 6 N 2 2 2 2 2 0 2 1 2 2 4 2 0 57
AES Corp. 80.0 4 4 4 6 6 0 4 2 4 6 N 2 2 2 2 0 2 0 0 0 0 2 2 2 56
Campbell Soup Co. 80.0 4 4 4 6 6 0 4 2 4 6 N 1 2 2 2 2 1 1 1 0 0 2 2 0 56
Cerner Corp. 80.0 4 4 4 6 0 0 4 2 4 6 N 2 1 1 2 2 2 2 2 0 2 2 2 2 56
Comcast Corp. 80.0 4 4 4 0 6 0 4 2 4 6 N 2 2 2 2 2 2 2 2 0 2 2 0 2 56
Corning Inc. 80.0 2 2 4 6 3 0 4 2 4 6 N 1 2 0 2 2 2 2 2 0 2 4 2 2 56
Franklin Resources Inc. 80.0 4 4 4 3 0 0 4 2 4 6 N 2 2 1 2 2 2 2 0 2 2 4 2 2 56
General Electric Co. 80.0 4 4 4 0 0 0 4 2 4 6 N 2 2 2 2 2 2 2 2 2 2 4 2 2 56
LyondellBasell Industries NV 80.0 4 4 4 6 6 0 4 2 4 6 N 2 2 2 2 0 0 0 0 0 0 4 2 2 56
Newell Brands Inc. 80.0 4 4 4 0 6 0 4 2 2 6 N 2 2 2 2 2 2 2 2 2 2 2 2 0 56
Seco
nd T
ier
Xcel Energy Inc. 80.0 4 4 4 6 3 0 4 2 0 6 N 2 2 2 2 2 2 2 2 0 2 2 1 2 56
Abbott Laboratories 78.6 4 4 4 3 0 0 4 2 4 6 N 2 2 2 2 2 2 0 2 0 2 4 2 2 55
Cardinal Health Inc. 78.6 4 2 4 6 0 2 4 2 4 6 N 2 2 1 2 2 2 2 2 0 2 2 2 0 55
DowDuPont Inc. 78.6 4 4 4 6 3 0 4 2 4 6 N 2 2 2 2 2 1 1 0 0 0 2 2 2 55
Intercontinental Exchange Inc. 78.6 4 4 4 3 6 0 4 2 2 6 N 2 2 2 2 2 0 2 0 2 2 2 2 0 55
Lockheed Martin Corp. 78.6 4 4 4 3 0 0 4 2 4 6 N 2 2 2 2 2 2 2 2 0 2 2 2 2 55
Pfizer Inc. 78.6 4 4 4 3 0 0 4 2 4 6 N 2 2 2 2 2 2 2 2 0 2 2 2 2 55
Phillips 66 78.6 4 4 4 6 0 0 4 2 0 6 N 1 2 2 2 2 2 2 2 2 2 2 2 2 55
Southern Co. 78.6 4 4 4 6 6 0 4 2 4 6 N 1 2 2 2 2 0 0 0 0 0 2 2 2 55
United Rentals Inc. 78.6 4 4 4 6 0 0 4 2 4 3 N 2 2 2 2 2 0 2 2 2 2 4 2 0 55
Allergan PLC 77.1 4 2 4 3 0 0 4 2 4 6 N 2 2 2 2 2 2 2 1 0 2 4 2 2 54
Anthem Inc. 77.1 4 4 0 6 0 0 4 2 4 6 N 2 2 2 2 2 2 2 2 0 2 2 2 2 54
ConAgra Foods Inc. 77.1 4 4 4 6 0 0 4 2 0 6 N 2 1 1 2 2 2 2 2 0 2 4 2 2 54
Starbucks Corp. 77.1 4 4 0 3 6 0 4 2 4 6 N 1 2 2 2 2 1 2 2 0 2 2 1 2 54
T. Rowe Price Group Inc. 77.1 4 4 4 3 3 0 4 2 2 6 N 2 2 2 2 2 0 2 0 2 2 2 2 2 54
Walt Disney Co., The 77.1 4 4 4 6 0 0 4 2 4 6 N 1 2 2 2 2 0 2 2 0 2 2 2 1 54
AT&T 75.7 4 4 0 3 0 0 4 2 4 6 N 2 1 2 2 2 1 2 2 2 2 4 2 2 53
BlackRock Inc. 75.7 4 4 4 3 0 0 4 2 2 6 N 2 2 2 2 2 1 2 1 2 2 2 2 2 53
Caterpillar Inc. 75.7 4 4 4 3 0 0 4 2 4 6 N 2 2 2 2 2 0 2 2 0 2 4 2 0 53
eBay Inc. 75.7 4 4 4 6 0 0 0 2 4 6 N 2 1 2 2 2 2 2 2 0 2 2 2 2 53
Hess Corp. 75.7 4 4 4 3 6 0 4 2 2 6 N 2 2 2 2 2 0 2 0 0 2 2 2 0 53
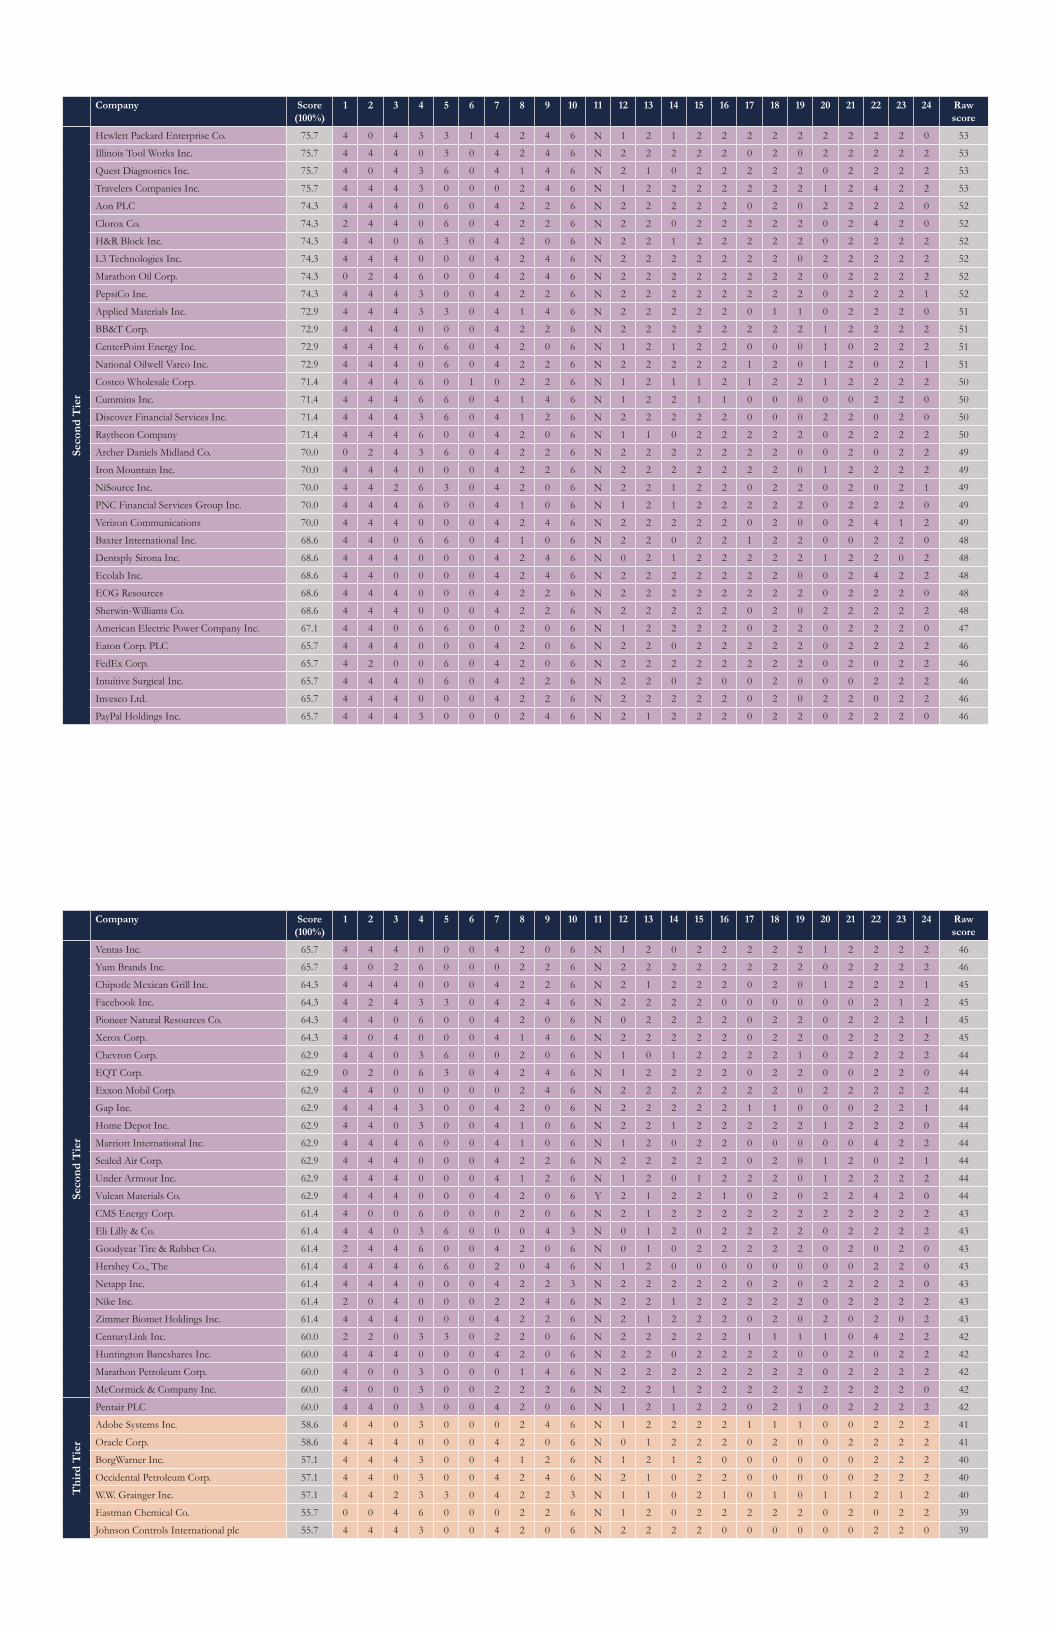
4445
Company Score(100%)
1 2 3 4 5 6 7 8 9 10 11 12 13 14 15 16 17 18 19 20 21 22 23 24 Raw score
Seco
nd T
ier
Hewlett Packard Enterprise Co. 75.7 4 0 4 3 3 1 4 2 4 6 N 1 2 1 2 2 2 2 2 2 2 2 2 0 53
Illinois Tool Works Inc. 75.7 4 4 4 0 3 0 4 2 4 6 N 2 2 2 2 2 0 2 0 2 2 2 2 2 53
Quest Diagnostics Inc. 75.7 4 0 4 3 6 0 4 1 4 6 N 2 1 0 2 2 2 2 2 0 2 2 2 2 53
Travelers Companies Inc. 75.7 4 4 4 3 0 0 0 2 4 6 N 1 2 2 2 2 2 2 2 1 2 4 2 2 53
Aon PLC 74.3 4 4 4 0 6 0 4 2 2 6 N 2 2 2 2 2 0 2 0 2 2 2 2 0 52
Clorox Co. 74.3 2 4 4 0 6 0 4 2 2 6 N 2 2 0 2 2 2 2 2 0 2 4 2 0 52
H&R Block Inc. 74.3 4 4 0 6 3 0 4 2 0 6 N 2 2 1 2 2 2 2 2 0 2 2 2 2 52
L3 Technologies Inc. 74.3 4 4 4 0 0 0 4 2 4 6 N 2 2 2 2 2 2 2 0 2 2 2 2 2 52
Marathon Oil Corp. 74.3 0 2 4 6 0 0 4 2 4 6 N 2 2 2 2 2 2 2 2 0 2 2 2 2 52
PepsiCo Inc. 74.3 4 4 4 3 0 0 4 2 2 6 N 2 2 2 2 2 2 2 2 0 2 2 2 1 52
Applied Materials Inc. 72.9 4 4 4 3 3 0 4 1 4 6 N 2 2 2 2 2 0 1 1 0 2 2 2 0 51
BB&T Corp. 72.9 4 4 4 0 0 0 4 2 2 6 N 2 2 2 2 2 2 2 2 1 2 2 2 2 51
CenterPoint Energy Inc. 72.9 4 4 4 6 6 0 4 2 0 6 N 1 2 1 2 2 0 0 0 1 0 2 2 2 51
National Oilwell Varco Inc. 72.9 4 4 4 0 6 0 4 2 2 6 N 2 2 2 2 2 1 2 0 1 2 0 2 1 51
Costco Wholesale Corp. 71.4 4 4 4 6 0 1 0 2 2 6 N 1 2 1 1 2 1 2 2 1 2 2 2 2 50
Cummins Inc. 71.4 4 4 4 6 6 0 4 1 4 6 N 1 2 2 1 1 0 0 0 0 0 2 2 0 50
Discover Financial Services Inc. 71.4 4 4 4 3 6 0 4 1 2 6 N 2 2 2 2 2 0 0 0 2 2 0 2 0 50
Raytheon Company 71.4 4 4 4 6 0 0 4 2 0 6 N 1 1 0 2 2 2 2 2 0 2 2 2 2 50
Archer Daniels Midland Co. 70.0 0 2 4 3 6 0 4 2 2 6 N 2 2 2 2 2 2 2 0 0 2 0 2 2 49
Iron Mountain Inc. 70.0 4 4 4 0 0 0 4 2 2 6 N 2 2 2 2 2 2 2 0 1 2 2 2 2 49
NiSource Inc. 70.0 4 4 2 6 3 0 4 2 0 6 N 2 2 1 2 2 0 2 2 0 2 0 2 1 49
PNC Financial Services Group Inc. 70.0 4 4 4 6 0 0 4 1 0 6 N 1 2 1 2 2 2 2 2 0 2 2 2 0 49
Verizon Communications 70.0 4 4 4 0 0 0 4 2 4 6 N 2 2 2 2 2 0 2 0 0 2 4 1 2 49
Baxter International Inc. 68.6 4 4 0 6 6 0 4 1 0 6 N 2 2 0 2 2 1 2 2 0 0 2 2 0 48
Dentsply Sirona Inc. 68.6 4 4 4 0 0 0 4 2 4 6 N 0 2 1 2 2 2 2 2 1 2 2 0 2 48
Ecolab Inc. 68.6 4 4 0 0 0 0 4 2 4 6 N 2 2 2 2 2 2 2 0 0 2 4 2 2 48
EOG Resources 68.6 4 4 4 0 0 0 4 2 2 6 N 2 2 2 2 2 2 2 2 0 2 2 2 0 48
Sherwin-Williams Co. 68.6 4 4 4 0 0 0 4 2 2 6 N 2 2 2 2 2 0 2 0 2 2 2 2 2 48
American Electric Power Company Inc. 67.1 4 4 0 6 6 0 0 2 0 6 N 1 2 2 2 2 0 2 2 0 2 2 2 0 47
Eaton Corp. PLC 65.7 4 4 4 0 0 0 4 2 0 6 N 2 2 0 2 2 2 2 2 0 2 2 2 2 46
FedEx Corp. 65.7 4 2 0 0 6 0 4 2 0 6 N 2 2 2 2 2 2 2 2 0 2 0 2 2 46
Intuitive Surgical Inc. 65.7 4 4 4 0 6 0 4 2 2 6 N 2 2 0 2 0 0 2 0 0 0 2 2 2 46
Invesco Ltd. 65.7 4 4 4 0 0 0 4 2 2 6 N 2 2 2 2 2 0 2 0 2 2 0 2 2 46
PayPal Holdings Inc. 65.7 4 4 4 3 0 0 0 2 4 6 N 2 1 2 2 2 0 2 2 0 2 2 2 0 46
Company Score(100%)
1 2 3 4 5 6 7 8 9 10 11 12 13 14 15 16 17 18 19 20 21 22 23 24 Raw score
Seco
nd T
ier
Ventas Inc. 65.7 4 4 4 0 0 0 4 2 0 6 N 1 2 0 2 2 2 2 2 1 2 2 2 2 46
Yum Brands Inc. 65.7 4 0 2 6 0 0 0 2 2 6 N 2 2 2 2 2 2 2 2 0 2 2 2 2 46
Chipotle Mexican Grill Inc. 64.3 4 4 4 0 0 0 4 2 2 6 N 2 1 2 2 2 0 2 0 1 2 2 2 1 45
Facebook Inc. 64.3 4 2 4 3 3 0 4 2 4 6 N 2 2 2 2 0 0 0 0 0 0 2 1 2 45
Pioneer Natural Resources Co. 64.3 4 4 0 6 0 0 4 2 0 6 N 0 2 2 2 2 0 2 2 0 2 2 2 1 45
Xerox Corp. 64.3 4 0 4 0 0 0 4 1 4 6 N 2 2 2 2 2 0 2 2 0 2 2 2 2 45
Chevron Corp. 62.9 4 4 0 3 6 0 0 2 0 6 N 1 0 1 2 2 2 2 1 0 2 2 2 2 44
EQT Corp. 62.9 0 2 0 6 3 0 4 2 4 6 N 1 2 2 2 2 0 2 2 0 0 2 2 0 44
Exxon Mobil Corp. 62.9 4 4 0 0 0 0 0 2 4 6 N 2 2 2 2 2 2 2 0 2 2 2 2 2 44
Gap Inc. 62.9 4 4 4 3 0 0 4 2 0 6 N 2 2 2 2 2 1 1 0 0 0 2 2 1 44
Home Depot Inc. 62.9 4 4 0 3 0 0 4 1 0 6 N 2 2 1 2 2 2 2 2 1 2 2 2 0 44
Marriott International Inc. 62.9 4 4 4 6 0 0 4 1 0 6 N 1 2 0 2 2 0 0 0 0 0 4 2 2 44
Sealed Air Corp. 62.9 4 4 4 0 0 0 4 2 2 6 N 2 2 2 2 2 0 2 0 1 2 0 2 1 44
Under Armour Inc. 62.9 4 4 4 0 0 0 4 1 2 6 N 1 2 0 1 2 2 2 0 1 2 2 2 2 44
Vulcan Materials Co. 62.9 4 4 4 0 0 0 4 2 0 6 Y 2 1 2 2 1 0 2 0 2 2 4 2 0 44
CMS Energy Corp. 61.4 4 0 0 6 0 0 0 2 0 6 N 2 1 2 2 2 2 2 2 2 2 2 2 2 43
Eli Lilly & Co. 61.4 4 4 0 3 6 0 0 0 4 3 N 0 1 2 0 2 2 2 2 0 2 2 2 2 43
Goodyear Tire & Rubber Co. 61.4 2 4 4 6 0 0 4 2 0 6 N 0 1 0 2 2 2 2 2 0 2 0 2 0 43
Hershey Co., The 61.4 4 4 4 6 6 0 2 0 4 6 N 1 2 0 0 0 0 0 0 0 0 2 2 0 43
Netapp Inc. 61.4 4 4 4 0 0 0 4 2 2 3 N 2 2 2 2 2 0 2 0 2 2 2 2 0 43
Nike Inc. 61.4 2 0 4 0 0 0 2 2 4 6 N 2 2 1 2 2 2 2 2 0 2 2 2 2 43
Zimmer Biomet Holdings Inc. 61.4 4 4 4 0 0 0 4 2 2 6 N 2 1 2 2 2 0 2 0 2 0 2 0 2 43
CenturyLink Inc. 60.0 2 2 0 3 3 0 2 2 0 6 N 2 2 2 2 2 1 1 1 1 0 4 2 2 42
Huntington Bancshares Inc. 60.0 4 4 4 0 0 0 4 2 0 6 N 2 2 0 2 2 2 2 0 0 2 0 2 2 42
Marathon Petroleum Corp. 60.0 4 0 0 3 0 0 0 1 4 6 N 2 2 2 2 2 2 2 2 0 2 2 2 2 42
McCormick & Company Inc. 60.0 4 0 0 3 0 0 2 2 2 6 N 2 2 1 2 2 2 2 2 2 2 2 2 0 42
Thi
rd T
ier
Pentair PLC 60.0 4 4 0 3 0 0 4 2 0 6 N 1 2 1 2 2 0 2 1 0 2 2 2 2 42
Adobe Systems Inc. 58.6 4 4 0 3 0 0 0 2 4 6 N 1 2 2 2 2 1 1 1 0 0 2 2 2 41
Oracle Corp. 58.6 4 4 4 0 0 0 4 2 0 6 N 0 1 2 2 2 0 2 0 0 2 2 2 2 41
BorgWarner Inc. 57.1 4 4 4 3 0 0 4 1 2 6 N 1 2 1 2 0 0 0 0 0 0 2 2 2 40
Occidental Petroleum Corp. 57.1 4 4 0 3 0 0 4 2 4 6 N 2 1 0 2 2 0 0 0 0 0 2 2 2 40
W.W. Grainger Inc. 57.1 4 4 2 3 3 0 4 2 2 3 N 1 1 0 2 1 0 1 0 1 1 2 1 2 40
Eastman Chemical Co. 55.7 0 0 4 6 0 0 0 2 2 6 N 1 2 0 2 2 2 2 2 0 2 0 2 2 39
Johnson Controls International plc 55.7 4 4 4 3 0 0 4 2 0 6 N 2 2 2 2 0 0 0 0 0 0 2 2 0 39
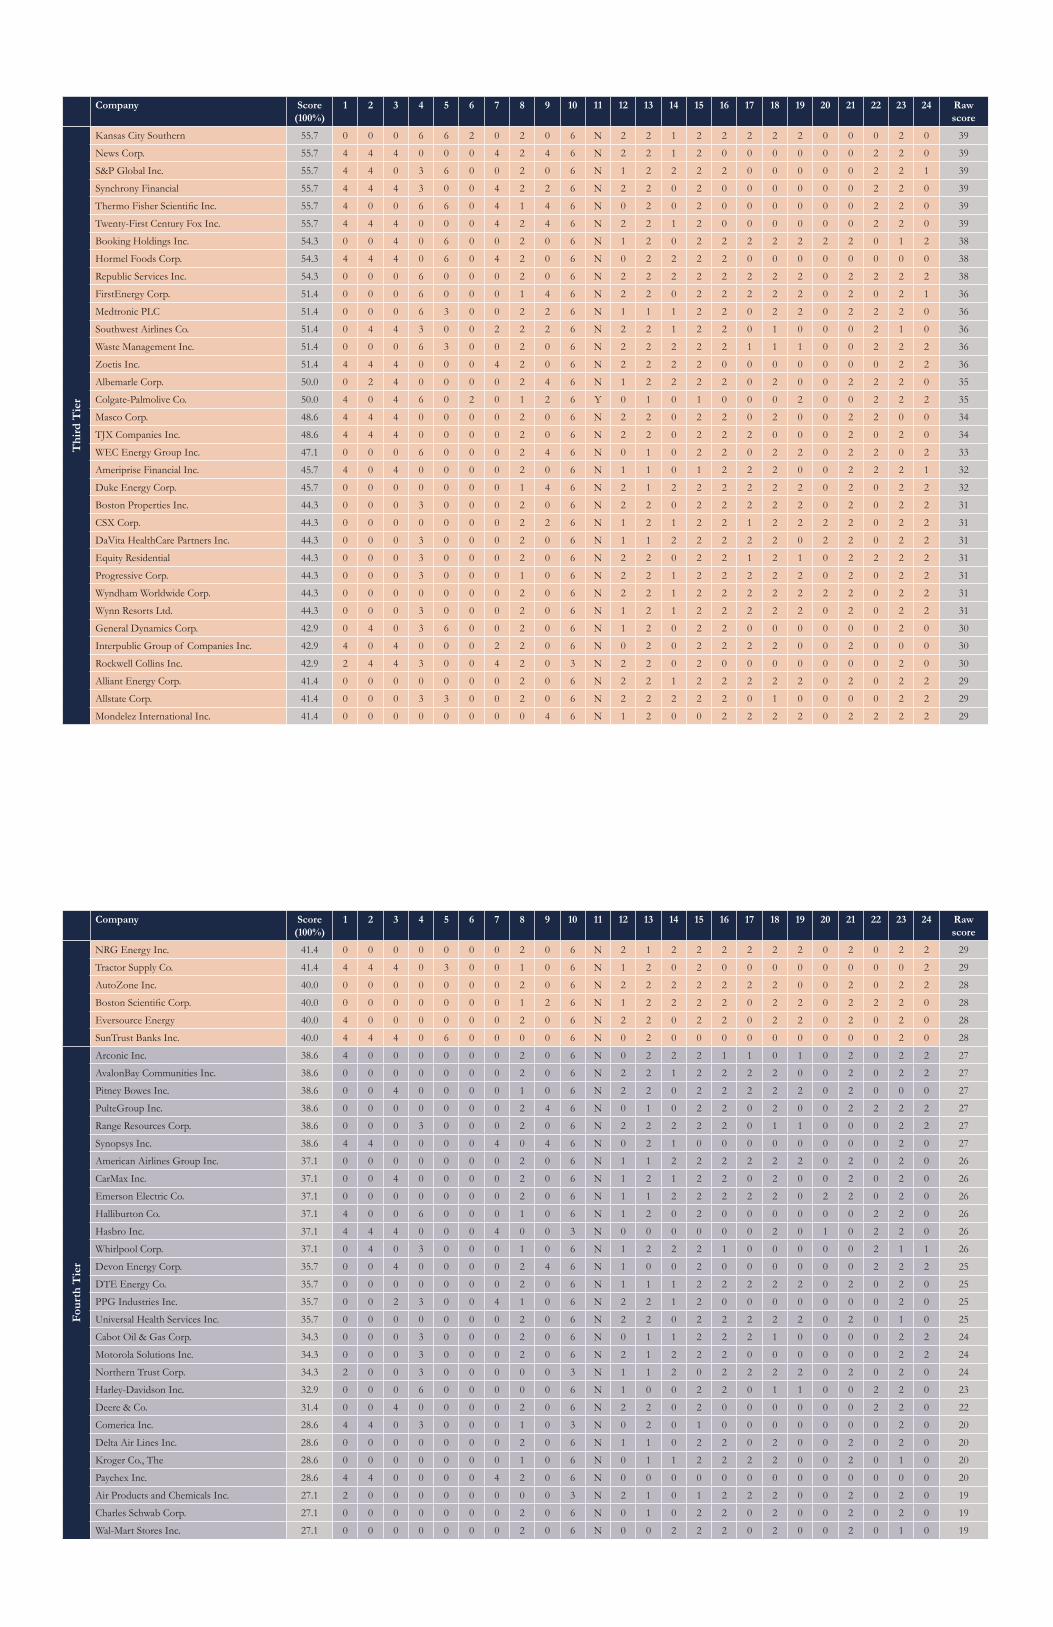
4647
Company Score(100%)
1 2 3 4 5 6 7 8 9 10 11 12 13 14 15 16 17 18 19 20 21 22 23 24 Raw score
Thi
rd T
ier
Kansas City Southern 55.7 0 0 0 6 6 2 0 2 0 6 N 2 2 1 2 2 2 2 2 0 0 0 2 0 39
News Corp. 55.7 4 4 4 0 0 0 4 2 4 6 N 2 2 1 2 0 0 0 0 0 0 2 2 0 39
S&P Global Inc. 55.7 4 4 0 3 6 0 0 2 0 6 N 1 2 2 2 2 0 0 0 0 0 2 2 1 39
Synchrony Financial 55.7 4 4 4 3 0 0 4 2 2 6 N 2 2 0 2 0 0 0 0 0 0 2 2 0 39
Thermo Fisher Scientific Inc. 55.7 4 0 0 6 6 0 4 1 4 6 N 0 2 0 2 0 0 0 0 0 0 2 2 0 39
Twenty-First Century Fox Inc. 55.7 4 4 4 0 0 0 4 2 4 6 N 2 2 1 2 0 0 0 0 0 0 2 2 0 39
Booking Holdings Inc. 54.3 0 0 4 0 6 0 0 2 0 6 N 1 2 0 2 2 2 2 2 2 2 0 1 2 38
Hormel Foods Corp. 54.3 4 4 4 0 6 0 4 2 0 6 N 0 2 2 2 2 0 0 0 0 0 0 0 0 38
Republic Services Inc. 54.3 0 0 0 6 0 0 0 2 0 6 N 2 2 2 2 2 2 2 2 0 2 2 2 2 38
FirstEnergy Corp. 51.4 0 0 0 6 0 0 0 1 4 6 N 2 2 0 2 2 2 2 2 0 2 0 2 1 36
Medtronic PLC 51.4 0 0 0 6 3 0 0 2 2 6 N 1 1 1 2 2 0 2 2 0 2 2 2 0 36
Southwest Airlines Co. 51.4 0 4 4 3 0 0 2 2 2 6 N 2 2 1 2 2 0 1 0 0 0 2 1 0 36
Waste Management Inc. 51.4 0 0 0 6 3 0 0 2 0 6 N 2 2 2 2 2 1 1 1 0 0 2 2 2 36
Zoetis Inc. 51.4 4 4 4 0 0 0 4 2 0 6 N 2 2 2 2 0 0 0 0 0 0 0 2 2 36
Albemarle Corp. 50.0 0 2 4 0 0 0 0 2 4 6 N 1 2 2 2 2 0 2 0 0 2 2 2 0 35
Colgate-Palmolive Co. 50.0 4 0 4 6 0 2 0 1 2 6 Y 0 1 0 1 0 0 0 2 0 0 2 2 2 35
Masco Corp. 48.6 4 4 4 0 0 0 0 2 0 6 N 2 2 0 2 2 0 2 0 0 2 2 0 0 34
TJX Companies Inc. 48.6 4 4 4 0 0 0 0 2 0 6 N 2 2 0 2 2 2 0 0 0 2 0 2 0 34
WEC Energy Group Inc. 47.1 0 0 0 6 0 0 0 2 4 6 N 0 1 0 2 2 0 2 2 0 2 2 0 2 33
Ameriprise Financial Inc. 45.7 4 0 4 0 0 0 0 2 0 6 N 1 1 0 1 2 2 2 0 0 2 2 2 1 32
Duke Energy Corp. 45.7 0 0 0 0 0 0 0 1 4 6 N 2 1 2 2 2 2 2 2 0 2 0 2 2 32
Boston Properties Inc. 44.3 0 0 0 3 0 0 0 2 0 6 N 2 2 0 2 2 2 2 2 0 2 0 2 2 31
CSX Corp. 44.3 0 0 0 0 0 0 0 2 2 6 N 1 2 1 2 2 1 2 2 2 2 0 2 2 31
DaVita HealthCare Partners Inc. 44.3 0 0 0 3 0 0 0 2 0 6 N 1 1 2 2 2 2 2 0 2 2 0 2 2 31
Equity Residential 44.3 0 0 0 3 0 0 0 2 0 6 N 2 2 0 2 2 1 2 1 0 2 2 2 2 31
Progressive Corp. 44.3 0 0 0 3 0 0 0 1 0 6 N 2 2 1 2 2 2 2 2 0 2 0 2 2 31
Wyndham Worldwide Corp. 44.3 0 0 0 0 0 0 0 2 0 6 N 2 2 1 2 2 2 2 2 2 2 0 2 2 31
Wynn Resorts Ltd. 44.3 0 0 0 3 0 0 0 2 0 6 N 1 2 1 2 2 2 2 2 0 2 0 2 2 31
General Dynamics Corp. 42.9 0 4 0 3 6 0 0 2 0 6 N 1 2 0 2 2 0 0 0 0 0 0 2 0 30
Interpublic Group of Companies Inc. 42.9 4 0 4 0 0 0 2 2 0 6 N 0 2 0 2 2 2 2 0 0 2 0 0 0 30
Rockwell Collins Inc. 42.9 2 4 4 3 0 0 4 2 0 3 N 2 2 0 2 0 0 0 0 0 0 0 2 0 30
Alliant Energy Corp. 41.4 0 0 0 0 0 0 0 2 0 6 N 2 2 1 2 2 2 2 2 0 2 0 2 2 29
Allstate Corp. 41.4 0 0 0 3 3 0 0 2 0 6 N 2 2 2 2 2 0 1 0 0 0 0 2 2 29
Mondelez International Inc. 41.4 0 0 0 0 0 0 0 0 4 6 N 1 2 0 0 2 2 2 2 0 2 2 2 2 29
Company Score(100%)
1 2 3 4 5 6 7 8 9 10 11 12 13 14 15 16 17 18 19 20 21 22 23 24 Raw score
NRG Energy Inc. 41.4 0 0 0 0 0 0 0 2 0 6 N 2 1 2 2 2 2 2 2 0 2 0 2 2 29
Tractor Supply Co. 41.4 4 4 4 0 3 0 0 1 0 6 N 1 2 0 2 0 0 0 0 0 0 0 0 2 29
AutoZone Inc. 40.0 0 0 0 0 0 0 0 2 0 6 N 2 2 2 2 2 2 2 0 0 2 0 2 2 28
Boston Scientific Corp. 40.0 0 0 0 0 0 0 0 1 2 6 N 1 2 2 2 2 0 2 2 0 2 2 2 0 28
Eversource Energy 40.0 4 0 0 0 0 0 0 2 0 6 N 2 2 0 2 2 0 2 2 0 2 0 2 0 28
SunTrust Banks Inc. 40.0 4 4 4 0 6 0 0 0 0 6 N 0 2 0 0 0 0 0 0 0 0 0 2 0 28
Four
th T
ier
Arconic Inc. 38.6 4 0 0 0 0 0 0 2 0 6 N 0 2 2 2 1 1 0 1 0 2 0 2 2 27
AvalonBay Communities Inc. 38.6 0 0 0 0 0 0 0 2 0 6 N 2 2 1 2 2 2 2 0 0 2 0 2 2 27
Pitney Bowes Inc. 38.6 0 0 4 0 0 0 0 1 0 6 N 2 2 0 2 2 2 2 2 0 2 0 0 0 27
PulteGroup Inc. 38.6 0 0 0 0 0 0 0 2 4 6 N 0 1 0 2 2 0 2 0 0 2 2 2 2 27
Range Resources Corp. 38.6 0 0 0 3 0 0 0 2 0 6 N 2 2 2 2 2 0 1 1 0 0 0 2 2 27
Synopsys Inc. 38.6 4 4 0 0 0 0 4 0 4 6 N 0 2 1 0 0 0 0 0 0 0 0 2 0 27
American Airlines Group Inc. 37.1 0 0 0 0 0 0 0 2 0 6 N 1 1 2 2 2 2 2 2 0 2 0 2 0 26
CarMax Inc. 37.1 0 0 4 0 0 0 0 2 0 6 N 1 2 1 2 2 0 2 0 0 2 0 2 0 26
Emerson Electric Co. 37.1 0 0 0 0 0 0 0 2 0 6 N 1 1 2 2 2 2 2 0 2 2 0 2 0 26
Halliburton Co. 37.1 4 0 0 6 0 0 0 1 0 6 N 1 2 0 2 0 0 0 0 0 0 2 2 0 26
Hasbro Inc. 37.1 4 4 4 0 0 0 4 0 0 3 N 0 0 0 0 0 0 2 0 1 0 2 2 0 26
Whirlpool Corp. 37.1 0 4 0 3 0 0 0 1 0 6 N 1 2 2 2 1 0 0 0 0 0 2 1 1 26
Devon Energy Corp. 35.7 0 0 4 0 0 0 0 2 4 6 N 1 0 0 2 0 0 0 0 0 0 2 2 2 25
DTE Energy Co. 35.7 0 0 0 0 0 0 0 2 0 6 N 1 1 1 2 2 2 2 2 0 2 0 2 0 25
PPG Industries Inc. 35.7 0 0 2 3 0 0 4 1 0 6 N 2 2 1 2 0 0 0 0 0 0 0 2 0 25
Universal Health Services Inc. 35.7 0 0 0 0 0 0 0 2 0 6 N 2 2 0 2 2 2 2 2 0 2 0 1 0 25
Cabot Oil & Gas Corp. 34.3 0 0 0 3 0 0 0 2 0 6 N 0 1 1 2 2 2 1 0 0 0 0 2 2 24
Motorola Solutions Inc. 34.3 0 0 0 3 0 0 0 2 0 6 N 2 1 2 2 2 0 0 0 0 0 0 2 2 24
Northern Trust Corp. 34.3 2 0 0 3 0 0 0 0 0 3 N 1 1 2 0 2 2 2 2 0 2 0 2 0 24
Harley-Davidson Inc. 32.9 0 0 0 6 0 0 0 0 0 6 N 1 0 0 2 2 0 1 1 0 0 2 2 0 23
Deere & Co. 31.4 0 0 4 0 0 0 0 2 0 6 N 2 2 0 2 0 0 0 0 0 0 2 2 0 22
Comerica Inc. 28.6 4 4 0 3 0 0 0 1 0 3 N 0 2 0 1 0 0 0 0 0 0 0 2 0 20
Delta Air Lines Inc. 28.6 0 0 0 0 0 0 0 2 0 6 N 1 1 0 2 2 0 2 0 0 2 0 2 0 20
Kroger Co., The 28.6 0 0 0 0 0 0 0 1 0 6 N 0 1 1 2 2 2 2 0 0 2 0 1 0 20
Paychex Inc. 28.6 4 4 0 0 0 0 4 2 0 6 N 0 0 0 0 0 0 0 0 0 0 0 0 0 20
Air Products and Chemicals Inc. 27.1 2 0 0 0 0 0 0 0 0 3 N 2 1 0 1 2 2 2 0 0 2 0 2 0 19
Charles Schwab Corp. 27.1 0 0 0 0 0 0 0 2 0 6 N 0 1 0 2 2 0 2 0 0 2 0 2 0 19
Wal-Mart Stores Inc. 27.1 0 0 0 0 0 0 0 2 0 6 N 0 0 2 2 2 0 2 0 0 2 0 1 0 19
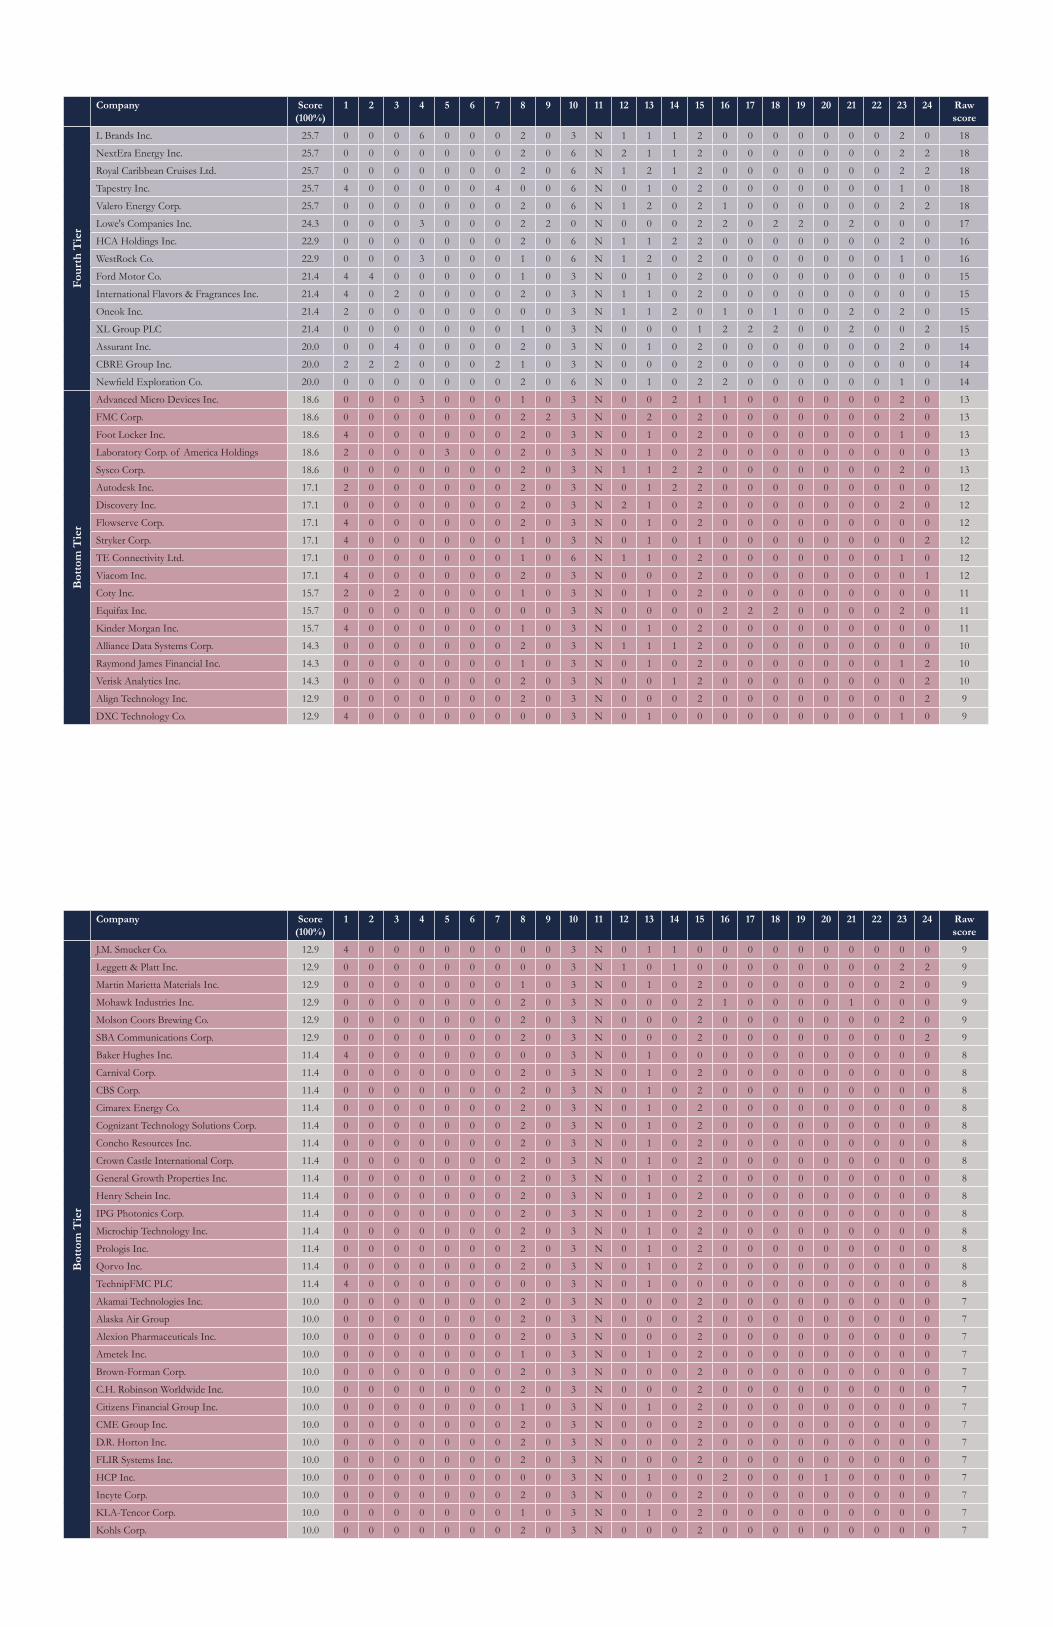
4849
Company Score(100%)
1 2 3 4 5 6 7 8 9 10 11 12 13 14 15 16 17 18 19 20 21 22 23 24 Raw score
Four
th T
ier
L Brands Inc. 25.7 0 0 0 6 0 0 0 2 0 3 N 1 1 1 2 0 0 0 0 0 0 0 2 0 18
NextEra Energy Inc. 25.7 0 0 0 0 0 0 0 2 0 6 N 2 1 1 2 0 0 0 0 0 0 0 2 2 18
Royal Caribbean Cruises Ltd. 25.7 0 0 0 0 0 0 0 2 0 6 N 1 2 1 2 0 0 0 0 0 0 0 2 2 18
Tapestry Inc. 25.7 4 0 0 0 0 0 4 0 0 6 N 0 1 0 2 0 0 0 0 0 0 0 1 0 18
Valero Energy Corp. 25.7 0 0 0 0 0 0 0 2 0 6 N 1 2 0 2 1 0 0 0 0 0 0 2 2 18
Lowe's Companies Inc. 24.3 0 0 0 3 0 0 0 2 2 0 N 0 0 0 2 2 0 2 2 0 2 0 0 0 17
HCA Holdings Inc. 22.9 0 0 0 0 0 0 0 2 0 6 N 1 1 2 2 0 0 0 0 0 0 0 2 0 16
WestRock Co. 22.9 0 0 0 3 0 0 0 1 0 6 N 1 2 0 2 0 0 0 0 0 0 0 1 0 16
Ford Motor Co. 21.4 4 4 0 0 0 0 0 1 0 3 N 0 1 0 2 0 0 0 0 0 0 0 0 0 15
International Flavors & Fragrances Inc. 21.4 4 0 2 0 0 0 0 2 0 3 N 1 1 0 2 0 0 0 0 0 0 0 0 0 15
Oneok Inc. 21.4 2 0 0 0 0 0 0 0 0 3 N 1 1 2 0 1 0 1 0 0 2 0 2 0 15
XL Group PLC 21.4 0 0 0 0 0 0 0 1 0 3 N 0 0 0 1 2 2 2 0 0 2 0 0 2 15
Assurant Inc. 20.0 0 0 4 0 0 0 0 2 0 3 N 0 1 0 2 0 0 0 0 0 0 0 2 0 14
CBRE Group Inc. 20.0 2 2 2 0 0 0 2 1 0 3 N 0 0 0 2 0 0 0 0 0 0 0 0 0 14
Newfield Exploration Co. 20.0 0 0 0 0 0 0 0 2 0 6 N 0 1 0 2 2 0 0 0 0 0 0 1 0 14
Bot
tom
Tie
r
Advanced Micro Devices Inc. 18.6 0 0 0 3 0 0 0 1 0 3 N 0 0 2 1 1 0 0 0 0 0 0 2 0 13
FMC Corp. 18.6 0 0 0 0 0 0 0 2 2 3 N 0 2 0 2 0 0 0 0 0 0 0 2 0 13
Foot Locker Inc. 18.6 4 0 0 0 0 0 0 2 0 3 N 0 1 0 2 0 0 0 0 0 0 0 1 0 13
Laboratory Corp. of America Holdings 18.6 2 0 0 0 3 0 0 2 0 3 N 0 1 0 2 0 0 0 0 0 0 0 0 0 13
Sysco Corp. 18.6 0 0 0 0 0 0 0 2 0 3 N 1 1 2 2 0 0 0 0 0 0 0 2 0 13
Autodesk Inc. 17.1 2 0 0 0 0 0 0 2 0 3 N 0 1 2 2 0 0 0 0 0 0 0 0 0 12
Discovery Inc. 17.1 0 0 0 0 0 0 0 2 0 3 N 2 1 0 2 0 0 0 0 0 0 0 2 0 12
Flowserve Corp. 17.1 4 0 0 0 0 0 0 2 0 3 N 0 1 0 2 0 0 0 0 0 0 0 0 0 12
Stryker Corp. 17.1 4 0 0 0 0 0 0 1 0 3 N 0 1 0 1 0 0 0 0 0 0 0 0 2 12
TE Connectivity Ltd. 17.1 0 0 0 0 0 0 0 1 0 6 N 1 1 0 2 0 0 0 0 0 0 0 1 0 12
Viacom Inc. 17.1 4 0 0 0 0 0 0 2 0 3 N 0 0 0 2 0 0 0 0 0 0 0 0 1 12
Coty Inc. 15.7 2 0 2 0 0 0 0 1 0 3 N 0 1 0 2 0 0 0 0 0 0 0 0 0 11
Equifax Inc. 15.7 0 0 0 0 0 0 0 0 0 3 N 0 0 0 0 2 2 2 0 0 0 0 2 0 11
Kinder Morgan Inc. 15.7 4 0 0 0 0 0 0 1 0 3 N 0 1 0 2 0 0 0 0 0 0 0 0 0 11
Alliance Data Systems Corp. 14.3 0 0 0 0 0 0 0 2 0 3 N 1 1 1 2 0 0 0 0 0 0 0 0 0 10
Raymond James Financial Inc. 14.3 0 0 0 0 0 0 0 1 0 3 N 0 1 0 2 0 0 0 0 0 0 0 1 2 10
Verisk Analytics Inc. 14.3 0 0 0 0 0 0 0 2 0 3 N 0 0 1 2 0 0 0 0 0 0 0 0 2 10
Align Technology Inc. 12.9 0 0 0 0 0 0 0 2 0 3 N 0 0 0 2 0 0 0 0 0 0 0 0 2 9
DXC Technology Co. 12.9 4 0 0 0 0 0 0 0 0 3 N 0 1 0 0 0 0 0 0 0 0 0 1 0 9
Company Score(100%)
1 2 3 4 5 6 7 8 9 10 11 12 13 14 15 16 17 18 19 20 21 22 23 24 Raw score
Bot
tom
Tie
r
J.M. Smucker Co. 12.9 4 0 0 0 0 0 0 0 0 3 N 0 1 1 0 0 0 0 0 0 0 0 0 0 9
Leggett & Platt Inc. 12.9 0 0 0 0 0 0 0 0 0 3 N 1 0 1 0 0 0 0 0 0 0 0 2 2 9
Martin Marietta Materials Inc. 12.9 0 0 0 0 0 0 0 1 0 3 N 0 1 0 2 0 0 0 0 0 0 0 2 0 9
Mohawk Industries Inc. 12.9 0 0 0 0 0 0 0 2 0 3 N 0 0 0 2 1 0 0 0 0 1 0 0 0 9
Molson Coors Brewing Co. 12.9 0 0 0 0 0 0 0 2 0 3 N 0 0 0 2 0 0 0 0 0 0 0 2 0 9
SBA Communications Corp. 12.9 0 0 0 0 0 0 0 2 0 3 N 0 0 0 2 0 0 0 0 0 0 0 0 2 9
Baker Hughes Inc. 11.4 4 0 0 0 0 0 0 0 0 3 N 0 1 0 0 0 0 0 0 0 0 0 0 0 8
Carnival Corp. 11.4 0 0 0 0 0 0 0 2 0 3 N 0 1 0 2 0 0 0 0 0 0 0 0 0 8
CBS Corp. 11.4 0 0 0 0 0 0 0 2 0 3 N 0 1 0 2 0 0 0 0 0 0 0 0 0 8
Cimarex Energy Co. 11.4 0 0 0 0 0 0 0 2 0 3 N 0 1 0 2 0 0 0 0 0 0 0 0 0 8
Cognizant Technology Solutions Corp. 11.4 0 0 0 0 0 0 0 2 0 3 N 0 1 0 2 0 0 0 0 0 0 0 0 0 8
Concho Resources Inc. 11.4 0 0 0 0 0 0 0 2 0 3 N 0 1 0 2 0 0 0 0 0 0 0 0 0 8
Crown Castle International Corp. 11.4 0 0 0 0 0 0 0 2 0 3 N 0 1 0 2 0 0 0 0 0 0 0 0 0 8
General Growth Properties Inc. 11.4 0 0 0 0 0 0 0 2 0 3 N 0 1 0 2 0 0 0 0 0 0 0 0 0 8
Henry Schein Inc. 11.4 0 0 0 0 0 0 0 2 0 3 N 0 1 0 2 0 0 0 0 0 0 0 0 0 8
IPG Photonics Corp. 11.4 0 0 0 0 0 0 0 2 0 3 N 0 1 0 2 0 0 0 0 0 0 0 0 0 8
Microchip Technology Inc. 11.4 0 0 0 0 0 0 0 2 0 3 N 0 1 0 2 0 0 0 0 0 0 0 0 0 8
Prologis Inc. 11.4 0 0 0 0 0 0 0 2 0 3 N 0 1 0 2 0 0 0 0 0 0 0 0 0 8
Qorvo Inc. 11.4 0 0 0 0 0 0 0 2 0 3 N 0 1 0 2 0 0 0 0 0 0 0 0 0 8
TechnipFMC PLC 11.4 4 0 0 0 0 0 0 0 0 3 N 0 1 0 0 0 0 0 0 0 0 0 0 0 8
Akamai Technologies Inc. 10.0 0 0 0 0 0 0 0 2 0 3 N 0 0 0 2 0 0 0 0 0 0 0 0 0 7
Alaska Air Group 10.0 0 0 0 0 0 0 0 2 0 3 N 0 0 0 2 0 0 0 0 0 0 0 0 0 7
Alexion Pharmaceuticals Inc. 10.0 0 0 0 0 0 0 0 2 0 3 N 0 0 0 2 0 0 0 0 0 0 0 0 0 7
Ametek Inc. 10.0 0 0 0 0 0 0 0 1 0 3 N 0 1 0 2 0 0 0 0 0 0 0 0 0 7
Brown-Forman Corp. 10.0 0 0 0 0 0 0 0 2 0 3 N 0 0 0 2 0 0 0 0 0 0 0 0 0 7
C.H. Robinson Worldwide Inc. 10.0 0 0 0 0 0 0 0 2 0 3 N 0 0 0 2 0 0 0 0 0 0 0 0 0 7
Citizens Financial Group Inc. 10.0 0 0 0 0 0 0 0 1 0 3 N 0 1 0 2 0 0 0 0 0 0 0 0 0 7
CME Group Inc. 10.0 0 0 0 0 0 0 0 2 0 3 N 0 0 0 2 0 0 0 0 0 0 0 0 0 7
D.R. Horton Inc. 10.0 0 0 0 0 0 0 0 2 0 3 N 0 0 0 2 0 0 0 0 0 0 0 0 0 7
FLIR Systems Inc. 10.0 0 0 0 0 0 0 0 2 0 3 N 0 0 0 2 0 0 0 0 0 0 0 0 0 7
HCP Inc. 10.0 0 0 0 0 0 0 0 0 0 3 N 0 1 0 0 2 0 0 0 1 0 0 0 0 7
Incyte Corp. 10.0 0 0 0 0 0 0 0 2 0 3 N 0 0 0 2 0 0 0 0 0 0 0 0 0 7
KLA-Tencor Corp. 10.0 0 0 0 0 0 0 0 1 0 3 N 0 1 0 2 0 0 0 0 0 0 0 0 0 7
Kohls Corp. 10.0 0 0 0 0 0 0 0 2 0 3 N 0 0 0 2 0 0 0 0 0 0 0 0 0 7
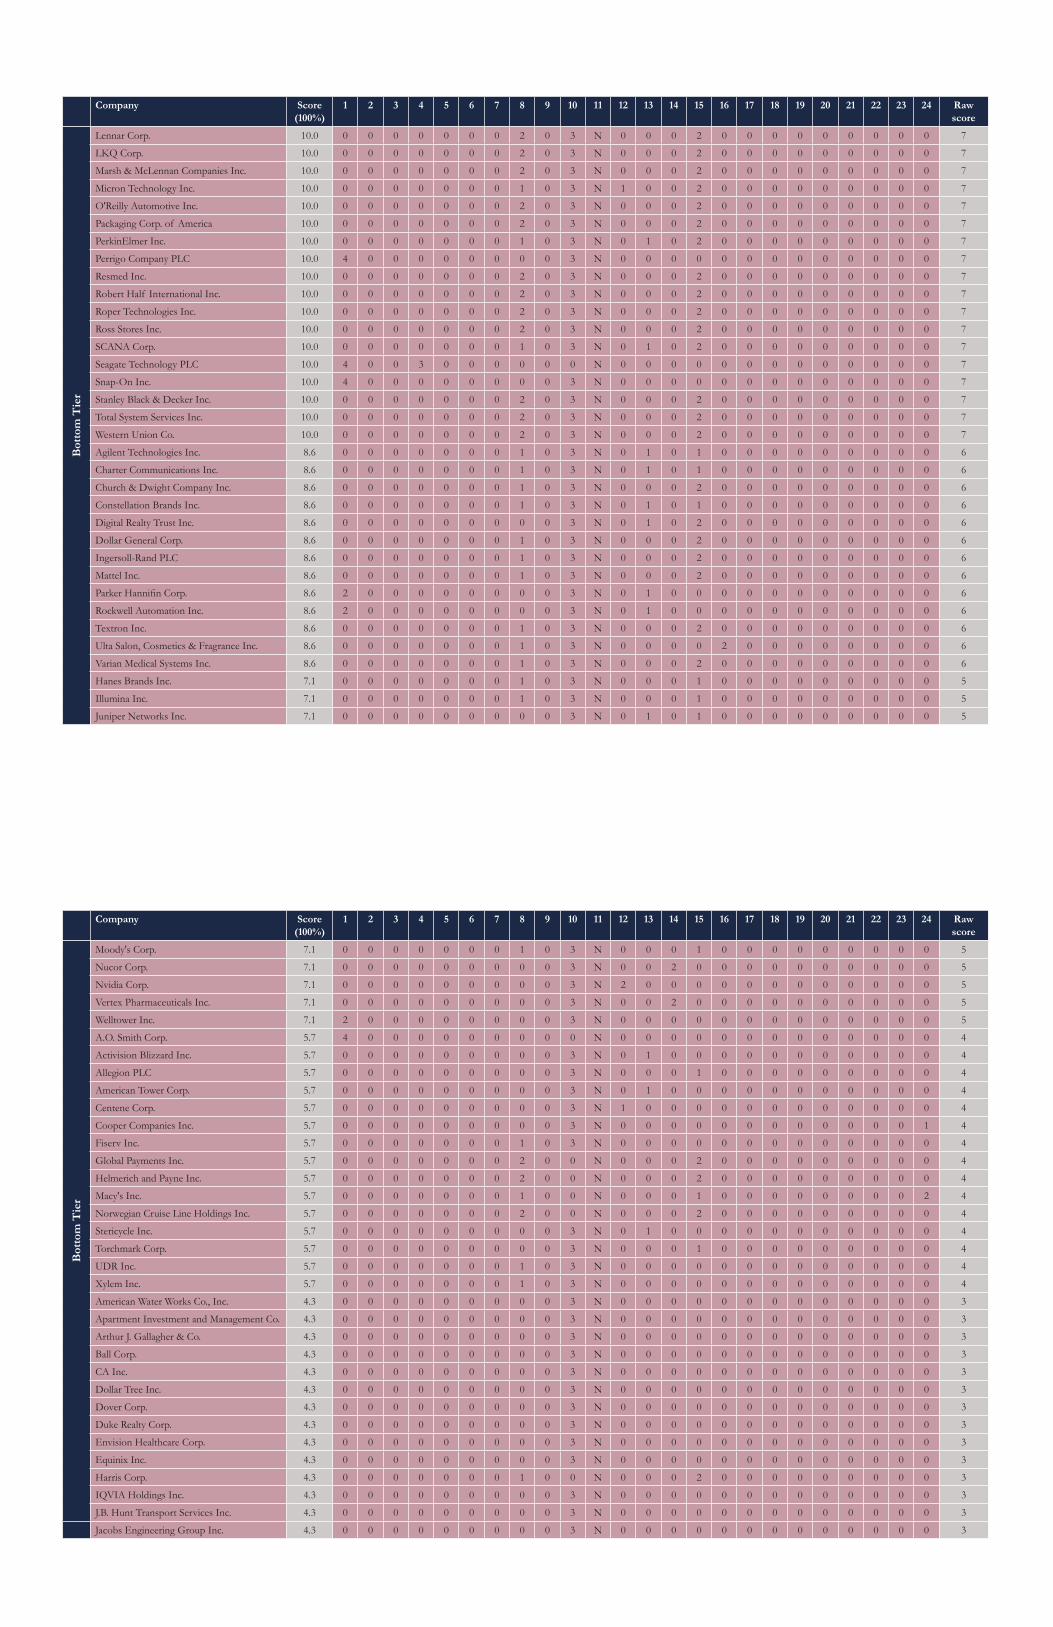
5051
Company Score(100%)
1 2 3 4 5 6 7 8 9 10 11 12 13 14 15 16 17 18 19 20 21 22 23 24 Raw score
Bot
tom
Tie
r
Lennar Corp. 10.0 0 0 0 0 0 0 0 2 0 3 N 0 0 0 2 0 0 0 0 0 0 0 0 0 7
LKQ Corp. 10.0 0 0 0 0 0 0 0 2 0 3 N 0 0 0 2 0 0 0 0 0 0 0 0 0 7
Marsh & McLennan Companies Inc. 10.0 0 0 0 0 0 0 0 2 0 3 N 0 0 0 2 0 0 0 0 0 0 0 0 0 7
Micron Technology Inc. 10.0 0 0 0 0 0 0 0 1 0 3 N 1 0 0 2 0 0 0 0 0 0 0 0 0 7
O'Reilly Automotive Inc. 10.0 0 0 0 0 0 0 0 2 0 3 N 0 0 0 2 0 0 0 0 0 0 0 0 0 7
Packaging Corp. of America 10.0 0 0 0 0 0 0 0 2 0 3 N 0 0 0 2 0 0 0 0 0 0 0 0 0 7
PerkinElmer Inc. 10.0 0 0 0 0 0 0 0 1 0 3 N 0 1 0 2 0 0 0 0 0 0 0 0 0 7
Perrigo Company PLC 10.0 4 0 0 0 0 0 0 0 0 3 N 0 0 0 0 0 0 0 0 0 0 0 0 0 7
Resmed Inc. 10.0 0 0 0 0 0 0 0 2 0 3 N 0 0 0 2 0 0 0 0 0 0 0 0 0 7
Robert Half International Inc. 10.0 0 0 0 0 0 0 0 2 0 3 N 0 0 0 2 0 0 0 0 0 0 0 0 0 7
Roper Technologies Inc. 10.0 0 0 0 0 0 0 0 2 0 3 N 0 0 0 2 0 0 0 0 0 0 0 0 0 7
Ross Stores Inc. 10.0 0 0 0 0 0 0 0 2 0 3 N 0 0 0 2 0 0 0 0 0 0 0 0 0 7
SCANA Corp. 10.0 0 0 0 0 0 0 0 1 0 3 N 0 1 0 2 0 0 0 0 0 0 0 0 0 7
Seagate Technology PLC 10.0 4 0 0 3 0 0 0 0 0 0 N 0 0 0 0 0 0 0 0 0 0 0 0 0 7
Snap-On Inc. 10.0 4 0 0 0 0 0 0 0 0 3 N 0 0 0 0 0 0 0 0 0 0 0 0 0 7
Stanley Black & Decker Inc. 10.0 0 0 0 0 0 0 0 2 0 3 N 0 0 0 2 0 0 0 0 0 0 0 0 0 7
Total System Services Inc. 10.0 0 0 0 0 0 0 0 2 0 3 N 0 0 0 2 0 0 0 0 0 0 0 0 0 7
Western Union Co. 10.0 0 0 0 0 0 0 0 2 0 3 N 0 0 0 2 0 0 0 0 0 0 0 0 0 7
Agilent Technologies Inc. 8.6 0 0 0 0 0 0 0 1 0 3 N 0 1 0 1 0 0 0 0 0 0 0 0 0 6
Charter Communications Inc. 8.6 0 0 0 0 0 0 0 1 0 3 N 0 1 0 1 0 0 0 0 0 0 0 0 0 6
Church & Dwight Company Inc. 8.6 0 0 0 0 0 0 0 1 0 3 N 0 0 0 2 0 0 0 0 0 0 0 0 0 6
Constellation Brands Inc. 8.6 0 0 0 0 0 0 0 1 0 3 N 0 1 0 1 0 0 0 0 0 0 0 0 0 6
Digital Realty Trust Inc. 8.6 0 0 0 0 0 0 0 0 0 3 N 0 1 0 2 0 0 0 0 0 0 0 0 0 6
Dollar General Corp. 8.6 0 0 0 0 0 0 0 1 0 3 N 0 0 0 2 0 0 0 0 0 0 0 0 0 6
Ingersoll-Rand PLC 8.6 0 0 0 0 0 0 0 1 0 3 N 0 0 0 2 0 0 0 0 0 0 0 0 0 6
Mattel Inc. 8.6 0 0 0 0 0 0 0 1 0 3 N 0 0 0 2 0 0 0 0 0 0 0 0 0 6
Parker Hannifin Corp. 8.6 2 0 0 0 0 0 0 0 0 3 N 0 1 0 0 0 0 0 0 0 0 0 0 0 6
Rockwell Automation Inc. 8.6 2 0 0 0 0 0 0 0 0 3 N 0 1 0 0 0 0 0 0 0 0 0 0 0 6
Textron Inc. 8.6 0 0 0 0 0 0 0 1 0 3 N 0 0 0 2 0 0 0 0 0 0 0 0 0 6
Ulta Salon, Cosmetics & Fragrance Inc. 8.6 0 0 0 0 0 0 0 1 0 3 N 0 0 0 0 2 0 0 0 0 0 0 0 0 6
Varian Medical Systems Inc. 8.6 0 0 0 0 0 0 0 1 0 3 N 0 0 0 2 0 0 0 0 0 0 0 0 0 6
Hanes Brands Inc. 7.1 0 0 0 0 0 0 0 1 0 3 N 0 0 0 1 0 0 0 0 0 0 0 0 0 5
Illumina Inc. 7.1 0 0 0 0 0 0 0 1 0 3 N 0 0 0 1 0 0 0 0 0 0 0 0 0 5
Juniper Networks Inc. 7.1 0 0 0 0 0 0 0 0 0 3 N 0 1 0 1 0 0 0 0 0 0 0 0 0 5
Company Score(100%)
1 2 3 4 5 6 7 8 9 10 11 12 13 14 15 16 17 18 19 20 21 22 23 24 Raw score
Bot
tom
Tie
r
Moody's Corp. 7.1 0 0 0 0 0 0 0 1 0 3 N 0 0 0 1 0 0 0 0 0 0 0 0 0 5
Nucor Corp. 7.1 0 0 0 0 0 0 0 0 0 3 N 0 0 2 0 0 0 0 0 0 0 0 0 0 5
Nvidia Corp. 7.1 0 0 0 0 0 0 0 0 0 3 N 2 0 0 0 0 0 0 0 0 0 0 0 0 5
Vertex Pharmaceuticals Inc. 7.1 0 0 0 0 0 0 0 0 0 3 N 0 0 2 0 0 0 0 0 0 0 0 0 0 5
Welltower Inc. 7.1 2 0 0 0 0 0 0 0 0 3 N 0 0 0 0 0 0 0 0 0 0 0 0 0 5
A.O. Smith Corp. 5.7 4 0 0 0 0 0 0 0 0 0 N 0 0 0 0 0 0 0 0 0 0 0 0 0 4
Activision Blizzard Inc. 5.7 0 0 0 0 0 0 0 0 0 3 N 0 1 0 0 0 0 0 0 0 0 0 0 0 4
Allegion PLC 5.7 0 0 0 0 0 0 0 0 0 3 N 0 0 0 1 0 0 0 0 0 0 0 0 0 4
American Tower Corp. 5.7 0 0 0 0 0 0 0 0 0 3 N 0 1 0 0 0 0 0 0 0 0 0 0 0 4
Centene Corp. 5.7 0 0 0 0 0 0 0 0 0 3 N 1 0 0 0 0 0 0 0 0 0 0 0 0 4
Cooper Companies Inc. 5.7 0 0 0 0 0 0 0 0 0 3 N 0 0 0 0 0 0 0 0 0 0 0 0 1 4
Fiserv Inc. 5.7 0 0 0 0 0 0 0 1 0 3 N 0 0 0 0 0 0 0 0 0 0 0 0 0 4
Global Payments Inc. 5.7 0 0 0 0 0 0 0 2 0 0 N 0 0 0 2 0 0 0 0 0 0 0 0 0 4
Helmerich and Payne Inc. 5.7 0 0 0 0 0 0 0 2 0 0 N 0 0 0 2 0 0 0 0 0 0 0 0 0 4
Macy's Inc. 5.7 0 0 0 0 0 0 0 1 0 0 N 0 0 0 1 0 0 0 0 0 0 0 0 2 4
Norwegian Cruise Line Holdings Inc. 5.7 0 0 0 0 0 0 0 2 0 0 N 0 0 0 2 0 0 0 0 0 0 0 0 0 4
Stericycle Inc. 5.7 0 0 0 0 0 0 0 0 0 3 N 0 1 0 0 0 0 0 0 0 0 0 0 0 4
Torchmark Corp. 5.7 0 0 0 0 0 0 0 0 0 3 N 0 0 0 1 0 0 0 0 0 0 0 0 0 4
UDR Inc. 5.7 0 0 0 0 0 0 0 1 0 3 N 0 0 0 0 0 0 0 0 0 0 0 0 0 4
Xylem Inc. 5.7 0 0 0 0 0 0 0 1 0 3 N 0 0 0 0 0 0 0 0 0 0 0 0 0 4
American Water Works Co., Inc. 4.3 0 0 0 0 0 0 0 0 0 3 N 0 0 0 0 0 0 0 0 0 0 0 0 0 3
Apartment Investment and Management Co. 4.3 0 0 0 0 0 0 0 0 0 3 N 0 0 0 0 0 0 0 0 0 0 0 0 0 3
Arthur J. Gallagher & Co. 4.3 0 0 0 0 0 0 0 0 0 3 N 0 0 0 0 0 0 0 0 0 0 0 0 0 3
Ball Corp. 4.3 0 0 0 0 0 0 0 0 0 3 N 0 0 0 0 0 0 0 0 0 0 0 0 0 3
CA Inc. 4.3 0 0 0 0 0 0 0 0 0 3 N 0 0 0 0 0 0 0 0 0 0 0 0 0 3
Dollar Tree Inc. 4.3 0 0 0 0 0 0 0 0 0 3 N 0 0 0 0 0 0 0 0 0 0 0 0 0 3
Dover Corp. 4.3 0 0 0 0 0 0 0 0 0 3 N 0 0 0 0 0 0 0 0 0 0 0 0 0 3
Duke Realty Corp. 4.3 0 0 0 0 0 0 0 0 0 3 N 0 0 0 0 0 0 0 0 0 0 0 0 0 3
Envision Healthcare Corp. 4.3 0 0 0 0 0 0 0 0 0 3 N 0 0 0 0 0 0 0 0 0 0 0 0 0 3
Equinix Inc. 4.3 0 0 0 0 0 0 0 0 0 3 N 0 0 0 0 0 0 0 0 0 0 0 0 0 3
Harris Corp. 4.3 0 0 0 0 0 0 0 1 0 0 N 0 0 0 2 0 0 0 0 0 0 0 0 0 3
IQVIA Holdings Inc. 4.3 0 0 0 0 0 0 0 0 0 3 N 0 0 0 0 0 0 0 0 0 0 0 0 0 3
J.B. Hunt Transport Services Inc. 4.3 0 0 0 0 0 0 0 0 0 3 N 0 0 0 0 0 0 0 0 0 0 0 0 0 3
Jacobs Engineering Group Inc. 4.3 0 0 0 0 0 0 0 0 0 3 N 0 0 0 0 0 0 0 0 0 0 0 0 0 3
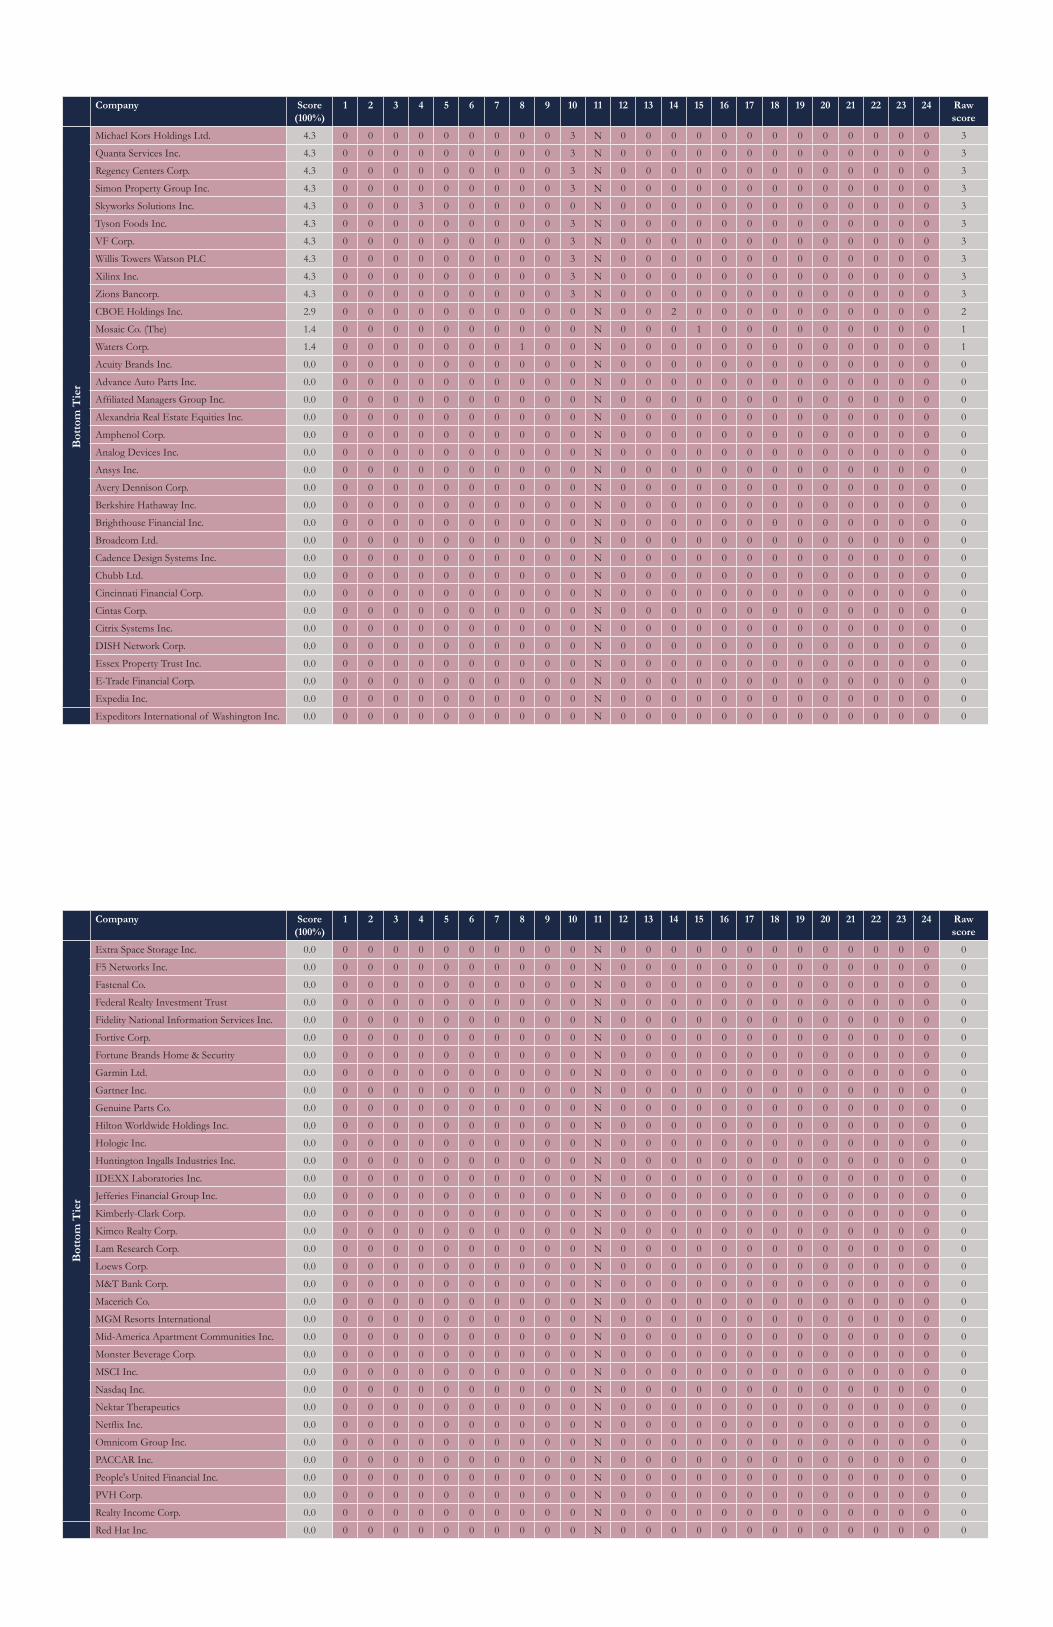
5253
Company Score(100%)
1 2 3 4 5 6 7 8 9 10 11 12 13 14 15 16 17 18 19 20 21 22 23 24 Raw score
Bot
tom
Tie
r
Michael Kors Holdings Ltd. 4.3 0 0 0 0 0 0 0 0 0 3 N 0 0 0 0 0 0 0 0 0 0 0 0 0 3
Quanta Services Inc. 4.3 0 0 0 0 0 0 0 0 0 3 N 0 0 0 0 0 0 0 0 0 0 0 0 0 3
Regency Centers Corp. 4.3 0 0 0 0 0 0 0 0 0 3 N 0 0 0 0 0 0 0 0 0 0 0 0 0 3
Simon Property Group Inc. 4.3 0 0 0 0 0 0 0 0 0 3 N 0 0 0 0 0 0 0 0 0 0 0 0 0 3
Skyworks Solutions Inc. 4.3 0 0 0 3 0 0 0 0 0 0 N 0 0 0 0 0 0 0 0 0 0 0 0 0 3
Tyson Foods Inc. 4.3 0 0 0 0 0 0 0 0 0 3 N 0 0 0 0 0 0 0 0 0 0 0 0 0 3
VF Corp. 4.3 0 0 0 0 0 0 0 0 0 3 N 0 0 0 0 0 0 0 0 0 0 0 0 0 3
Willis Towers Watson PLC 4.3 0 0 0 0 0 0 0 0 0 3 N 0 0 0 0 0 0 0 0 0 0 0 0 0 3
Xilinx Inc. 4.3 0 0 0 0 0 0 0 0 0 3 N 0 0 0 0 0 0 0 0 0 0 0 0 0 3
Zions Bancorp. 4.3 0 0 0 0 0 0 0 0 0 3 N 0 0 0 0 0 0 0 0 0 0 0 0 0 3
CBOE Holdings Inc. 2.9 0 0 0 0 0 0 0 0 0 0 N 0 0 2 0 0 0 0 0 0 0 0 0 0 2
Mosaic Co. (The) 1.4 0 0 0 0 0 0 0 0 0 0 N 0 0 0 1 0 0 0 0 0 0 0 0 0 1
Waters Corp. 1.4 0 0 0 0 0 0 0 1 0 0 N 0 0 0 0 0 0 0 0 0 0 0 0 0 1
Acuity Brands Inc. 0.0 0 0 0 0 0 0 0 0 0 0 N 0 0 0 0 0 0 0 0 0 0 0 0 0 0
Advance Auto Parts Inc. 0.0 0 0 0 0 0 0 0 0 0 0 N 0 0 0 0 0 0 0 0 0 0 0 0 0 0
Affiliated Managers Group Inc. 0.0 0 0 0 0 0 0 0 0 0 0 N 0 0 0 0 0 0 0 0 0 0 0 0 0 0
Alexandria Real Estate Equities Inc. 0.0 0 0 0 0 0 0 0 0 0 0 N 0 0 0 0 0 0 0 0 0 0 0 0 0 0
Amphenol Corp. 0.0 0 0 0 0 0 0 0 0 0 0 N 0 0 0 0 0 0 0 0 0 0 0 0 0 0
Analog Devices Inc. 0.0 0 0 0 0 0 0 0 0 0 0 N 0 0 0 0 0 0 0 0 0 0 0 0 0 0
Ansys Inc. 0.0 0 0 0 0 0 0 0 0 0 0 N 0 0 0 0 0 0 0 0 0 0 0 0 0 0
Avery Dennison Corp. 0.0 0 0 0 0 0 0 0 0 0 0 N 0 0 0 0 0 0 0 0 0 0 0 0 0 0
Berkshire Hathaway Inc. 0.0 0 0 0 0 0 0 0 0 0 0 N 0 0 0 0 0 0 0 0 0 0 0 0 0 0
Brighthouse Financial Inc. 0.0 0 0 0 0 0 0 0 0 0 0 N 0 0 0 0 0 0 0 0 0 0 0 0 0 0
Broadcom Ltd. 0.0 0 0 0 0 0 0 0 0 0 0 N 0 0 0 0 0 0 0 0 0 0 0 0 0 0
Cadence Design Systems Inc. 0.0 0 0 0 0 0 0 0 0 0 0 N 0 0 0 0 0 0 0 0 0 0 0 0 0 0
Chubb Ltd. 0.0 0 0 0 0 0 0 0 0 0 0 N 0 0 0 0 0 0 0 0 0 0 0 0 0 0
Cincinnati Financial Corp. 0.0 0 0 0 0 0 0 0 0 0 0 N 0 0 0 0 0 0 0 0 0 0 0 0 0 0
Cintas Corp. 0.0 0 0 0 0 0 0 0 0 0 0 N 0 0 0 0 0 0 0 0 0 0 0 0 0 0
Citrix Systems Inc. 0.0 0 0 0 0 0 0 0 0 0 0 N 0 0 0 0 0 0 0 0 0 0 0 0 0 0
DISH Network Corp. 0.0 0 0 0 0 0 0 0 0 0 0 N 0 0 0 0 0 0 0 0 0 0 0 0 0 0
Essex Property Trust Inc. 0.0 0 0 0 0 0 0 0 0 0 0 N 0 0 0 0 0 0 0 0 0 0 0 0 0 0
E-Trade Financial Corp. 0.0 0 0 0 0 0 0 0 0 0 0 N 0 0 0 0 0 0 0 0 0 0 0 0 0 0
Expedia Inc. 0.0 0 0 0 0 0 0 0 0 0 0 N 0 0 0 0 0 0 0 0 0 0 0 0 0 0
Expeditors International of Washington Inc. 0.0 0 0 0 0 0 0 0 0 0 0 N 0 0 0 0 0 0 0 0 0 0 0 0 0 0
Company Score(100%)
1 2 3 4 5 6 7 8 9 10 11 12 13 14 15 16 17 18 19 20 21 22 23 24 Raw score
Bot
tom
Tie
r
Extra Space Storage Inc. 0.0 0 0 0 0 0 0 0 0 0 0 N 0 0 0 0 0 0 0 0 0 0 0 0 0 0
F5 Networks Inc. 0.0 0 0 0 0 0 0 0 0 0 0 N 0 0 0 0 0 0 0 0 0 0 0 0 0 0
Fastenal Co. 0.0 0 0 0 0 0 0 0 0 0 0 N 0 0 0 0 0 0 0 0 0 0 0 0 0 0
Federal Realty Investment Trust 0.0 0 0 0 0 0 0 0 0 0 0 N 0 0 0 0 0 0 0 0 0 0 0 0 0 0
Fidelity National Information Services Inc. 0.0 0 0 0 0 0 0 0 0 0 0 N 0 0 0 0 0 0 0 0 0 0 0 0 0 0
Fortive Corp. 0.0 0 0 0 0 0 0 0 0 0 0 N 0 0 0 0 0 0 0 0 0 0 0 0 0 0
Fortune Brands Home & Security 0.0 0 0 0 0 0 0 0 0 0 0 N 0 0 0 0 0 0 0 0 0 0 0 0 0 0
Garmin Ltd. 0.0 0 0 0 0 0 0 0 0 0 0 N 0 0 0 0 0 0 0 0 0 0 0 0 0 0
Gartner Inc. 0.0 0 0 0 0 0 0 0 0 0 0 N 0 0 0 0 0 0 0 0 0 0 0 0 0 0
Genuine Parts Co. 0.0 0 0 0 0 0 0 0 0 0 0 N 0 0 0 0 0 0 0 0 0 0 0 0 0 0
Hilton Worldwide Holdings Inc. 0.0 0 0 0 0 0 0 0 0 0 0 N 0 0 0 0 0 0 0 0 0 0 0 0 0 0
Hologic Inc. 0.0 0 0 0 0 0 0 0 0 0 0 N 0 0 0 0 0 0 0 0 0 0 0 0 0 0
Huntington Ingalls Industries Inc. 0.0 0 0 0 0 0 0 0 0 0 0 N 0 0 0 0 0 0 0 0 0 0 0 0 0 0
IDEXX Laboratories Inc. 0.0 0 0 0 0 0 0 0 0 0 0 N 0 0 0 0 0 0 0 0 0 0 0 0 0 0
Jefferies Financial Group Inc. 0.0 0 0 0 0 0 0 0 0 0 0 N 0 0 0 0 0 0 0 0 0 0 0 0 0 0
Kimberly-Clark Corp. 0.0 0 0 0 0 0 0 0 0 0 0 N 0 0 0 0 0 0 0 0 0 0 0 0 0 0
Kimco Realty Corp. 0.0 0 0 0 0 0 0 0 0 0 0 N 0 0 0 0 0 0 0 0 0 0 0 0 0 0
Lam Research Corp. 0.0 0 0 0 0 0 0 0 0 0 0 N 0 0 0 0 0 0 0 0 0 0 0 0 0 0
Loews Corp. 0.0 0 0 0 0 0 0 0 0 0 0 N 0 0 0 0 0 0 0 0 0 0 0 0 0 0
M&T Bank Corp. 0.0 0 0 0 0 0 0 0 0 0 0 N 0 0 0 0 0 0 0 0 0 0 0 0 0 0
Macerich Co. 0.0 0 0 0 0 0 0 0 0 0 0 N 0 0 0 0 0 0 0 0 0 0 0 0 0 0
MGM Resorts International 0.0 0 0 0 0 0 0 0 0 0 0 N 0 0 0 0 0 0 0 0 0 0 0 0 0 0
Mid-America Apartment Communities Inc. 0.0 0 0 0 0 0 0 0 0 0 0 N 0 0 0 0 0 0 0 0 0 0 0 0 0 0
Monster Beverage Corp. 0.0 0 0 0 0 0 0 0 0 0 0 N 0 0 0 0 0 0 0 0 0 0 0 0 0 0
MSCI Inc. 0.0 0 0 0 0 0 0 0 0 0 0 N 0 0 0 0 0 0 0 0 0 0 0 0 0 0
Nasdaq Inc. 0.0 0 0 0 0 0 0 0 0 0 0 N 0 0 0 0 0 0 0 0 0 0 0 0 0 0
Nektar Therapeutics 0.0 0 0 0 0 0 0 0 0 0 0 N 0 0 0 0 0 0 0 0 0 0 0 0 0 0
Netflix Inc. 0.0 0 0 0 0 0 0 0 0 0 0 N 0 0 0 0 0 0 0 0 0 0 0 0 0 0
Omnicom Group Inc. 0.0 0 0 0 0 0 0 0 0 0 0 N 0 0 0 0 0 0 0 0 0 0 0 0 0 0
PACCAR Inc. 0.0 0 0 0 0 0 0 0 0 0 0 N 0 0 0 0 0 0 0 0 0 0 0 0 0 0
People's United Financial Inc. 0.0 0 0 0 0 0 0 0 0 0 0 N 0 0 0 0 0 0 0 0 0 0 0 0 0 0
PVH Corp. 0.0 0 0 0 0 0 0 0 0 0 0 N 0 0 0 0 0 0 0 0 0 0 0 0 0 0
Realty Income Corp. 0.0 0 0 0 0 0 0 0 0 0 0 N 0 0 0 0 0 0 0 0 0 0 0 0 0 0
Red Hat Inc. 0.0 0 0 0 0 0 0 0 0 0 0 N 0 0 0 0 0 0 0 0 0 0 0 0 0 0
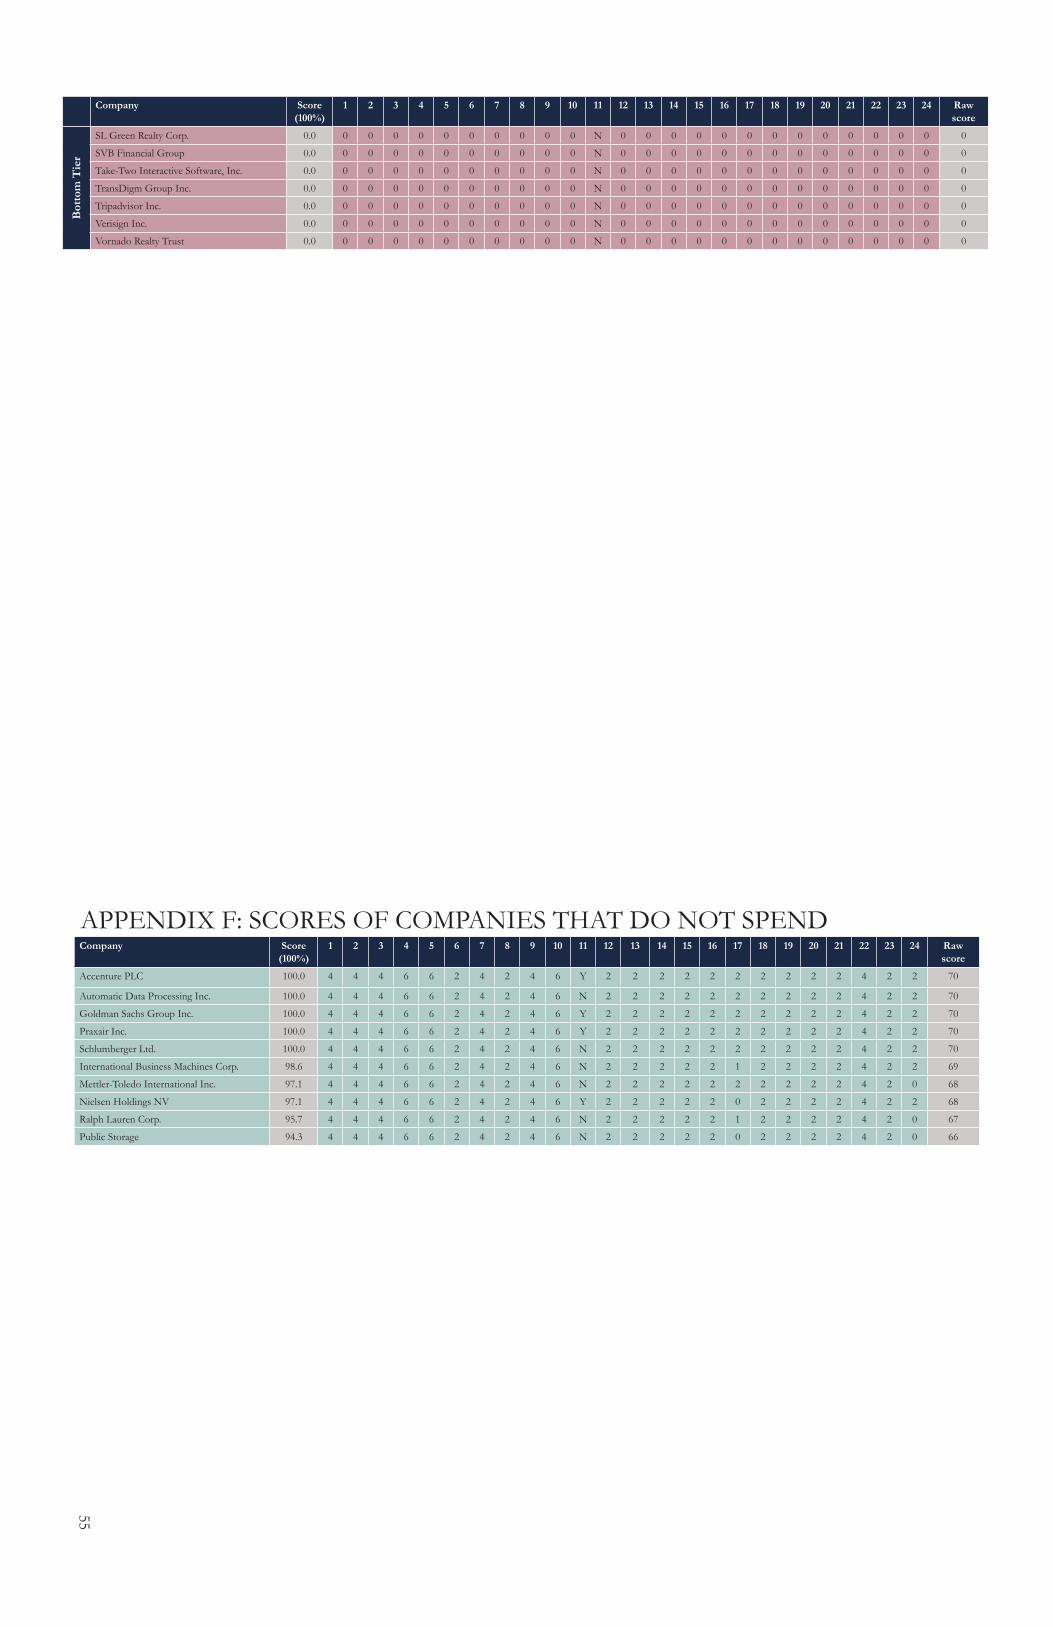
5455
Company Score(100%)
1 2 3 4 5 6 7 8 9 10 11 12 13 14 15 16 17 18 19 20 21 22 23 24 Raw score
Bot
tom
Tie
r
SL Green Realty Corp. 0.0 0 0 0 0 0 0 0 0 0 0 N 0 0 0 0 0 0 0 0 0 0 0 0 0 0
SVB Financial Group 0.0 0 0 0 0 0 0 0 0 0 0 N 0 0 0 0 0 0 0 0 0 0 0 0 0 0
Take-Two Interactive Software, Inc. 0.0 0 0 0 0 0 0 0 0 0 0 N 0 0 0 0 0 0 0 0 0 0 0 0 0 0
TransDigm Group Inc. 0.0 0 0 0 0 0 0 0 0 0 0 N 0 0 0 0 0 0 0 0 0 0 0 0 0 0
Tripadvisor Inc. 0.0 0 0 0 0 0 0 0 0 0 0 N 0 0 0 0 0 0 0 0 0 0 0 0 0 0
Verisign Inc. 0.0 0 0 0 0 0 0 0 0 0 0 N 0 0 0 0 0 0 0 0 0 0 0 0 0 0
Vornado Realty Trust 0.0 0 0 0 0 0 0 0 0 0 0 N 0 0 0 0 0 0 0 0 0 0 0 0 0 0
Company Score(100%)
1 2 3 4 5 6 7 8 9 10 11 12 13 14 15 16 17 18 19 20 21 22 23 24 Raw score
Accenture PLC 100.0 4 4 4 6 6 2 4 2 4 6 Y 2 2 2 2 2 2 2 2 2 2 4 2 2 70
Automatic Data Processing Inc. 100.0 4 4 4 6 6 2 4 2 4 6 N 2 2 2 2 2 2 2 2 2 2 4 2 2 70
Goldman Sachs Group Inc. 100.0 4 4 4 6 6 2 4 2 4 6 Y 2 2 2 2 2 2 2 2 2 2 4 2 2 70
Praxair Inc. 100.0 4 4 4 6 6 2 4 2 4 6 Y 2 2 2 2 2 2 2 2 2 2 4 2 2 70
Schlumberger Ltd. 100.0 4 4 4 6 6 2 4 2 4 6 N 2 2 2 2 2 2 2 2 2 2 4 2 2 70
International Business Machines Corp. 98.6 4 4 4 6 6 2 4 2 4 6 N 2 2 2 2 2 1 2 2 2 2 4 2 2 69
Mettler-Toledo International Inc. 97.1 4 4 4 6 6 2 4 2 4 6 N 2 2 2 2 2 2 2 2 2 2 4 2 0 68
Nielsen Holdings NV 97.1 4 4 4 6 6 2 4 2 4 6 Y 2 2 2 2 2 0 2 2 2 2 4 2 2 68
Ralph Lauren Corp. 95.7 4 4 4 6 6 2 4 2 4 6 N 2 2 2 2 2 1 2 2 2 2 4 2 0 67
Public Storage 94.3 4 4 4 6 6 2 4 2 4 6 N 2 2 2 2 2 0 2 2 2 2 4 2 0 66
APPENDIX F: SCORES OF COMPANIES THAT DO NOT SPEND
For more information on the Center for Political Accountability, visit http://politicalaccountability.net