Embed Size (px)
Citation preview

Construction ReportConstruction Report
REGIONal aNalysIswhat are your neighbors doing?
buIldING tRENdshow are construction dollars being used?
NatIONal statIstIcswhat happened in 2010?what will happen in 2011?
16th annual report
the 2011 schoolthe 2011 school

www.planning4education.comCR2 Sp&m — 2011 annual ScHool conStRuction RepoRt / February 2011
In the 16 years sInce 1995, school districts in the United States have put more than $285 billion worth of construction in place, including $160 billion for new schools, $67 billion to add space to existing schools and $53 billion to upgrade existing buildings. Spending in that period rose from just over $10 billion annually to more than $20 billion per annum during each of the first eight years of the 21st century. In the last three years, it has fallen significantly to just $14.5 billion last year and a projected $13.4 billion in 2011. There has also been a change in how the money was spent. From 1995 through 2001, more than half the construction dollars went towards additions to, and upgrading of, existing buildings. Starting in 2002, the pendulum has swung sharply towards providing new buildings and, possibly, neglecting the old. There is some indication that, starting in 2010, school districts are putting a larger percentage of capital funds into existing buildings rather than building new. Whether that is a trend or just a blip remains to be seen.
$25B
$20B
$15B
$10B
$5B
$0
1995 1996 1997 1998 1999 2000 2001 2002 2003 2004 2005 2006 2007 2008 2009 2010 2011
Total Construction
New
Additions/Retrofits Combined
2011 Projected Total Construction
$13,353,171
SCHOOL CONSTRUCTION COMPLETED, 1995 THROUGH 2011 (Projected)
Total school construction fell in 2010 for the third consecutive year, but even so, more than $14.5 billion
dollars of construction was put in place. Schools are still one of the largest construc-tion markets in the United States.
But, there is no question that the school construction boom has quieted. During the first years of this century, school construc-tion totaled at least $20 billion annually. Then, as the nation’s economy slowed, school construction spending slowed, too, falling to $19.5 billion in 2008, then dropping almost 16 percent in 2009 to just $16.4 billion. It was down another 12 percent last year and, if pro-jections prove correct, could fall again in 2011.
Not only has construction fallen, but there appear to be some significant changes in the makeup of what was completed.
Almost 73 percent of construction in 2009 was of new school buildings. New school buildings accounted for less than 60 percent of construction spending in 2010, suggesting a shift to using less abundant construction dollars to upgrade and add to existing buildings.
It is interesting to note that while overall construction fell more than $1.8 billion last year, spending on additions and renovation projects rose by more than $1.4 billion, a significant switch in construction strategy and activity.
These are among the major findings and conclusions to be drawn from School Planning & Management’s 16th Annual School Construction Report.
To prepare this report, School Planning & Management received information on school
construction completed and underway dur-ing 2010 and planned to start in 2011 from Market Data Retrieval (MDR), a company of Dun and Bradstreet (D&B). MDR contacts school districts throughout the United States seeking information on their construction plans — new buildings, additions to exist-ing buildings and major renovation, retrofit or modernization projects. We take that project information and use it to estimate construction on a national and regional basis, and to report on how dollars are being spent on new schools.
All of the figures published are “annual in nature.” That is, they do not accumulate ongoing construction, but rather compile information on what was completed or expected to be completed or started in a given calendar year. School districts may be involved in more construction, but work started or completed outside the targeted years is not included.
The National SceneSchool districts in the United States
spent just over $14.5 billion on construc-tion projects completed during the 2010 calendar year, including almost $8.7 billion on new schools (accounting for 59.6
Fewer dollars mean more renovations and additions. By PaUL aBRaMSON
School Construction Spending Shifts Gears
16th annual school construction report
1
2
3
4
5
6
7
8
9
10
11
12
Nat’l
Region New Schools New Addition Renovation% of
Nation% of SpeNdiNg foR
$312,331
$513,348
$541,173
$1,012,550
$1,337,912
$359,603
$309,283
$217,620
$1,653,853
$548,231
$1,605,375
$258,182
$8,669,459
Additions
$93,965
$392,482
$133,923
$202,689
$327,624
$286,289
$206,136
$231,374
$479,615
$130,878
$407,300
$181,797
$3,074,072
Renovation
$246,624
$588,861
$154,155
$115,020
$175,897
$278,887
$135,252
$187,821
$387,774
$93,277
$275,185
$158,073
$2,796,826
Total
$652,920
$1,494,691
$829,252
$1,330,259
$1,841,432
$924,778
$650,671
$636,814
$2,521,241
$772,386
$2,287,859
$598,052
$14,540,356
47.8%
34.3%
65.3%
76.1%
72.7%
38.9%
47.5%
34.2%
65.6%
71.0%
70.2%
43.2%
59.6%
14.4%
26.3%
16.1%
15.2%
17.8%
31.0%
31.7%
36.3%
19.0%
16.9%
17.8%
30.4%
21.1%
37.8%
39.4%
18.6%
8.6%
9.6%
30.2%
20.8%
29.5%
15.4%
12.1%
12.0%
26.4%
19.2%
4.5%
10.3%
5.7%
9.1%
12.7%
6.4%
4.5%
4.4%
17.3%
5.3%
15.7%
4.1%
100.0%
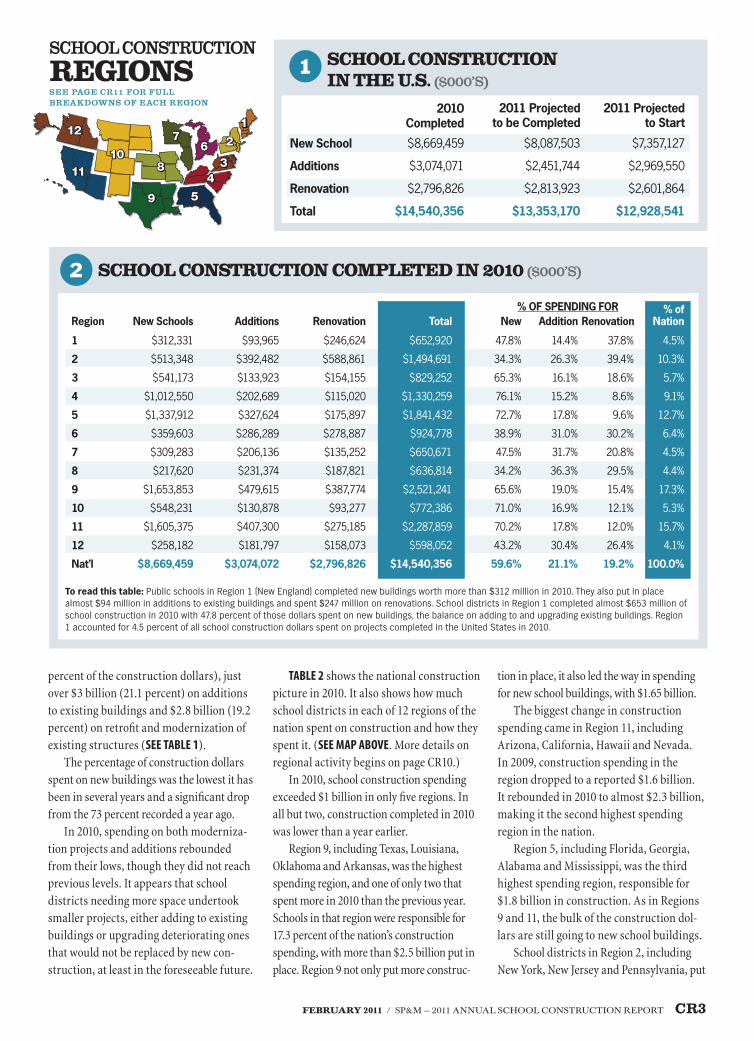
2 SChool ConStRuCtion Completed in 2010 ($000’s)
To read this table: Public schools in Region 1 (New England) completed new buildings worth more than $312 million in 2010. They also put in place almost $94 million in additions to existing buildings and spent $247 million on renovations. School districts in Region 1 completed almost $653 million of school construction in 2010 with 47.8 percent of those dollars spent on new buildings, the balance on adding to and upgrading existing buildings. Region 1 accounted for 4.5 percent of all school construction dollars spent on projects completed in the United States in 2010.
2010Completed
2011 projected to be Completed
2011 projected to Start
1 SChool ConStRuCtion in the u.S. ($000’s)
New School
Additions
Renovation
Total
$8,669,459
$3,074,071
$2,796,826
$14,540,356
$8,087,503
$2,451,744
$2,813,923
$13,353,170
$7,357,127
$2,969,550
$2,601,864
$12,928,541
111212
22
3344
55
6677
88
99
10101111
school construction
RegionSsee page cr11 for full breakdowns of each region
February 2011 / Sp&m — 2011 annual ScHool conStRuction RepoRt CR3
percent of the construction dollars), just over $3 billion (21.1 percent) on additions to existing buildings and $2.8 billion (19.2 percent) on retrofit and modernization of existing structures (sEE tablE 1).
The percentage of construction dollars spent on new buildings was the lowest it has been in several years and a significant drop from the 73 percent recorded a year ago.
In 2010, spending on both moderniza-tion projects and additions rebounded from their lows, though they did not reach previous levels. It appears that school districts needing more space undertook smaller projects, either adding to existing buildings or upgrading deteriorating ones that would not be replaced by new con-struction, at least in the foreseeable future.
tablE 2 shows the national construction picture in 2010. It also shows how much school districts in each of 12 regions of the nation spent on construction and how they spent it. (sEE map abOvE. More details on regional activity begins on page CR10.)
In 2010, school construction spending exceeded $1 billion in only five regions. In all but two, construction completed in 2010 was lower than a year earlier.
Region 9, including Texas, Louisiana, Oklahoma and Arkansas, was the highest spending region, and one of only two that spent more in 2010 than the previous year. Schools in that region were responsible for 17.3 percent of the nation’s construction spending, with more than $2.5 billion put in place. Region 9 not only put more construc-
tion in place, it also led the way in spending for new school buildings, with $1.65 billion.
The biggest change in construction spending came in Region 11, including Arizona, California, Hawaii and Nevada. In 2009, construction spending in the region dropped to a reported $1.6 billion. It rebounded in 2010 to almost $2.3 billion, making it the second highest spending region in the nation.
Region 5, including Florida, Georgia, Alabama and Mississippi, was the third highest spending region, responsible for $1.8 billion in construction. As in Regions 9 and 11, the bulk of the construction dol-lars are still going to new school buildings.
School districts in Region 2, including New York, New Jersey and Pennsylvania, put

www.planning4education.com
3 ConStRuCtion expeCted to be Completed in 2011 ($000’s)
1
2
3
4
5
6
7
8
9
10
11
12
Nat’l
Region New Schools New Addition Renovation% of
Nation% of SpeNdiNg foR
$459,212
$551,985
$662,760
$827,523
$1,058,564
$442,253
$202,071
$412,599
$1,412,981
$402,619
$1,376,781
$278,156
$8,087,503
Additions
$138,487
$293,335
$151,482
$137,799
$431,202
$157,000
$167,269
$192,133
$245,293
$77,886
$270,342
$189,515
$2,451,745
Renovation
$172,195
$449,218
$178,806
$261,525
$199,762
$283,985
$208,831
$139,619
$327,957
$46,727
$348,263
$197,036
$2,813,923
Total
$769,894
$1,294,538
$993,048
$1,226,847
$1,689,528
$883,237
$578,171
$744,352
$1,986,232
$527,231
$1,995,386
$664,707
$13,353,171
59.6%
42.6%
66.7%
67.5%
62.7%
50.1%
34.9%
55.4%
71.1%
76.4%
69.0%
41.8%
60.6%
18.0%
22.7%
15.3%
11.2%
25.5%
17.8%
28.9%
25.8%
12.3%
14.8%
13.5%
28.5%
18.4%
22.4%
34.7%
18.0%
21.3%
11.8%
32.2%
36.1%
18.8%
16.5%
8.9%
17.5%
29.6%
21.1%
5.8%
9.7%
7.4%
9.2%
12.7%
6.6%
4.3%
5.6%
14.9%
3.9%
14.9%
5.0%
100.0%
To read this table: In 2011, public schools in Region 1 (New England) are expecting to complete new buildings worth $459 million. They also expect to complete additions worth $138 million and renovations valued at $172 million. Total spending in Region 1 is projected at almost $770 million, with 59.6 percent of the dollars for new buildings, the balance for additions and renovations. New England is projected to account for 5.8 percent of all school construction dollars spent in the nation on schools completed in 2011.
CR4 Sp&m — 2011 annual ScHool conStRuction RepoRt / February 2011
almost $1.5 billion of school construction in place in 2010, a 17 percent drop from the year before. Districts in these states, which are not gaining in population, spend just a third of their construction dollars on new buildings, but they continue to invest in their existing structures, putting almost 40 percent into retrofitting existing buildings.
Districts in Region 4 (North Carolina, South Carolina, Kentucky and Tennessee) spent $1.3 billion last year, with 76 percent of that on new schools. While construction spending remains high in these four states, it was 20 percent lower than its activity just a year earlier. New schools are the driving force.
Region 6 (Indiana, Michigan and Ohio) school districts spent $924 million last year, and those in Region 3 (Delaware, District of Columbia, Maryland, Virginia and West Virginia) reported just $829 mil-lion in completed work. Each region spent more than a billion dollars in each of the previous five years.
Region 10 (Colorado, Montana, New Mexico, North Dakota, South Dakota, Utah and Wyoming) covers many of the least populated areas of the nation, but includes important pockets of growth. The fact that 75 percent of the $772 million invested in school construction went to new schools
probably reflects that growth. Each of the other four regions put about
$600 million of construction in place last year. Region 1 (Connecticut, Maine, Mas-sachusetts, New Hampshire, Rhode Island and Vermont) was responsible for $653 million, with more than half of it spent on existing buildings. Region 7 (Illinois, Minnesota and Wisconsin) spent just about the same amount of money and used it in a similar manner.
Region 8 (Iowa, Kansas, Missouri and Nebraska), divided its $636 million spend-ing pretty evenly among new buildings, additional space and renovation. Region 12 (Alaska, Idaho, Oregon and Washington) was the lowest spending region at $598 million, and also put the majority of its dollars into existing structures.
What’s Underway Now?tablE 3 examines construction that
school districts say they will complete in 2011. If these projections are accurate, total construction this year will fall to $13.4 bil-lion, somewhat less than was projected for 2011 a year ago. If the pattern holds, actual completions should exceed the projections.
The same five regions that do most con-struction, at least on a dollar basis, expect
to be the busiest again, but school districts in all of them predict that they will be less active, in terms of completed construc-tion. If the projections hold up, completion of new schools will account for about 60 percent of the dollars spent.
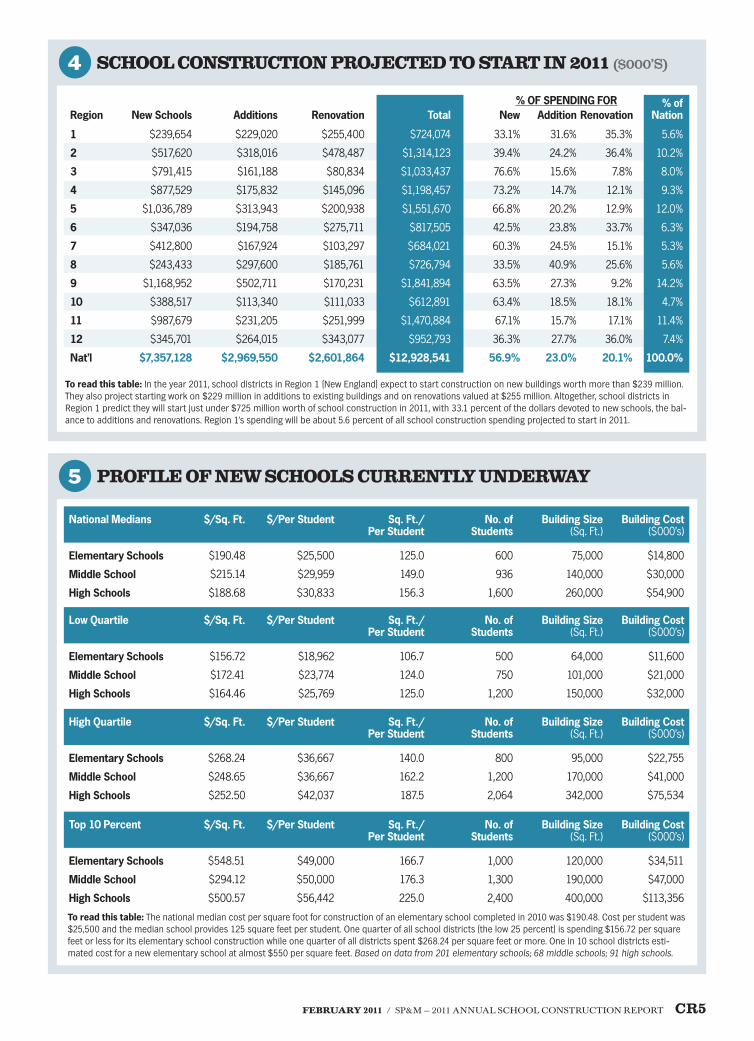
Looking AheadtablE 4 reports on construction that
is projected to start this year. It is perhaps the truest picture of the mood of the school construction market, with districts across the board reluctant to predict that they will have the dollars necessary to get their needed construction underway. The total shown (less than $13 billion) is the lowest we have seen projected in more than a decade. There is little optimism that scheduled bond votes will pass and resulting construction go forward. The mood of the nation may change, but of late, education in general has had a difficult time getting political and financial support for on-going educational programs. The chances of getting support for construction seem poor.
New Schools Completed in 2010tablE 5 provides a profile, on a national
basis, of new schools that were completed in 2010. The figures are medians. That means, for example, that among elementary schools
5 pRofile of new SChoolS CuRRently undeRway
4 SChool ConStRuCtion pRojeCted to StaRt in 2011 ($000’s)
1
2
3
4
5
6
7
8
9
10
11
12
Nat’l
Region New Schools New Addition Renovation% of
Nation% of SpeNdiNg foR
$239,654
$517,620
$791,415
$877,529
$1,036,789
$347,036
$412,800
$243,433
$1,168,952
$388,517
$987,679
$345,701
$7,357,128
Additions
$229,020
$318,016
$161,188
$175,832
$313,943
$194,758
$167,924
$297,600
$502,711
$113,340
$231,205
$264,015
$2,969,550
Renovation
$255,400
$478,487
$80,834
$145,096
$200,938
$275,711
$103,297
$185,761
$170,231
$111,033
$251,999
$343,077
$2,601,864
Total
$724,074
$1,314,123
$1,033,437
$1,198,457
$1,551,670
$817,505
$684,021
$726,794
$1,841,894
$612,891
$1,470,884
$952,793
$12,928,541
33.1%
39.4%
76.6%
73.2%
66.8%
42.5%
60.3%
33.5%
63.5%
63.4%
67.1%
36.3%
56.9%
31.6%
24.2%
15.6%
14.7%
20.2%
23.8%
24.5%
40.9%
27.3%
18.5%
15.7%
27.7%
23.0%
35.3%
36.4%
7.8%
12.1%
12.9%
33.7%
15.1%
25.6%
9.2%
18.1%
17.1%
36.0%
20.1%
5.6%
10.2%
8.0%
9.3%
12.0%
6.3%
5.3%
5.6%
14.2%
4.7%
11.4%
7.4%
100.0%
To read this table: In the year 2011, school districts in Region 1 (New England) expect to start construction on new buildings worth more than $239 million. They also project starting work on $229 million in additions to existing buildings and on renovations valued at $255 million. Altogether, school districts in Region 1 predict they will start just under $725 million worth of school construction in 2011, with 33.1 percent of the dollars devoted to new schools, the bal-ance to additions and renovations. Region 1’s spending will be about 5.6 percent of all school construction spending projected to start in 2011.
National Medians
elementary Schools
Middle School
High Schools
$/Sq. ft. $/per Student Sq. ft./ per Student
No. of Students
Building Size (Sq. Ft.)
Building Cost ($000’s)
$190.48
$215.14
$188.68
$25,500
$29,959
$30,833
125.0
149.0
156.3
600
936
1,600
75,000
140,000
260,000
$14,800
$30,000
$54,900
Low Quartile
elementary Schools
Middle School
High Schools
$/Sq. ft. $/per Student Sq. ft./ per Student
No. of Students
Building Size (Sq. Ft.)
Building Cost ($000’s)
$156.72
$172.41
$164.46
$18,962
$23,774
$25,769
106.7
124.0
125.0
500
750
1,200
64,000
101,000
150,000
$11,600
$21,000
$32,000
High Quartile
elementary Schools
Middle School
High Schools
$/Sq. ft. $/per Student Sq. ft./ per Student
No. of Students
Building Size (Sq. Ft.)
Building Cost ($000’s)
$268.24
$248.65
$252.50
$36,667
$36,667
$42,037
140.0
162.2
187.5
800
1,200
2,064
95,000
170,000
342,000
$22,755
$41,000
$75,534
Top 10 percent
elementary Schools
Middle School
High Schools
$/Sq. ft. $/per Student Sq. ft./ per Student
No. of Students
Building Size (Sq. Ft.)
Building Cost ($000’s)
$548.51
$294.12
$500.57
$49,000
$50,000
$56,442
166.7
176.3
225.0
1,000
1,300
2,400
120,000
190,000
400,000
$34,511
$47,000
$113,356
To read this table: The national median cost per square foot for construction of an elementary school completed in 2010 was $190.48. Cost per student was $25,500 and the median school provides 125 square feet per student. One quarter of all school districts (the low 25 percent) is spending $156.72 per square feet or less for its elementary school construction while one quarter of all districts spent $268.24 per square feet or more. One in 10 school districts esti-mated cost for a new elementary school at almost $550 per square feet. Based on data from 201 elementary schools; 68 middle schools; 91 high schools.
February 2011 / Sp&m — 2011 annual ScHool conStRuction RepoRt CR5
www.planning4education.com
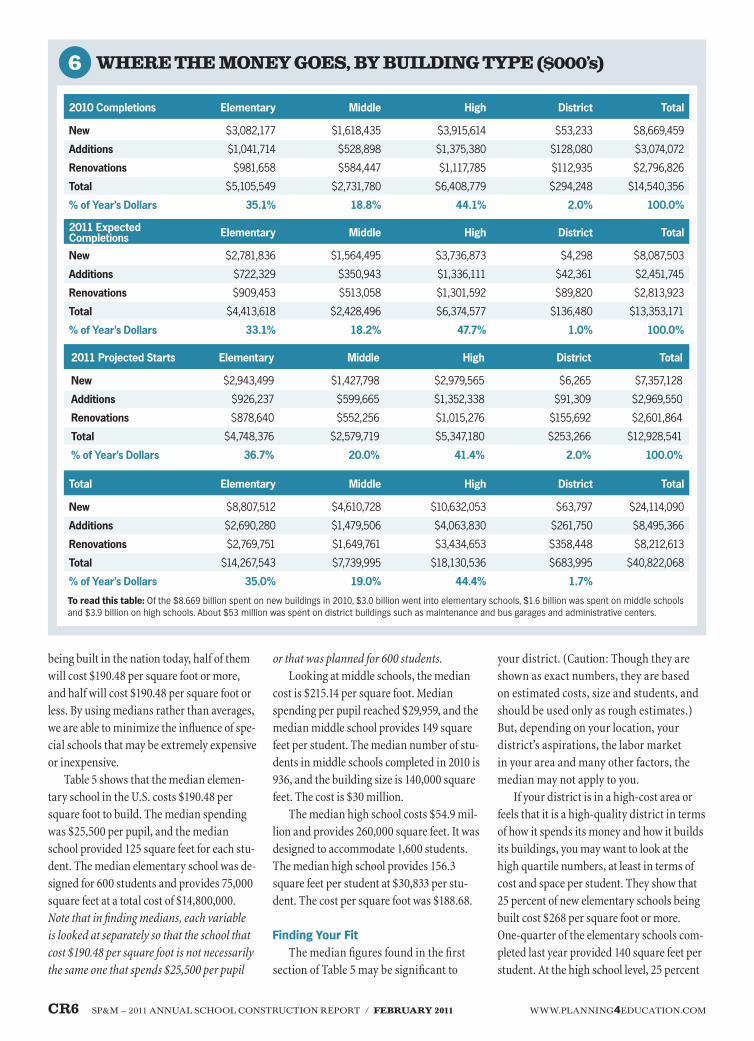
6 wheRe the money goeS, by building type ($000’s)
New
Additions
Renovations
Total
% of Year’s dollars
2010 Completions elementary Middle High district Total
$3,082,177
$1,041,714
$981,658
$5,105,549
35.1%
$1,618,435
$528,898
$584,447
$2,731,780
18.8%
$3,915,614
$1,375,380
$1,117,785
$6,408,779
44.1%
$53,233
$128,080
$112,935
$294,248
2.0%
$8,669,459
$3,074,072
$2,796,826
$14,540,356
100.0%
New
Additions
Renovations
Total
% of Year’s dollars
2011 expected Completions elementary Middle High district Total
$2,781,836
$722,329
$909,453
$4,413,618
33.1%
$1,564,495
$350,943
$513,058
$2,428,496
18.2%
$3,736,873
$1,336,111
$1,301,592
$6,374,577
47.7%
$4,298
$42,361
$89,820
$136,480
1.0%
$8,087,503
$2,451,745
$2,813,923
$13,353,171
100.0%
New
Additions
Renovations
Total
% of Year’s dollars
2011 projected Starts elementary Middle High district Total
$2,943,499
$926,237
$878,640
$4,748,376
36.7%
$1,427,798
$599,665
$552,256
$2,579,719
20.0%
$2,979,565
$1,352,338
$1,015,276
$5,347,180
41.4%
$6,265
$91,309
$155,692
$253,266
2.0%
$7,357,128
$2,969,550
$2,601,864
$12,928,541
100.0%
New
Additions
Renovations
Total
% of Year’s dollars
Total elementary Middle High district Total
$8,807,512
$2,690,280
$2,769,751
$14,267,543
35.0%
$4,610,728
$1,479,506
$1,649,761
$7,739,995
19.0%
$10,632,053
$4,063,830
$3,434,653
$18,130,536
44.4%
$63,797
$261,750
$358,448
$683,995
1.7%
$24,114,090
$8,495,366
$8,212,613
$40,822,068
To read this table: Of the $8.669 billion spent on new buildings in 2010, $3.0 billion went into elementary schools, $1.6 billion was spent on middle schools and $3.9 billion on high schools. About $53 million was spent on district buildings such as maintenance and bus garages and administrative centers.
CR6 Sp&m — 2011 annual ScHool conStRuction RepoRt / February 2011
being built in the nation today, half of them will cost $190.48 per square foot or more, and half will cost $190.48 per square foot or less. By using medians rather than averages, we are able to minimize the influence of spe-cial schools that may be extremely expensive or inexpensive.
Table 5 shows that the median elemen-tary school in the U.S. costs $190.48 per square foot to build. The median spending was $25,500 per pupil, and the median school provided 125 square feet for each stu-dent. The median elementary school was de-signed for 600 students and provides 75,000 square feet at a total cost of $14,800,000. Note that in finding medians, each variable is looked at separately so that the school that cost $190.48 per square foot is not necessarily the same one that spends $25,500 per pupil
or that was planned for 600 students.Looking at middle schools, the median
cost is $215.14 per square foot. Median spending per pupil reached $29,959, and the median middle school provides 149 square feet per student. The median number of stu-dents in middle schools completed in 2010 is 936, and the building size is 140,000 square feet. The cost is $30 million.
The median high school costs $54.9 mil-lion and provides 260,000 square feet. It was designed to accommodate 1,600 students. The median high school provides 156.3 square feet per student at $30,833 per stu-dent. The cost per square foot was $188.68.
Finding Your FitThe median figures found in the first
section of Table 5 may be significant to
your district. (Caution: Though they are shown as exact numbers, they are based on estimated costs, size and students, and should be used only as rough estimates.) But, depending on your location, your district’s aspirations, the labor market in your area and many other factors, the median may not apply to you.
If your district is in a high-cost area or feels that it is a high-quality district in terms of how it spends its money and how it builds its buildings, you may want to look at the high quartile numbers, at least in terms of cost and space per student. They show that 25 percent of new elementary schools being built cost $268 per square foot or more. One-quarter of the elementary schools com-pleted last year provided 140 square feet per student. At the high school level, 25 percent
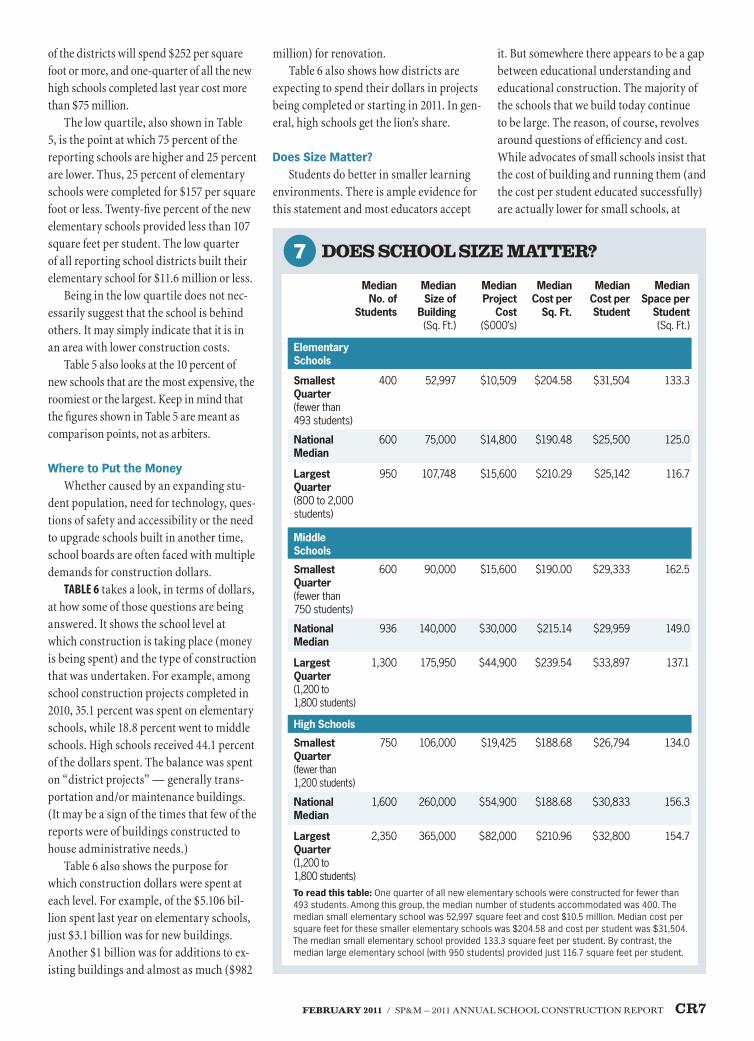
7 doeS SChool Size matteR?
elementary Schools
Largest Quarter (1,200 to 1,800 students)
2,350 365,000 $82,000 $210.96 $32,800 154.7
National Median
1,600 260,000 $54,900 $188.68 $30,833 156.3
Smallest Quarter (fewer than 1,200 students)
750 106,000 $19,425 $188.68 $26,794 134.0
High Schools
Largest Quarter (1,200 to 1,800 students)
1,300 175,950 $44,900 $239.54 $33,897 137.1
National Median
936 140,000 $30,000 $215.14 $29,959 149.0
Smallest Quarter (fewer than 750 students)
600 90,000 $15,600 $190.00 $29,333 162.5
Middle Schools
Largest Quarter (800 to 2,000 students)
950 107,748 $15,600 $210.29 $25,142 116.7
National Median
600 75,000 $14,800 $190.48 $25,500 125.0
Smallest Quarter (fewer than 493 students)
400 52,997 $10,509 $204.58 $31,504 133.3
Median No. of
Students
Median Size of
Building(Sq. Ft.)
Median project
Cost ($000’s)
Median Cost per
Sq. ft.
Median Cost per Student
Median Space per
Student (Sq. Ft.)
To read this table: One quarter of all new elementary schools were constructed for fewer than 493 students. Among this group, the median number of students accommodated was 400. The median small elementary school was 52,997 square feet and cost $10.5 million. Median cost per square feet for these smaller elementary schools was $204.58 and cost per student was $31,504. The median small elementary school provided 133.3 square feet per student. By contrast, the median large elementary school (with 950 students) provided just 116.7 square feet per student.
February 2011 / Sp&m — 2011 annual ScHool conStRuction RepoRt CR7
of the districts will spend $252 per square foot or more, and one-quarter of all the new high schools completed last year cost more than $75 million.
The low quartile, also shown in Table 5, is the point at which 75 percent of the reporting schools are higher and 25 percent are lower. Thus, 25 percent of elementary schools were completed for $157 per square foot or less. Twenty-five percent of the new elementary schools provided less than 107 square feet per student. The low quarter of all reporting school districts built their elementary school for $11.6 million or less.
Being in the low quartile does not nec-essarily suggest that the school is behind others. It may simply indicate that it is in an area with lower construction costs.
Table 5 also looks at the 10 percent of new schools that are the most expensive, the roomiest or the largest. Keep in mind that the figures shown in Table 5 are meant as comparison points, not as arbiters.
Where to Put the MoneyWhether caused by an expanding stu-
dent population, need for technology, ques-tions of safety and accessibility or the need to upgrade schools built in another time, school boards are often faced with multiple demands for construction dollars.
tablE 6 takes a look, in terms of dollars, at how some of those questions are being answered. It shows the school level at which construction is taking place (money is being spent) and the type of construction that was undertaken. For example, among school construction projects completed in 2010, 35.1 percent was spent on elementary schools, while 18.8 percent went to middle schools. High schools received 44.1 percent of the dollars spent. The balance was spent on “district projects” — generally trans-portation and/or maintenance buildings. (It may be a sign of the times that few of the reports were of buildings constructed to house administrative needs.)
Table 6 also shows the purpose for which construction dollars were spent at each level. For example, of the $5.106 bil-lion spent last year on elementary schools, just $3.1 billion was for new buildings. Another $1 billion was for additions to ex-isting buildings and almost as much ($982
million) for renovation. Table 6 also shows how districts are
expecting to spend their dollars in projects being completed or starting in 2011. In gen-eral, high schools get the lion’s share.
Does Size Matter?Students do better in smaller learning
environments. There is ample evidence for this statement and most educators accept
it. But somewhere there appears to be a gap between educational understanding and educational construction. The majority of the schools that we build today continue to be large. The reason, of course, revolves around questions of efficiency and cost. While advocates of small schools insist that the cost of building and running them (and the cost per student educated successfully) are actually lower for small schools, at

8 what new SChoolS Completed in 2011 will pRovide
elementary Middle/JHS High School
100.0%
100.0%
98.7%
99.4%
8.2%
100.0%
100.0%
100.0%
100.0%
100.0%
100.0%
100.0%
100.0%
100.0%
100.0%
100.0%
98.7%
82.3%
86.7%
10.8%
95.6%
100.0%
97.5%
12.9%
21.5%
5.7%
82.9%
0.0%
0.0%
0.0%
0.0%
0.0%
0.6%
100.0%
100.0%
100.0%
98.1%
98.1%
100.0%
100.0%
100.0%
1.9%
37.5%
35.2%
96.3%
1.9%
11.1%
9.3%
1.9%
0.0%
1.9%
100.0%
98.2%
100.0%
100.0%
100.0%
100.0%
98.2%
100.0%
10.5%
80.7%
78.9%
91.2%
38.6%
50.9%
19.3%
40.4%
3.5%
8.8%
100.0%
100.0%
0.0%
1.3%
98.7%
100.0%
100.0%
0.0%
1.7%
100.0%
Classrooms
Library
Media Center
Computer Lab
Science Lab
Music
Arts/Crafts
Gymnasium
Multipurpose Room
Stage
Auditorium/Theater
Special Ed/Resource
Fine Arts
Home Arts
Industrial Tech.
Vocational Shops
Photo Lab
TV/Radio Studio
Offices
Infirmary/Clinic
Cafeteria
Kitchen
Hall Lockers
LANs
Fiber Optics/Cable
Technology Lab
Language Lab
WANs
100.0%
100.0%
43.9%
14.0%
100.0%
Locker Rooms
Bleachers
Track
Field House
Fitness Center
Tennis
Pool
Stadium
Athletic Fields
Playground
4.1%
12.7%
0.0%
0.0%
0.0%
0.0%
0.6%
0.0%
10.1%
99.4%
87.0%
96.3%
9.3%
0.0%
7.4%
0.0%
0.0%
0.0%
94.4%
9.3%
100.0%
100.0%
29.8%
5.3%
47.4%
26.3%
3.5%
14.0%
98.2%
10.5%
Day Care/Nursery
Elevators
Security Equipment
20.9%
6.3%
100.0%
0.0%
20.4%
100.0%
0.0%
36.8%
100.0%
Core Facilities
Support Facilities
Technology Support
Athletic Support
Other Facilities
9 top ten additionS by SChool type
Classrooms
Lavatories
Gymnasium
Cafeteria
Offices
Special Education
Library/Media Center
Day Care/Early Ed.
Kitchen
Music
1
2
3
4
5
6
7
8
9
10
71.1%
54.4%
11.1%
14.4%
11.1%
7.8%
7.7%
6.7%
6.7%
5.6%
elementary
Classrooms
Lavatories
Science Labs
Offices
Portables
Gymnasium
Library/Media Center
Special Education
Music
Cafeteria
1
2
3
4
5
6
7
8
9
10
76.9%
65.4%
26.9%
19.2%
15.4%
11.5%
11.5%
7.7%
7.7%
7.7%
Middle/JHS
Lavatories
Classrooms
Science Labs
Offices
Library/Media Center
Bleachers
Locker Rooms
Arts/Crafts/Fine Arts
Stage
Auditorium/Theater
1
2
3
4
5
6
7
8
9
10
69.6%
53.6%
26.7%
20.3%
20.3%
18.8%
18.8%
18.8%
15.9%
14.5%
High School
(% of school additions that are reported to contain facility)
(% of new schools that reported facility, by grade level)
CR8 Sp&m — 2011 annual ScHool conStRuction RepoRt / February 2011 www.planning4education.com

This is the 16th year that School Planning & Management has collected and published data on costs of new schools. Reporting is done based on medians. The number shown
is more than what one-half of schools constructed cost, and less than the cost for the other half (see Table 5 for more on national medians and the regional tables for regional medians).
In 1995, as GRaph a shows, the median school district was paying about $104 per square foot for middle schools and high schools; $93 per square foot for elementary. Costs remained reasonably close to those numbers for the next four years, rising slightly but still staying close to $100 a square foot — a little above that in high cost parts of the nation, a little below in areas where all costs tended to be lower.
And then things changed. By 2003, high school construction costs had risen to $132 per square foot, a 25 percent increase. Four years later, in 2007, the median high school was being constructed
February 2011 / Sp&m — 2011 annual ScHool conStRuction RepoRt CR9
times it is a hard sell. tablE 7 examines the question of the com-
parative cost of building schools by size. To do this, all of the new school buildings construct-ed in 2010 on which information was available were lined up by size and then were divided into four equal groups so that median costs and other information could be found among the smaller and larger buildings.
Looking at elementary schools, one- quarter of them were designed to house 500 or fewer students. Among that group, the median building will house 400 students and will contain 53,000 square feet. The cost will be $10.5 million. The median cost per square foot among the smaller elementary schools was $204.08 and cost per student was $31,504.
By contrast, one of every four new elementary schools was designed for 800 or more students. The largest one reported was designed for 2,000 elementary school students.
Among these larger elementary schools, the median student population was 950, the median size almost 108,000 square feet and the median cost $15.6 million. In terms of cost per square foot, these larger buildings cost $210.29, somewhat more than the smaller elementary schools. The cost per student, $25,142, was less than the $31,504 being spent per pupil for the smaller schools. On the other hand, the smaller schools provided much more space per pupil (133.3 square feet per student)
than the larger schools (116.7). One-quarter of the middle schools were
constructed for 750 or fewer students. The median housed 600 students in 90,000 square feet at a cost of $15.6 million. The median cost per square foot for these smaller schools was $190 and the cost per pupil $29,333. The smaller middle schools provided 162.5 square feet per student.
Among larger middle schools (with between 1,200 and 1,800 students) the median was 1,300 students, 175,950 square feet and almost $45 million in cost. In terms of cost per pupil ($33,897), the larger middle schools were more costly than the small ones, and cost per square foot ($239.54) was greater. These larger schools also provided less space per pupil.
The high school picture shows that the median cost per student in larger schools (with 2,064 to 4,200 students) was more than for smaller ones (fewer than 1,200 students), as was cost per square foot. The smaller high schools provided less space per student for the program.
The difference in construction cost per student between large and small high schools is significant, as is the cost per square foot. Considering the educational implications, and the usually higher ad-ministrative and security costs of large high schools, school districts may wish to look once again at the efficacy of putting 2,000 or more students into a single building.
Providing FacilitiesNew school buildings have great similari-
ties. All have classrooms and offices. Virtu-ally all have facilities for physical education. Some kind of a nurse’s station is a regular feature. Libraries are in all buildings, though in some, they may be listed as media centers. In elementary schools, gymnasiums and cafeterias are provided, but some are listed as multi-purpose rooms. tablE 8 records the percentage of new schools completed in 2010 that include specific facilities.
tablE 9 details information collected on additions to existing schools and the facili-ties most often included by school type.
Classrooms and lavatories were included in a majority of elementary and middle school additions, but no other feature was regularly included, confirming that the basic reason districts added to these schools was to accommodate additional students. Middle school projects often (25 percent) also added science facilities. The inclusion of portables in 15 percent of the middle schools is something of a surprise, and once again speaks to the idea that school additions were essentially a means to house more students.
High school additions were significantly more varied. Science labs were in 27 per-cent; offices and libraries or media centers in one of five. Athletic facilities (locker rooms and bleachers) and arts facilities (including performance and work space) were also frequently added.
Trends Since 1995 $220
$200
$180
$160
$140
$120
$100
$801995 1997 1999 2001 2003 2005 2007 2009
Graph A: Median Cost per Sq. Ft., 1995-2009
Elementary Middle High
2010 Median Cost per Sq. Ft.
$190.48 $215.14 $188.60Elementary Middle High
>> This Construction Report and the accompanying tables, etc., was compiled by Paul Abramson, education industry consultant for School Planning & Management magazine and the president of Stanton Leggett & Associates, an education consulting firm based in Mamaroneck, N.Y. He can be reached at [email protected].
this 16th annual school construction report is also available For DoWnloaD on our Website at WWW.planning4eDucation.com
Web eXtra
www.planning4education.com
National figures are always instruc-tive, but from the point of view of the local school administrator
or school board, it may be more important to know what your neighbors are doing. School Planning & Management’s regional figures are designed to help you do that.
On the following pages, figures are given for each of the 12 regions of the United States. They show the total amount of construction activity by year and how that money was spent, on new schools, ad-ditions or renovations. They also show by year what percentage of money in your re-gion goes into elementary schools, middle schools, high schools and district projects.
The purpose of this report is to provide you with data that can help you under-stand not only what your own district needs, but also what others are doing and how much their projects cost. The
national tables allow you to compare with districts with similar aspirations. Thus, if districts in your region on average tend to provide minimal space per student, but your district aspires to a variety of programs that need space, you may want to look at the amount of space per pupil provided in the high quarter or 10 percent of the nation’s schools. The regional tables allow you to measure yourself against your neighbors.
With this information, you will have the data necessary to make your own plans and, in many cases, to help the public understand what you are building, why you are doing it and what it is likely to cost. Remember, there is no right or wrong; these are guidelines that need to be applied to your own local needs.
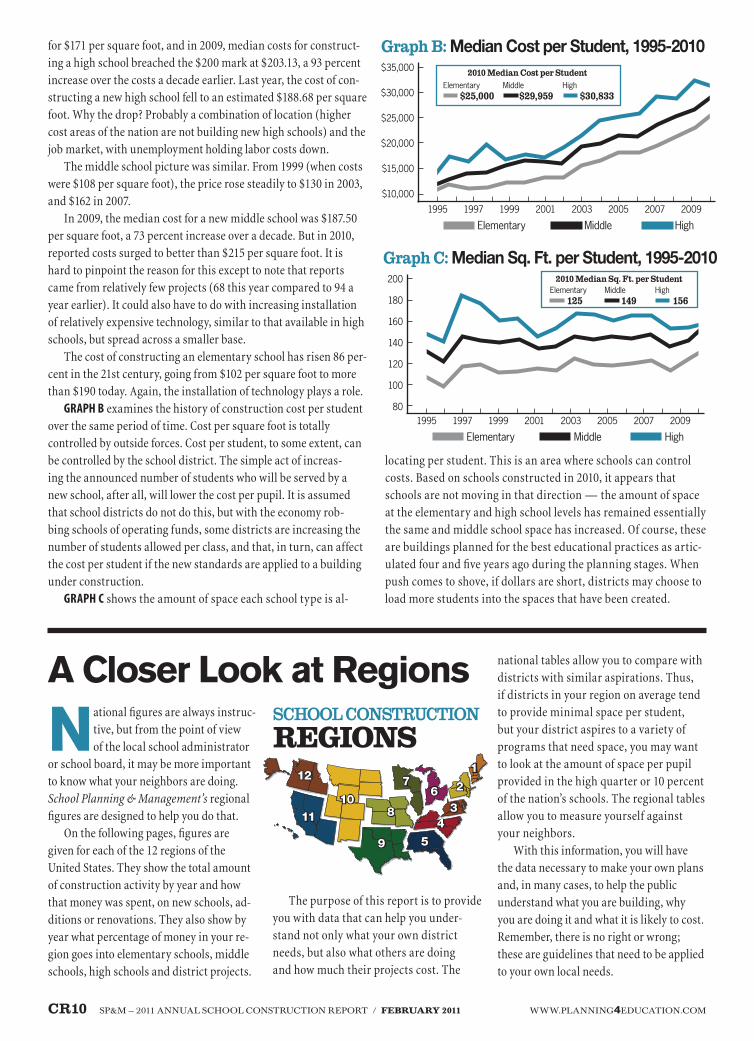
for $171 per square foot, and in 2009, median costs for construct-ing a high school breached the $200 mark at $203.13, a 93 percent increase over the costs a decade earlier. Last year, the cost of con-structing a new high school fell to an estimated $188.68 per square foot. Why the drop? Probably a combination of location (higher cost areas of the nation are not building new high schools) and the job market, with unemployment holding labor costs down.
The middle school picture was similar. From 1999 (when costs were $108 per square foot), the price rose steadily to $130 in 2003, and $162 in 2007.
In 2009, the median cost for a new middle school was $187.50 per square foot, a 73 percent increase over a decade. But in 2010, reported costs surged to better than $215 per square foot. It is hard to pinpoint the reason for this except to note that reports came from relatively few projects (68 this year compared to 94 a year earlier). It could also have to do with increasing installation of relatively expensive technology, similar to that available in high schools, but spread across a smaller base.
The cost of constructing an elementary school has risen 86 per-cent in the 21st century, going from $102 per square foot to more than $190 today. Again, the installation of technology plays a role.
GRaph b examines the history of construction cost per student over the same period of time. Cost per square foot is totally controlled by outside forces. Cost per student, to some extent, can be controlled by the school district. The simple act of increas-ing the announced number of students who will be served by a new school, after all, will lower the cost per pupil. It is assumed that school districts do not do this, but with the economy rob-bing schools of operating funds, some districts are increasing the number of students allowed per class, and that, in turn, can affect the cost per student if the new standards are applied to a building under construction.
GRaph c shows the amount of space each school type is al-
locating per student. This is an area where schools can control costs. Based on schools constructed in 2010, it appears that schools are not moving in that direction — the amount of space at the elementary and high school levels has remained essentially the same and middle school space has increased. Of course, these are buildings planned for the best educational practices as artic-ulated four and five years ago during the planning stages. When push comes to shove, if dollars are short, districts may choose to load more students into the spaces that have been created.
CR10 Sp&m — 2011 annual ScHool conStRuction RepoRt / February 2011
a Closer Look at Regions
111212
22
3344
55
6677
88
99
10101111
school construction
RegionS
200
180
160
140
120
100
801995 1997 1999 2001 2003 2005 2007 2009
Graph C: Median Sq. Ft. per Student, 1995-2010
Elementary Middle High
2010 Median Sq. Ft. per Student
125 149 156Elementary Middle High
$35,000
$30,000
$25,000
$20,000
$15,000
$10,000
1995 1997 1999 2001 2003 2005 2007 2009
Graph B: Median Cost per Student, 1995-2010
Elementary Middle High
2010 Median Cost per Student
$25,000 $29,959 $30,833Elementary Middle High

February 2011 / Sp&m — 2011 annual ScHool conStRuction RepoRt CR11
region 1 Ct, me, ma, nh, Ri, vtHow Much is Being Spent? ($000s)
New Schools Additions Renovations Total$312,331 $459,212 $239,654 $698,866
46.8%
$93,965 $138,487 $229,020 $367,507
24.6%
$246,624 $172,195 $255,400 $427,594
28.6%
$652,920 $769,894 $724,074
$1,493,967
Where is the Money going?
Total ($000s) elementary Middle High$652,920 $769,894 $724,074
$1,493,967
29.8%29.0%23.4%
39.3%
0.8%18.7%13.7%
16.6%
69.3%51.9%58.8%85.6%
district0.1%0.5%4.0%
2.2%
New Schools onlyCost/
Sq. ft.Cost/
StudentSq. ft./ Student
Median Cost ($000s)
$273.40
$37,235 136.2 $23,950,000
Median # Students
675
Median Size (Sq. Ft.)92,000
REGION 1, consisting of the six New England states, completed $653 million worth of construction in 2010, making it the fourth consecutive year that construc-tion has fallen. The total, however, was somewhat higher than had been expected and school districts in the region are projecting a turnaround in 2011 with $770 million in completions. Almost as much is expected to get underway this year. Less than half of the region’s construction money (46.8 percent) is spent on new school buildings but if all goes as expected this year, there will be a small surge in funding of new schools, buildings currently underway that are going to be completed before the year ends. Very few new schools were opened in the region during 2010. As a result, it is not possible to provide credible information on cost and size of new middle and high schools in the region but, historically, Region 1’s new schools have been among the highest priced in the nation. Based on total dollars spent and average cost, indications are that just seven entirely new school buildings were completed last year in New England.
REGION 2 consists of New Jersey, New York and Pennsylvania. Costs in most parts of these states tend to be higher than elsewhere in the nation. In 2010, school districts in Region 2 put $1.5 billion worth of construction in place, about 16 percent less than the previous year. Construction completed in 2011 is expected to be lower again, and there is no indication that it will pick up in terms of projects being started this year. Few new schools are being constructed, with less than 39 percent of the region’s funds going to new schools. The balance of the money is being spent on additions and renovation of existing buildings, with the emphasis on retrofit and modernization. Middle schools, which tend to be slightly newer, get short shrift in terms of where the available money is being spent.Based on total dollars spent on new schools and average cost, indications are that about 15 new schools were completed in 2011.
Completions in 2010Completions in 2011Starting in 2011Total Activity% of Total
Completions in 2010Completions in 2011Starting in 2011Total Activity
ElementaryMiddle/JHSHigh School
region 2 nj, ny, paHow Much is Being Spent? ($000s)
New Schools Additions Renovations Total$513,348 $551,985 $517,620
$1,582,953 38.6%
$392,482 $293,335 $318,016
$1,003,833 24.5%
$588,861 $449,218 $478,487
$1,516,566 37.0%
$1,494,691 $1,294,538 $1,314,123
$4,103,352
Where is the Money going?
Total ($000s) elementary Middle High$1,494,691 $1,294,538 $1,314,123
$4,103,352
34.3%50.5%43.4%
42.3%
18.9%7.8%
10.5%12.7%
45.8%39.6%44.7%
43.5%
district1.0%2.1%1.4%
1.5%
New Schools onlyCost/
Sq. ft.Cost/
StudentSq. ft./ Student
Median Cost ($000s)
$309.52 $250.00 $262.01
$38,571 $40,000 $40,000
138.5173.3174.0
$26,000,000 $24,000,000 $81,710,636
Median # Students
673 600
1,400
Median Size (Sq. Ft.) 90,000
104,000 333,810
Completions in 2010Completions in 2011Starting in 2011Total Activity% of Total
Completions in 2010Completions in 2011Starting in 2011Total Activity
ElementaryMiddle/JHSHigh School
MDR reported too few new middle schools in this region in 2010 to calculate medians.MDR reported too few new high schools in this region in 2010 to calculate medians.

www.planning4education.comCR12 Sp&m — 2011 annual ScHool conStRuction RepoRt / February 2011
region 3 dC, de, md, va, wvHow Much is Being Spent? ($000s)
New Schools Additions Renovations Total$541,173
$662,760 $791,415
$1,995,348 69.9%
$133,923 $151,482 $161,188
$446,593 15.6%
$154,155 $178,806 $80,834
$413,794 14.5%
$829,252 $993,048
$1,033,437 $2,855,736
Where is the Money going?
Total ($000s) elementary Middle High$829,252 $993,048
$1,033,437 $2,855,736
46.5%28.1%36.9%
36.6%
22.8%25.1%16.0%21.1%
27.2%46.7%46.9%41.1%
district3.6%0.1%0.2%1.2%
New Schools onlyCost/
Sq. ft.Cost/
StudentSq. ft./ Student
Median Cost ($000s)
$234.94 $188.79 $206.44
$33,333 $25,000 $32,136
128.8140.8157.5
$22,200,000 $32,095,000 $70,700,000
Median # Students
676 1,250 1,600
Median Size (Sq. Ft.) 95,000
170,000 280,000
Completions in 2010Completions in 2011Starting in 2011Total Activity% of Total
Completions in 2010Completions in 2011Starting in 2011Total Activity
ElementaryMiddle/JHSHigh School
REGION 3 includes Delaware, the District of Columbia, Maryland, Virginia and West Virginia. Over the last eight years, school districts in this region have spent about $1 billion annually on school construction put in place. In 2010, it fell short with just $829 million in completed work. Most of that money was spent on new schools. Projections for completions and starts this year indicate a slight rebound expected in total construction, with the emphasis remaining on new buildings. Construction costs in Region 3 are consistently above national averages, but this is a region with wide variations between the suburbs of Washington, D.C. and the hills of western Virginia and West Virginia. Based on total dollars spent on new schools and average costs, indications are that about 19 new schools were completed in 2011.
region 4 Ky, nC, SC, tnHow Much is Being Spent? ($000s)
New Schools Additions Renovations Total$1,012,550 $827,523 $877,529
$2,717,602 72.4%
$202,689 $137,799 $175,832 $516,320
13.7%
$115,020 $261,525 $145,096 $521,640
13.9%
$1,330,259 $1,226,847 $1,198,457
$3,755,562
Where is the Money going?
Total ($000s) elementary Middle High$1,330,259 $1,226,847 $1,198,457
$3,755,562
34.1%38.2%35.5%
35.9%
21.5%24.4%28.2%24.6%
43.1%37.3%36.3%39.0%
district1.3%0.2%0.1%
0.5%
New Schools onlyCost/
Sq. ft.Cost/
StudentSq. ft./ Student
Median Cost ($000s)
$144.96 $195.59 $197.39
$19,825 $28,333 $27,494
127.1146.1190.8
$14,148,000 $25,500,000 $35,000,000
Median # Students
731 900
1,250
Median Size (Sq. Ft.) 86,000
131,000 195,000
Completions in 2010Completions in 2011Starting in 2011Total Activity% of Total
Completions in 2010Completions in 2011Starting in 2011Total Activity
ElementaryMiddle/JHSHigh School
REGION 4 consists of Kentucky, North Carolina, South Carolina and Tennessee. Together, school districts in this region put more than $1.3 billion worth of construction in place in 2010, but that was almost 20 percent less than was spent the previous year — the second year in a row that construction spending has dropped significantly. Projections for completions in 2011 show a further pull-back, and asked to look ahead to work starting in 2011, reporting districts saw further cuts ahead. School districts in Region 4 devote most of their construction dollars to new buildings, but in the last year put more emphasis on renovation and retrofit projects. That trend seems to be continuing with projects ending and starting in 2011. The cost of construction, based on dollars per square foot and per student, tends to be slightly below national medians. Based on total dollars spent on new schools and average costs, indications are that about 44 new schools were completed in 2010.

February 2011 / Sp&m — 2011 annual ScHool conStRuction RepoRt CR13
region 5 al, fl, ga, mSHow Much is Being Spent? ($000s)
New Schools Additions Renovations Total$1,337,912
$1,058,564 $1,036,789
$3,433,264 67.5%
$327,624 $431,202 $313,943
$1,072,768 21.1%
$175,897 $199,762 $200,938 $576,597
11.3%
$1,841,432 $1,689,528 $1,551,670
$5,082,630
Where is the Money going?
Total ($000s) elementary Middle High$1,841,432 $1,689,528 $1,551,670
$5,082,630
33.2%38.9%38.6%36.7%
19.0%16.8%27.1%
20.7%
47.0%42.6%31.6%
40.9%
district0.8%1.7%2.7%1.7%
New Schools onlyCost/
Sq. ft.Cost/
StudentSq. ft./ Student
Median Cost ($000s)
$139.53 $181.74 $173.21
$20,000 $28,462 $27,813
132.3133.3155.6
$17,500,000 $30,000,000 $46,500,000
Median # Students
762 1,200 1,880
Median Size (Sq. Ft.)
100,000 165,068 280,500
Completions in 2010Completions in 2011Starting in 2011Total Activity% of Total
Completions in 2010Completions in 2011Starting in 2011Total Activity
ElementaryMiddle/JHSHigh School
Alabama, Florida, Georgia and Mississippi are the four states that make up REGION 5. Led by Florida and Georgia, this region has produced an unbroken record of high construction activity, but the bubble may have burst a little in 2010. While Region 5 remained among the highest school construction regions, the $1.8 billion spent was almost $1 billion less than was completed the previous year. This did not come as a surprise; the projections posted a year ago proved accurate. If they are accurate again for 2011, the region will show a further, but smaller, decline in construction activity. Despite increases in student population, spending for public school construction does not appear to be a priority in the area. Construction costs are creeping up in Region 5, but remain well below national medians, closer to the bottom quartile. The region tends to build large schools but provide ample space per student. Based on total dollars spent on new schools, average cost and numbers of children accommodated, indications are that only 43 new schools were put in place in Region 5 in 2010, less than in the last several years.
region 6 in, oh, miHow Much is Being Spent? ($000s)
New Schools Additions Renovations Total$359,603
$442,253 $347,036
$1,148,892 43.8%
$286,289 $157,000 $194,758
$638,046 24.3%
$278,887 $283,985 $275,711
$838,583 31.9%
$924,778 $883,237 $817,505
$2,625,520
Where is the Money going?
Total ($000s) elementary Middle High$924,778 $883,237 $817,505
$2,625,520
43.6%28.9%40.2%37.6%
20.2%22.9%18.7%
20.6%
35.5%45.9%38.4%
39.9%
district0.8%2.3%2.6%1.9%
New Schools onlyCost/
Sq. ft.Cost/
StudentSq. ft./ Student
Median Cost ($000s)
$190.48 $214.93 $189.33
$24,000 $34,444 $28,000
125.7158.9176.5
$10,900,000 $22,000,000 $40,000,000
Median # Students
493 750
1,038
Median Size (Sq. Ft.) 66,000
113,000 211,273
Completions in 2010Completions in 2011Starting in 2011Total Activity% of Total
Completions in 2010Completions in 2011Starting in 2011Total Activity
ElementaryMiddle/JHSHigh School
REGION 6, including the states of Indiana, Michigan and Ohio, put $924 million into its school buildings in 2010 and expects to complete less work this year. Starts in 2011 are also down. New schools are not the priority in Region 6, where population growth is not a factor. Instead, more and more money is being spent on upgrading existing buildings — 32 percent of construction funds — and enlarging them (24 percent). Some new schools are still being constructed, and when they are, costs are very close to national medians. Based on total dollars spent on new schools and average cost, indications are that about 20 new schools were completed in 2010.

www.planning4education.comCR14 Sp&m — 2011 annual ScHool conStRuction RepoRt / February 2011
region 7 il, mn, wiHow Much is Being Spent? ($000s)
New Schools Additions Renovations Total$309,283 $202,071 $412,800 $924,154
48.3%
$206,136 $167,269 $167,924
$541,329 28.3%
$135,252 $208,831 $103,297 $447,380
23.4%
$650,671 $578,171
$684,021 $1,912,863
Where is the Money going?
Total ($000s) elementary Middle High$650,671 $578,171 $684,021
$1,912,863
21.0%18.9%38.2%26.5%
25.6%11.2%9.9%
15.7%
50.6%69.5%48.3%55.5%
district2.8%0.3%3.6%
2.3%
New Schools onlyCost/
Sq. ft.Cost/
StudentSq. ft./ Student
Median Cost ($000s)
$191.58 $208.50 $172.39
$29,867 $34,531 $31,412
150.0165.9207.6
$14,000,000 $34,257,500 $68,050,000
Median # Students
550 989
1,900
Median Size (Sq. Ft.) 76,800
165,000 394,000
Completions in 2010Completions in 2011Starting in 2011Total Activity% of Total
Completions in 2010Completions in 2011Starting in 2011Total Activity
ElementaryMiddle/JHSHigh School
States in REGION 7 — Illinois, Minnesota and Wisconsin — have been less and less active in terms of school construction over the last few years. In 2008, construction slipped under $1 billion, and it apparently will remain there for the foreseeable future. In 2010, $651 million was completed, slightly above what had been projected. Projections for completions this year ($578 million) are even lower. However, a bounce back to almost $700 million is projected for projects starting this year. More than half the region’s dollars are now going to enlarging and improving existing buildings rather than erecting new ones. Based on total dollars spent on new schools and average cost, indications are that about 16 new schools were completed by districts in Region 7 during 2010.
region 8 ia, KS, mo, neHow Much is Being Spent? ($000s)
New Schools Additions Renovations Total$217,620
$412,599 $243,433 $873,652
41.4%
$231,374 $192,133 $297,600 $721,107
34.2%
$187,821 $139,619 $185,761 $513,201
24.3%
$636,814 $744,352 $726,794
$2,107,960
Where is the Money going?
Total ($000s) elementary Middle High$636,814 $744,352 $726,794
$2,107,960
51.7%33.7%24.8%36.1%
6.1%26.2%28.7%
21.0%
40.2%39.1%42.8%40.7%
district2.0%1.0%3.7%
2.2%
New Schools onlyCost/
Sq. ft.Cost/
StudentSq. ft./ Student
Median Cost ($000s)
$165.92 $209.84 $141.02
$22,222 $29,750 $30,375
140.0155.0204.1
$11,960,500 $21,000,000 $19,425,439
Median # Students
450 750 725
Median Size (Sq. Ft.) 74,500
110,000 136,500
Completions in 2010Completions in 2011Starting in 2011Total Activity% of Total
Completions in 2010Completions in 2011Starting in 2011Total Activity
ElementaryMiddle/JHSHigh School
The states of Iowa, Kansas, Missouri and Nebraska make up REGION 8. School districts in these four states completed about $637 million worth of construction in 2010 — fairly evenly distributed among new schools, additions to and retrofit of existing ones. That has been the pattern in these four states for a number of years, but last year, the bulk of money was spent on entirely new schools. We surmised that this was because the districts were having difficulty getting money for construction projects and, therefore, were able only to complete new buildings that were already funded and underway before the recession hit. Hopefully, the return to a pattern of even spending indicates that taxpayers in this region understand the importance and value of maintaining their public schools. When new schools are built, it is interesting to note that costs tend to be below national medians, possibly because the size of the schools is relatively small. As shown earlier (Table 7), building smaller schools tends to lower costs. Based on total dollars spent on new schools and average cost, indications are that about 16 new schools were completed in 2010.

February 2011 / Sp&m — 2011 annual ScHool conStRuction RepoRt CR15
region 9 aR, la, oK, txHow Much is Being Spent? ($000s)
New Schools Additions Renovations Total$1,653,853 $1,412,981 $1,168,952
$4,235,787 66.7%
$479,615 $245,293 $502,711
$1,227,619 19.3%
$387,774 $327,957 $170,231
$885,962 14.0%
$2,521,241 $1,986,232 $1,841,894
$6,349,366
Where is the Money going?
Total ($000s) elementary Middle High$2,521,241 $1,986,232 $1,841,894
$6,349,366
35.4%31.9%44.1%
36.8%
18.8%20.0%24.1%
20.7%
42.5%47.3%29.5%
40.2%
district3.3%0.9%2.3%2.3%
New Schools onlyCost/
Sq. ft.Cost/
StudentSq. ft./ Student
Median Cost ($000s)
$168.92 $210.71 $186.67
$18,939 $30,705 $29,545
112.5154.2159.1
$13,500,000 $30,000,000 $37,000,000
Median # Students
740 1,000 1,600
Median Size (Sq. Ft.) 82,100
150,000 240,000
Completions in 2010Completions in 2011Starting in 2011Total Activity% of Total
Completions in 2010Completions in 2011Starting in 2011Total Activity
ElementaryMiddle/JHSHigh School
REGION 9 includes Arkansas, Louisiana, Oklahoma and Texas. While all of the states are normally involved in school construction of one kind or another, it is the activity in Texas that dominates the region, and that makes it, year after year, one the highest spending regions in terms of school construction. (Louisiana, because of post-Katrina activity, will be more active over the next few years.) Region 9 school districts put $2.5 billion worth of school construction in place in 2010 — slightly more than a year ago and ahead of expectations. Projections for completions and starts this year show some falling off, but districts in Region 9 tend to understate their activity or choose not to report it until construction has been completed. More than two-thirds of construction dollars go into building new schools, and the emphasis is on the high schools. The region’s schools are constructed at or close to national medians. Based on total dollars spent on new schools and average cost, indications are that about 73 new schools were completed in Region 9 in 2010.
region 10 Co, mt, nd, nm, Sd, ut, wyHow Much is Being Spent? ($000s)
New Schools Additions Renovations Total$548,231 $402,619 $388,517
$1,339,367 70.0%
$130,878 $77,886
$113,340 $322,104
16.8%
$93,277 $46,727
$111,033 $251,037
13.1%
$772,386 $527,231
$612,891 $1,912,508
Where is the Money going?
Total ($000s) elementary Middle High$772,386 $527,231 $612,891
$1,912,508
38.9%18.2%33.4%31.4%
23.7%6.3%
19.1%17.4%
34.8%74.4%46.2%49.4%
district2.6%1.1%1.3%1.8%
New Schools onlyCost/
Sq. ft.Cost/
StudentSq. ft./ Student
Median Cost ($000s)
$253.18 $190.00 $236.84
$27,250 $25,333 $40,909
130.9153.8172.7
$30,000,000 $30,000,000 $61,355,000
Median # Students
1,000 1,200 1,600
Median Size (Sq. Ft.)
150,000 175,900 300,000
Completions in 2010Completions in 2011Starting in 2011Total Activity% of Total
Completions in 2010Completions in 2011Starting in 2011Total Activity
ElementaryMiddle/JHSHigh School
There are seven states in REGION 10 including Colorado, Montana, New Mexico, North Dakota, South Dakota, Utah and Wyoming. In 2010, districts in Region 10 spent $772 million on school construction — less than the previous year and the continuation of a recent downward trend. The bulk of it (71 percent), was for new schools, and that trend is expected to continue. Projections for the future show further declines in spending, but the actual total for 2010 exceeded projections, so one can hope that the same will be true this year. Considering the long distance and relatively sparse population of many areas in Region 10, it is surprising to find that it tends to build schools for large numbers of students. Based on total dollars spent on new schools and average cost, indications are that about 13 new schools were completed in the region in 2010.
www.planning4education.comCR16 Sp&m — 2011 annual ScHool conStRuction RepoRt / February 2011
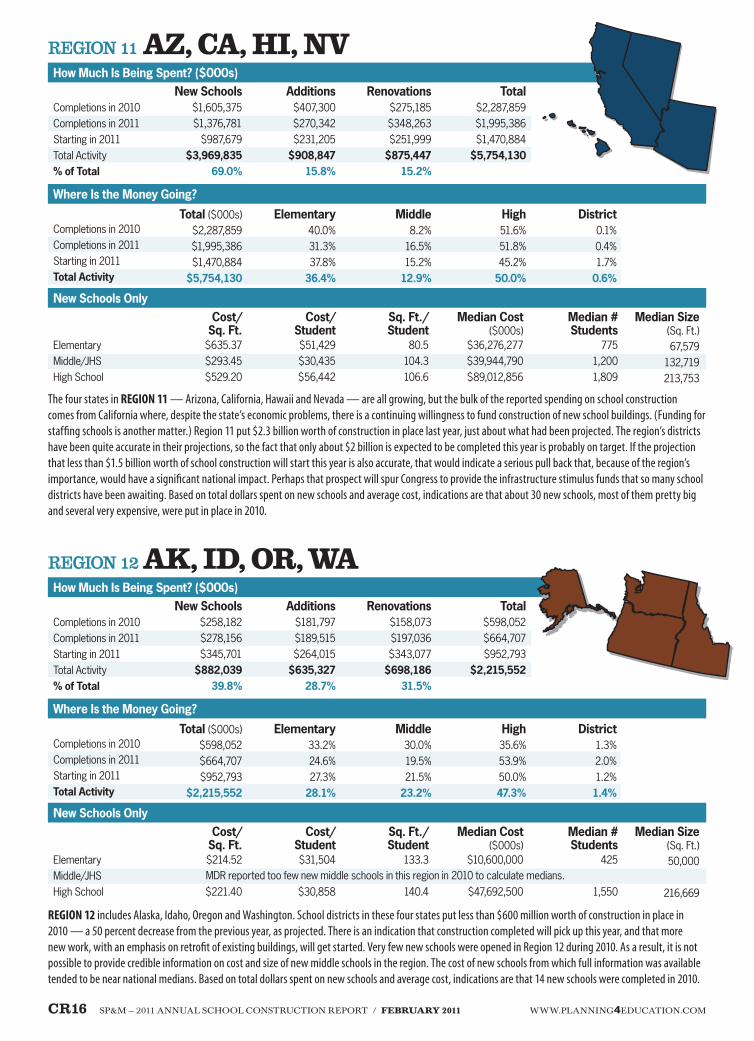
region 11 az, Ca, hi, nvHow Much is Being Spent? ($000s)
New Schools Additions Renovations Total$1,605,375 $1,376,781
$987,679 $3,969,835
69.0%
$407,300 $270,342 $231,205 $908,847
15.8%
$275,185 $348,263 $251,999 $875,447
15.2%
$2,287,859 $1,995,386 $1,470,884 $5,754,130
Where is the Money going?
Total ($000s) elementary Middle High$2,287,859 $1,995,386 $1,470,884
$5,754,130
40.0%31.3%37.8%
36.4%
8.2%16.5%15.2%
12.9%
51.6%51.8%45.2%
50.0%
district0.1%0.4%1.7%
0.6%
New Schools onlyCost/
Sq. ft.Cost/
StudentSq. ft./ Student
Median Cost ($000s)
$635.37 $293.45 $529.20
$51,429 $30,435 $56,442
80.5104.3106.6
$36,276,277 $39,944,790 $89,012,856
Median # Students
775 1,200 1,809
Median Size (Sq. Ft.) 67,579
132,719 213,753
Completions in 2010Completions in 2011Starting in 2011Total Activity% of Total
Completions in 2010Completions in 2011Starting in 2011Total Activity
ElementaryMiddle/JHSHigh School
The four states in REGION 11 — Arizona, California, Hawaii and Nevada — are all growing, but the bulk of the reported spending on school construction comes from California where, despite the state’s economic problems, there is a continuing willingness to fund construction of new school buildings. (Funding for staffing schools is another matter.) Region 11 put $2.3 billion worth of construction in place last year, just about what had been projected. The region’s districts have been quite accurate in their projections, so the fact that only about $2 billion is expected to be completed this year is probably on target. If the projection that less than $1.5 billion worth of school construction will start this year is also accurate, that would indicate a serious pull back that, because of the region’s importance, would have a significant national impact. Perhaps that prospect will spur Congress to provide the infrastructure stimulus funds that so many school districts have been awaiting. Based on total dollars spent on new schools and average cost, indications are that about 30 new schools, most of them pretty big and several very expensive, were put in place in 2010.
region 12 aK, id, oR, waHow Much is Being Spent? ($000s)
New Schools Additions Renovations Total$258,182 $278,156 $345,701 $882,039
39.8%
$181,797 $189,515 $264,015 $635,327
28.7%
$158,073 $197,036 $343,077 $698,186
31.5%
$598,052 $664,707 $952,793
$2,215,552
Where is the Money going?
Total ($000s) elementary Middle High$598,052 $664,707 $952,793
$2,215,552
33.2%24.6%27.3%
28.1%
30.0%19.5%21.5%
23.2%
35.6%53.9%50.0%47.3%
district1.3%2.0%1.2%1.4%
New Schools onlyCost/
Sq. ft.Cost/
StudentSq. ft./ Student
Median Cost ($000s)
$214.52
$221.40
$31,504
$30,858
133.3
140.4
$10,600,000
$47,692,500
Median # Students
425
1,550
Median Size (Sq. Ft.) 50,000
216,669
Completions in 2010Completions in 2011Starting in 2011Total Activity% of Total
Completions in 2010Completions in 2011Starting in 2011Total Activity
ElementaryMiddle/JHSHigh School
REGION 12 includes Alaska, Idaho, Oregon and Washington. School districts in these four states put less than $600 million worth of construction in place in 2010 — a 50 percent decrease from the previous year, as projected. There is an indication that construction completed will pick up this year, and that more new work, with an emphasis on retrofit of existing buildings, will get started. Very few new schools were opened in Region 12 during 2010. As a result, it is not possible to provide credible information on cost and size of new middle schools in the region. The cost of new schools from which full information was available tended to be near national medians. Based on total dollars spent on new schools and average cost, indications are that 14 new schools were completed in 2010.
MDR reported too few new middle schools in this region in 2010 to calculate medians.