Embed Size (px)
Citation preview
Oroboros Instruments High-Resolution Respirometry
Mitochondrial Physiology Network 06.05:1-12 (2010) Version 10: 2010-08-20 ©2001-2010 Oroboros
Updates: https://wiki.oroboros.at/index.php/MiPNet06.05_Test_Experiments_on_O2k-Specifications
Test Experiments
on O2k-Specifications
Gnaiger E
Oroboros Instruments GmbH High-Resolution Respirometry Schoepfstrasse 18, A-6020 Innsbruck, Austria [email protected]; www.oroboros.at
Summary: The OROBOROS® Oxygraph with DatLab software is world-wide
the only instrument on the market which allows routine measurements to be made with specifications summarized under the term “high-resolution
respirometry”: The limit of detection of O2 flux is as low as 0.5 pmols−1cm−3.
Signal noise at zero oxygen concentration is <0.05 µM O2. Oxygen
backdiffusion at zero oxygen is <3 pmols−1cm−3, and oxygen consumption
at air saturation and standard barometric pressure (100 kPa) was 2.7 0.9
SD in 114 test runs at 37 °C. These highly standardized instrumental
background fluxes are a linear function of oxygen concentration, which is used for routine background correction of oxygen flux. Typical exponential
time constants of the oxygen sensors are <4 s, used for dynamic corrections in kinetic studies. Results of an extensive experimental test program are
presented as the basis of OROBOROS® Oxygraph specifications, which distinguish high-resolution respirometry from any conventional oxygraph
system. Acknowledgements: Supported by Austrian FFF-Project 802985 Oxygraph-2k, OROBOROS INSTRUMENTS GmbH. Technical assistance has been provided by Dr. A.V. Kuznetsov.
Section 1. Zero current .................................................. 2 Page 2. Signal noise .................................................. 5
3. Signal stability of the oxygen sensor ................. 5 4. Time constant .............................................. 12
5. Instrumental background oxygen flux .............. 12
MiPNet06.05 O2k-Specifications 2
Oroboros Instruments High-Resolution Respirometry
6. References .................................................. 13
The following test experiments were performed on the OROBOROS
Oxygraph (Paar) und routine laboratory conditions. The specifications provide a reference for the new OROBOROS Oxygraph-2k.
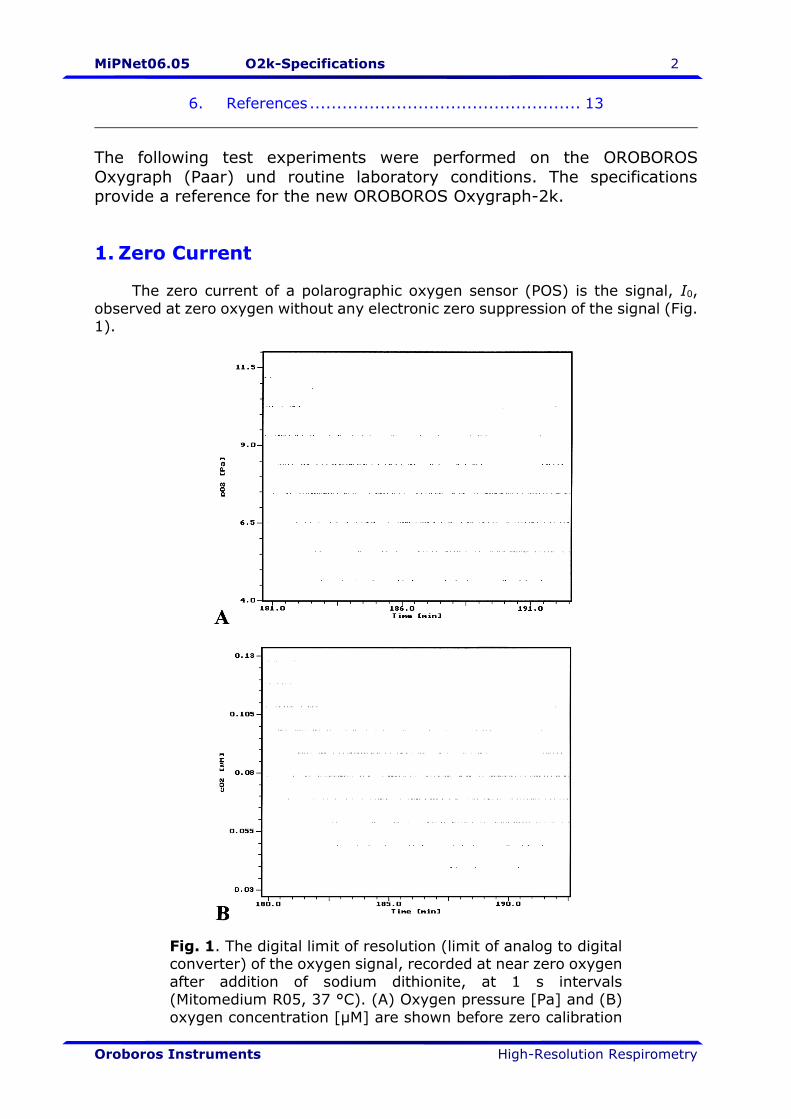
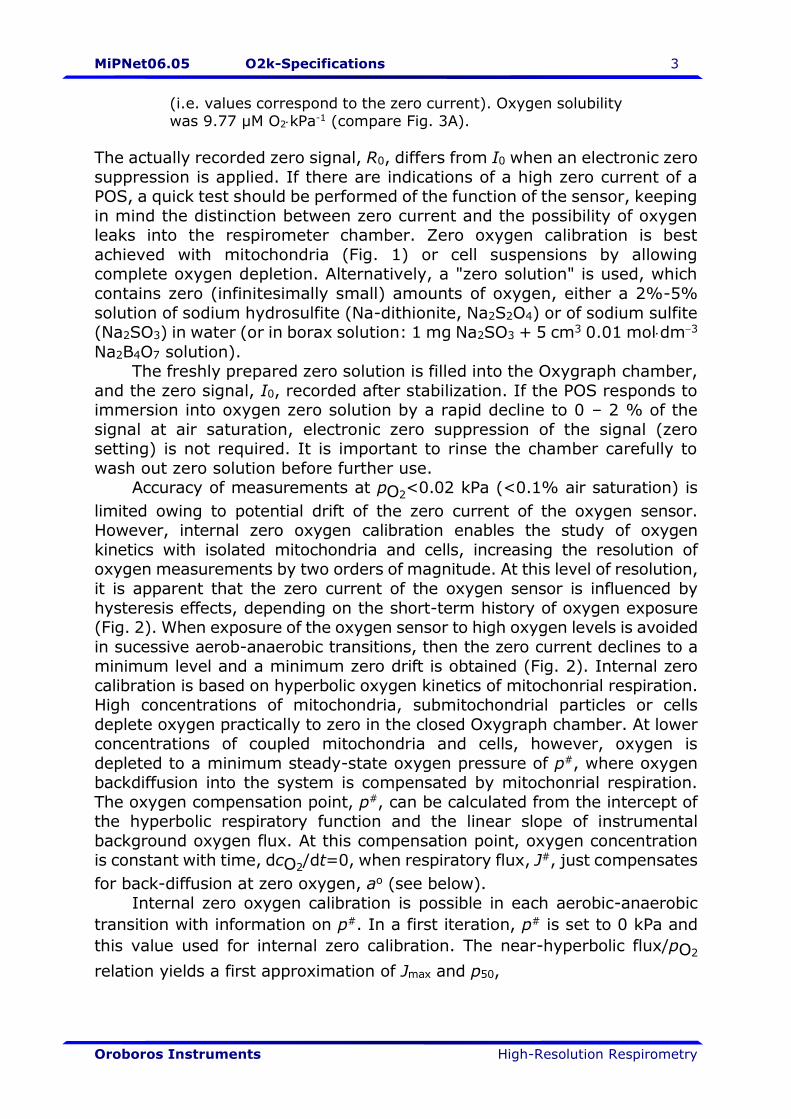
1. Zero Current The zero current of a polarographic oxygen sensor (POS) is the signal, I0,
observed at zero oxygen without any electronic zero suppression of the signal (Fig. 1).
Fig. 1. The digital limit of resolution (limit of analog to digital converter) of the oxygen signal, recorded at near zero oxygen
after addition of sodium dithionite, at 1 s intervals (Mitomedium R05, 37 °C). (A) Oxygen pressure [Pa] and (B)
oxygen concentration [µM] are shown before zero calibration
MiPNet06.05 O2k-Specifications 3
Oroboros Instruments High-Resolution Respirometry
(i.e. values correspond to the zero current). Oxygen solubility was 9.77 µM O2kPa-1 (compare Fig. 3A).
The actually recorded zero signal, R0, differs from I0 when an electronic zero
suppression is applied. If there are indications of a high zero current of a POS, a quick test should be performed of the function of the sensor, keeping
in mind the distinction between zero current and the possibility of oxygen leaks into the respirometer chamber. Zero oxygen calibration is best
achieved with mitochondria (Fig. 1) or cell suspensions by allowing complete oxygen depletion. Alternatively, a "zero solution" is used, which
contains zero (infinitesimally small) amounts of oxygen, either a 2%-5%
solution of sodium hydrosulfite (Na-dithionite, Na2S2O4) or of sodium sulfite (Na2SO3) in water (or in borax solution: 1 mg Na2SO3 + 5 cm3 0.01 moldm−3
Na2B4O7 solution). The freshly prepared zero solution is filled into the Oxygraph chamber,
and the zero signal, I0, recorded after stabilization. If the POS responds to immersion into oxygen zero solution by a rapid decline to 0 – 2 % of the
signal at air saturation, electronic zero suppression of the signal (zero setting) is not required. It is important to rinse the chamber carefully to
wash out zero solution before further use. Accuracy of measurements at pO2
<0.02 kPa (<0.1% air saturation) is
limited owing to potential drift of the zero current of the oxygen sensor. However, internal zero oxygen calibration enables the study of oxygen
kinetics with isolated mitochondria and cells, increasing the resolution of oxygen measurements by two orders of magnitude. At this level of resolution,
it is apparent that the zero current of the oxygen sensor is influenced by
hysteresis effects, depending on the short-term history of oxygen exposure (Fig. 2). When exposure of the oxygen sensor to high oxygen levels is avoided
in sucessive aerob-anaerobic transitions, then the zero current declines to a minimum level and a minimum zero drift is obtained (Fig. 2). Internal zero
calibration is based on hyperbolic oxygen kinetics of mitochonrial respiration. High concentrations of mitochondria, submitochondrial particles or cells
deplete oxygen practically to zero in the closed Oxygraph chamber. At lower concentrations of coupled mitochondria and cells, however, oxygen is
depleted to a minimum steady-state oxygen pressure of p#, where oxygen backdiffusion into the system is compensated by mitochonrial respiration.
The oxygen compensation point, p#, can be calculated from the intercept of the hyperbolic respiratory function and the linear slope of instrumental
background oxygen flux. At this compensation point, oxygen concentration is constant with time, dcO2
/dt=0, when respiratory flux, J#, just compensates
for back-diffusion at zero oxygen, ao (see below).
Internal zero oxygen calibration is possible in each aerobic-anaerobic
transition with information on p#. In a first iteration, p# is set to 0 kPa and
this value used for internal zero calibration. The near-hyperbolic flux/pO2
relation yields a first approximation of Jmax and p50,
MiPNet06.05 O2k-Specifications 4
Oroboros Instruments High-Resolution Respirometry
Eq. (1) p + p
p J =
O50
Omax
O
2
2
2
•J
Inserting J#-ao into Eq.(1), p# is calculated,
Eq. (2) J - max
•
J
J p = p 50
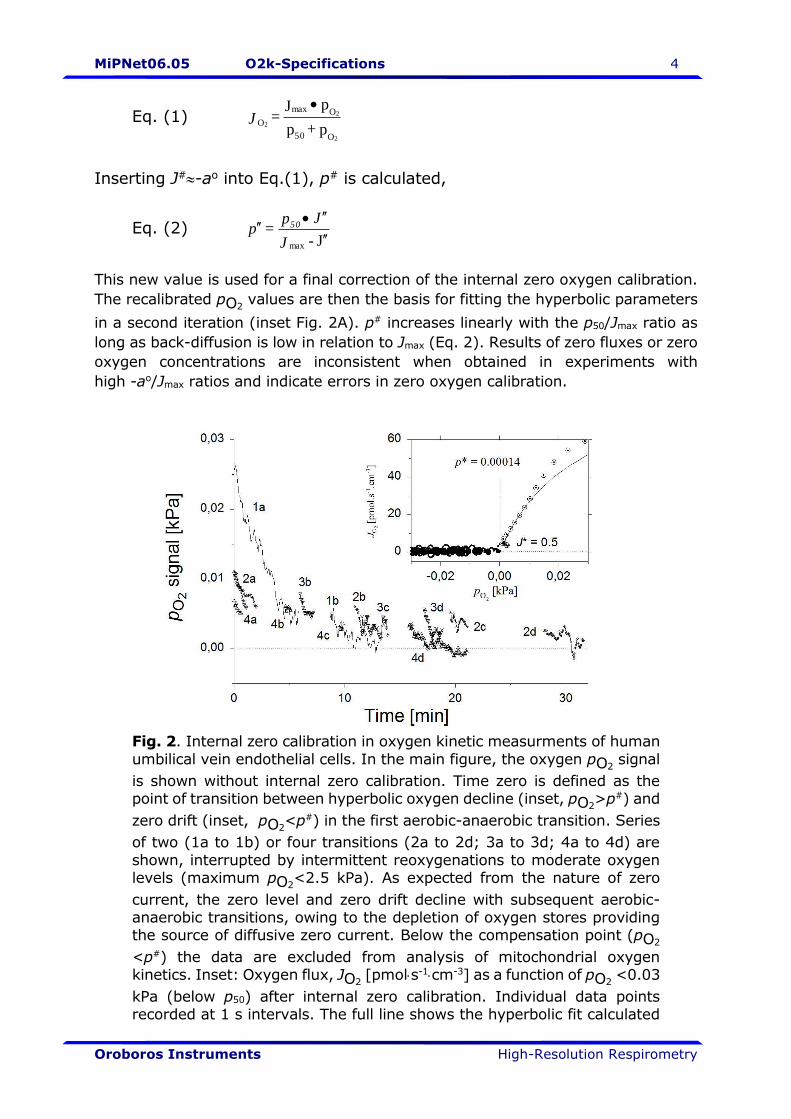
This new value is used for a final correction of the internal zero oxygen calibration.
The recalibrated pO2 values are then the basis for fitting the hyperbolic parameters
in a second iteration (inset Fig. 2A). p# increases linearly with the p50/Jmax ratio as
long as back-diffusion is low in relation to Jmax (Eq. 2). Results of zero fluxes or zero
oxygen concentrations are inconsistent when obtained in experiments with
high -ao/Jmax ratios and indicate errors in zero oxygen calibration.
Fig. 2. Internal zero calibration in oxygen kinetic measurments of human
umbilical vein endothelial cells. In the main figure, the oxygen pO2 signal
is shown without internal zero calibration. Time zero is defined as the point of transition between hyperbolic oxygen decline (inset, pO2
>p#) and
zero drift (inset, pO2<p#) in the first aerobic-anaerobic transition. Series
of two (1a to 1b) or four transitions (2a to 2d; 3a to 3d; 4a to 4d) are
shown, interrupted by intermittent reoxygenations to moderate oxygen levels (maximum pO2
<2.5 kPa). As expected from the nature of zero
current, the zero level and zero drift decline with subsequent aerobic-anaerobic transitions, owing to the depletion of oxygen stores providing the source of diffusive zero current. Below the compensation point (pO2
<p#) the data are excluded from analysis of mitochondrial oxygen kinetics. Inset: Oxygen flux, JO2
[pmols-1cm-3] as a function of pO2 <0.03
kPa (below p50) after internal zero calibration. Individual data points recorded at 1 s intervals. The full line shows the hyperbolic fit calculated
MiPNet06.05 O2k-Specifications 5
Oroboros Instruments High-Resolution Respirometry
for the low oxygen range <1.1 kPa. Apparently “negative” oxygen signals are obtained due to zero drift (trace 1a). The dotted lines are J# and p# crossing at the compensation point. p# cannot be determined from a pO2
/time plot shown in the main figure. 0.01 kPa corresponds to 0.05 % standard air saturation.
2. Signal Noise
The minimum signal noise must be compared with the resolution of the
analog/digital (A/D) converter. The resolution of the A/D converter is 1 Pa (0.001 kPa) or 0.01 µM (Fig. 1). Noise (SD) of the oxygen signal at air
saturation ranged between 0.01 to 0.04 µM, corresponding to 0.01 to
0.04 % of the mean. The average SD for 6 oxygen sensors measured at air
saturation and 37 °C was 0.0052 kPa (SD of mean SD was 0.0030 kPa;
compare Tab. 1b).
Noise declined linearly with oxygen level (Fig. 4 and 5). At zero oxygen, noise was about half of that observed at air saturation (Tab. 1 and Fig. 4).
These test refer to the old OROBOROS Oxygraph (Paar), whereas the
advanced electronics of the Oxygraph-2k has improved particularly the resolution of low oxygen levels.
3. Signal Stability of the Oxygen Sensor
The stability of the oxygen signal at air saturation is influenced by the stability of the zero current and the oxygen-dependent response. Sensor
stability is checked when recording the oxygen signal at zero oxygen (Fig. 5) and at air saturation over sufficiently long periods of time (Fig. 6). Drift
of the sensor signal causes irregular apparent fluxes, calculated as the slope over such calibration sections. These slopes must not be significantly
different from zero (Fig. 5).
Noise and drift of the POS in the Oxygraph chamber usually have different causes. For diagnosis in the respirometer, it is most important to
discriminate the type and source of the disturbance, which may occur (1) strictly simultaneously in both chambers, or (2) entirely independent in only
one chamber. Simultaneous noise or drift: A strictly simultaneous disturbance may
be due to a failure in the temperature regulation or stirrer regulation of the respirometer. In the open-mode for equilibration with the gas phase,
changes in barometric pressure will influence the signal in both chambers which, however, has to be distinguished from drift (Fig. 6A,B).
Independent irregularity in one chamber: This type of disturbance may be due to various reasons: The membrane of the POS may be damaged,
the electrolyte may be too old or contain a large gas bubble, or the cathode or anode may require cleaning. The magnetic stirrer of one chamber may
cause problems. If service precautions do not solve the problem, the two

MiPNet06.05 O2k-Specifications 6
Oroboros Instruments High-Resolution Respirometry
sensor heads can be exchanged to distinguish a chamber-specific from a
sensor-specific defect.
MiPNet06.05 O2k-Specifications 7
Oroboros Instruments High-Resolution Respirometry
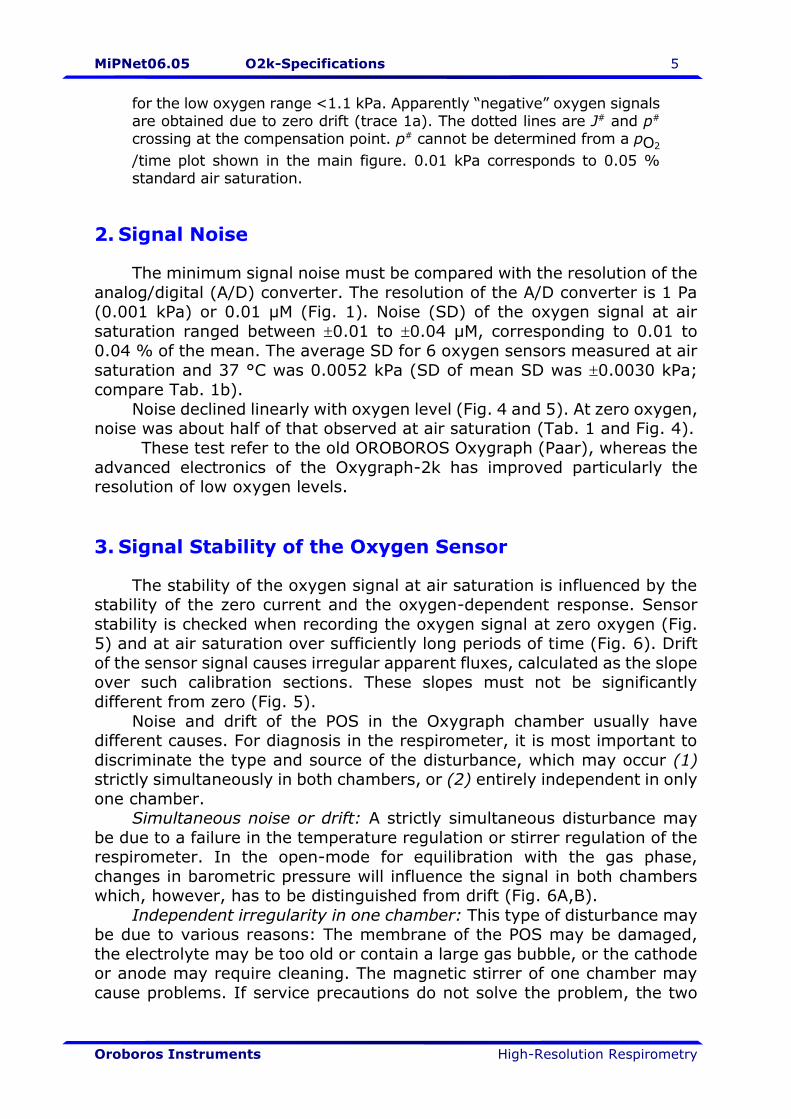
Fig.3. Noise of oxygen signal (A) and oxygen flux (B) measured at step-wise
reduced oxygen levels in an instrumental background experiment (Mitomedium
R05, 37 °C). (A) Deviations from the average oxygen signal, cO2 [nM=pmol.cm−3],
are shown at each oxygen level, indicated by numbers (top, pO2 [kPa]; bottom, cO2
[µM]). The signal was not smoothed (compare Fig. 3B, closed symbols). (B)
Deviations from average background flux, JO2° [pmol.s−1.cm-3], are shown at each
oxygen level (see A). The corresponding steady-state background fluxes are
indicated by numbers (bottom; JO2° [pmol.s−1.cm-3]; see Fig. 3A). Flux was
calculated on the basis of smoothed oxygen signal (moving average, N=30) as the negative time derivative, using a standard routine of DatLab (compare Fig. 4C,
closed symbols). Zero oxygen was obtained after addition of sodium dithionite (A), resulting in zero flux (B). No data points are shown during transitions between
steady-state oxygen levels. Symbols show individual data points measured at 1 s intervals. Bars indicate SD.
MiPNet06.05 O2k-Specifications 8
Oroboros Instruments High-Resolution Respirometry
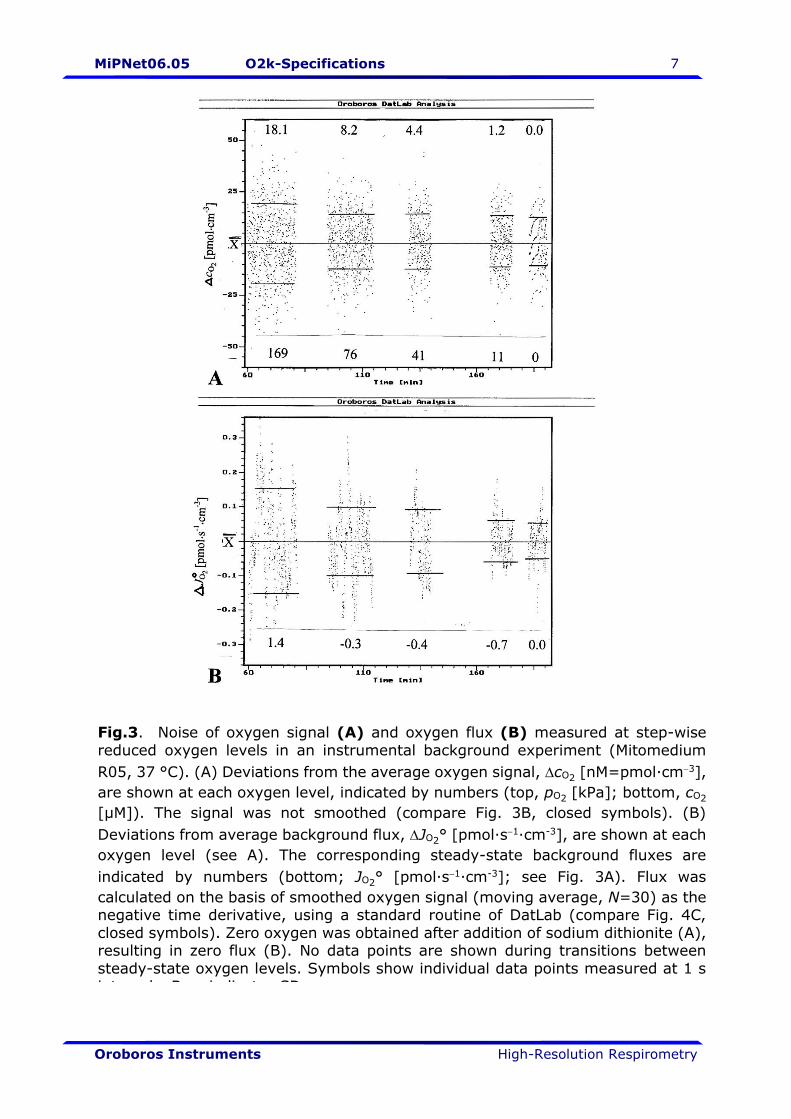
Fig. 4. Instrumental background and noise of oxygen signal and oxygen flux as a function of oxygen concentration (two separate experiments, Mitomedium R05, 37 °C). (A) Steady-state background flux, J°O2, as a function of oxygen concentration.
(B) Signal noise, expressed as SD of the mean oxygen concentration
[nM=pmol.cm-3], as a function of oxygen concentration, cO2 [µM=nmol.cm-3]. At
air saturation, SD is <0.02 % of the mean. (C) Noise of background oxygen flux
[pmol.s-1.cm-3] as a function of cO2, obtained by DatLab analysis using a moving
average with 30 data points. For oxygen flux, the SD of <0.2 pmol.s-1.cm-3 is 20
% of the limit of resolution of flux at 1 pmol.s-1.cm-3. Closed symbols refer to data
shown in Fig. 2. The oxygen solubility was 9.77 µM.kPa-1.
MiPNet06.05 O2k-Specifications 9
Oroboros Instruments High-Resolution Respirometry
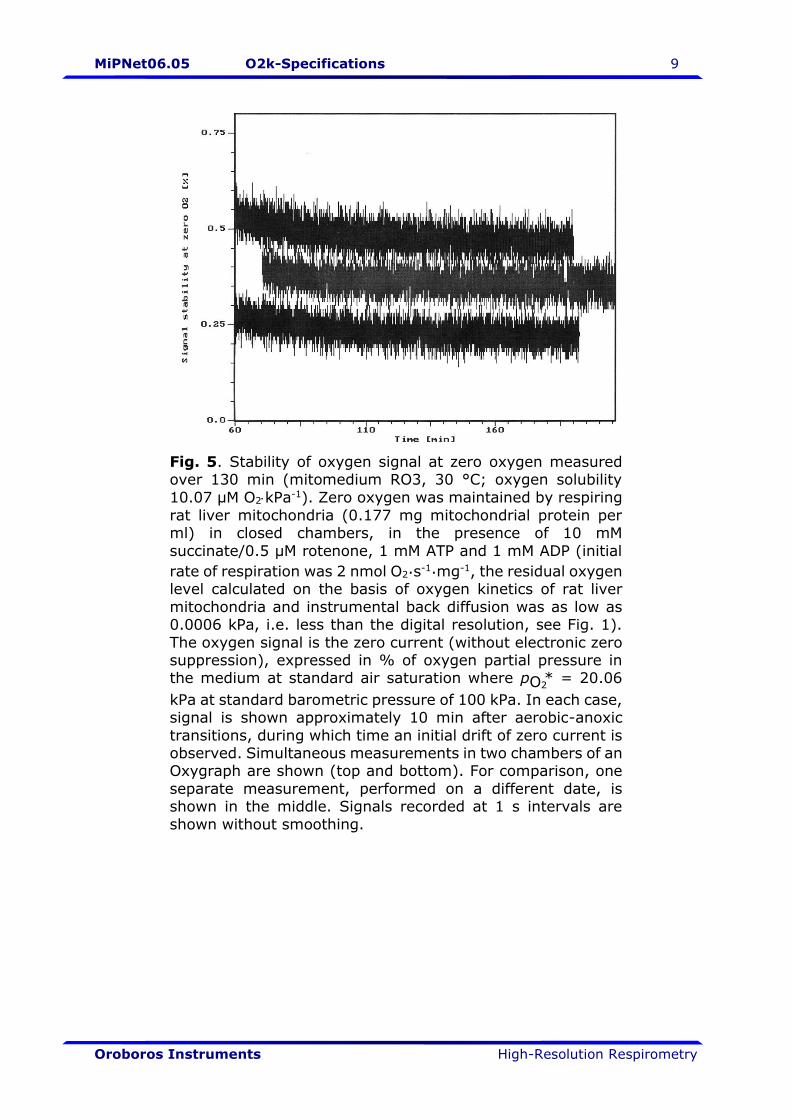
Fig. 5. Stability of oxygen signal at zero oxygen measured over 130 min (mitomedium RO3, 30 °C; oxygen solubility
10.07 µM O2kPa-1). Zero oxygen was maintained by respiring
rat liver mitochondria (0.177 mg mitochondrial protein per ml) in closed chambers, in the presence of 10 mM
succinate/0.5 µM rotenone, 1 mM ATP and 1 mM ADP (initial
rate of respiration was 2 nmol O2.s-1.mg-1, the residual oxygen level calculated on the basis of oxygen kinetics of rat liver
mitochondria and instrumental back diffusion was as low as 0.0006 kPa, i.e. less than the digital resolution, see Fig. 1).
The oxygen signal is the zero current (without electronic zero suppression), expressed in % of oxygen partial pressure in the medium at standard air saturation where pO2
* = 20.06
kPa at standard barometric pressure of 100 kPa. In each case, signal is shown approximately 10 min after aerobic-anoxic
transitions, during which time an initial drift of zero current is observed. Simultaneous measurements in two chambers of an Oxygraph are shown (top and bottom). For comparison, one
separate measurement, performed on a different date, is shown in the middle. Signals recorded at 1 s intervals are
shown without smoothing.
MiPNet06.05 O2k-Specifications 10
Oroboros Instruments High-Resolution Respirometry
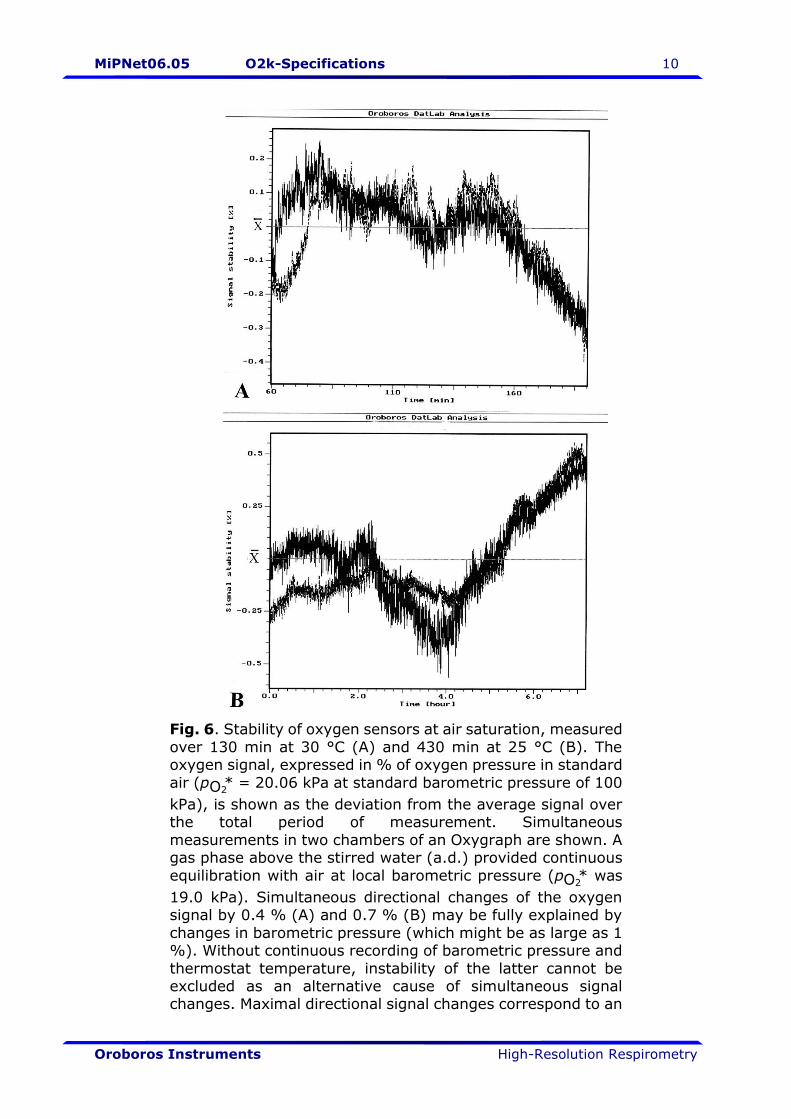
Fig. 6. Stability of oxygen sensors at air saturation, measured
over 130 min at 30 °C (A) and 430 min at 25 °C (B). The oxygen signal, expressed in % of oxygen pressure in standard
air (pO2* = 20.06 kPa at standard barometric pressure of 100
kPa), is shown as the deviation from the average signal over the total period of measurement. Simultaneous
measurements in two chambers of an Oxygraph are shown. A gas phase above the stirred water (a.d.) provided continuous
equilibration with air at local barometric pressure (pO2* was
19.0 kPa). Simultaneous directional changes of the oxygen signal by 0.4 % (A) and 0.7 % (B) may be fully explained by
changes in barometric pressure (which might be as large as 1 %). Without continuous recording of barometric pressure and
thermostat temperature, instability of the latter cannot be excluded as an alternative cause of simultaneous signal changes. Maximal directional signal changes correspond to an
MiPNet06.05 O2k-Specifications 11
Oroboros Instruments High-Resolution Respirometry
“apparent oxygen flux” of 0.3 to 0.4 pmol.s−1.cm−3 (A;
between 140 and 190 min) and -0.2 pmol.s−1.cm−3 (B;
between 4 and 7 hours). These apparent instabilities are
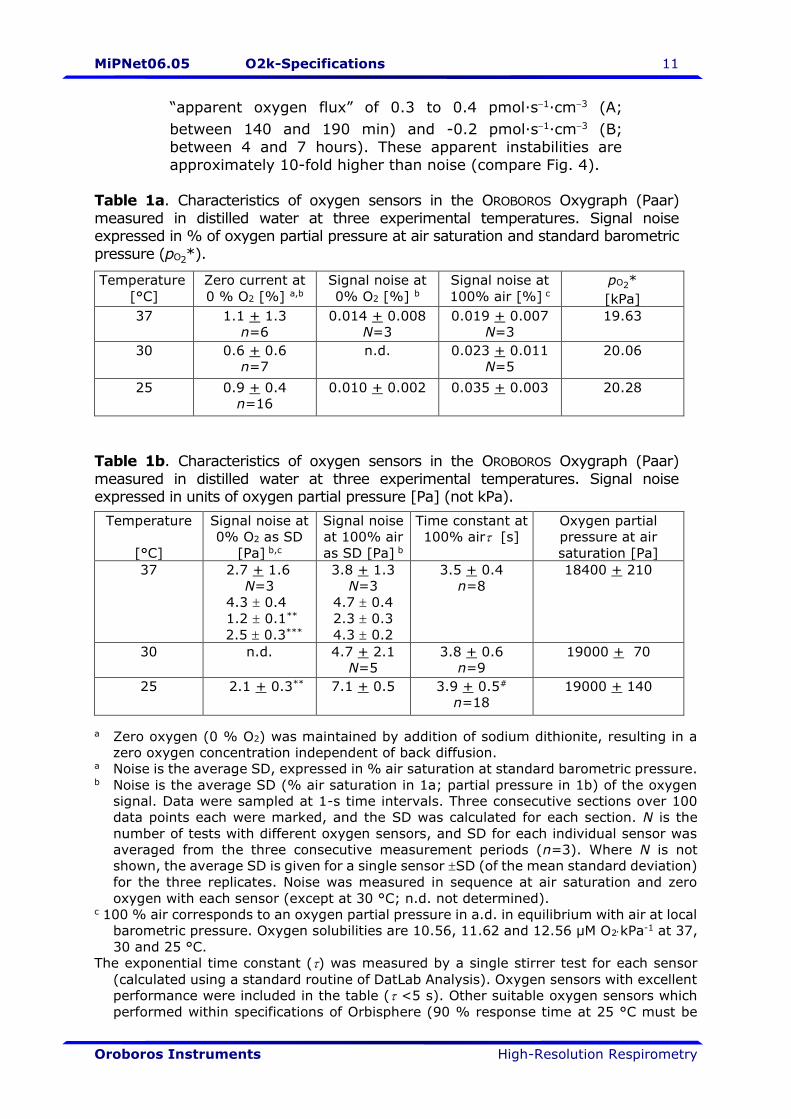
approximately 10-fold higher than noise (compare Fig. 4). Table 1a. Characteristics of oxygen sensors in the OROBOROS Oxygraph (Paar)
measured in distilled water at three experimental temperatures. Signal noise expressed in % of oxygen partial pressure at air saturation and standard barometric
pressure (pO2*).
Temperature
[°C]
Zero current at
0 % O2 [%] a,b
Signal noise at
0% O2 [%] b
Signal noise at
100% air [%] c
pO2*
[kPa]
37
1.1 + 1.3
n=6
0.014 + 0.008
N=3
0.019 + 0.007
N=3
19.63
30
0.6 + 0.6
n=7
n.d. 0.023 + 0.011
N=5
20.06
25 0.9 + 0.4
n=16
0.010 + 0.002 0.035 + 0.003 20.28
Table 1b. Characteristics of oxygen sensors in the OROBOROS Oxygraph (Paar)
measured in distilled water at three experimental temperatures. Signal noise expressed in units of oxygen partial pressure [Pa] (not kPa).
Temperature
[°C]
Signal noise at
0% O2 as SD
[Pa] b,c
Signal noise
at 100% air
as SD [Pa] b
Time constant at
100% air [s]
Oxygen partial
pressure at air
saturation [Pa]
37
2.7 + 1.6
N=3
4.3 0.4
1.2 0.1**
2.5 0.3***
3.8 + 1.3
N=3
4.7 0.4
2.3 0.3
4.3 0.2
3.5 + 0.4
n=8
18400 + 210
30
n.d. 4.7 + 2.1
N=5
3.8 + 0.6
n=9
19000 + 70
25
2.1 + 0.3** 7.1 + 0.5 3.9 + 0.5#
n=18
19000 + 140
a Zero oxygen (0 % O2) was maintained by addition of sodium dithionite, resulting in a
zero oxygen concentration independent of back diffusion. a Noise is the average SD, expressed in % air saturation at standard barometric pressure. b Noise is the average SD (% air saturation in 1a; partial pressure in 1b) of the oxygen
signal. Data were sampled at 1-s time intervals. Three consecutive sections over 100
data points each were marked, and the SD was calculated for each section. N is the
number of tests with different oxygen sensors, and SD for each individual sensor was
averaged from the three consecutive measurement periods (n=3). Where N is not
shown, the average SD is given for a single sensor SD (of the mean standard deviation)
for the three replicates. Noise was measured in sequence at air saturation and zero
oxygen with each sensor (except at 30 °C; n.d. not determined). c 100 % air corresponds to an oxygen partial pressure in a.d. in equilibrium with air at local
barometric pressure. Oxygen solubilities are 10.56, 11.62 and 12.56 µM O2kPa-1 at 37,
30 and 25 °C.
The exponential time constant () was measured by a single stirrer test for each sensor
(calculated using a standard routine of DatLab Analysis). Oxygen sensors with excellent
performance were included in the table ( <5 s). Other suitable oxygen sensors which
performed within specifications of Orbisphere (90 % response time at 25 °C must be
MiPNet06.05 O2k-Specifications 12
Oroboros Instruments High-Resolution Respirometry
<25 s) were analyzed separately (mean at 25 °C: 7.1+1.7 s, n=9). Sensors with 90
% response times >25 s frequently show a biphasic time response, with an exponential
phase followed by a much slower response phase and were excluded from this analysis. # - significantly different from 37 °C (P<0.05).
** and *** - significantly different from 100 % air (P<0.01 and <0.001, respectively).
4. Time Constant
Dynamic calibration of the oxygen sensor requires the determination of the exponential time constant, . can then be used for the time correction
(deconvolution) of the Oxygraph signal. While time correction is unnecessary for steady-state experiments (during periods of constant oxygen flux), it may critically influence the quantitative results in non-steady-state experiments, typical of many
kinetic applications (ADP pulse titrations, oxygen kinetics). Results of the time constant of different sensors (stirrer tests) are summarized in Table 1b.
5. Instrumental Background Oxygen Flux
In the OROBOROS® Oxygraph, the flux of oxygen back-diffusion at zero oxygen, ao, is usually -2 pmol.s-1.cm-3 when measured at 25 to 37 oC in a volume of 2 cm3. Background oxygen flux due to oxygen consumption by POS in the
saturation range is c. 2-3 pmol.s-1.cm-3. The point of compensation with zero background flux occurs typically at c. 40% air saturation (Fig. 4A). If the
background of an Oxygraph chamber exceeds this range in either direction by significantly more than 1 pmol.s-1.cm-3, a careful check of the system is required. "Odd" backgrounds usually indicate an instrumental problem.
For establishing automatically applied background parameters used in DatLab analysis, a large number of background measurements was performed at different
experimental temperatures (Tab. 2).
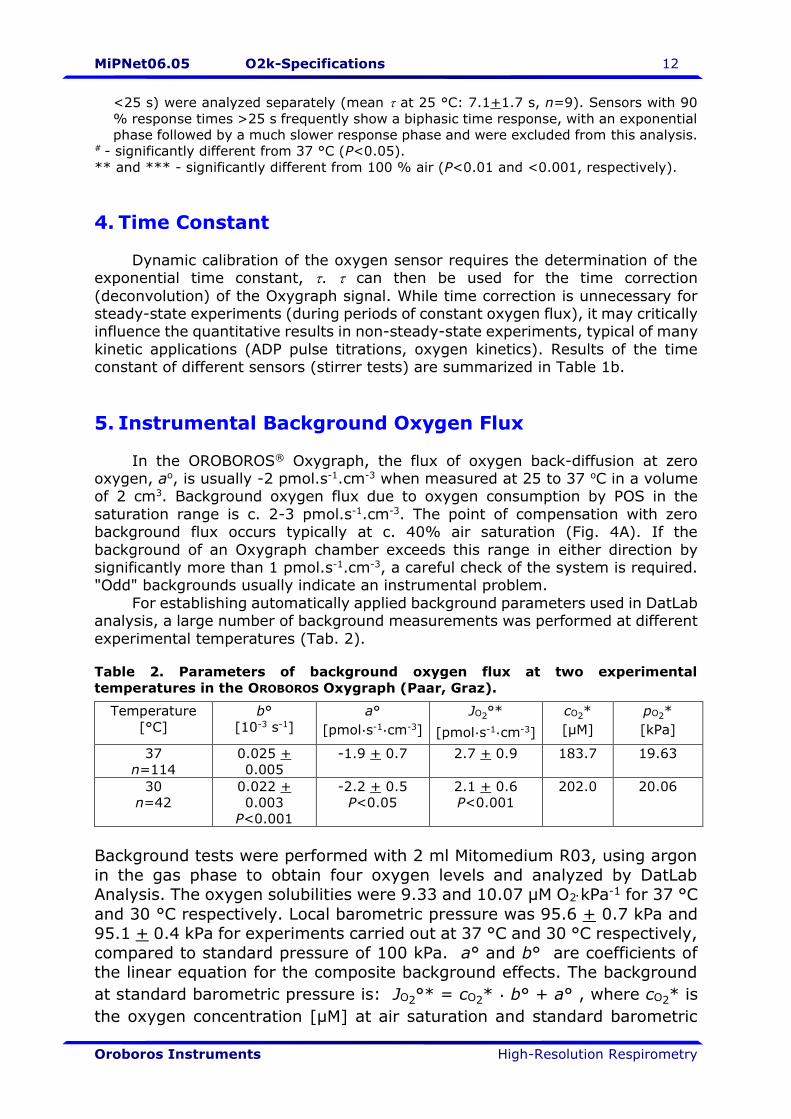
Table 2. Parameters of background oxygen flux at two experimental
temperatures in the OROBOROS Oxygraph (Paar, Graz).
Temperature
[°C]
b°
[10-3 s-1]
a°
[pmol.s-1.cm-3]
JO2°*
[pmol.s-1.cm-3]
cO2*
[µM]
pO2*
[kPa]
37
n=114
0.025 +
0.005
-1.9 + 0.7 2.7 + 0.9 183.7 19.63
30
n=42
0.022 +
0.003
P<0.001
-2.2 + 0.5
P<0.05
2.1 + 0.6
P<0.001
202.0
20.06
Background tests were performed with 2 ml Mitomedium R03, using argon
in the gas phase to obtain four oxygen levels and analyzed by DatLab Analysis. The oxygen solubilities were 9.33 and 10.07 µM O2kPa-1 for 37 °C
and 30 °C respectively. Local barometric pressure was 95.6 + 0.7 kPa and 95.1 + 0.4 kPa for experiments carried out at 37 °C and 30 °C respectively,
compared to standard pressure of 100 kPa. a° and b° are coefficients of the linear equation for the composite background effects. The background
at standard barometric pressure is: JO2°* = cO2* . b° + a° , where cO2* is
the oxygen concentration [µM] at air saturation and standard barometric
MiPNet06.05 O2k-Specifications 13
Oroboros Instruments High-Resolution Respirometry
pressure of 100 kPa (corresponding to the partial pressure of oxygen, pO2*).
n is the number of background determinations, using different chambers in
the two-chamber oxygraph, including different individual instruments.
6. References
Gnaiger E, Steinlechner-Maran R, Mendez G, Eberl T, Margreiter R (1995) Control of mitochondrial and cellular respiration by oxygen. J. Bioenerg. Biomembr.
27: 583-596. Gnaiger E, Lassnig B, Kuznetsov AV, Rieger G, Margreiter R (1998) Mitochondrial
oxygen affinity, respiratory flux control and excess capacity of cytochrome c oxidase. J. exp. Biol. 201: 1129-1139.
Gnaiger E, Méndez G, Hand SC (2000) High phosphorylation efficiency and
depression of uncoupled respiration in mitochondria under hypoxia. Proc. Natl. Acad. Sci. USA 97: 11080-11085.
Gnaiger E (2001) Bioenergetics at low oxygen: dependence of respiration and phosphorylation on oxygen and adenosine diphosphate supply. Respir.
Physiol. 128: 277-291. Méndez G, Gnaiger E (1994) How does oxygen pressure control oxygen flux in
isolated mitochondria? A methodological approach by high-resolution
respirometry and digital data analysis. In: What is Controlling Life? (Gnaiger E, Gellerich FN, Wyss M, eds) Modern Trends in BioThermo-Kinetics 3.
Innsbruck Univ. Press: 191-194. Steinlechner-Maran R, Eberl T, Kunc M, Margreiter R, Gnaiger E (1996) Oxygen dependence of respiration in coupled and uncoupled endothelial cells. Am. J.
Physiol. 271: C2053-C2061.