Embed Size (px)
Citation preview
Surface oxygen exchange between yttria-stabilised zirconia
and a low-temperature oxygen rf-plasma
Marcus Rohnkea, Jurgen Janeka,*, John A. Kilnerb, Richard J. Chaterb
aPhysikalisch-Chemisches Institut, Justus-Liebig-Universitat Giessen, Heinrich-Buff-Ring 58, 35392 Giessen, GermanybDepartment of Materials, Imperial College of Science, Technology and Medicine, Prince Consort Road, London SW7 2BP, UK
Received 22 November 2002; received in revised form 5 August 2003; accepted 1 October 2003
Abstract
Isotope Exchange/Depth Profiling (IEDP) using Secondary Ion Mass Spectrometry (SIMS) has been used to determine the oxygen tracer
diffusion and surface exchange coefficients of (100) oriented 9.5 mol% yttria stabilised zirconia single crystals. Exchange experiments
performed with molecular oxygen are compared with the exchange using an oxygen plasma. The surface exchange coefficient for
specimens in a plasma is up to 100 times higher compared to measurements with normal molecular oxygen. For the exchange experiments
we used an inductively coupled radio frequency (rf) oxygen plasma with a maximum radio frequency power of 250 W. Double probe
measurements and optical emission spectrometry are used for the characterisation of the plasma. The measured electron temperatures are
within the range of 5–12 eV.
D 2003 Elsevier B.V. All rights reserved.
PACS: 52.25; 52.40.H; 82.65.Yh
Keywords: Low temperature plasma; Oxygen surface exchange; SIMS; Yttria Stabilised Zirconia (YSZ); Surface kinetics
1. Introduction
A knowledge of the kinetics of oxygen incorporation into
(and release from) a solid electrolyte is very important for
the further development of solid oxide fuel cells, membrane
reactors, sensors and electrochemical promotion in hetero-
geneous catalysis. In particular at low temperatures the
kinetics is usually relatively slow due to the participation
of steps with high thermal activation. Different kinds of
catalysing electrodes, for example oxide perovskites or
platinum, are often used to accelerate such processes [1].
Various methods have been applied to obtain information on
the kinetics and the rate-limiting step. Usually kinetic
studies are performed by stoichiometry relaxation experi-
ments and are evaluated via conductivity relaxation [2,3].
The second and often applied method is impedance spec-
troscopy, which offers valuable information on boundary
resistances and capacities [4]. Furthermore 18O/16O isotope
exchange experiments are also used for the quantification of
the exchange kinetics [5,6]. More recently Merkle et al.
investigated the oxygen incorporation kinetics of Fe-doped
SrTiO3 in stoichiometry relaxation experiments using UV–
Vis spectroscopy. They showed that the incorporation of
oxygen in this case is influenced by UV irradiation with
photons, which excite electron-hole pairs [7]. As Maier
points out in [8], these different methods offer different
information on the microscopic processes. In contrast to
stoichiometry relaxation (non-equilibrium experiment) one
cannot distinguish between the in- and excorporation of
oxygen in the isotope exchange experiment (equilibrium
experiment).
Examining the exchange mechanism of oxygen in oxides
more closely we have to distinguish generally between
electron-rich and electron-poor materials. In electron-rich
materials with either a small band gap or sufficient n-
doping, the reduction of oxygen should be relatively fast
or at least not be limited by electron transfer. The reduction
step might be rate limiting in electron-poor materials as is
the case for all zirconia-based solid electrolytes. The incor-
poration of oxygen can be divided generally into several
steps: Firstly, an oxygen molecule has to adsorb on the
0167-2738/$ - see front matter D 2003 Elsevier B.V. All rights reserved.
doi:10.1016/j.ssi.2003.10.005
* Corresponding author. Tel.: +49-641-99-34500; fax: +49-641-99-
34509.
E-mail address: [email protected] (J. Janek).
www.elsevier.com/locate/ssi
Solid State Ionics 166 (2004) 89–102
Zuerst erschienen in: Solid State Ionics 166 (2004) 1/2, 89-102
surface. This process is controlled mainly by the oxygen gas
pressure and the oxygen sticking coefficient, and we can
formulate an adsorption isotherm. The reduction of O2
molecules may proceed via different reaction channels.
The following sequence for the formation of reduced
species has been proposed by different authors in the
literature [9,10]:
O2;ads ! O�2;ads ! O2�
2;ads ! 2O�ads ! 2O�
lattice ð1Þ
The dissociation of the neutral and free oxygen mol-
ecule requires a high dissociation energy of 498 kJ/mol
(5.2 eV), thus is a highly improbable step. The formation
of singly and doubly charged molecular anions (superox-
ide and peroxide ion) reduces the dissociation energy and
increases the rate of dissociation. It was shown by EPR
spectroscopy that the formation of O2� species takes place
at room temperature [11]. Whether Eq. (1) describes the
real sequence of microscopic steps at operational temper-
atures is yet not known. Currently there are no in situ
experiments available which might prove the complete
sequence.
Most surface analytical methods are restricted to UHV
conditions and thus do probably not provide data relevant
for oxygen exchange kinetics under atmospheric conditions.
However valuable information on microscopic electrode
processes in the Pt/YSZ system has recently been obtained
by photoelectron microscopy (PEEM) and microspectro-
scopy (SPEM) under in situ conditions [12].
Manning et al. [13] showed for yttria stabilised zirconia
(YSZ), an electron-poor material, that the rate-determining
step of the oxygen exchange appears to be the dissociation
of oxygen above 700 jC [14]. He analysed 18O/16O ex-
change experiments via two different techniques: He ana-
lysed the concentration profile of 18O in YSZ and also
determined the composition of the gas phase during the
exchange experiment. Below this temperature there must be
also other slow kinetic steps, as in the gas phase analysis he
detected a large amount of 16O18O species. This mixed
species is expected if the dissociation rate of oxygen
molecules is fast compared to the oxygen incorporation
step. Nevertheless a higher concentration of activated oxy-
gen species on the surface should result in a higher rate of
incorporation.
Based on Manning’s findings, one may ask whether
the direct supply with atomic oxygen increases the
exchange rate. As is well known from plasma physics,
oxygen plasmas often contain a significant fraction of
atomic oxygen [15]. Consequently we are interested
whether there is a difference in the exchange kinetics
using a low temperature oxygen plasma instead of mo-
lecular oxygen.
Plasma enhanced exchange reactions are also interesting
from another point of view. Recently De Ridder published
careful experimental studies of the influence of surface
segregation effects on the exchange kinetics of YSZ and
of surface cleaning procedures (mainly polycrystaline speci-
mens) [16]. He measured a pronounced difference in the
reactivity of clean YSZ surfaces and surfaces with segre-
gated impurities. In addition he found, that surface cleaning
in an oxygen plasma combined with annealing is one of the
two most efficient methods to obtain clean YSZ surfaces. As
the better method De Ridder proposes the use of an atomic
oxygen source.
To investigate the influence of excited oxygen species
on the surface kinetics we performed isotopic exchange
experiments on 9.5 mol% yttria stabilised zirconia single
crystals in oxygen atmospheres under thermal and plasma
conditions. YSZ is an excellent oxygen ion conductor at
high temperatures and has a very low electronic conduc-
tivity. For simplification the transference number of the
ions can be set equal to 1 [17]. The ionic mobility
depends strongly on the temperature due to its thermally
activated character and in most applications YSZ can only
be used above 350 jC. The material has a band gap in
the order of 5.2 eV [18], thus only UV radiation with a
wave length of less than 240 nm may influence the
kinetics by electron-hole formation.
2. Experimental
2.1. Experimental setup
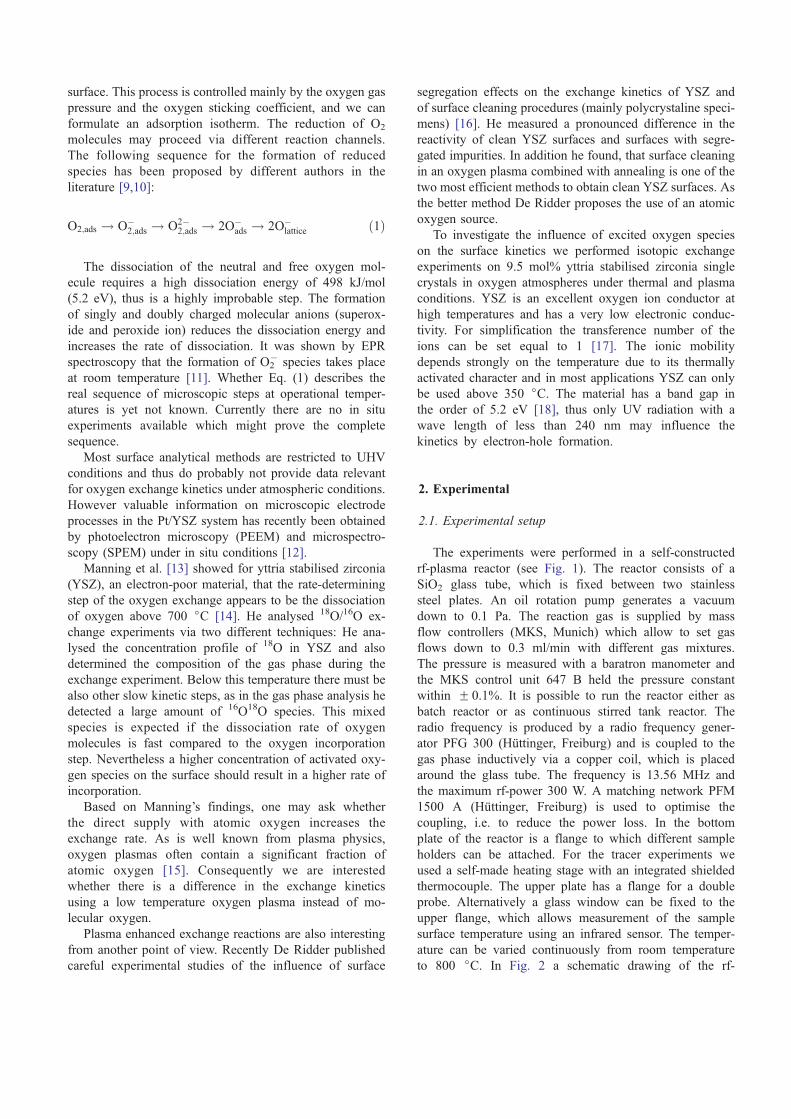
The experiments were performed in a self-constructed
rf-plasma reactor (see Fig. 1). The reactor consists of a
SiO2 glass tube, which is fixed between two stainless
steel plates. An oil rotation pump generates a vacuum
down to 0.1 Pa. The reaction gas is supplied by mass
flow controllers (MKS, Munich) which allow to set gas
flows down to 0.3 ml/min with different gas mixtures.
The pressure is measured with a baratron manometer and
the MKS control unit 647 B held the pressure constant
within F 0.1%. It is possible to run the reactor either as
batch reactor or as continuous stirred tank reactor. The
radio frequency is produced by a radio frequency gener-
ator PFG 300 (Huttinger, Freiburg) and is coupled to the
gas phase inductively via a copper coil, which is placed
around the glass tube. The frequency is 13.56 MHz and
the maximum rf-power 300 W. A matching network PFM
1500 A (Huttinger, Freiburg) is used to optimise the
coupling, i.e. to reduce the power loss. In the bottom
plate of the reactor is a flange to which different sample
holders can be attached. For the tracer experiments we
used a self-made heating stage with an integrated shielded
thermocouple. The upper plate has a flange for a double
probe. Alternatively a glass window can be fixed to the
upper flange, which allows measurement of the sample
surface temperature using an infrared sensor. The temper-
ature can be varied continuously from room temperature
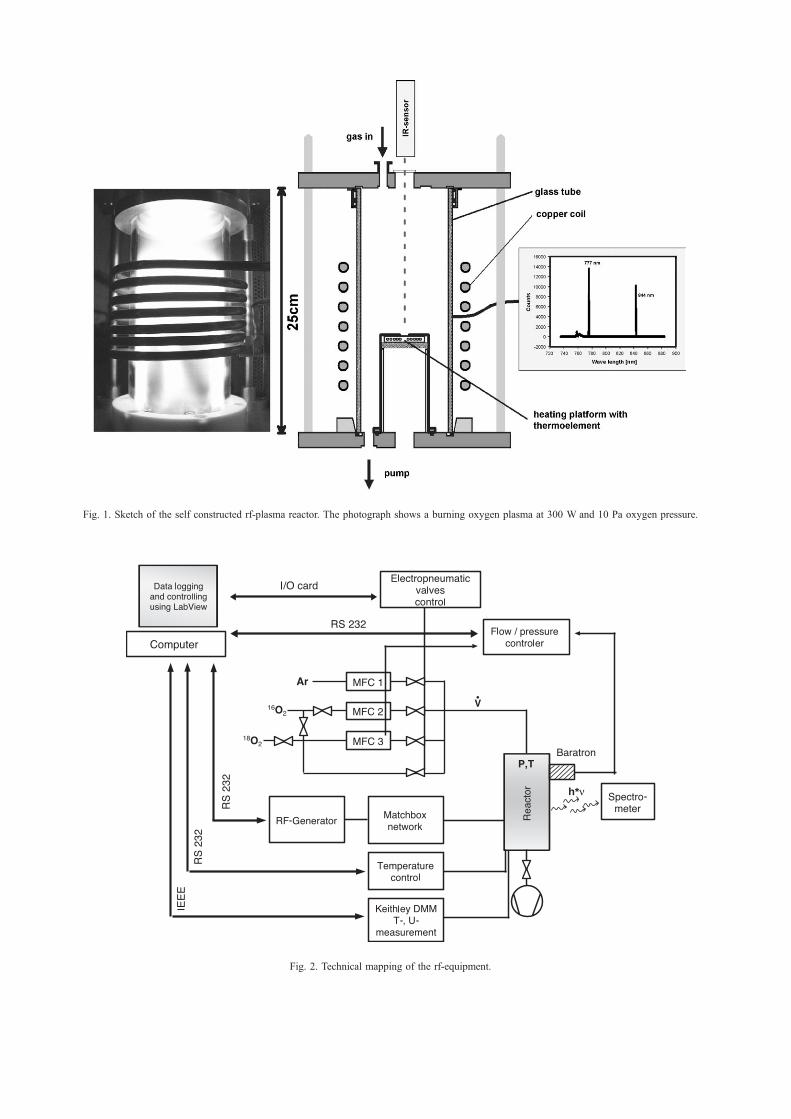
to 800 jC. In Fig. 2 a schematic drawing of the rf-
h*ν
Fig. 2. Technical mapping of the rf-equipment.
Fig. 1. Sketch of the self constructed rf-plasma reactor. The photograph shows a burning oxygen plasma at 300 W and 10 Pa oxygen pressure.
equipment is shown. The system is completely computer-
controlled employing LabViewR (National Instruments) as
a graphical programming language.
2.2. Plasma diagnostics
Since the plasma parameters depend strongly on the
geometry of the reactor it was necessary to characterise
the oxygen plasma before the exchange experiments.
Using a shielded thermocouple (0.5 mm diameter) we
measured the kinetic temperature of (neutral and ionic)
particles in the oxygen plasma in z-direction (parallel to
the axis of the glass tube) as a function of the rf-power.
Furthermore the optical and UV-plasma emission was
determined by optical emission spectrometry (MS257,
LOT-Oriel, Darmstadt). The emission was transferred via
fibre optics from the glass tube to the spectrometer. The
analysis offers qualitative information on changes in the
atomic oxygen concentration. It was not possible to
measure the atomic oxygen concentration quantitatively
in absolute numbers.
In addition we realised double probe measurements with
a self made double probe. The double probe consists of two
Pt-wires (0.3 mm diameter, 10 mm long, 10 mm distance).
For the I–U measurements we used a sourcemeter (Keith-
ley, model 2400).
2.3. Sample preparation
In order to obtain reliable data from the SIMS
measurements, the sample surface had to be as smooth
as possible. The 100-orientated YSZ (9.5 mol%, TBL-
Kelpin, Neuhausen) single crystals were polished with
different grades of diamond abrasive down to 0.25 Am.
The final polishing was done with 0.02 Am SiO2 abra-
sive. Prior to oxygen exchange all samples were ultra-
sonic-cleaned in acetone and afterwards plasma-cleaned
for 600 s (150 W rf-power at 10 Pa oxygen pressure), cf.
[19] for a comparison of different cleaning procedures.
For the SIMS analysis cross sections of the samples were
prepared after each exchange experiment by embedding,
cutting with a low speed saw and polishing as already
described.
2.4. Isotope exchange and SIMS
The plasma reactor was evacuated to a pressure lower
than 0.5 Pa before normal oxygen (99.8% purity) was
introduced. The samples were then annealed under a
continuous flow of oxygen at the required temperature
for two days and thereafter plasma-cleaned. The plasma
apparatus was then evacuated to the base pressure and
subsequently the isotope 18O (99.9%, Linde) was let in.
After the isotopic annealing the samples were cooled
down rapidly and the oxygen atmosphere was exchanged
by a high argon flux.
For SIMS analysis we used an Atomika 6500 ion
microprobe, equipped with a quadrupole mass analyser.
Primary Ar+ ions with an energy of 8 keV were used. To
prevent sample charging during the analysis, the samples
were co-bombarded with a 1 keV electron beam. More
details of the isotopic exchange SIMS technique are
reported by Chater et al. [5].
3. Results
3.1. Temperature profile
Compared to thermal experiments the thermodynamic
characterisation of a plasma experiment suffers from a major
disadvantage. Any low temperature plasma is a non-equi-
librium system, which means that the electron temperature
differs significantly from the temperature of the ions and the
neutral particles. Normally the temperature of the electrons
is up to 100 times higher than the temperatures of ions and
neutrals [20]. Of main interest for plasma–solid reactions is
the thermodynamic temperature of a sample immersed into
the plasma.
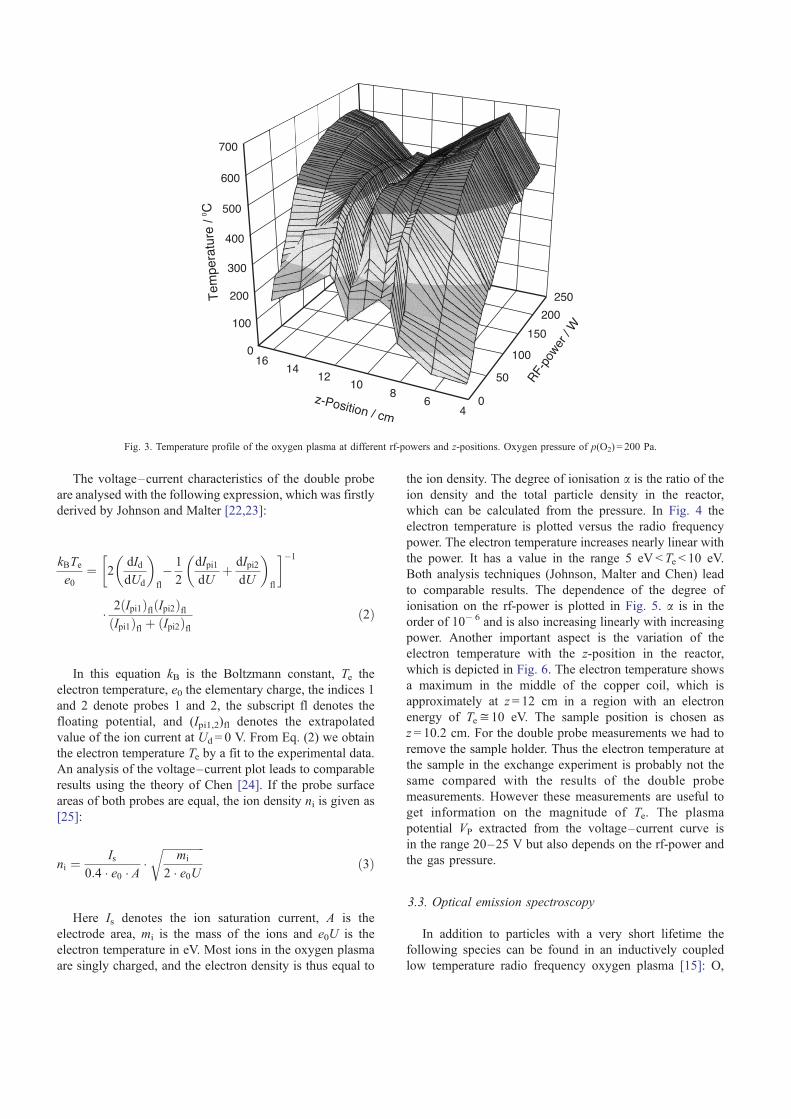
The temperature profile measured with a shielded ther-
mocouple is depicted in Fig. 3. The temperature increases
with increasing rf-power up to temperatures of 650 jC. Thetemperature is also varying with the z-position. The hottest
areas are at the ends of the copper coil. In the middle of the
coil the temperature increase is relatively low. At the
position of the heating stage it is definitely lower than 500
jC. This is very important for the exchange experiments,
which require temperatures between 500 and 600 jC. Thusonly minor external heating is required in order to maintain
the defined experimental conditions.
3.2. Double probe measurements
For generating the plasma a 13.56 MHz signal is used
and the radio frequency power is coupled to the gas
inductively via a copper coil. Due to their high masses all
oxygen particles are virtually unaffected by the alternating
field and maintain a Maxwell-Boltzmann-type energy
distribution. In contrast the electrons are accelerated to
much higher velocities, which correspond to high kinetic
electron temperatures up to 12 eV. The energy of neutral
particles is influenced slightly by the impact of electrons,
thus they are in thermal equilibrium with the walls of the
reactor. Typical temperatures of neutrals are in the order
of 0.05 eV (room temperature) and the ion temperature is
usually higher (approximately 0.5 eV). Low temperature
oxygen plasmas are weakly ionised. The degree of ionisa-
tion a is smaller than 1�10� 5 and the plasma density n
corresponds to 5�1011/cm3 at 10 Pa. The electron temper-
ature Te, the plasma potential VP, the ion density Is and the
degree of ionisation a can be evaluated from double probe
measurements [21].
The voltage–current characteristics of the double probe
are analysed with the following expression, which was firstly
derived by Johnson and Malter [22,23]:
kBTe
e0¼ 2
dId
dUd
� �fl
� 1
2
dIpi1
dUþ dIpi2
dU
� �fl
� ��1
� 2ðIpi1ÞflðIpi2ÞflðIpi1Þfl þ ðIpi2Þfl
ð2Þ
In this equation kB is the Boltzmann constant, Te the
electron temperature, e0 the elementary charge, the indices 1
and 2 denote probes 1 and 2, the subscript fl denotes the
floating potential, and (Ipi1,2)fl denotes the extrapolated
value of the ion current at Ud = 0 V. From Eq. (2) we obtain
the electron temperature Te by a fit to the experimental data.
An analysis of the voltage–current plot leads to comparable
results using the theory of Chen [24]. If the probe surface
areas of both probes are equal, the ion density ni is given as
[25]:
ni ¼ Is
0:4 � e0 � A �ffiffiffiffiffiffiffiffiffiffiffiffiffiffiffi
mi
2 � e0Ur
ð3Þ
Here Is denotes the ion saturation current, A is the
electrode area, mi is the mass of the ions and e0U is the
electron temperature in eV. Most ions in the oxygen plasma
are singly charged, and the electron density is thus equal to
the ion density. The degree of ionisation a is the ratio of the
ion density and the total particle density in the reactor,
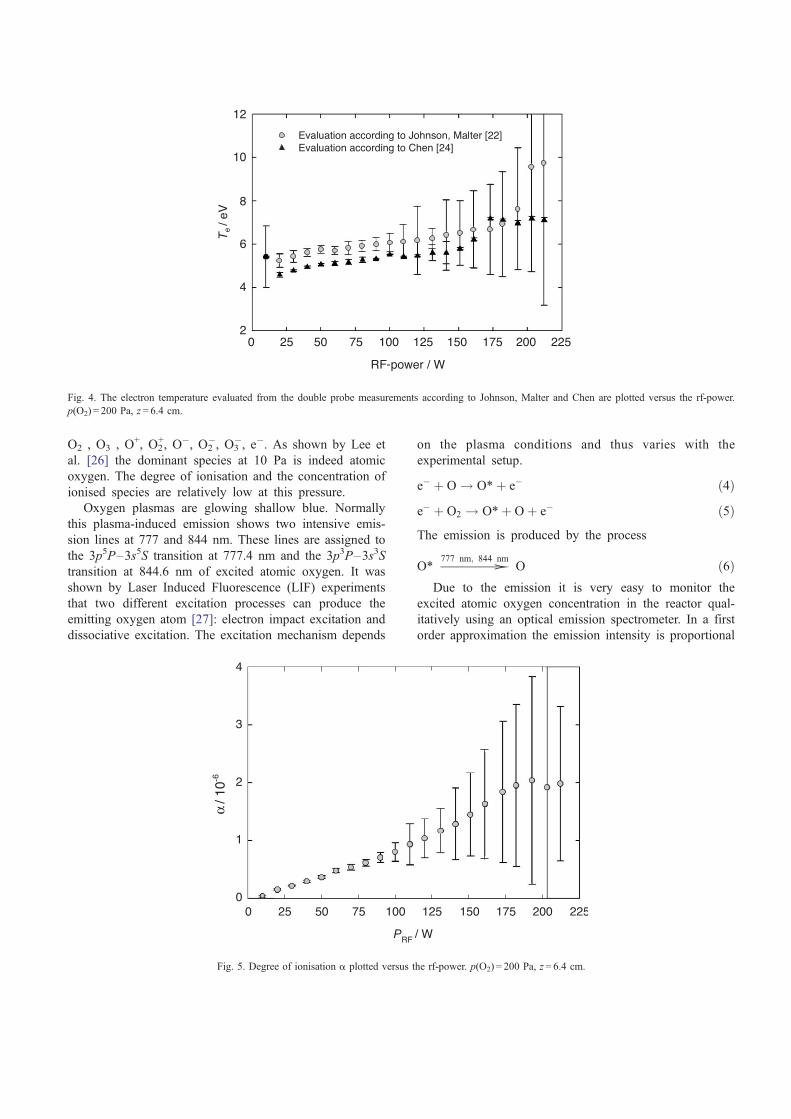
which can be calculated from the pressure. In Fig. 4 the
electron temperature is plotted versus the radio frequency
power. The electron temperature increases nearly linear with
the power. It has a value in the range 5 eV < Te < 10 eV.
Both analysis techniques (Johnson, Malter and Chen) lead
to comparable results. The dependence of the degree of
ionisation on the rf-power is plotted in Fig. 5. a is in the
order of 10� 6 and is also increasing linearly with increasing
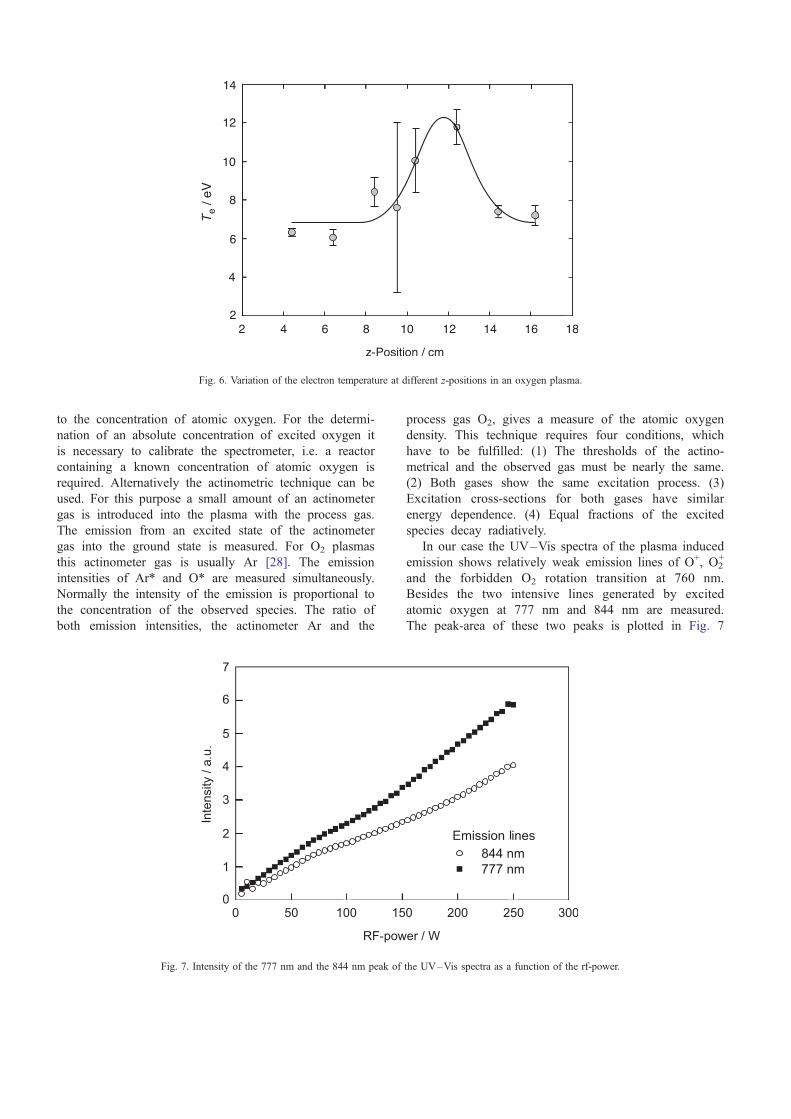
power. Another important aspect is the variation of the
electron temperature with the z-position in the reactor,
which is depicted in Fig. 6. The electron temperature shows
a maximum in the middle of the copper coil, which is
approximately at z= 12 cm in a region with an electron
energy of Tei10 eV. The sample position is chosen as
z = 10.2 cm. For the double probe measurements we had to
remove the sample holder. Thus the electron temperature at
the sample in the exchange experiment is probably not the
same compared with the results of the double probe
measurements. However these measurements are useful to
get information on the magnitude of Te. The plasma
potential VP extracted from the voltage–current curve is
in the range 20–25 V but also depends on the rf-power and
the gas pressure.
3.3. Optical emission spectroscopy
In addition to particles with a very short lifetime the
following species can be found in an inductively coupled
low temperature radio frequency oxygen plasma [15]: O,
Fig. 3. Temperature profile of the oxygen plasma at different rf-powers and z-positions. Oxygen pressure of p(O2) = 200 Pa.
O2 , O3 , O+, O2+, O�, O2
�, O3�, e�. As shown by Lee et
al. [26] the dominant species at 10 Pa is indeed atomic
oxygen. The degree of ionisation and the concentration of
ionised species are relatively low at this pressure.
Oxygen plasmas are glowing shallow blue. Normally
this plasma-induced emission shows two intensive emis-
sion lines at 777 and 844 nm. These lines are assigned to
the 3p5P–3s5S transition at 777.4 nm and the 3p3P–3s3S
transition at 844.6 nm of excited atomic oxygen. It was
shown by Laser Induced Fluorescence (LIF) experiments
that two different excitation processes can produce the
emitting oxygen atom [27]: electron impact excitation and
dissociative excitation. The excitation mechanism depends
on the plasma conditions and thus varies with the
experimental setup.
e� þ O ! O*þ e� ð4Þe� þ O2 ! O*þ Oþ e� ð5ÞThe emission is produced by the process
O*!777 nm; 844 nmO ð6Þ
Due to the emission it is very easy to monitor the
excited atomic oxygen concentration in the reactor qual-
itatively using an optical emission spectrometer. In a first
order approximation the emission intensity is proportional
Fig. 5. Degree of ionisation a plotted versus the rf-power. p(O2) = 200 Pa, z= 6.4 cm.
Fig. 4. The electron temperature evaluated from the double probe measurements according to Johnson, Malter and Chen are plotted versus the rf-power.
p(O2) = 200 Pa, z = 6.4 cm.
to the concentration of atomic oxygen. For the determi-
nation of an absolute concentration of excited oxygen it
is necessary to calibrate the spectrometer, i.e. a reactor
containing a known concentration of atomic oxygen is
required. Alternatively the actinometric technique can be
used. For this purpose a small amount of an actinometer
gas is introduced into the plasma with the process gas.
The emission from an excited state of the actinometer
gas into the ground state is measured. For O2 plasmas
this actinometer gas is usually Ar [28]. The emission
intensities of Ar* and O* are measured simultaneously.
Normally the intensity of the emission is proportional to
the concentration of the observed species. The ratio of
both emission intensities, the actinometer Ar and the
process gas O2, gives a measure of the atomic oxygen
density. This technique requires four conditions, which
have to be fulfilled: (1) The thresholds of the actino-
metrical and the observed gas must be nearly the same.
(2) Both gases show the same excitation process. (3)
Excitation cross-sections for both gases have similar
energy dependence. (4) Equal fractions of the excited
species decay radiatively.
In our case the UV–Vis spectra of the plasma induced
emission shows relatively weak emission lines of O+, O2+
and the forbidden O2 rotation transition at 760 nm.
Besides the two intensive lines generated by excited
atomic oxygen at 777 nm and 844 nm are measured.
The peak-area of these two peaks is plotted in Fig. 7
Fig. 7. Intensity of the 777 nm and the 844 nm peak of the UV–Vis spectra as a function of the rf-power.
Fig. 6. Variation of the electron temperature at different z-positions in an oxygen plasma.
versus the radio frequency power. The change of the
concentration of excited atomic oxygen, which is propor-
tional to the concentration of atomic oxygen, with in-
creasing rf-power is observed. The results are identical for
both emission lines.
In order to obtain the absolute oxygen concentration we
tried to use the actinometric technique. Argon was chosen as
actinometer gas. As observed in these experiments the
oxygen peaks at 777 nm and at 844 nm are produced by
both possible excitation processes (electron impact and
dissociation excitation). Therefore it is not possible to apply
the actinometric technique. The condition number two
failed, and we obtain only relative information from emis-
sion spectrometry.
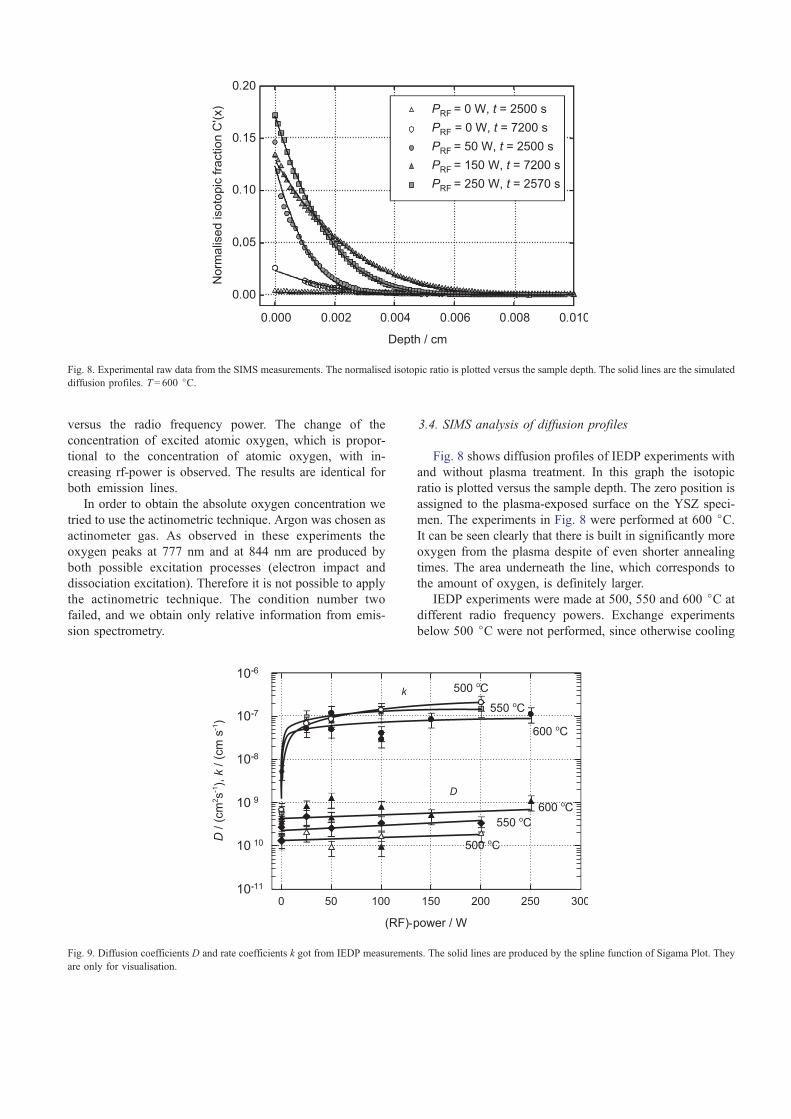
3.4. SIMS analysis of diffusion profiles
Fig. 8 shows diffusion profiles of IEDP experiments with
and without plasma treatment. In this graph the isotopic
ratio is plotted versus the sample depth. The zero position is
assigned to the plasma-exposed surface on the YSZ speci-
men. The experiments in Fig. 8 were performed at 600 jC.It can be seen clearly that there is built in significantly more
oxygen from the plasma despite of even shorter annealing
times. The area underneath the line, which corresponds to
the amount of oxygen, is definitely larger.
IEDP experiments were made at 500, 550 and 600 jC at
different radio frequency powers. Exchange experiments
below 500 jC were not performed, since otherwise cooling
Fig. 8. Experimental raw data from the SIMS measurements. The normalised isotopic ratio is plotted versus the sample depth. The solid lines are the simulated
diffusion profiles. T= 600 jC.
Fig. 9. Diffusion coefficients D and rate coefficients k got from IEDP measurements. The solid lines are produced by the spline function of Sigama Plot. They
are only for visualisation.
of the samples would have been necessary. Temperatures
above 600 jC were not chosen in order to reduce temper-
ature gradients between the sample surface and the thermo-
couple.
In Fig. 9 the diffusion coefficients and the rate constants
for the exchange experiments at different plasma powers for
500, 550 and 600 jC are depicted. These data were
evaluated by the use of Eq. (9) from the diffusion profiles.
The diffusion coefficients are constant within an error of
F 32%. A linear regression shows nevertheless that the
diffusion coefficients become slightly higher with increasing
rf-power. This is due to the increasing heating power of the
plasma. The rate constants show a completely different
behaviour. The rate constants of the plasma experiments
are up to 100 times higher than those of thermal experi-
ments. The effect of the plasma becomes smaller with
increasing temperature. At 600 jC the ratio of the rate
constants with and without plasma is only a factor 10. If we
would try to generate the same effect via heating, we had to
raise the temperature by a few hundred Kelvin. The influ-
ence of the increasing plasma power on the rate constants is
strongly non-linear. It appears that already a minor plasma
power is sufficient to obtain a maximum effect.
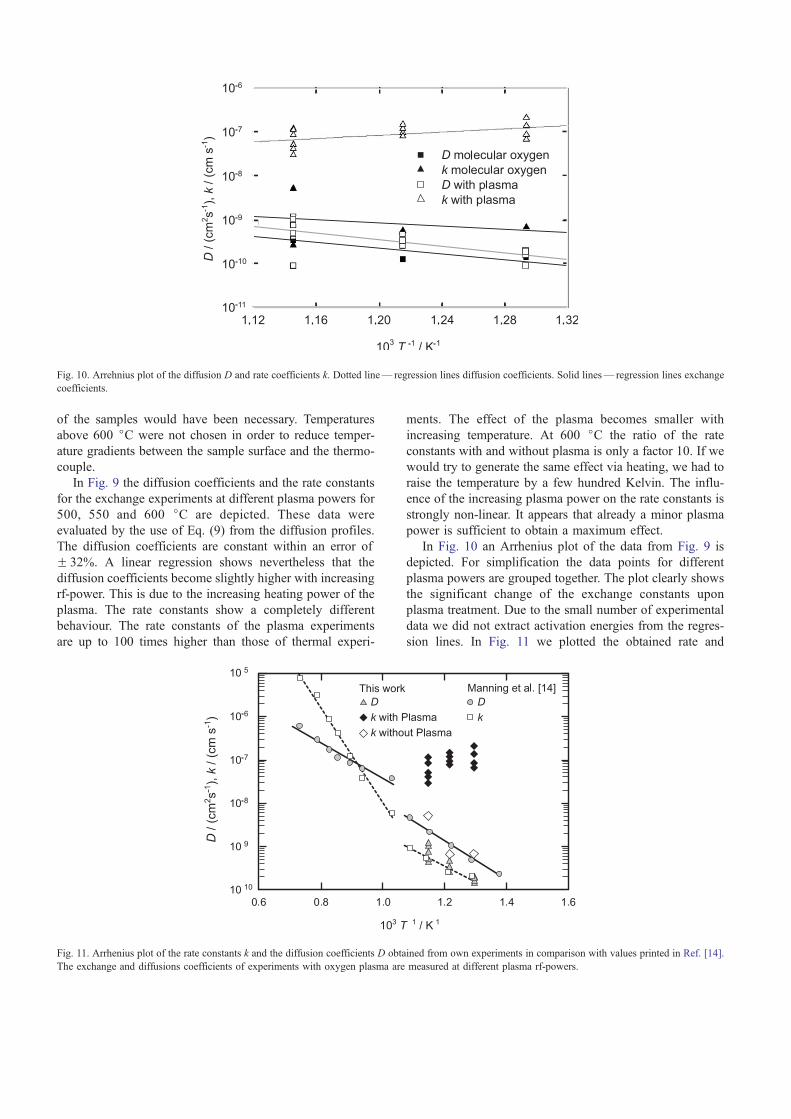
In Fig. 10 an Arrhenius plot of the data from Fig. 9 is
depicted. For simplification the data points for different
plasma powers are grouped together. The plot clearly shows
the significant change of the exchange constants upon
plasma treatment. Due to the small number of experimental
data we did not extract activation energies from the regres-
sion lines. In Fig. 11 we plotted the obtained rate and
Fig. 10. Arrehnius plot of the diffusion D and rate coefficients k. Dotted line— regression lines diffusion coefficients. Solid lines— regression lines exchange
coefficients.
Fig. 11. Arrhenius plot of the rate constants k and the diffusion coefficients D obtained from own experiments in comparison with values printed in Ref. [14].
The exchange and diffusions coefficients of experiments with oxygen plasma are measured at different plasma rf-powers.
diffusion coefficients in comparison with values received by
Manning et al. from exchange experiments with molecular
oxygen at single crystalline YSZ ((100)-orientation) [14].
As can be seen, our diffusion coefficients are slightly
smaller than the literature values. In contrast our rate
constants are definitely higher, which could be due to the
plasma cleaning step before each exchange experiment. The
exchange rates within the plasma are magnitudes higher.
3.5. Data analysis of SIMS profiles
For the analysis of the SIMS data we assume a kinetic of
first order for the gas/solid and plasma/solid interface,
respectively. Therefore we formulate the expression:
kðCO � CSÞ ¼ �DBCðxÞBx
����x¼0
ð7Þ
Here k is the surface exchange coefficient (first order rate
constant), D is the self-diffusion coefficient, CO is the 18O
concentration of adsorbed oxygen on the surface, CS the18O
concentration in the first lattice layers of the surface. The18O concentration CO is in equilibrium with the 18O con-
centration Cg in the gas. For simplification CO is equated
with Cg. Taking Eq. (1) as boundary condition for Fick’s
second law of diffusion
BCðxÞBt
¼ DB2CðxÞBx2
� �ð8Þ
The solution of the differential Eq. (2) for diffusion into a
semi-infinite medium with the initially 18O concentration
Cbg in the material is given by Crank [29] as
CðxÞ � Cbg
Cg � Cbg
¼ erfcx
2ffiffiffiffiffiDt
p�
� expðhxþ h2DTtÞ
� erfcx
2ffiffiffiffiffiDt
p þ hffiffiffiffiffiDt
p� ð9Þ
with h = k/D. Cbg is the natural background level of 18O. In
order to extract the parameters k and D from the profiles a
non-linear least squares fit based upon Eq. (9) was used to
determine D and k.
4. Discussion
The main results of our experimental study can be
summarised as follows:
1. A significant increase of 18O/16O exchange rate is
observed upon the presence of an oxygen plasma.
2. The relation between plasma power (i.e. degree of
ionisation) and rate increase appears to be strongly
non-linear. Saturation is already observed at 25 W.
However, it might also be possible that even a smaller
plasma power is sufficient to cause a strong effect, which
is then only slightly improving with additional power.
Below 25 W the plasma becomes unstable, and thus, the
experiments had to be restricted to powers above 25 W.
Any model for oxygen exchange from a plasma has to
explain these three observations. In the following we will
firstly discuss different aspects of plasma/solid interaction,
which may all contribute to the enhanced surface reactivity
to a varying degree.
4.1. Plasma cleaning/surface structure
As it is well known in surface science the atomic surface
structure and the surface coverage with impurities play a
crucial role for the surface reactivity. Of course oxygen
exchange also depends on the number of reactive surface
sites, and thus, on the microscopic nature of the oxide
surface. But despite the importance of a reproducible
surface preparation only a few studies on the influence of
surface structure and contamination have yet been reported.
Probably the most comprehensive information is available
for the surface reactivity of SrTiO3. It has been shown by
Denk [30] that the surfaces of freshly cleaved SrTiO3
crystals have considerably higher exchange coefficients than
aged (relaxed) surfaces. Whether this effect is due to a plain
structural relaxation of the surface atoms or due to a
growing surface contamination (e.g. with water) with time
is yet not clear.
Regardless of the results of Denk, De Ridder investigated
different cleaning procedures on YSZ surfaces using low
energy ion scattering (LEIS) for surface analysis on an
atomic scale with respect to depth. He shows that the
combination of thermal annealing and atomic oxygen treat-
ment before an exchange experiment gives the cleanest
surfaces. The maximum cleaning effect is reached after a
treatment of 200 s. Longer cleaning times do not lead to a
cleaner surface [19].
The treatment of materials with plasmas is a widely
used method for the activation of surfaces [25]. Thus
polymer foils are often exposed shortly to plasmas in
order to improve their adhesive properties. Often plasma
cleaning of solid substrates is used before thin films are
deposited either by sputtering or vapour deposition [31].
Indeed we observed that plasma cleaned surfaces
usually have a higher surface concentration of 18O after
the exchange experiment, i.e. we assume that the incor-
poration into the lattice is faster for plasma cleaned
surfaces. In our experiments we excluded this plain
cleaning effect of the plasma by a similar treatment of
all samples before the exchange experiments. Each sam-
ple was cleaned in an oxygen plasma before either a
thermal or a plasma exchange experiment was performed.
Thus the initial surface state of all samples was identical.
We cannot exclude the possibility that the continuous
exposure to reactive particles during the subsequent
plasma exchange experiment prevents an ageing of the
fresh surfaces, and thus, leads to an optimised surface
reactivity. But since all exchange experiments took no
longer than 4 h, any surface relaxation or contamination
should be very fast in order to become significant. In the
current state of understanding we thus exclude a relevant
contribution of continuous plasma cleaning to the im-
proved surface kinetics. Regarding the importance of
surface reactivity it might nevertheless be interesting to
investigate a plasma cleaning effect more intensively.
Along with the cleaning effect we have to discuss a
possible surface segregation of impurities. Hughes mea-
sured high concentrations of Y, Si, Na and Fe on the
surfaces of YSZ single crystals, which were annealed at
temperatures from 900 up to 1500 jC [32]. This study was
extended by De Ridder to lower temperatures. He observed
segregation of Y2O3 in the surface near region of polycrys-
talline YSZ at temperatures above 600 jC and segregation
of Na, Si and Fe at temperatures higher than 1000 jC. Incontrast to these findings the segregation in YSZ single
crystals is much slower because of missing grain boundaries
as fast diffusion paths [33]. In the present study our
maximum exchange temperature is 600 jC. For this reasonsegregation effects will play no role after the plasma-
cleaning step.
4.2. UV radiation
As already indicated the incorporation of oxygen into
an oxide includes the reduction of the oxygen molecules
by the supply of four electrons from the oxide. In the
case of YSZ as an electron-poor material this reduction
step is necessarily hindered and might even control the
complete kinetics.
For the case of SrTiO3 it has indeed been shown by
Merkle et al. [7] that UV irradiation with photons of the
same energy as the band gap leads to increased exchange
rates of oxygen exposed samples. In a detailed analysis
the authors prove that the electron transfer to the oxygen
molecule is rate limiting at low and intermediate temper-
atures. In our case the band gap of YSZ equals 5.2 eV
[18], which corresponds to a wavelength of 238 nm. The
average kinetic energy of the electrons in the rf-plasma
equals 10 eV, and thus, emission of UV photons with an
energy of 5.2 eV is at least theoretically possible. Nev-
ertheless we can safely assume that electron-hole forma-
tion by UV irradiation plays a negligible role in the
observed rate increase since the emission spectrum of
our oxygen plasma shows no UV lines with such high
energy. It has to be noted that even in the case of high
energy UV emission the intensity of the emission would
be much too low for a significant influence on the kinetics.
As can be seen from Fig. 9, a rf-power of 25 W is already
sufficient to see a serious rate increase. Merkle et al. had
to use a 200 W-discharge lamp in order to obtain an effect
by UV irradiation.
4.3. Particle bombardment/ion implantation
In the stationary state of a plasma each surface of the
plasma container and of the sample is charged negatively,
and a significant potential difference between the plasma
bulk and the wall is established. The plasma potential is
positive referred to the wall potential. A positive space
charge (double layer or Langmuir shield) is created, and
equal fluxes of positive and negative particles towards the
wall are maintained, where recombination of charged par-
ticles takes place. Only electrons with a high kinetic energy
can cross the Langmuir shield, whereas the cations are
accelerated by the electric field in the space charge region
towards the wall. Lee et al. [26] estimate the average energy
of bombarding ions as 6 Te and the energy of electrons as
2 Te. In our case this corresponds to an average energy of
30 eV of ions, which impinge the surface, and of 10 eV of
electrons. A cation energy of 30 eV is in principle sufficient
for the creation of defects at or close to the surface since it is
higher than the binding energy in the crystal. But real ion
implantation to the bulk requires energies higher than
0.5 keV [34], thus can be excluded in our case. Ions with
an energy of 30 eV cannot penetrate the lattice deeper than
0.2 nm, i.e. essentially not deeper than just one or two
atomic layers. In essence, the cations from our rf-plasma hit
the surface of any wall and might be incorporated into the
first or second lattice plane but not into the crystal bulk.
Realising that ion implantation will definitely not partic-
ipate in the process, it is nevertheless interesting to estimate
the average flux of cations and electrons towards the surface
under self-bias conditions, i.e. without applying an external
voltage to the surface. According to Chapman [20] the
plasma potential VP is given as
VP ¼ Te
2eln
mi
2:3me
� �þ Vf ð10Þ
taking the Bohm criterion1 into account. Assuming an
electron temperature Te of 5 eV and O+ as the main ionic
species, the plasma potential at a floating potential of Vf = 0
V equals 23.6 V. This agrees perfectly with our measured
plasma potentials, which are in the range of 20–25 V.
A zirconia surface area of 1 cm2 includes approximately
8.8�1014 atoms in the first atom layer. The ion flux ji to the
surface can be estimated by using the following equation:
ji ¼ eni ci
4ð11Þ
Assuming an ion temperature of 800 K and an ion
density of 1010/cm3 (which corresponds to a degree of
ionisation a = 1.1�10� 6) we obtain a current density of 41.2
1 The ions entering the langmuir sheath have a directed velocity uswhich is greater than the minimum velocity uB. The velocity uB is called
Bohm velocity.
AA/cm2 and a corresponding flux of approximately
4� 10� 10 mol/(cm2 s). This flux can also be regarded as
a rate of ion bombardment with 0.27 impacts per surface
atom and second. In the exchange experiments the flux of18O across the surface approximates to 1�10� 8 mol/
(cm2s). Thus, the 18O flux into the surface is definitely
larger than the ionic flux to the surface and in consequence
the ions can be excluded as possible reason for the faster
surface kinetics.
4.4. Surface heating/temperature effects
In addition to the mere mass transfer effect of ion
bombardment the simultaneous energy impact may lead to
a local temperature increase and a corresponding accelera-
tion of thermally activated surface reactions. Even more
seriously, high energetic particles may transfer large
amounts of energy to a small surface area close to the point
of impact. These so-called hot spots have a rather short
lifetime in the order of 10� 10 s which is in the order of the
period which is required for the hot spot to decay by lattice
vibrations [35]. The influence of hot spots on the exchange
cannot be estimated, thus we have to focus to the average
energy transfer by all impinging particles. At least we can
assume that the number of hot spots from high energetic
ions will be small since the power of our rf-plasma is
relatively low. On average every ion hitting the surface
acquires an energy close to the product of its charge and the
plasma potential. This results in an average energy flux of
12.5 mJ/(cm2 s). The energy flux related to electron impact
can be neglected.
The energy loss of the sample holder by heat radiation
equals 270 mJ/(cm2 s) at a temperature of 700 K, thus we
can safely assume that energy transfer by particle impact
cannot change the sample temperature significantly. It is
nontrivial to measure the temperature of the surface. For
measurements with a conventional shielded thermocouple
the heat capacity and conductivity of the thermocouple itself
is too large. The temperature profile of the rf-reactor, which
we measured with a shielded thermocouple, is comparable
with measurements by Piejak et al. [36] in an Argon plasma
generated in an ICP chamber. The temperatures increase
with increasing pressure and rf-power. The smaller the
diameter of the thermocouple, the higher is the temperature.
A smaller thermocouple has a smaller metal shield, which
results in a smaller thermal conductivity.
Measurements of the infrared emission are also excluded
because the measured radiation is not only the radiation of
the top surface layer. The lower layers emit, too. It depends
on the transmission coefficient of the material, which
average temperature is measured. We always measure a
mean value. The best indicator is the diffusion coefficient
received from the tracer experiments. As can be seen the
diffusion coefficient is not changing significantly with
increasing radio frequency power. Because the ion flux to
the surface is very low and the lifetime of the hot spots
generated by ion impact is very short, it is not expected that
a higher surface temperature is the reason for the higher
exchange rate.
A possible heating of the sample by the electromagnetic
field can be excluded, too. The coupling of the electromag-
netic field to the ionic material is relatively weak at the
investigated temperatures. For example in the more power-
ful microwave heating an increase in the microwave ab-
sorption is only observed at temperatures of about 0.4–0.5
Tm (where Tm is the melting temperature of the material)
[37]. For zirconia the temperature should be definitely
higher than 1000 jC in order to obtain serious heating
effects.
4.5. Sputter effects
Highly energetic ions can initiate an impact cascade at
the sample surface, leading finally to the emission of atoms
from the surface. This effect is called sputtering. Sputtering
of the sample surface by ion impact should lead to a
continuous loss of material from the surface, i.e. of material
with a high concentration of 18O. In effect, a lower concen-
tration of 18O and smaller exchange coefficients in the data
evaluation should be the consequence.
Besides these arguments we do not expect any serious
sputter effect in our experiments. YSZ is a hard material
with a sputter yield being approximately 100 times lower
than in the case of halides [38]. In addition the energy
of impinging ions is relatively small. A check of the
surface morphology after 24 h of plasma treatment did
not show any measurable change with a laser interfer-
ence microscope.
A related effect is based on the impact of electrons. If
highly energetic electrons impinge at the surface ions can be
desorbed. This process is called electron stimulated desorp-
tion (ESD). It usually requires electron energies in the order
of a few keV [39]. As shown by the double probe measure-
ments our electron energies are not higher than 10 eV, and
thus, we neglect ESD as we also neglect sputtering by ion
impact.
4.6. Atomic oxygen
Oxygen plasmas contain varying concentrations of oxy-
gen atoms depending on the exact plasma properties. As Lee
et al. [26] show it can even reach concentrations up to 50%
depending on the plasma parameters. On the basis of our
analytical methods we cannot determine the absolute con-
centration of oxygen atoms but assume that its concentration
depends linearly on the plasma power as it does the degree
of ionisation.
Oxygen atoms are unaffected by the existence of the
space charge in front of the sample surface and can reach the
sample surface without being slowed down or accelerated
by the potential gradient in the space charge region. If we
assume a concentration of oxygen atoms in the order of 1%
their flux to the surface equals 1.2�10� 5 mol/(cm2 s) under
typical plasma conditions. This value is considerably higher
than the flux of oxygen ions and electrons, and thus, is
probably more important than any rate increase caused by
the impact of ionic species.
It has been shown by Manning et al. [13] that the rate-
determining step of oxygen exchange above 700 jC is the
dissociation of the oxygen molecule. We assume that at
lower temperatures the incorporation and reduction step
may take over the role of the rate-limiting process.
4.7. Surface charging/electric field effect
The formation of negative surface charges at plasma walls
is one the most prominent plasma effects. As we estimated
above, the flux of electrons to the YSZ surface can be
estimated as approximately 4�10� 10 mol/(cm2s), and the
surface charge is typically in the order of 1.7� 10� 11
C/cm2 at a plasma potential of 20 V, thus representing a
relatively low surface charge density.
The influence of the negative surface charge can be
three-fold:
(a) The electrons, which create the negative surface
charge, may occupy surface states in or close to the
conduction band, which then promote the reduction of
adsorbed oxygen atoms. It is interesting to note that this
effect is probably comparable to the formation of electron
and holes at oxide surfaces by UV irradiation. In any case a
rate increase is related to a lift in the electron concentration
at the surface, which directly influences the reduction of
oxygen species. Therefore we refer to this effect as a
concentration effect. It is not possible to prove this effect
or to make a quantitative statement on its influence. Wheth-
er a negative surface charge has also an effect on the
oxidation of oxygen ions, which are leaving the crystal
during the exchange experiment, is difficult to decide.
Currently we assume that any effect on the oxygen release
can be neglected.
(b) Additionally to point (a) the negative surface charge
establishes a positive space charge under the oxide surface.
Only mobile positive oxygen vacancies can form this space
charge leaving (relatively) negatively charged dopand cati-
ons behind. The Debye length of YSZ is very short due to
the high degree of doping. Thus the concentration of anion
vacancies should only be increased within a distance of
approximately 0.1 nm close to the surface. We believe that
this increased vacancy concentration may also participate in
an increased oxygen incorporation which requires vacancies
at the surface, but cannot give a quantitative measure.
Regarding the estimate of the surface charge, the increase
of the vacancy concentration is negligible compared to the
mean vacancy concentration.
Kilner et al. [40] have shown that the exchange coeffi-
cient k can be correlated to the diffusion coefficient D.
logk ¼ m � logDþ b ð12Þ
For mixed conductors the coefficient m is approximately
0.5, for oxides with the fluorite structure the coefficient is
approximately 1 [41]. The diffusion coefficient D itself is
proportional to the vacancy concentration which depends on
the material properties and the dopand concentration. Dv is
the vacancy diffusion coefficient.
D ¼ ½VSSO� � Dv ð13Þ
This means that the rate constant for the oxygen
exchange is related to the oxygen vacancy concentration
if the surface charge creates a significant vacancy space
charge. This might explain higher k values for the
exchange in materials with more pronounced space charge
effects.
As the concentration effect for electrons in (a) the space
charge effect can also be regarded as a (small) concentration
effect on the surface exchange rate.
(c) In addition to the effect of a negative surface charge
on the concentrations of electrons and oxygen vacancies as
reaction partners in the rate-limiting surface reaction, a real
electric field effect might also assist in the exchange
kinetics. As is well known from electrode kinetics in the
liquid state, an electric field across an electrode interface
will increase the rate of either the cathodic or anodic transfer
process. In our case the oxide surface possesses two
asymmetric space charges in the solid electrolyte and the
plasma phase. The electric field vector in the solid electro-
lyte will point from the bulk to the surface, and it might be
that thermally activated jumps or transfer steps of negative
species (oxygen ions) are supported. Again, we cannot give
a quantitative estimation of this effect in the current state of
investigation.
Perhaps it is worthwhile to investigate the interaction
between a solid electrolyte and a plasma more thoroughly
by theoretical methods.
Summarizing all above discussed effects, we believe that
the negative surface charge of the YSZ surface in the rf-
plasma contributes to the observed rate increase. We cannot
exclude a contribution of oxygen atoms but have no means
to give a quantitative answer.
5. Conclusions
Isotopic oxygen exchange experiments were performed
in rf-oxygen plasma. In contrast to the exchange with
molecular oxygen the exchange rate is up to 100 times
higher for samples immersed in an oxygen plasma, even at
low plasma powers. In the temperature range 500–600 jCthe exchange rate is not increasing significantly with the
exchange temperature.
Several effects related to the plasma/solid interaction
are discussed as possible causes for the rate increase.
Currently we assume that the strong negative charging of
a sample surface plays a dominant role for the rate
increase. The negative surface charge is a consequence of
electronic surface states, which may promote the slow
reduction of oxygen species, and also leads to a space
charge in the electrolyte being composed of anion vacan-
cies. It might be that this space charge with an increased
concentration of vacancies also promotes the oxygen
incorporation. An influence of oxygen atoms on the rate
increase can neither be proved nor excluded at the present
state.
Acknowledgements
This work was supported by the german research
foundation with a Gerhard Hess project (projects DFG Ja
648/4-1 and DFG Ja 648/4-2).
References
[1] B.C.H. Steele, Solid State Ionics 86–88 (1996) 1223–1234.
[2] J.A. Lane, S.J. Benson, D. Waller, J. Kilner, Solid State Ionics 121
(1999) 201–208.
[3] C.-R. Song, H.-I. Yoo, Solid State Ionics 120 (1999) 141–153.
[4] A. Mitterdorfer, L.J. Gauckler, Solid State Ionics 117 (1999) 187–217.
[5] R.J. Chater, S. Carter, J.A. Kilner, B.C.H. Steele, Solid State Ionics
53–56 (1992) 859–867.
[6] M.W. den Otter, B.A. Boukamp, H.J.M. Bouwmeester, Solid State
Ionics 139 (2001) 89–94.
[7] R. Merkle, R.A. De Souza, J. Maier, Angew. Chem. 113 (2001)
2184–2187.
[8] J. Maier, Solid State Ionics 112 (1998) 197–228.
[9] C. Li, K. Domen, K. Maruya, T. Onishi, J. Am. Chem. Soc. 111 (1989)
7683–7687.
[10] B.A. Boukamp, H.J.M. Bouwmeester, H. Verweij, A.J. Burggraaf,
Mater. Res. Soc. Symp. Proc. 293 (1993) 361–366.
[11] T. Bak, M. Rekas, J. Nowotny, C.C. Sorell, A. Adamski, K. Dyrek,
Z. Sojka, Ionics 7 (2001) 332–338.
[12] B. Luerssen, J. Janek, S. Guenther, M. Kiskinova, R. Imbihl, Phys.
Chem. Chem. Phys. 4 (2002) 2673–2679.
[13] P.S. Manning, J.D. Sirman, J.A. Kilner, Solid State Ionics 93 (1997)
125–132.
[14] P.S. Manning, J.D. Sirman, R.A. De Souza, J.A. Kilner, Solid State
Ionics 100 (1997) 1–10.
[15] J.T. Gudmundsson, M.A. Lieberman, Plasma Sources Sci. Technol. 7
(1998) 1–12.
[16] M. de Ridder, A.G.J. Vervoort, R.G. van Welzenis, H.H. Brongersma,
Solid State Ionics 156 (2003) 255–262.
[17] J.H. Park, R.N. Blumenthal, J. Electrochem. Soc. 136 (1989) 2867.
[18] U. Vohrer, H.-D. Wiemhofer, W. Gopel, Solid State Ionics 59 (1993)
141–149.
[19] M. de Ridder, R.G. van Welzenis, H.H. Brongersma, Surf. Interface
Anal. 33 (2002) 309–317.
[20] B. Chapman, Glow Discharge Processes, Wiley, New York, 1980.
[21] J.D. Swift, M.J.R. Schwar, Electrical Probes for Plasma Diagnostics,
Ilife Books, London, 1970.
[22] E.O. Johnson, L. Malter, Phys. Rev. 80 (1950) 58–68.
[23] S. Pfau, M. Tichy, Low Temperature Plasma Physics, Wiley-VCH,
Berlin, 2000.
[24] F.F. Chen, Plasma Diagnostic Techniques, Academic Press, New
York, 1965, pp. 177–183.
[25] G. Janzen, Plasmatechnik, Huthig Verlag, Heidelberg, 1992.
[26] C. Lee, D.B. Graves, M.A. Lieberman, D.W. Hess, J. Electrochem.
Soc. 141 (1994) 1546–1555.
[27] E.J.H. Collart, J.A.G. Baggerman, R.J. Visser, J. Appl. Phys. 70 (1991)
5278–5281.
[28] R.E. Walkup, K.L. Saenger, G.S. Selwyn, J. Chem. Phys. 84 (1986)
2668–2674.
[29] J. Crank, The Mathematics of Diffusion, Oxford Sci. Publ., Oxford,
1975.
[30] I. Denk, F. Noll, J. Maier, J. Am. Ceram. Soc. 80 (1997) 279.
[31] M.A. Lieberman, A.J. Lichtenberg, Principles of Plasma Discharges
and Materials Processing, Wiley, New York, 1994.
[32] A.E. Hughes, Am. Ceram. Soc. 78 (1995) 369–378.
[33] M. de Ridder, The Rate-Limiting Factor of the Solid Oxide Fuel Cell,
PhD thesis, Technical University of Eindhoven, Eindhoven (2002),
Chap. 3.
[34] A. Anders, Handbook of Plasma Immersion Ion Implantation and
Deposition, Wiley, New York, 2000.
[35] R. Kelly, Ion Bombardment Modification of Surfaces, Elsevier, Am-
sterdam, 1984.
[36] R. Piejak, V. Godyak, B. Alexandrovich, N. Tishchenko, Plasma
Sources Sci. Technol. 7 (1998) 590–598.
[37] Y.V. Bykov, K.I. Rybakov, V.E. Semenov, J. Phys. D: Appl. Phys. 34
(2001) R55–R75.
[38] R. Kelly, Surf. Sci. 90 (1979) 280–318.
[39] J.A. Kilner, L. Ilkov, Vacuum 34 (1984) 139–143.
[40] J.A. Kilner, R.A. De Souza, I.C. Fullarton, Solid State Ionics 86–88
(1996) 703–709.
[41] J.A. Kilner, in: T.A. Ramanarayana, W.C. Worrell (Eds.), Proc. of the
2nd Intern. Symp. on Ionic and Mixed Conducting Ceramics, Electro-
chem. Soc. Proc. vol. 94–12, (1994) 174–190.