Embed Size (px)
Citation preview
Tfl
AC
a
ARRAA
KTFG
1
nseamC
pdHs
Sdmcoss
j(
0d
Journal of Membrane Science 382 (2011) 316– 322
Contents lists available at SciVerse ScienceDirect
Journal of Membrane Science
j ourna l ho me pag e: www.elsev ier .com/ locate /memsci
ertiary membrane filtration of an industrial wastewater using granular orocculent biomass sequencing batch reactors
. Sánchez ∗, J.M. Garrido, R. Méndezhemical Engineering Department, School of Engineering, University of Santiago de Compostela, Campus Sur, E-15782 Santiago de Compostela, Spain
r t i c l e i n f o
rticle history:eceived 26 May 2011eceived in revised form 10 August 2011ccepted 11 August 2011vailable online 22 August 2011
eywords:ertiary membrane filtration
a b s t r a c t
Sequencing batch reactors (SBR) are widely used for wastewater treatment. The use of granular biomassin SBR allows higher organic loading rates (OLR). Nevertheless, the main disadvantage of SBR reactors isthe presence of suspended solids in the effluent.
In this study, effluents from a flocculent biomass SBR (F-SBR) and a granular biomass SBR (G-SBR) weretreated in tertiary membrane filtration chambers to remove suspended solids. The performances of theoperating systems were compared to determine the influence of the state of the biomass on the filtrationprocess. No significant differences were observed between the two tertiary filtration systems in terms of
oulingranular biomass
capacity and permeability. Tertiary filtration of the effluent from the G-SBR was similar to that of the F-SBR system. The incorporation of wastewater free of suspended solids during one of the operating stagessignificantly worsened operation of the tertiary membrane filtration systems; permeabilities decreasedby up to 40% in both systems. Additionally, other factors such as nitrification, the presence of solublemicrobial products and the concentration of dissolved organic carbon seem to play an important role in
ion.
tertiary membrane filtrat. Introduction
In recent years, granular sludge has been proposed as an alter-ative for high capacity SBR wastewater treatment systems. G-SBRystems can be operated at higher OLRs than F-SBR systems. Arrojot al. [1] reported organic and nitrogen loading rates of 7 g COD/L dnd 0.7 g N/L d, respectively, in a G-SBR. The OLR values recom-ended for flocculent SBRs in the literature range from 0.5 to 2.0 g
OD/L d [2].The basis of granulation is the continuous selection of sludge
articles that occur inside a reactor. The part of the biomass that
oes not settle quickly enough is washed out with the effluent [2].owever, a main drawback of G-SBR systems is the presence ofuspended solids that are washed out with the treated effluent.
Abbreviations: SBR, sequencing batch reactors; OLR, organic loading rates; F-BR, flocculent biomass SBR; G-SBR, granular biomass SBR; COD, chemical oxygenemand; TSS, total suspended solids; MF, microfiltration; UF, ultrafiltration; MBR,embrane bioreactors; PVDF, polyvinylidene fluoride; PLC, programmable logic
ontroller; TMP, transmembrane pressure; SRT, sludge retention time; TOC, totalrganic car; SMP, soluble microbial products; EPS, extracellular polymeric sub-tances; SRF, specific resistance to filtration; SVI, sludge volume index; SSR, sludgeettling rate; VSS, volatile suspended solids; BPC, biopolymer clusters.∗ Corresponding author. Tel.: +34 881 816 741.
E-mail addresses: [email protected] (A. Sánchez),[email protected] (J.M. Garrido), [email protected]. Méndez).
376-7388/$ – see front matter © 2011 Elsevier B.V. All rights reserved.oi:10.1016/j.memsci.2011.08.027
© 2011 Elsevier B.V. All rights reserved.
Therefore, a suitable post-treatment process may be required tofulfil local requirements for the amount of total suspended solids(TSS) in the effluent, which can be accomplished using membranefiltration units, depth filters, surface filters or external settlers [1].
Tertiary filtration, especially depth filtration, has been used toremove suspended solids from secondary treated waters. However,in recent years, the use of tertiary membrane filtration systems isbecoming more common. Low-pressure tertiary membranes havebeen proven to meet stringent standards. Membranes are a physi-cal barrier to suspended solids that are larger than the membranepore size. Micro- and ultrafiltration (MF/UF) membranes have beenused since the early 1990s for drinking water production. Theycan also be used to remove particulate and colloidal matter fromsettled secondary effluents, which increases the effectiveness ofdisinfection with either ultraviolet radiation or ozone for reuseapplications [3,4]. Thus, compared to depth filtration, tertiary MF orUF membrane treatments produce water of better microbiologicalquality that is also free of suspended solids. This should be takeninto account when water will be reused or discharged into sensibleareas.
Fouling is the main drawback associated with the applicationof membrane technology for wastewater treatment [5–7]. Foulingdecreases the permeability of a membrane, limits flux and short-
ens the life of membrane modules, thus increasing both the capitaland the operating costs of filtration systems. Membrane foulingis the result of complex phenomena that are not yet completelyunderstood.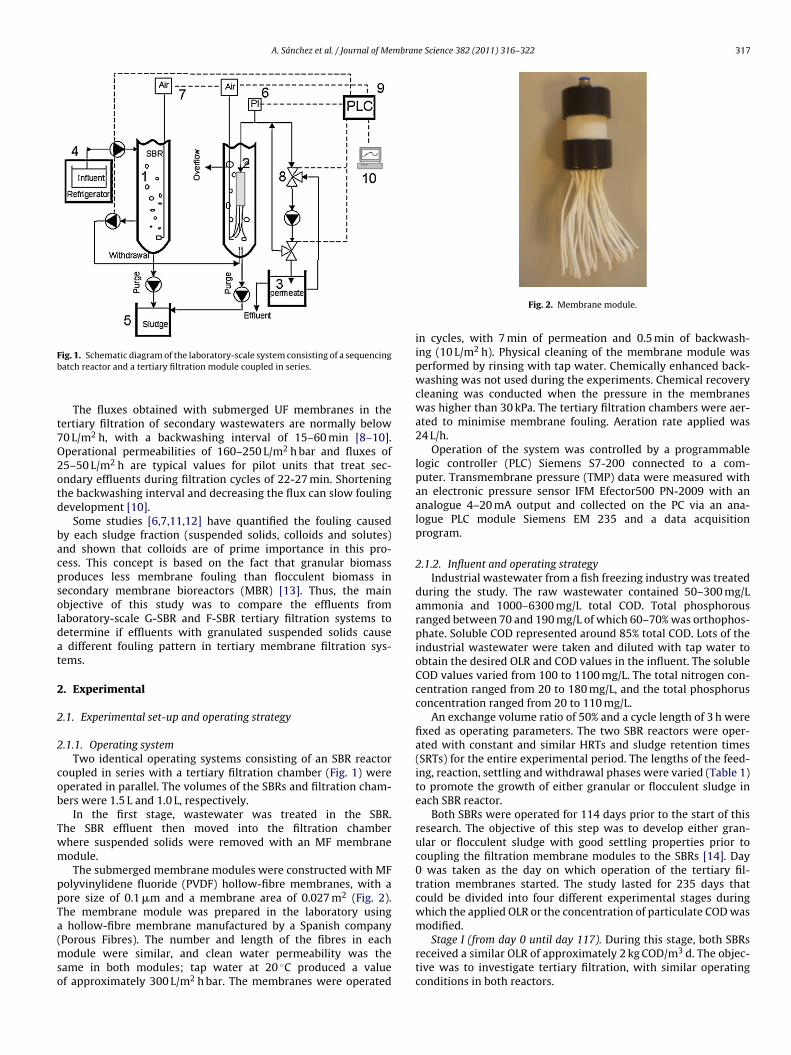
A. Sánchez et al. / Journal of Membrane Science 382 (2011) 316– 322 317
Fb
t7O2otd
bacpsoldat
2
2
2
cob
Twm
ppTa(mso
ig. 1. Schematic diagram of the laboratory-scale system consisting of a sequencingatch reactor and a tertiary filtration module coupled in series.
The fluxes obtained with submerged UF membranes in theertiary filtration of secondary wastewaters are normally below0 L/m2 h, with a backwashing interval of 15–60 min [8–10].perational permeabilities of 160–250 L/m2 h bar and fluxes of5–50 L/m2 h are typical values for pilot units that treat sec-ndary effluents during filtration cycles of 22-27 min. Shorteninghe backwashing interval and decreasing the flux can slow foulingevelopment [10].
Some studies [6,7,11,12] have quantified the fouling causedy each sludge fraction (suspended solids, colloids and solutes)nd shown that colloids are of prime importance in this pro-ess. This concept is based on the fact that granular biomassroduces less membrane fouling than flocculent biomass inecondary membrane bioreactors (MBR) [13]. Thus, the mainbjective of this study was to compare the effluents fromaboratory-scale G-SBR and F-SBR tertiary filtration systems toetermine if effluents with granulated suspended solids cause
different fouling pattern in tertiary membrane filtration sys-ems.
. Experimental
.1. Experimental set-up and operating strategy
.1.1. Operating systemTwo identical operating systems consisting of an SBR reactor
oupled in series with a tertiary filtration chamber (Fig. 1) wereperated in parallel. The volumes of the SBRs and filtration cham-ers were 1.5 L and 1.0 L, respectively.
In the first stage, wastewater was treated in the SBR.he SBR effluent then moved into the filtration chamberhere suspended solids were removed with an MF membraneodule.The submerged membrane modules were constructed with MF
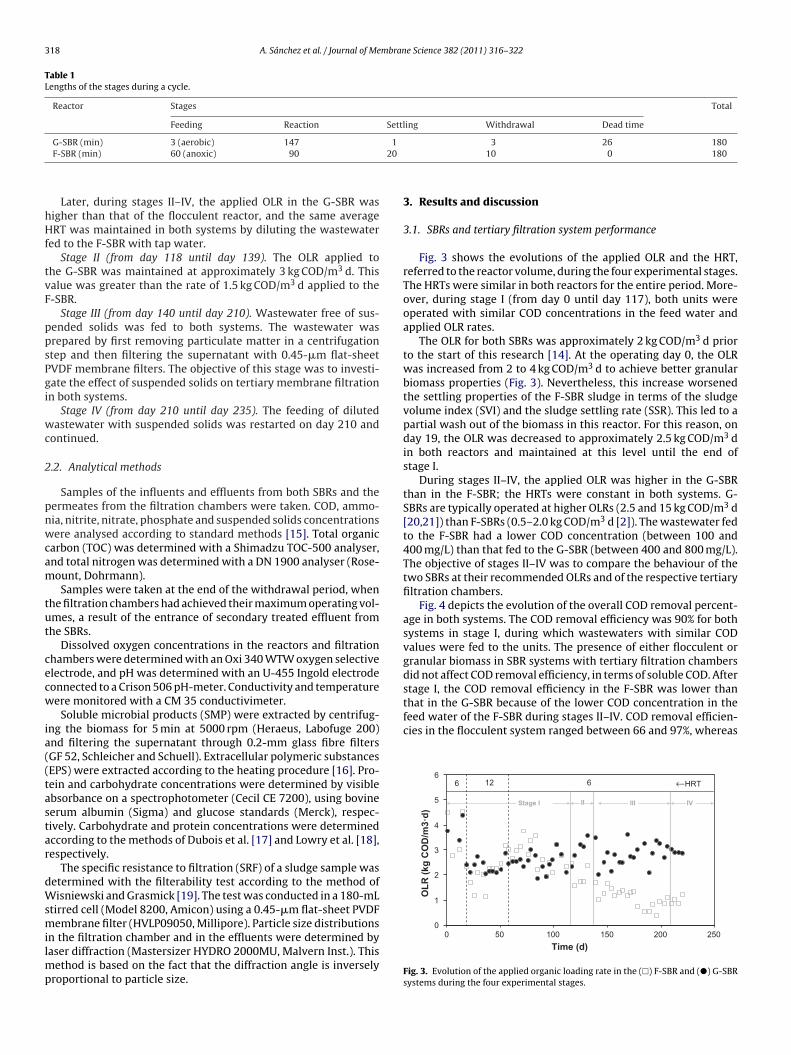
olyvinylidene fluoride (PVDF) hollow-fibre membranes, with aore size of 0.1 �m and a membrane area of 0.027 m2 (Fig. 2).he membrane module was prepared in the laboratory using
hollow-fibre membrane manufactured by a Spanish company
Porous Fibres). The number and length of the fibres in eachodule were similar, and clean water permeability was theame in both modules; tap water at 20 ◦C produced a valuef approximately 300 L/m2 h bar. The membranes were operated
Fig. 2. Membrane module.
in cycles, with 7 min of permeation and 0.5 min of backwash-ing (10 L/m2 h). Physical cleaning of the membrane module wasperformed by rinsing with tap water. Chemically enhanced back-washing was not used during the experiments. Chemical recoverycleaning was conducted when the pressure in the membraneswas higher than 30 kPa. The tertiary filtration chambers were aer-ated to minimise membrane fouling. Aeration rate applied was24 L/h.
Operation of the system was controlled by a programmablelogic controller (PLC) Siemens S7-200 connected to a com-puter. Transmembrane pressure (TMP) data were measured withan electronic pressure sensor IFM Efector500 PN-2009 with ananalogue 4–20 mA output and collected on the PC via an ana-logue PLC module Siemens EM 235 and a data acquisitionprogram.
2.1.2. Influent and operating strategyIndustrial wastewater from a fish freezing industry was treated
during the study. The raw wastewater contained 50–300 mg/Lammonia and 1000–6300 mg/L total COD. Total phosphorousranged between 70 and 190 mg/L of which 60–70% was orthophos-phate. Soluble COD represented around 85% total COD. Lots of theindustrial wastewater were taken and diluted with tap water toobtain the desired OLR and COD values in the influent. The solubleCOD values varied from 100 to 1100 mg/L. The total nitrogen con-centration ranged from 20 to 180 mg/L, and the total phosphorusconcentration ranged from 20 to 110 mg/L.
An exchange volume ratio of 50% and a cycle length of 3 h werefixed as operating parameters. The two SBR reactors were oper-ated with constant and similar HRTs and sludge retention times(SRTs) for the entire experimental period. The lengths of the feed-ing, reaction, settling and withdrawal phases were varied (Table 1)to promote the growth of either granular or flocculent sludge ineach SBR reactor.
Both SBRs were operated for 114 days prior to the start of thisresearch. The objective of this step was to develop either gran-ular or flocculent sludge with good settling properties prior tocoupling the filtration membrane modules to the SBRs [14]. Day0 was taken as the day on which operation of the tertiary fil-tration membranes started. The study lasted for 235 days thatcould be divided into four different experimental stages duringwhich the applied OLR or the concentration of particulate COD wasmodified.
Stage I (from day 0 until day 117). During this stage, both SBRsreceived a similar OLR of approximately 2 kg COD/m3 d. The objec-tive was to investigate tertiary filtration, with similar operatingconditions in both reactors.
318 A. Sánchez et al. / Journal of Membrane Science 382 (2011) 316– 322
Table 1Lengths of the stages during a cycle.
Reactor Stages Total
Feeding Reaction Settling Withdrawal Dead time
G-SBR (min) 3 (aerobic) 147 1 3 26 18020
hHf
tvF
ppsPgi
wc
2
pnwcam
tut
cecw
ia((tastar
dWsmilmp
that in the G-SBR because of the lower COD concentration in thefeed water of the F-SBR during stages II–IV. COD removal efficien-cies in the flocculent system ranged between 66 and 97%, whereas
0
1
2
3
4
5
6
OLR
(kg
CO
D/m
3·d)
Stage I
←HRT 6 612
IV III II
F-SBR (min) 60 (anoxic) 90
Later, during stages II–IV, the applied OLR in the G-SBR wasigher than that of the flocculent reactor, and the same averageRT was maintained in both systems by diluting the wastewater
ed to the F-SBR with tap water.Stage II (from day 118 until day 139). The OLR applied to
he G-SBR was maintained at approximately 3 kg COD/m3 d. Thisalue was greater than the rate of 1.5 kg COD/m3 d applied to the-SBR.
Stage III (from day 140 until day 210). Wastewater free of sus-ended solids was fed to both systems. The wastewater wasrepared by first removing particulate matter in a centrifugationtep and then filtering the supernatant with 0.45-�m flat-sheetVDF membrane filters. The objective of this stage was to investi-ate the effect of suspended solids on tertiary membrane filtrationn both systems.
Stage IV (from day 210 until day 235). The feeding of dilutedastewater with suspended solids was restarted on day 210 and
ontinued.
.2. Analytical methods
Samples of the influents and effluents from both SBRs and theermeates from the filtration chambers were taken. COD, ammo-ia, nitrite, nitrate, phosphate and suspended solids concentrationsere analysed according to standard methods [15]. Total organic
arbon (TOC) was determined with a Shimadzu TOC-500 analyser,nd total nitrogen was determined with a DN 1900 analyser (Rose-ount, Dohrmann).Samples were taken at the end of the withdrawal period, when
he filtration chambers had achieved their maximum operating vol-mes, a result of the entrance of secondary treated effluent fromhe SBRs.
Dissolved oxygen concentrations in the reactors and filtrationhambers were determined with an Oxi 340 WTW oxygen selectivelectrode, and pH was determined with an U-455 Ingold electrodeonnected to a Crison 506 pH-meter. Conductivity and temperatureere monitored with a CM 35 conductivimeter.
Soluble microbial products (SMP) were extracted by centrifug-ng the biomass for 5 min at 5000 rpm (Heraeus, Labofuge 200)nd filtering the supernatant through 0.2-mm glass fibre filtersGF 52, Schleicher and Schuell). Extracellular polymeric substancesEPS) were extracted according to the heating procedure [16]. Pro-ein and carbohydrate concentrations were determined by visiblebsorbance on a spectrophotometer (Cecil CE 7200), using bovineerum albumin (Sigma) and glucose standards (Merck), respec-ively. Carbohydrate and protein concentrations were determinedccording to the methods of Dubois et al. [17] and Lowry et al. [18],espectively.
The specific resistance to filtration (SRF) of a sludge sample wasetermined with the filterability test according to the method ofisniewski and Grasmick [19]. The test was conducted in a 180-mL
tirred cell (Model 8200, Amicon) using a 0.45-�m flat-sheet PVDFembrane filter (HVLP09050, Millipore). Particle size distributions
n the filtration chamber and in the effluents were determined byaser diffraction (Mastersizer HYDRO 2000MU, Malvern Inst.). This
ethod is based on the fact that the diffraction angle is inverselyroportional to particle size.
10 0 180
3. Results and discussion
3.1. SBRs and tertiary filtration system performance
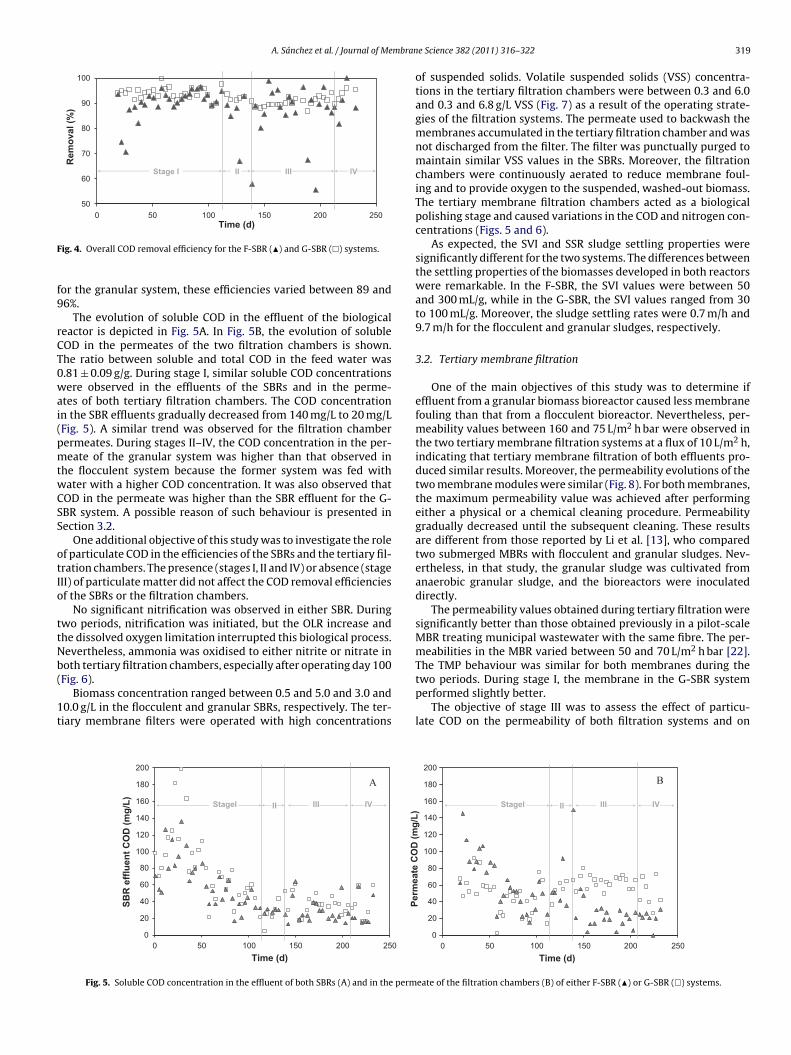
Fig. 3 shows the evolutions of the applied OLR and the HRT,referred to the reactor volume, during the four experimental stages.The HRTs were similar in both reactors for the entire period. More-over, during stage I (from day 0 until day 117), both units wereoperated with similar COD concentrations in the feed water andapplied OLR rates.
The OLR for both SBRs was approximately 2 kg COD/m3 d priorto the start of this research [14]. At the operating day 0, the OLRwas increased from 2 to 4 kg COD/m3 d to achieve better granularbiomass properties (Fig. 3). Nevertheless, this increase worsenedthe settling properties of the F-SBR sludge in terms of the sludgevolume index (SVI) and the sludge settling rate (SSR). This led to apartial wash out of the biomass in this reactor. For this reason, onday 19, the OLR was decreased to approximately 2.5 kg COD/m3 din both reactors and maintained at this level until the end ofstage I.
During stages II–IV, the applied OLR was higher in the G-SBRthan in the F-SBR; the HRTs were constant in both systems. G-SBRs are typically operated at higher OLRs (2.5 and 15 kg COD/m3 d[20,21]) than F-SBRs (0.5–2.0 kg COD/m3 d [2]). The wastewater fedto the F-SBR had a lower COD concentration (between 100 and400 mg/L) than that fed to the G-SBR (between 400 and 800 mg/L).The objective of stages II–IV was to compare the behaviour of thetwo SBRs at their recommended OLRs and of the respective tertiaryfiltration chambers.
Fig. 4 depicts the evolution of the overall COD removal percent-age in both systems. The COD removal efficiency was 90% for bothsystems in stage I, during which wastewaters with similar CODvalues were fed to the units. The presence of either flocculent orgranular biomass in SBR systems with tertiary filtration chambersdid not affect COD removal efficiency, in terms of soluble COD. Afterstage I, the COD removal efficiency in the F-SBR was lower than
250200150100500Time (d)
Fig. 3. Evolution of the applied organic loading rate in the (�) F-SBR and (�) G-SBRsystems during the four experimental stages.
A. Sánchez et al. / Journal of Membran
50
60
70
80
90
100
250200150100500Time (d)
Rem
oval
(%)
IIIIStage IV II
F
f9
rCT0wai(pmtwCSS
otIo
ttNb(
1t
two periods. During stage I, the membrane in the G-SBR system
ig. 4. Overall COD removal efficiency for the F-SBR (�) and G-SBR (�) systems.
or the granular system, these efficiencies varied between 89 and6%.
The evolution of soluble COD in the effluent of the biologicaleactor is depicted in Fig. 5A. In Fig. 5B, the evolution of solubleOD in the permeates of the two filtration chambers is shown.he ratio between soluble and total COD in the feed water was.81 ± 0.09 g/g. During stage I, similar soluble COD concentrationsere observed in the effluents of the SBRs and in the perme-
tes of both tertiary filtration chambers. The COD concentrationn the SBR effluents gradually decreased from 140 mg/L to 20 mg/LFig. 5). A similar trend was observed for the filtration chamberermeates. During stages II–IV, the COD concentration in the per-eate of the granular system was higher than that observed in
he flocculent system because the former system was fed withater with a higher COD concentration. It was also observed thatOD in the permeate was higher than the SBR effluent for the G-BR system. A possible reason of such behaviour is presented inection 3.2.
One additional objective of this study was to investigate the rolef particulate COD in the efficiencies of the SBRs and the tertiary fil-ration chambers. The presence (stages I, II and IV) or absence (stageII) of particulate matter did not affect the COD removal efficienciesf the SBRs or the filtration chambers.
No significant nitrification was observed in either SBR. Duringwo periods, nitrification was initiated, but the OLR increase andhe dissolved oxygen limitation interrupted this biological process.evertheless, ammonia was oxidised to either nitrite or nitrate inoth tertiary filtration chambers, especially after operating day 100Fig. 6).
Biomass concentration ranged between 0.5 and 5.0 and 3.0 and0.0 g/L in the flocculent and granular SBRs, respectively. The ter-iary membrane filters were operated with high concentrations
0
20
40
60
80
100
120
140
160
180
200
250200150100500Time (d)
SBR
effl
uent
CO
D (m
g/L) IVStageI IIIII
A
Fig. 5. Soluble COD concentration in the effluent of both SBRs (A) and in the perm
e Science 382 (2011) 316– 322 319
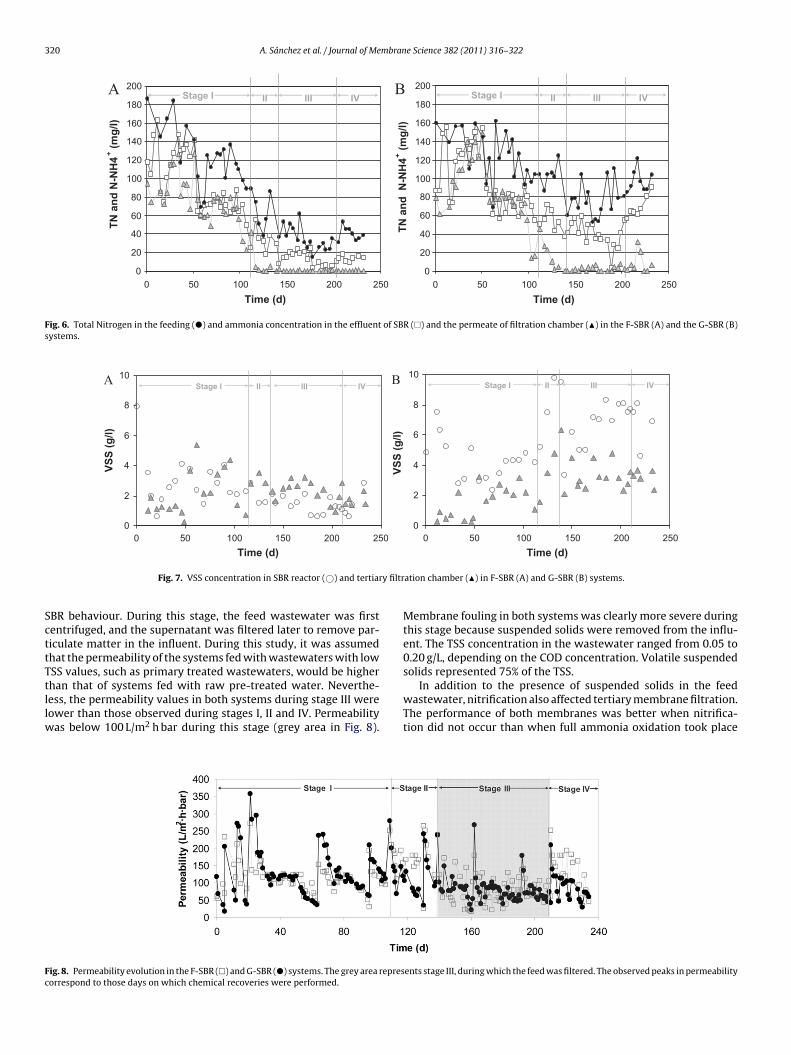
of suspended solids. Volatile suspended solids (VSS) concentra-tions in the tertiary filtration chambers were between 0.3 and 6.0and 0.3 and 6.8 g/L VSS (Fig. 7) as a result of the operating strate-gies of the filtration systems. The permeate used to backwash themembranes accumulated in the tertiary filtration chamber and wasnot discharged from the filter. The filter was punctually purged tomaintain similar VSS values in the SBRs. Moreover, the filtrationchambers were continuously aerated to reduce membrane foul-ing and to provide oxygen to the suspended, washed-out biomass.The tertiary membrane filtration chambers acted as a biologicalpolishing stage and caused variations in the COD and nitrogen con-centrations (Figs. 5 and 6).
As expected, the SVI and SSR sludge settling properties weresignificantly different for the two systems. The differences betweenthe settling properties of the biomasses developed in both reactorswere remarkable. In the F-SBR, the SVI values were between 50and 300 mL/g, while in the G-SBR, the SVI values ranged from 30to 100 mL/g. Moreover, the sludge settling rates were 0.7 m/h and9.7 m/h for the flocculent and granular sludges, respectively.
3.2. Tertiary membrane filtration
One of the main objectives of this study was to determine ifeffluent from a granular biomass bioreactor caused less membranefouling than that from a flocculent bioreactor. Nevertheless, per-meability values between 160 and 75 L/m2 h bar were observed inthe two tertiary membrane filtration systems at a flux of 10 L/m2 h,indicating that tertiary membrane filtration of both effluents pro-duced similar results. Moreover, the permeability evolutions of thetwo membrane modules were similar (Fig. 8). For both membranes,the maximum permeability value was achieved after performingeither a physical or a chemical cleaning procedure. Permeabilitygradually decreased until the subsequent cleaning. These resultsare different from those reported by Li et al. [13], who comparedtwo submerged MBRs with flocculent and granular sludges. Nev-ertheless, in that study, the granular sludge was cultivated fromanaerobic granular sludge, and the bioreactors were inoculateddirectly.
The permeability values obtained during tertiary filtration weresignificantly better than those obtained previously in a pilot-scaleMBR treating municipal wastewater with the same fibre. The per-meabilities in the MBR varied between 50 and 70 L/m2 h bar [22].The TMP behaviour was similar for both membranes during the
performed slightly better.The objective of stage III was to assess the effect of particu-
late COD on the permeability of both filtration systems and on
0
20
40
60
80
100
120
140
160
180
200
250200150100500Time (d)
Perm
eate
CO
D (m
g/L)
IVStageI IIIII
B
eate of the filtration chambers (B) of either F-SBR (�) or G-SBR (�) systems.
320 A. Sánchez et al. / Journal of Membrane Science 382 (2011) 316– 322
0
20
40
60
80
100
120
140
160
180
200
250200150100500Time (d)
TN a
nd N
-NH
4+ (mg/
l)Stage I III IV II
A
0
20
40
60
80
100
120
140
160
180
200
250200150100500Time (d)
TN a
nd N
-NH
4+ (mg/
l)
Stage I III IVIIB
Fig. 6. Total Nitrogen in the feeding (�) and ammonia concentration in the effluent of SBR (�) and the permeate of filtration chamber (�) in the F-SBR (A) and the G-SBR (B)systems.
0
2
4
6
8
10
250200150100500Time (d)
VSS
(g/l)
III Stage I IVIIA
0
2
4
6
8
10
250200150100500Time (d)
VSS
(g/l)
III Stage I IVIIB
y filtr
ScttTtllw
Fc
Fig. 7. VSS concentration in SBR reactor (©) and tertiar
BR behaviour. During this stage, the feed wastewater was firstentrifuged, and the supernatant was filtered later to remove par-iculate matter in the influent. During this study, it was assumedhat the permeability of the systems fed with wastewaters with lowSS values, such as primary treated wastewaters, would be higher
han that of systems fed with raw pre-treated water. Neverthe-ess, the permeability values in both systems during stage III wereower than those observed during stages I, II and IV. Permeabilityas below 100 L/m2 h bar during this stage (grey area in Fig. 8).
ig. 8. Permeability evolution in the F-SBR (�) and G-SBR (�) systems. The grey area represorrespond to those days on which chemical recoveries were performed.
ation chamber (�) in F-SBR (A) and G-SBR (B) systems.
Membrane fouling in both systems was clearly more severe duringthis stage because suspended solids were removed from the influ-ent. The TSS concentration in the wastewater ranged from 0.05 to0.20 g/L, depending on the COD concentration. Volatile suspendedsolids represented 75% of the TSS.
In addition to the presence of suspended solids in the feedwastewater, nitrification also affected tertiary membrane filtration.The performance of both membranes was better when nitrifica-tion did not occur than when full ammonia oxidation took place
ents stage III, during which the feed was filtered. The observed peaks in permeability
A. Sánchez et al. / Journal of Membrane Science 382 (2011) 316– 322 321
0
40
80
120
160
200
250200150100500Time (d)
SMP
carb
ohyd
rate
s (m
g/L) Stage I III IV II
Fc
(eatflnfgtaraii
ccb(TSpth64
acptlc
0
10
20
30
40
50
60
70
80
90
100
100001000100101Particle Size (μm)
Volu
me
(%)
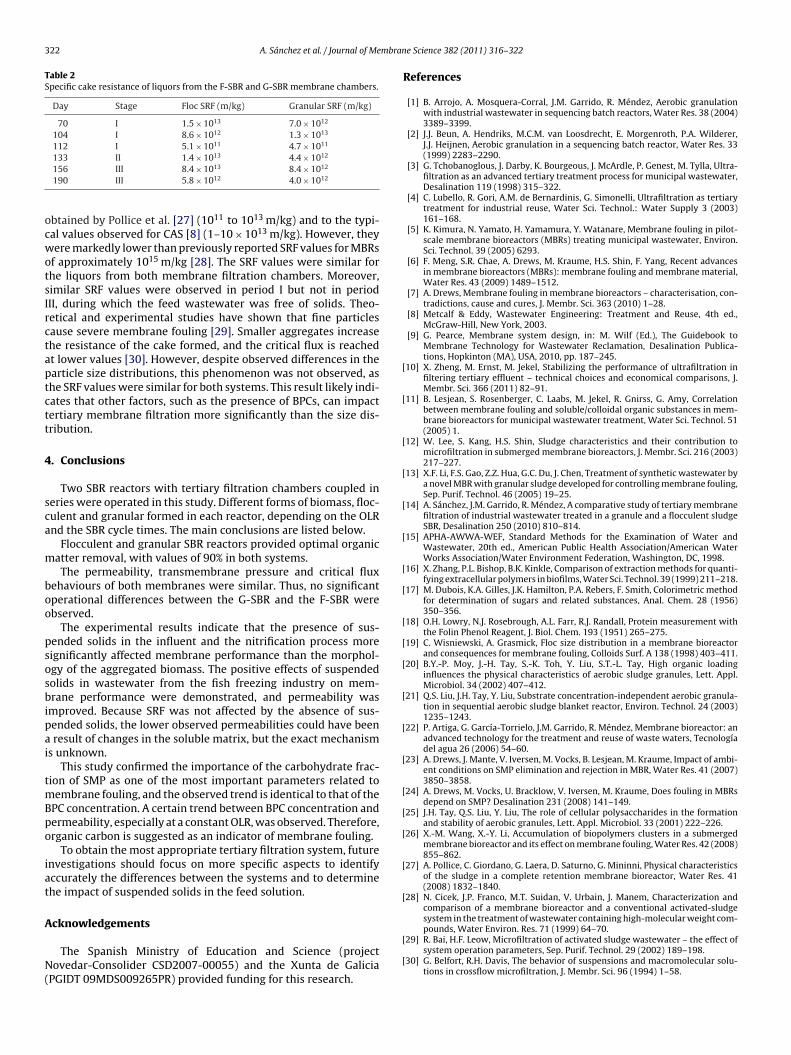
Fig. 11. Cumulative volume percentage distributions of the flocculent (�) and gran-
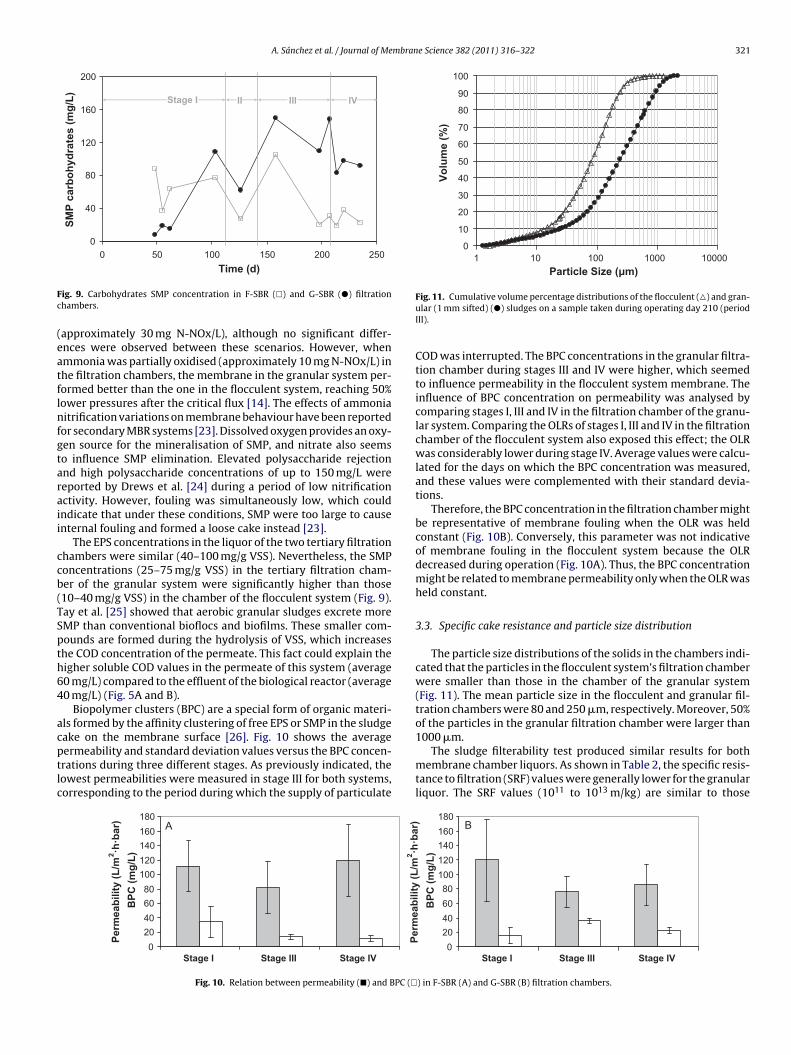
ig. 9. Carbohydrates SMP concentration in F-SBR (�) and G-SBR (�) filtrationhambers.approximately 30 mg N-NOx/L), although no significant differ-nces were observed between these scenarios. However, whenmmonia was partially oxidised (approximately 10 mg N-NOx/L) inhe filtration chambers, the membrane in the granular system per-ormed better than the one in the flocculent system, reaching 50%ower pressures after the critical flux [14]. The effects of ammoniaitrification variations on membrane behaviour have been reported
or secondary MBR systems [23]. Dissolved oxygen provides an oxy-en source for the mineralisation of SMP, and nitrate also seemso influence SMP elimination. Elevated polysaccharide rejectionnd high polysaccharide concentrations of up to 150 mg/L wereeported by Drews et al. [24] during a period of low nitrificationctivity. However, fouling was simultaneously low, which couldndicate that under these conditions, SMP were too large to causenternal fouling and formed a loose cake instead [23].
The EPS concentrations in the liquor of the two tertiary filtrationhambers were similar (40–100 mg/g VSS). Nevertheless, the SMPoncentrations (25–75 mg/g VSS) in the tertiary filtration cham-er of the granular system were significantly higher than those10–40 mg/g VSS) in the chamber of the flocculent system (Fig. 9).ay et al. [25] showed that aerobic granular sludges excrete moreMP than conventional bioflocs and biofilms. These smaller com-ounds are formed during the hydrolysis of VSS, which increaseshe COD concentration of the permeate. This fact could explain theigher soluble COD values in the permeate of this system (average0 mg/L) compared to the effluent of the biological reactor (average0 mg/L) (Fig. 5A and B).
Biopolymer clusters (BPC) are a special form of organic materi-ls formed by the affinity clustering of free EPS or SMP in the sludgeake on the membrane surface [26]. Fig. 10 shows the average
ermeability and standard deviation values versus the BPC concen-rations during three different stages. As previously indicated, theowest permeabilities were measured in stage III for both systems,orresponding to the period during which the supply of particulate020406080
100120140160180
Stage IVStage IIIStage I
Perm
eabi
lity
(L/m
2 ·h·b
ar)
BPC
(mg/
L)
A
2
Fig. 10. Relation between permeability (�) and BPC (�
ular (1 mm sifted) (�) sludges on a sample taken during operating day 210 (periodIII).
COD was interrupted. The BPC concentrations in the granular filtra-tion chamber during stages III and IV were higher, which seemedto influence permeability in the flocculent system membrane. Theinfluence of BPC concentration on permeability was analysed bycomparing stages I, III and IV in the filtration chamber of the granu-lar system. Comparing the OLRs of stages I, III and IV in the filtrationchamber of the flocculent system also exposed this effect; the OLRwas considerably lower during stage IV. Average values were calcu-lated for the days on which the BPC concentration was measured,and these values were complemented with their standard devia-tions.
Therefore, the BPC concentration in the filtration chamber mightbe representative of membrane fouling when the OLR was heldconstant (Fig. 10B). Conversely, this parameter was not indicativeof membrane fouling in the flocculent system because the OLRdecreased during operation (Fig. 10A). Thus, the BPC concentrationmight be related to membrane permeability only when the OLR washeld constant.
3.3. Specific cake resistance and particle size distribution
The particle size distributions of the solids in the chambers indi-cated that the particles in the flocculent system’s filtration chamberwere smaller than those in the chamber of the granular system(Fig. 11). The mean particle size in the flocculent and granular fil-tration chambers were 80 and 250 �m, respectively. Moreover, 50%of the particles in the granular filtration chamber were larger than1000 �m.
The sludge filterability test produced similar results for bothmembrane chamber liquors. As shown in Table 2, the specific resis-tance to filtration (SRF) values were generally lower for the granularliquor. The SRF values (1011 to 1013 m/kg) are similar to those
020406080
100120140160180
Stage IVStage IIIStage I
Perm
eabi
lity
(L/m
·h·b
ar)
BPC
(mg/
L)
B
) in F-SBR (A) and G-SBR (B) filtration chambers.
322 A. Sánchez et al. / Journal of Membran
Table 2Specific cake resistance of liquors from the F-SBR and G-SBR membrane chambers.
Day Stage Floc SRF (m/kg) Granular SRF (m/kg)
70 I 1.5 × 10¹³ 7.0 × 10¹²
104 I 8.6 × 10¹² 1.3 × 10¹³
112 I 5.1 × 10¹¹ 4.7 × 10¹¹
133 II 1.4 × 10¹³ 4.4 × 10¹²
ocwotsIrctaptctt
4
sca
m
boo
psosbipai
tmBpo
iat
A
N(
[
[
[
[
[
[
[
[
[
[
[
[
[
[
[
[
[
[
[
pounds, Water Environ. Res. 71 (1999) 64–70.
156 III 8.4 × 10¹³ 8.4 × 10¹²
190 III 5.8 × 10¹² 4.0 × 10¹²
btained by Pollice et al. [27] (1011 to 1013 m/kg) and to the typi-al values observed for CAS [8] (1–10 × 1013 m/kg). However, theyere markedly lower than previously reported SRF values for MBRs
f approximately 1015 m/kg [28]. The SRF values were similar forhe liquors from both membrane filtration chambers. Moreover,imilar SRF values were observed in period I but not in periodII, during which the feed wastewater was free of solids. Theo-etical and experimental studies have shown that fine particlesause severe membrane fouling [29]. Smaller aggregates increasehe resistance of the cake formed, and the critical flux is reachedt lower values [30]. However, despite observed differences in thearticle size distributions, this phenomenon was not observed, ashe SRF values were similar for both systems. This result likely indi-ates that other factors, such as the presence of BPCs, can impactertiary membrane filtration more significantly than the size dis-ribution.
. Conclusions
Two SBR reactors with tertiary filtration chambers coupled ineries were operated in this study. Different forms of biomass, floc-ulent and granular formed in each reactor, depending on the OLRnd the SBR cycle times. The main conclusions are listed below.
Flocculent and granular SBR reactors provided optimal organicatter removal, with values of 90% in both systems.The permeability, transmembrane pressure and critical flux
ehaviours of both membranes were similar. Thus, no significantperational differences between the G-SBR and the F-SBR werebserved.
The experimental results indicate that the presence of sus-ended solids in the influent and the nitrification process moreignificantly affected membrane performance than the morphol-gy of the aggregated biomass. The positive effects of suspendedolids in wastewater from the fish freezing industry on mem-rane performance were demonstrated, and permeability was
mproved. Because SRF was not affected by the absence of sus-ended solids, the lower observed permeabilities could have been
result of changes in the soluble matrix, but the exact mechanisms unknown.
This study confirmed the importance of the carbohydrate frac-ion of SMP as one of the most important parameters related to
embrane fouling, and the observed trend is identical to that of thePC concentration. A certain trend between BPC concentration andermeability, especially at a constant OLR, was observed. Therefore,rganic carbon is suggested as an indicator of membrane fouling.
To obtain the most appropriate tertiary filtration system, futurenvestigations should focus on more specific aspects to identifyccurately the differences between the systems and to determinehe impact of suspended solids in the feed solution.
cknowledgements
The Spanish Ministry of Education and Science (projectovedar-Consolider CSD2007-00055) and the Xunta de Galicia
PGIDT 09MDS009265PR) provided funding for this research.
[
[
e Science 382 (2011) 316– 322
References
[1] B. Arrojo, A. Mosquera-Corral, J.M. Garrido, R. Méndez, Aerobic granulationwith industrial wastewater in sequencing batch reactors, Water Res. 38 (2004)3389–3399.
[2] J.J. Beun, A. Hendriks, M.C.M. van Loosdrecht, E. Morgenroth, P.A. Wilderer,J.J. Heijnen, Aerobic granulation in a sequencing batch reactor, Water Res. 33(1999) 2283–2290.
[3] G. Tchobanoglous, J. Darby, K. Bourgeous, J. McArdle, P. Genest, M. Tylla, Ultra-filtration as an advanced tertiary treatment process for municipal wastewater,Desalination 119 (1998) 315–322.
[4] C. Lubello, R. Gori, A.M. de Bernardinis, G. Simonelli, Ultrafiltration as tertiarytreatment for industrial reuse, Water Sci. Technol.: Water Supply 3 (2003)161–168.
[5] K. Kimura, N. Yamato, H. Yamamura, Y. Watanare, Membrane fouling in pilot-scale membrane bioreactors (MBRs) treating municipal wastewater, Environ.Sci. Technol. 39 (2005) 6293.
[6] F. Meng, S.R. Chae, A. Drews, M. Kraume, H.S. Shin, F. Yang, Recent advancesin membrane bioreactors (MBRs): membrane fouling and membrane material,Water Res. 43 (2009) 1489–1512.
[7] A. Drews, Membrane fouling in membrane bioreactors – characterisation, con-tradictions, cause and cures, J. Membr. Sci. 363 (2010) 1–28.
[8] Metcalf & Eddy, Wastewater Engineering: Treatment and Reuse, 4th ed.,McGraw-Hill, New York, 2003.
[9] G. Pearce, Membrane system design, in: M. Wilf (Ed.), The Guidebook toMembrane Technology for Wastewater Reclamation, Desalination Publica-tions, Hopkinton (MA), USA, 2010, pp. 187–245.
10] X. Zheng, M. Ernst, M. Jekel, Stabilizing the performance of ultrafiltration infiltering tertiary effluent – technical choices and economical comparisons, J.Membr. Sci. 366 (2011) 82–91.
11] B. Lesjean, S. Rosenberger, C. Laabs, M. Jekel, R. Gnirss, G. Amy, Correlationbetween membrane fouling and soluble/colloidal organic substances in mem-brane bioreactors for municipal wastewater treatment, Water Sci. Technol. 51(2005) 1.
12] W. Lee, S. Kang, H.S. Shin, Sludge characteristics and their contribution tomicrofiltration in submerged membrane bioreactors, J. Membr. Sci. 216 (2003)217–227.
13] X.F. Li, F.S. Gao, Z.Z. Hua, G.C. Du, J. Chen, Treatment of synthetic wastewater bya novel MBR with granular sludge developed for controlling membrane fouling,Sep. Purif. Technol. 46 (2005) 19–25.
14] A. Sánchez, J.M. Garrido, R. Méndez, A comparative study of tertiary membranefiltration of industrial wastewater treated in a granule and a flocculent sludgeSBR, Desalination 250 (2010) 810–814.
15] APHA-AWWA-WEF, Standard Methods for the Examination of Water andWastewater, 20th ed., American Public Health Association/American WaterWorks Association/Water Environment Federation, Washington, DC, 1998.
16] X. Zhang, P.L. Bishop, B.K. Kinkle, Comparison of extraction methods for quanti-fying extracellular polymers in biofilms, Water Sci. Technol. 39 (1999) 211–218.
17] M. Dubois, K.A. Gilles, J.K. Hamilton, P.A. Rebers, F. Smith, Colorimetric methodfor determination of sugars and related substances, Anal. Chem. 28 (1956)350–356.
18] O.H. Lowry, N.J. Rosebrough, A.L. Farr, R.J. Randall, Protein measurement withthe Folin Phenol Reagent, J. Biol. Chem. 193 (1951) 265–275.
19] C. Wisniewski, A. Grasmick, Floc size distribution in a membrane bioreactorand consequences for membrane fouling, Colloids Surf. A 138 (1998) 403–411.
20] B.Y.-P. Moy, J.-H. Tay, S.-K. Toh, Y. Liu, S.T.-L. Tay, High organic loadinginfluences the physical characteristics of aerobic sludge granules, Lett. Appl.Microbiol. 34 (2002) 407–412.
21] Q.S. Liu, J.H. Tay, Y. Liu, Substrate concentration-independent aerobic granula-tion in sequential aerobic sludge blanket reactor, Environ. Technol. 24 (2003)1235–1243.
22] P. Artiga, G. García-Torrielo, J.M. Garrido, R. Méndez, Membrane bioreactor: anadvanced technology for the treatment and reuse of waste waters, Tecnologíadel agua 26 (2006) 54–60.
23] A. Drews, J. Mante, V. Iversen, M. Vocks, B. Lesjean, M. Kraume, Impact of ambi-ent conditions on SMP elimination and rejection in MBR, Water Res. 41 (2007)3850–3858.
24] A. Drews, M. Vocks, U. Bracklow, V. Iversen, M. Kraume, Does fouling in MBRsdepend on SMP? Desalination 231 (2008) 141–149.
25] J.H. Tay, Q.S. Liu, Y. Liu, The role of cellular polysaccharides in the formationand stability of aerobic granules, Lett. Appl. Microbiol. 33 (2001) 222–226.
26] X.-M. Wang, X.-Y. Li, Accumulation of biopolymers clusters in a submergedmembrane bioreactor and its effect on membrane fouling, Water Res. 42 (2008)855–862.
27] A. Pollice, C. Giordano, G. Laera, D. Saturno, G. Mininni, Physical characteristicsof the sludge in a complete retention membrane bioreactor, Water Res. 41(2008) 1832–1840.
28] N. Cicek, J.P. Franco, M.T. Suidan, V. Urbain, J. Manem, Characterization andcomparison of a membrane bioreactor and a conventional activated-sludgesystem in the treatment of wastewater containing high-molecular weight com-
29] R. Bai, H.F. Leow, Microfiltration of activated sludge wastewater – the effect ofsystem operation parameters, Sep. Purif. Technol. 29 (2002) 189–198.
30] G. Belfort, R.H. Davis, The behavior of suspensions and macromolecular solu-tions in crossflow microfiltration, J. Membr. Sci. 96 (1994) 1–58.