Embed Size (px)
Citation preview

MTAC Publication TR06-10 ISWS Contract Report 2006-07
Temporal Variability of Arsenic in Municipal Well Water
Thomas R. Holm, Steven D. Wilson, and Walton R. Kelly
Center for Groundwater Science Illinois State Water Survey
2204 Griffith Drive Champaign, Illinois 61820-7495
i
Temporal Variability of Arsenic in Municipal Well Water
Thomas R. Holm, Steven D. Wilson, and Walton R. Kelly
Center for Groundwater Science Illinois State Water Survey
2204 Griffith Drive Champaign, Illinois 61820-7495
September 2006
ii
DISCLAIMER
This material is based upon work supported by the Midwest Technology Assistance Center for Small Public Water Systems (MTAC). MTAC was established October1, 1998 to provide assistance to small public water systems throughout the Midwest via funding from the United States Environmental Protection Agency (USEPA) under section 1420(f) of the 1996 amendments to the Safe Drinking Water Act. MTAC is funded by the USEPA under Grant No. X829218-01. Any opinions, findings, conclusions, or recommendations expressed in this publication are those of the author(s) and do not necessarily reflect the views of the USEPA or MTAC.
iii
Contents
Page
Abstract ..........................................................................................................................................iv Introduction .....................................................................................................................................1 Background .........................................................................................................................2 Methodology ...................................................................................................................................4 Results and Discussion ...................................................................................................................5 Conclusions .....................................................................................................................................7 Acknowledgments ...........................................................................................................................8 References .......................................................................................................................................9 Figures ...........................................................................................................................................10

iv
Abstract Short-term variations in groundwater arsenic (As) concentrations were characterized at four water treatment plants in Illinois and one in Indiana. At each plant, water samples were collected at 45-minute intervals over a six-hour period. Concentrations of As remained steady during the entire test at three facilities. At one facility, the As concentration increased from 58 μg/L in the first sample to 82 μg/L after 2.5 hours. At another facility the As concentration increased from 48 μg/L in the first sample to 68-70 μg/L in all subsequent samples. Variations in As over several years four of these facilities were characterized using data from the Water Survey’s groundwater-quality database. The long-term As variations were unique at each facility. For example, at one facility, the minimum and maximum As concentrations were 20 μg/L and 120 μg/L, a factor of 6. At another facility, the range in As was relatively narrow, with minimum and maximum As concentrations of 34 μg/L and 46 μg/L.

1
Introduction The U. S. Environmental Protection Agency arsenic (As) maximum contaminant level (MCL) was 50 micrograms per liter (μg/L) for many years and almost all water utilities in Illinois satisfied that MCL. In 2002, the MCL was lowered to 10 μg/L and as a result several utilities were suddenly out of compliance and had four years to get their As concentrations below the new MCL. Most options for lowering As concentrations in potable water, such as drilling a new well or installing new equipment, are expensive. Most communities with high As concentrations in their source water have small populations with limited resources and meeting the new MCL could impose a severe economic burden (Frey et al. 1998). Temporal variations in source-water As concentrations may determine whether a utility is in compliance. That is, a short-term As increase or “spike” at the time of compliance sampling may result in a water utility being classified as out of compliance (Type I error). On the other hand, a short-term As decrease or “dip” may make a utility seem to be in compliance when, in fact, it is not (Type II error). Temporal variations may also dictate treatment method or operational parameters. Background Temporal variations in groundwater As concentrations are uncommon but not unknown and have been observed over time scales from minutes to years. Cheng et al. (Cheng et al. 2005) found that the As concentrations in 10 community wells in Bangladesh varied by only about ±1 μg/L over a 3-year period. On the other hand Berg et al. (Berg et al. 2001) observed large variations over 15 months in wells serving treatment plants in Hanoi, Vietnam, in a similar geologic setting to those studied by Cheng et al. (Cheng et al. 2005). The largest percent change was 13-145 μg/L, a factor of more than 11, and the largest absolute range was 76-374 μg/L. Steinmaus et al. (Steinmaus et al. 2005) analyzed data from the Nevada State Health Division records, including public and private wells. For 394 wells with over 5 μg/L As and measurements 1-5 years apart, the Spearman correlation coefficient of repeated measurements of the same well was 0.71. (For perfect correlation the coefficient would be 1.00.) There was little variation in most wells, but significant variation for some. For wells with the first As measurement of 10 μg/L, subsequent measurements were in the 1 to 100 μg/L range. (This was estimated from a small graph with logarithmic scales and many overlapping symbols. Nevertheless, the range in the data was clear.) Hinkle and Polette (Hinkle and Polette 1999) collected samples from 17 irrigation wells in the Willamette Basin, Oregon. Nine wells showed little variation in As. On the other hand, As concentrations in one well increased from 14 μg/L to 40 μg/L (a factor of almost 3) in consecutive quarters. In another well As concentrations were in the 50 - 100 μg/L range. They found no correlation with season and attributed the arsenic variability to differing pumping rates and lengths of pumping prior to sampling. They suggest that in a bedrock system, water is withdrawn from multiple sources and will be significantly different depending on the water level at the time of sampling.
2
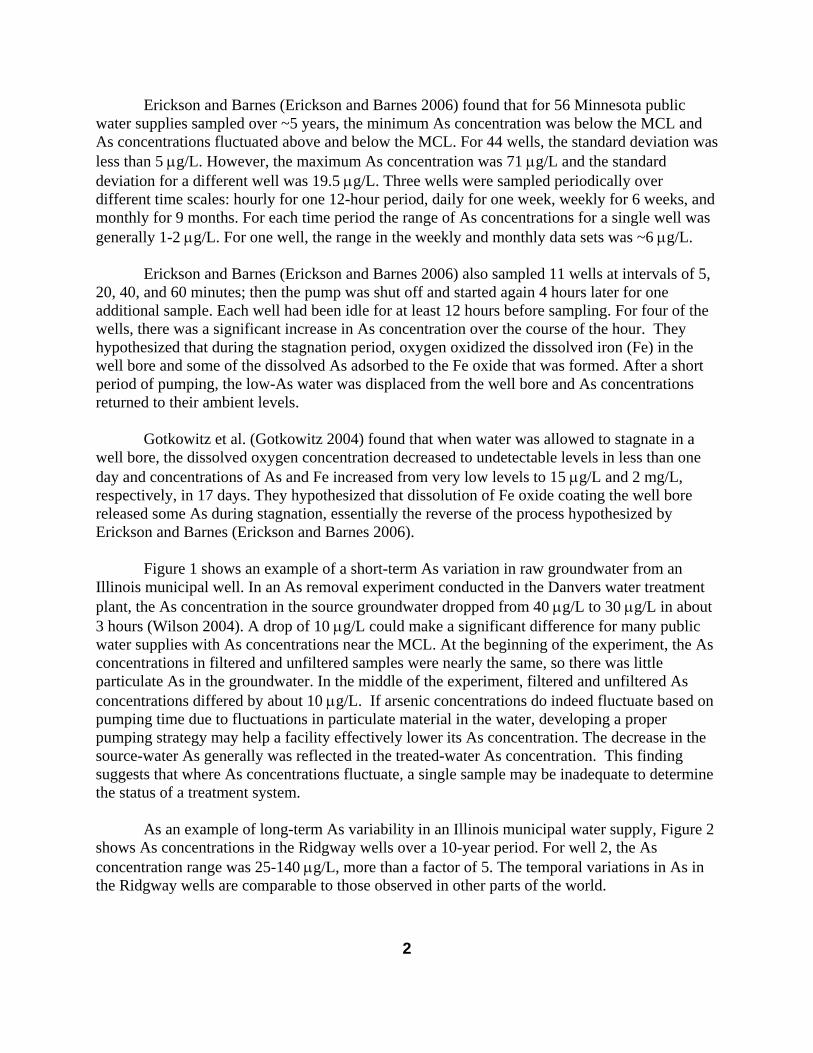
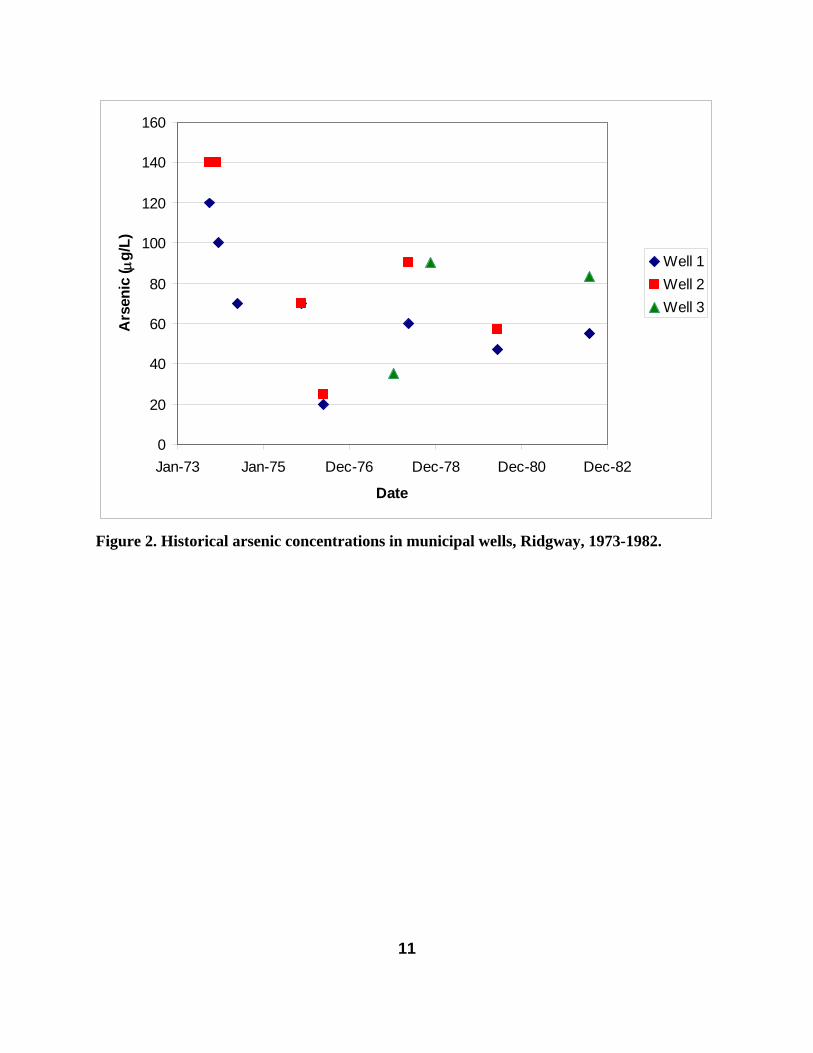
Erickson and Barnes (Erickson and Barnes 2006) found that for 56 Minnesota public water supplies sampled over ~5 years, the minimum As concentration was below the MCL and As concentrations fluctuated above and below the MCL. For 44 wells, the standard deviation was less than 5 μg/L. However, the maximum As concentration was 71 μg/L and the standard deviation for a different well was 19.5 μg/L. Three wells were sampled periodically over different time scales: hourly for one 12-hour period, daily for one week, weekly for 6 weeks, and monthly for 9 months. For each time period the range of As concentrations for a single well was generally 1-2 μg/L. For one well, the range in the weekly and monthly data sets was ~6 μg/L. Erickson and Barnes (Erickson and Barnes 2006) also sampled 11 wells at intervals of 5, 20, 40, and 60 minutes; then the pump was shut off and started again 4 hours later for one additional sample. Each well had been idle for at least 12 hours before sampling. For four of the wells, there was a significant increase in As concentration over the course of the hour. They hypothesized that during the stagnation period, oxygen oxidized the dissolved iron (Fe) in the well bore and some of the dissolved As adsorbed to the Fe oxide that was formed. After a short period of pumping, the low-As water was displaced from the well bore and As concentrations returned to their ambient levels. Gotkowitz et al. (Gotkowitz 2004) found that when water was allowed to stagnate in a well bore, the dissolved oxygen concentration decreased to undetectable levels in less than one day and concentrations of As and Fe increased from very low levels to 15 μg/L and 2 mg/L, respectively, in 17 days. They hypothesized that dissolution of Fe oxide coating the well bore released some As during stagnation, essentially the reverse of the process hypothesized by Erickson and Barnes (Erickson and Barnes 2006). Figure 1 shows an example of a short-term As variation in raw groundwater from an Illinois municipal well. In an As removal experiment conducted in the Danvers water treatment plant, the As concentration in the source groundwater dropped from 40 μg/L to 30 μg/L in about 3 hours (Wilson 2004). A drop of 10 μg/L could make a significant difference for many public water supplies with As concentrations near the MCL. At the beginning of the experiment, the As concentrations in filtered and unfiltered samples were nearly the same, so there was little particulate As in the groundwater. In the middle of the experiment, filtered and unfiltered As concentrations differed by about 10 μg/L. If arsenic concentrations do indeed fluctuate based on pumping time due to fluctuations in particulate material in the water, developing a proper pumping strategy may help a facility effectively lower its As concentration. The decrease in the source-water As generally was reflected in the treated-water As concentration. This finding suggests that where As concentrations fluctuate, a single sample may be inadequate to determine the status of a treatment system. As an example of long-term As variability in an Illinois municipal water supply, Figure 2 shows As concentrations in the Ridgway wells over a 10-year period. For well 2, the As concentration range was 25-140 μg/L, more than a factor of 5. The temporal variations in As in the Ridgway wells are comparable to those observed in other parts of the world.

3
Clearly, many factors determine whether the As concentrations in well water remains steady over time or changes significantly. The goal of this project was to characterize short-term temporal variations in source-water As concentration in some Illinois water treatment plants.
4
Methodology Five facilities were chosen for this study (Figure 3). Four Illinois facilities had been sampled previously (Wilson 2004), and the fifth, Kingman, Indiana was chosen because the operator had been in contact with the Illinois State Water Survey (ISWS) about possible treatment options for an As problem. As more became known about the facility, ISWS scientists decided to seek permission to sample at the Kingman facility. The 4 Illinois communities included in the study were Grand Ridge, Kenney, Ridgway, and Waterman. Of the five study locations, four have wells that are finished in unconsolidated sand and gravel. The other facility, the Village of Waterman, has wells finished in a limestone formation at a depth of about 400 feet. The Kenney and Grand Ridge wells are in deep glacial deposits over 250 feet below land surface. The Ridgway and Kingman, IN wells are in shallower sands and gravels about 100 feet below land surface. All of the wells are in confined systems that typically have reduced groundwater chemistry, including non-detectable dissolved oxygen and detectable dissolved Fe. Ridgway was sampled first, on June 7, 2005. Kingman was the last facility sampled, on November 15, 2005. At each facility, the well pump was left off overnight before sampling. Water samples were then collected immediately as the pump was turned on, and then every 45 minutes for 3 hours. At that point, the well was shut off for 45 minutes, then restarted to collect samples every 15 minutes for the remaining 45 minutes. Both unfiltered and filtered (0.45 μm) samples of untreated and treated water were collected. The high-density polyethylene sample bottles contained sufficient nitric acid to give a concentration of 0.2% (by volume) after dilution with the sample. The samples were analyzed for As by inductively coupled plasma mass spectrometry (Holm 2004). Selected samples were analyzed for Fe by colorimetry (Clesceri et al. 1998).

5
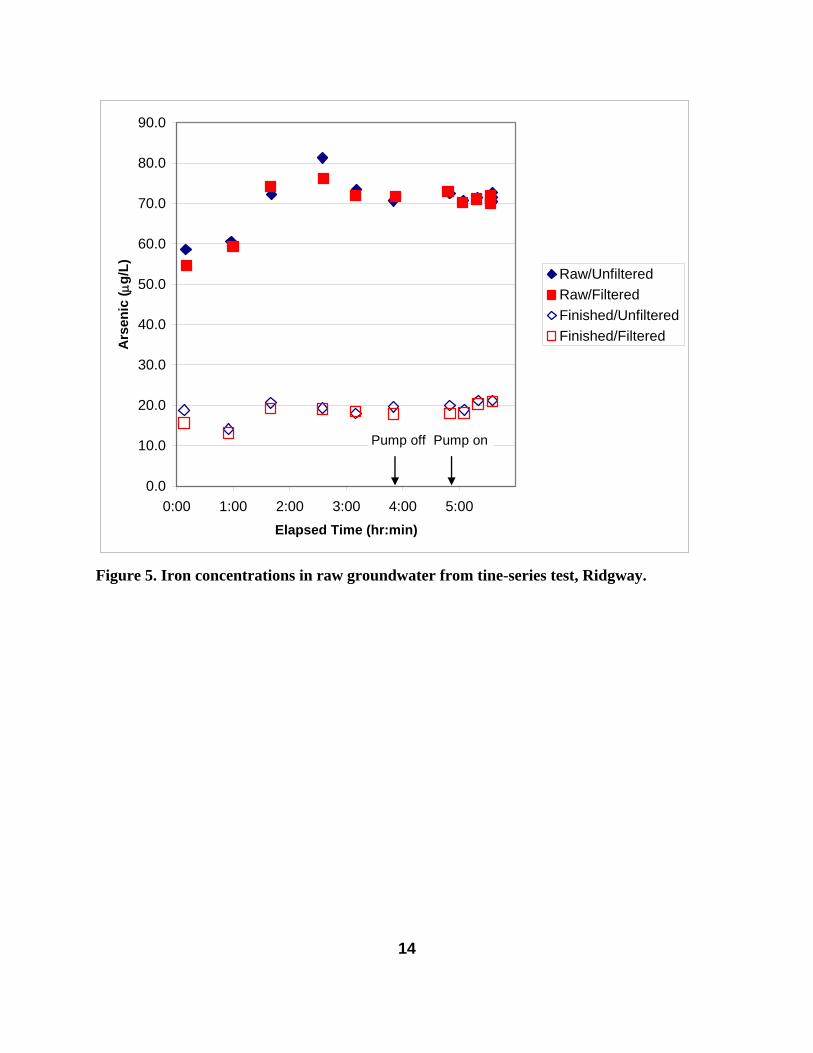
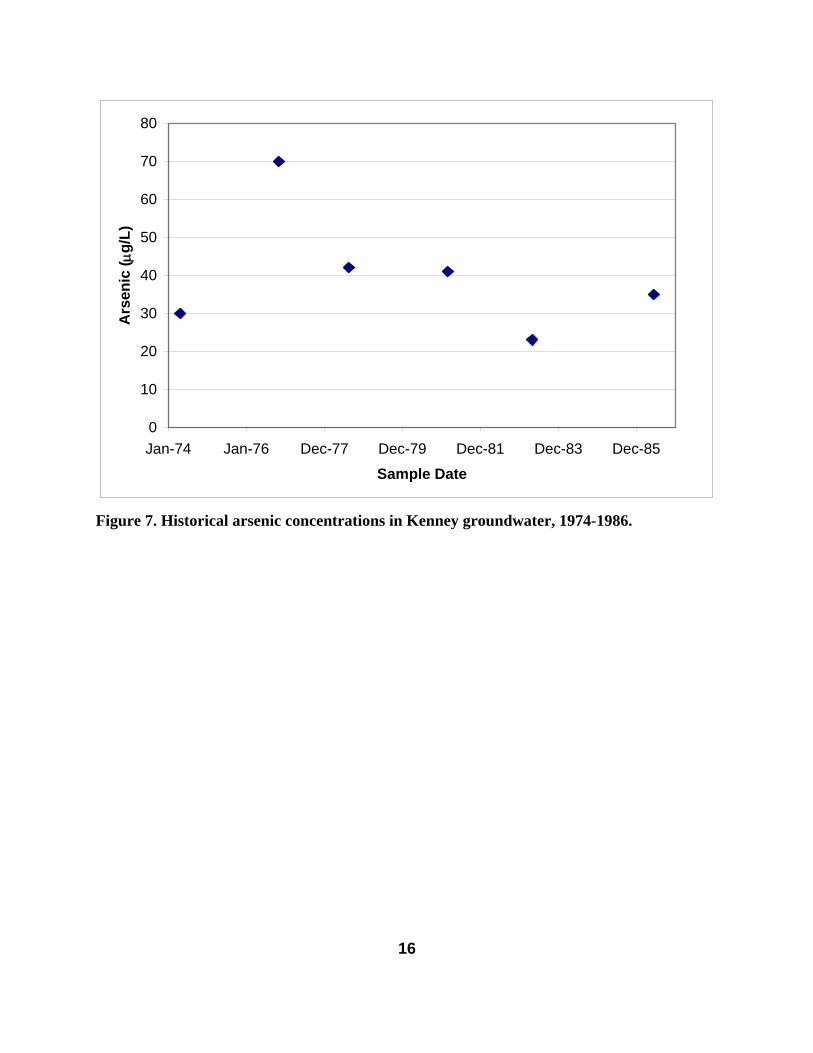
Results and Discussion The first unfiltered sample from Ridgway Well 3 had 58 μg/L As and concentrations steadily increased to 82 μg/L over the next 2 hours and then decreased to 70-75 μg/L for the rest of the test (Figure 4). There was no change in As concentrations after the pump was turned off for 45 minutes and then turned back on. Triplicate samples were collected at the end of the run. The range of concentration for these samples gives some idea of the overall precision of sampling, storage, and analysis. The differences between unfiltered and filtered samples were mostly smaller than the range of concentrations for the triplicate samples. The concentration of particulate As was less than ~4 μg/L. The Fe concentrations fluctuated between 4.0 and 4.5 mg/L during the test (Figure 5). Despite the increase in raw-water As in the first 2 hours, the treated-water As concentration was practically constant at 15-20 μg/L. Therefore, the treatment system (aeration and sand filtration) removed 40-60 μg/L or 67-75% of the As. For treated water, the differences between unfiltered and 0.45 μm-filtered As concentrations were less than 2 μg/L, so the sand filter removed essentially all of the particulate As formed in the aerator. The As concentrations in the Ridgway groundwater increased steadily over a period of 2.5 hours, which is far longer than the time to flush the well bore and gravel pack, and the Fe concentrations were practically constant. This suggests that the As variation at Ridgway was not due to the mechanism proposed by Erickson and Barnes (Erickson and Barnes 2006), i.e., Fe oxide precipitation and As adsorption in the well bore and gravel pack overnight followed by displacement of the low-As water by high-As ambient groundwater at the beginning of the pump test. The differences between filtered and unfiltered As concentrations were all less than 5 μg/L, so mobilization of particulate or colloidal As cannot explain the increase in As. The changes in As at Ridgway may be caused by spatial heterogeneity in groundwater As concentrations. Arsenic concentrations in the Mahomet Aquifer are spatially heterogeneous. Clusters of private wells much less than 1 km apart and with less than 10 μg/L and more than 50 μg/L As have been found in Tazewell County (Kelly et al. 2005). The ambient As concentration may have been ~50 μg/L in the vicinity of Ridgway Well 3, but continued pumping brought in higher-As groundwater from nearby. The As concentrations in the time-series test are in the range of historical As concentrations in Figure 2. The sampling protocol and pumping history of these samples is unknown. Some of the apparent long-term variation in As may have been due to sample collection at different times in the pumping cycle. The As concentrations in Kenney untreated water remained essentially constant at 40 μg/L for the entire test (Figure 6). Unfiltered and filtered As concentrations were nearly identical until the end when unfiltered concentrations were 3-5 μg/L higher than filtered concentrations. Shortly after the fifth set of samples was collected the water tower filled up and untreated water had to be diverted to the sewer. Only untreated water samples were collected for the rest of the test. Filtered As concentrations were nearly constant for all treated samples. Filtered and unfiltered As concentrations were identical in the first 2 samples of treated water. In the third sample, however, the unfiltered As concentration was similar to that of untreated groundwater. In the last two treated samples, unfiltered As concentrations were 7-8 μg/L higher than in 0.45 μm-filtered samples. For these samples, the sand filter may have released some particulate As. The
6
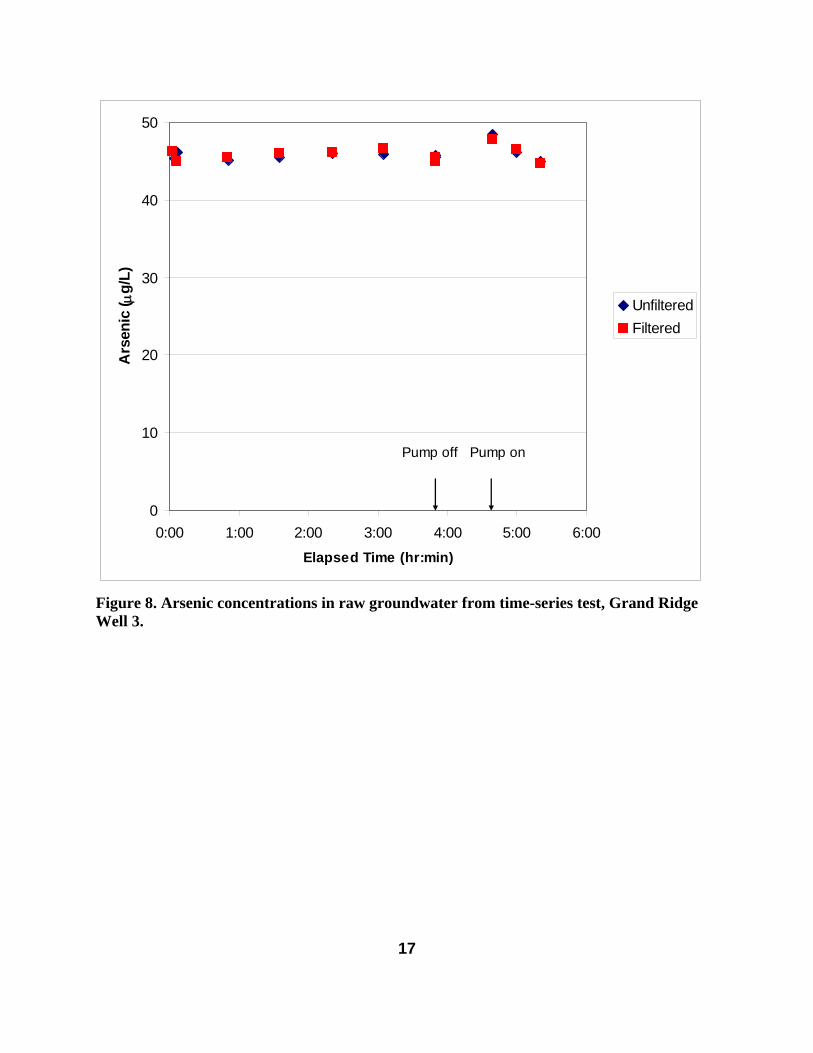
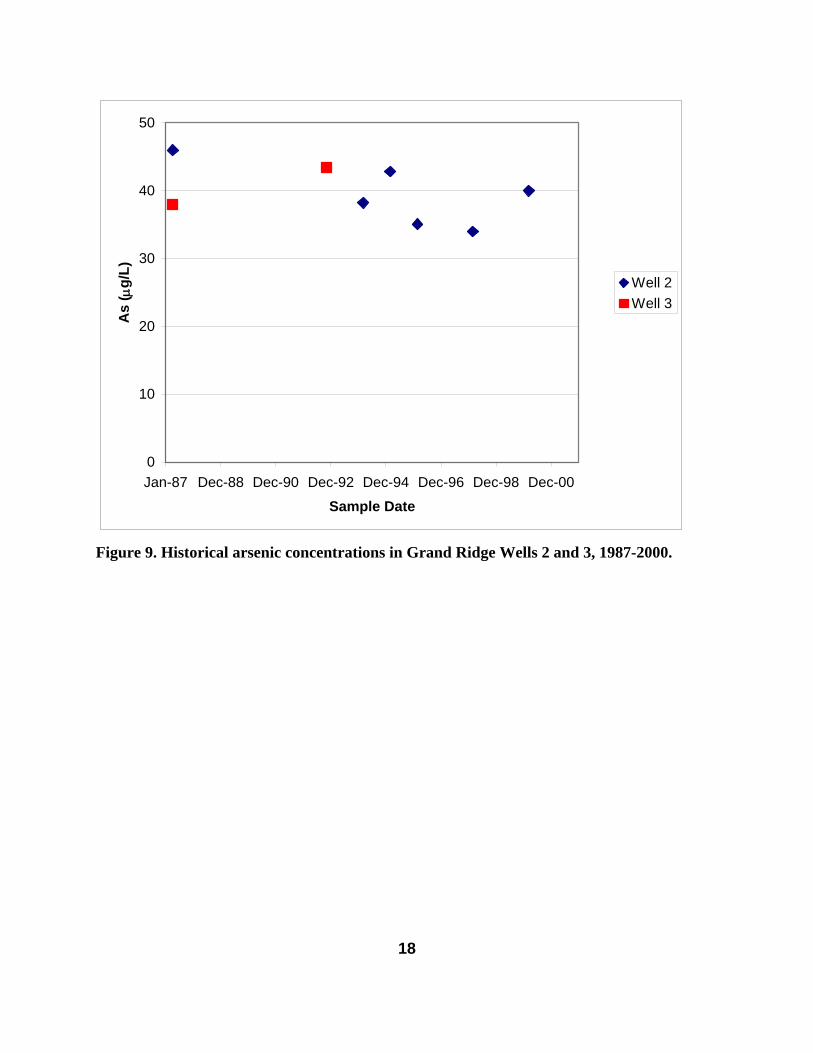
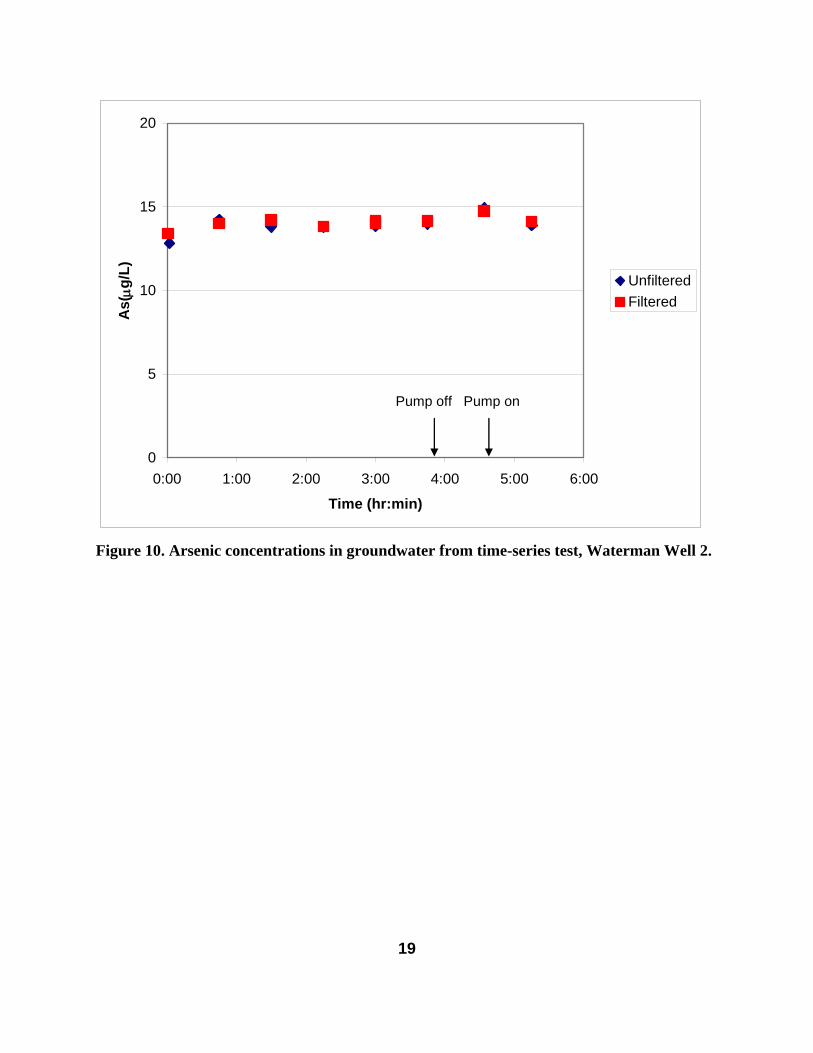
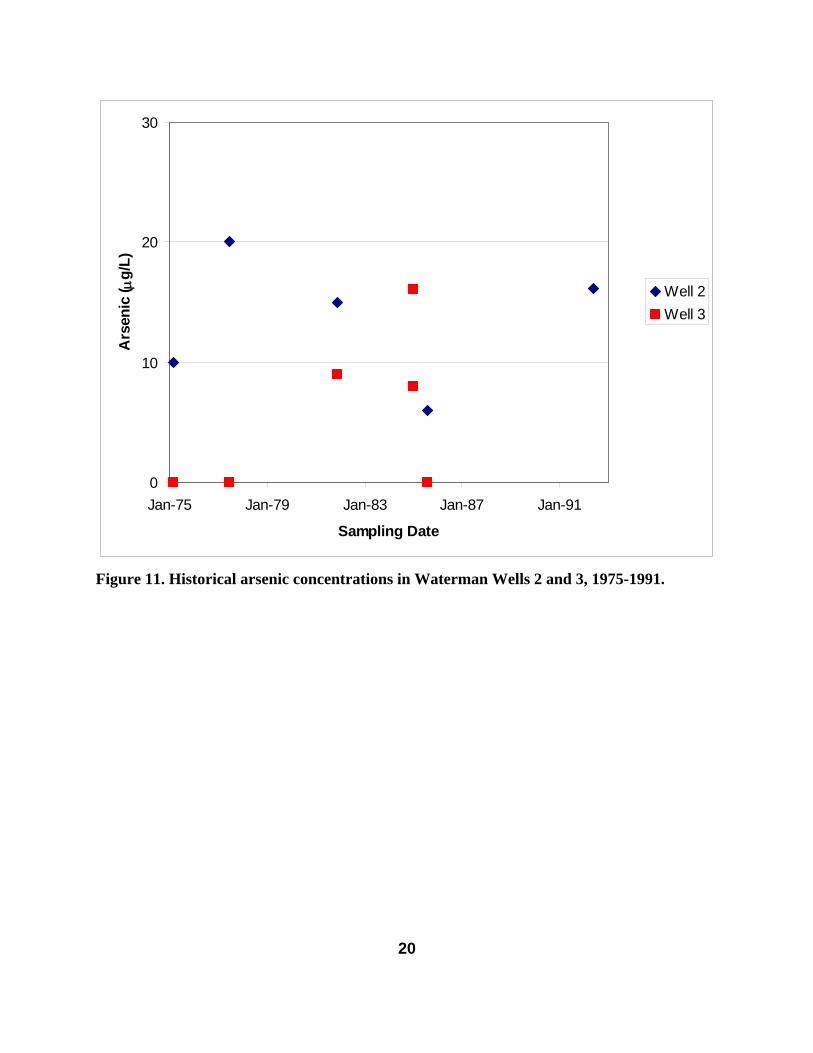
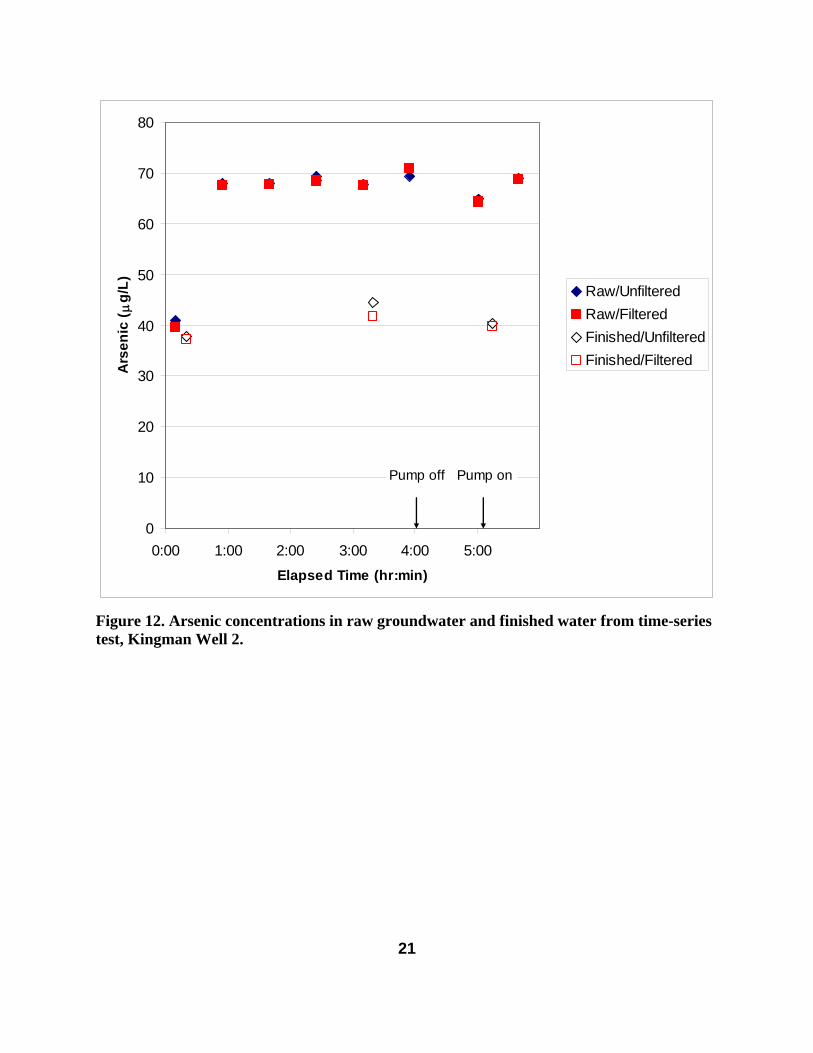
historical As concentrations in the Kenney well fluctuated between 23 and 70 μg/L, with the median As concentration close to the concentration in the time-series test (Figure 7). Neither the Grand Ridge nor Waterman plants remove Fe, so only untreated water samples were collected. The As concentrations from Grand Ridge Well 3 (Figure 8) were 45-48 μg/L for the entire test. Historical As concentrations in Grand Ridge Wells 2 and 3 fluctuated between 35 and 45 μg/L (Figure 9), near the concentrations in the time-series test. Samples from Waterman Well 2 (Figure 10) were in a narrow range, 13-14 μg/L, just above the MCL. Arsenic removal efficiency varies widely at Fe removal plants (McNeill and Edwards 1995). However, given the relatively high ratio of Fe to As, an Fe-removal plant at Waterman would probably satisfy the MCL (Wilson 2004). Historical As concentrations in Waterman Wells 2 and 3 fluctuated about the MCL (Figure 11). For both the Grand Ridge and Waterman systems, unfiltered and filtered As concentrations were nearly equal in all samples. The As concentration in untreated water from Kingman increased from 40 μg/L in the first sample to 65-71 μg/L in all subsequent samples (Figure 12). This rapid increase in As is similar to that observed in some wells by Erickson and Barnes (Erickson and Barnes 2006). Because the treatment plant was more than a mile from the well head, only three treated samples were collected. There was little variation in treated As, with concentrations between 37 and 42 μg/L. The difference between unfiltered and filtered As concentrations was no more than 2 μg/L for all samples.

7
Conclusions Arsenic concentrations in three municipal wells were essentially constant over five hours of pumping. In Ridgway Well 3, As concentrations increased from 60 μg/L to 80 μg/L in the first 2.5 hours of pumping. A likely explanation is a heterogeneous distribution of As in groundwater in the vicinity of the well. In Kingman Well 1, the As concentration increased from 40 to 68 μg/L between the first and second samples. The relatively rapid increase in As may have been due to Fe oxide precipitation and As adsorption during overnight stagnation followed by displacement of the low-As water by high-As water when the pump test was started. Particulate As concentrations were low in all raw groundwater samples. There was no evidence of mobilization of particulate or colloidal material in any of the tests. The study results are consistent with those of previous studies. In three systems, there was very little change in As with time. The other two systems had significant changes over a period of 0.5-2.5 hours. There is currently no general guidance on predicting which systems likely would show temporal variability in As. It may be necessary to determine the characteristics of every system affected by As.

8
Acknowledgments Kevin Rennels assisted with collecting water samples. Jon Talbott of the Waste Management and Research Center analyzed the samples for As. The authors thank Bob Roberts, Dave Swallow, Tom Difazzio, and Marv Eutis, the operators at the Ridgway, Kenney, Grand Ridge, and Waterman water treatment plants, and John McBride of ERH Enterprises, which operates the Kingman plant, for granting access to these facilities.
9
References Berg, M., H. C. Tran, T. C. Nguyen, H. V. Pham, R. Schertenleib and W. Giger. 2001. Arsenic
Contamination of Groundwater and Drinking Water in Vietnam: A Human Health Threat. Environmental Science & Technology 35(13): 2621-2626.
Cheng, Z., A. Van Geen, A. A. Seddique and K. M. Ahmed. 2005. Limited Temporal Variability of Arsenic Concentrations in 20 Wells Monitored for 3 Years in Araihazar, Bangladesh. Environmental Science & Technology 39(13): 4759-4766.
Clesceri, L. S., A. E. Greenberg and A. D. Eaton (1998). Standard Methods for the Examination of Water and Wastewater, 20th Ed. Washington, D.C.: A.P.H.A., A.W.W.A., W.E.F.
Erickson, M. L. and R. J. Barnes. 2006. Arsenic Concentration Variability in Public Water System Wells in Minnesota, USA. Applied Geochemistry 21(2): 305-317.
Frey, M. M., D. M. Owen, Z. K. Chowdhury, R. S. Raucher and M. A. Edwards. 1998. Cost to Utilities of a Lower MCL for Arsenic. Journal American Water Works Association 90(3): 89-102.
Gotkowitz, M. B., M. E. Schreiber, and J. A. Simo. 2004. Effects of Water Use on Arsenic Release to Well Water in a Confined Aquifer. Ground Water 42(4): 568-575.
Hinkle, S. R. and D. J. Polette. 1999. Arsenic in Ground Water of the Willamette Basin, Oregon. U. S. Geological Survey Water Resources Investigations 98-4205. Washington, D. C.
Holm, T. R., W. R. Kelly, S. D. Wilson, G. R. Roadcap, J. L. Talbott, and J. S. Scott. 2004. Arsenic Geochemistry and Distribution in the Mahomet Aquifer, Illinois. Waste Management and Research Center RR-107,Champaign, IL. (http://www.wmrc.uiuc.edu/main_sections/info_services/library_docs/RR/RR-107.pdf).
Kelly, W. R., T. R. Holm, S. D. Wilson and G. S. Roadcap. 2005. Arsenic in Glacial Aquifers: Sources and Geochemical Controls. Ground Water 43(4): 500-510.
McNeill, L. and M. Edwards. 1995. Soluble Arsenic Removal at Water Treatment Plants. Jour. AWWA 87(4): 105-113.
Steinmaus, C. M., Y. Yuan and A. H. Smith. 2005. The Temporal Stability of Arsenic Concentrations in Well Water in Western Nevada. Environmental Research 99(2): 164-168.
Wilson, S. D., Holm, T. R., Kelly, W. R. 2004. Arsenic Removal in Water Treatment Facilities: Survey of Geochemical Factors and Pilot Plant Experiments. Midwest Technology Assistance Center, Champaign, IL. (http://mtac.sws.uiuc.edu/mtacdocs/finalreports/ArsenicTreatmentMTACFinalReport.pdf).

10
0
10
20
30
40
50
0 50 100 150 200
Time (min.)
Ars
enic
( μg/
L)
UnfilteredFiltered
Figure 1. Arsenic concentrations in raw groundwater collected during an on-site treatment experiment, Danvers, Well 3.
11
0
20
40
60
80
100
120
140
160
Jan-73 Jan-75 Dec-76 Dec-78 Dec-80 Dec-82
Date
Ars
enic
( μg/
L)
Well 1Well 2Well 3
Figure 2. Historical arsenic concentrations in municipal wells, Ridgway, 1973-1982.

12
Figure 3. Locations of study communities.

13
0.0
10.0
20.0
30.0
40.0
50.0
60.0
70.0
80.0
90.0
0:00 1:00 2:00 3:00 4:00 5:00Elapsed Time (hr:min)
Ars
enic
(μ
g/L) Raw/Unfiltered
Raw/FilteredFinished/UnfilteredFinished/Filtered
Figure 4. Arsenic concentrations in raw groundwater and finished water from time-series test, Ridgway.
14
0.0
10.0
20.0
30.0
40.0
50.0
60.0
70.0
80.0
90.0
0:00 1:00 2:00 3:00 4:00 5:00Elapsed Time (hr:min)
Ars
enic
( μg/
L) Raw/UnfilteredRaw/FilteredFinished/UnfilteredFinished/Filtered
Pump off Pump on
Figure 5. Iron concentrations in raw groundwater from tine-series test, Ridgway.

15
0
10
20
30
40
50
0:00 1:00 2:00 3:00 4:00 5:00 6:00
Elapsed Time (hr:min)
Ars
enic
(ppb
)
Raw/UnfilteredRaw/FilteredFinished/UnfilteredFinished/Filtered
Tower full
Pump off
Pump on
Figure 6. Arsenic concentrations in raw groundwater and finished water from time-series test, Kenney.
16
0
10
20
30
40
50
60
70
80
Jan-74 Jan-76 Dec-77 Dec-79 Dec-81 Dec-83 Dec-85
Sample Date
Ars
enic
( μg/
L)
Figure 7. Historical arsenic concentrations in Kenney groundwater, 1974-1986.
17
0
10
20
30
40
50
0:00 1:00 2:00 3:00 4:00 5:00 6:00Elapsed Time (hr:min)
Ars
enic
( μg/
L)
UnfilteredFiltered
Pump off Pump on
Figure 8. Arsenic concentrations in raw groundwater from time-series test, Grand Ridge Well 3.
18
0
10
20
30
40
50
Jan-87 Dec-88 Dec-90 Dec-92 Dec-94 Dec-96 Dec-98 Dec-00
Sample Date
As
( μg/
L)
Well 2Well 3
Figure 9. Historical arsenic concentrations in Grand Ridge Wells 2 and 3, 1987-2000.
19
0
5
10
15
20
0:00 1:00 2:00 3:00 4:00 5:00 6:00
Time (hr:min)
As(μg
/L)
UnfilteredFiltered
Pump off Pump on
Figure 10. Arsenic concentrations in groundwater from time-series test, Waterman Well 2.
20
0
10
20
30
Jan-75 Jan-79 Jan-83 Jan-87 Jan-91
Sampling Date
Ars
enic
( μg/
L)
Well 2Well 3
Figure 11. Historical arsenic concentrations in Waterman Wells 2 and 3, 1975-1991.
21
0
10
20
30
40
50
60
70
80
0:00 1:00 2:00 3:00 4:00 5:00Elapsed Time (hr:min)
Ars
enic
(μ
g/L) Raw/Unfiltered
Raw/FilteredFinished/UnfilteredFinished/Filtered
Pump off Pump on
Figure 12. Arsenic concentrations in raw groundwater and finished water from time-series test, Kingman Well 2.