Embed Size (px)
Citation preview
Spatial variability and temporal trends in water-useefficiency of European forestsMATTH IAS SAURER 1 , RENATO SPAHNI 2 , 4 , DAV ID C . FRANK 3 , 4 , FORTUNAT JOOS 2 , 4 ,
MARKUS LEUENBERGER 2 , NE I L J . LOADER 5 , DANNY MCCARROLL 5 , MARY GAGEN5 ,
BEN POULTER 6 , ROLF T .W . S I EGWOLF 1 , LA IA ANDREU -HAYLES 7 , TAT JANA
BOETTGER 8 , I SABEL DORADO L I ~N�AN9 , 1 0 , I AN J . FA IRCH ILD 1 1 , M ICHAEL FR I EDR ICH1 2 ,
EM IL IA GUT IERREZ 9 , MAR IKA HAUPT 8 , EMMI H ILASVUOR I 1 3 , 1 4 , INGO HE INR ICH 1 5 ,
GERD HELLE 1 5 , H�AKAN GRUDD1 6 , R I S TO JALKANEN1 7 , TOM LEVANI �C1 8 , HANS W .
L INDERHOLM1 9 , IA IN ROBERTSON5 , ELON I SONNINEN 1 3 , KERST IN TREYDTE 3 , J OHN
S . WATERHOUSE 2 0 , EWAN J . WOODLEY 5 , 2 1 , P ETER M . WYNN2 2 and GILES H.F . YOUNG5
1Paul Scherrer Institut, Villigen, Switzerland, 2University of Bern, Bern, Switzerland, 3Swiss Federal Research Institute WSL,
Birmensdorf, Switzerland, 4Oeschger Centre for Climate Change Research, University of Bern, Bern, Switzerland, 5Department of
Geography, Swansea University, Swansea, UK, 6Laboratoire des Sciences du Climat et de L’Environment, Gif-sur Yvette, France,7Tree-Ring Laboratory, Lamont-Doherty Earth Observatory of Columbia University, Palisades, NY 10964, USA, 8Department of
Catchment Hydrology, Helmholtz Centre for Environmental Research–UFZ, Halle, Germany, 9Dept d’Ecologia, Facultat de
Biologia, Universitat de Barcelona, Barcelona, Spain, 10Chair of Ecoclimatology, Technische Universit€at M€unchen, Freising,
Germany, 11School of Geography, Earth & Environmental Sciences, University of Birmingham, Birmingham B15 2TT, UK,12Institute of Botany, Hohenheim University, Stuttgart, Germany, 13Laboratory of Chronology, Finnish Museum of Natural
History, University of Helsinki, P.O. Box 64, Helsinki 00014, Finland, 14Finnish Environment Institute, P.O. Box 140, Helsinki
00251, Finland, 15Climate Dynamics and Landscape Evolution, GFZ German Centre for GeoSciences, Potsdam 14473, Germany,16Bolin Centre for Climate Research, Department of Physical Geography and Quaternary Geology, Stockholm University,
Stockholm, Sweden, 17Northern Regional Unit, Finnish Forest Research Institute, Rovaniemi, Finland, 18Department of Yield and
Silviculture, Slovenian Forestry Institute, Ve�cna pot 2, Ljubljana 1000, Slovenia, 19University of Gothenburg, Gothenburg,
Sweden, 20Department of Life Sciences, Anglia Ruskin University, East Road, Cambridge CB1 1PT, UK, 21Department of
Geography, College of Life and Environmental Sciences, University of Exeter, Rennes Drive, Exeter EX4 4RJ, UK, 22Lancaster
Environment Centre, University of Lancaster, LA1 4YQ, UK
Abstract
The increasing carbon dioxide (CO2) concentration in the atmosphere in combination with climatic changes throughout the last
century are likely to have had a profound effect on the physiology of trees: altering the carbon andwater fluxes passing through
the stomatal pores. However, the magnitude and spatial patterns of such changes in natural forests remain highly uncertain.
Here, stable carbon isotope ratios from a network of 35 tree-ring sites located across Europe are investigated to determine the
intrinsic water-use efficiency (iWUE), the ratio of photosynthesis to stomatal conductance from 1901 to 2000. The results were
compared with simulations of a dynamic vegetation model (LPX-Bern 1.0) that integrates numerous ecosystem and land–atmosphere exchange processes in a theoretical framework. The spatial pattern of tree-ring derived iWUE of the investigated
coniferous anddeciduous species and themodel results agreed significantlywith a clear south-to-northgradient, aswell as agen-
eral increase in iWUE over the 20th century. The magnitude of the iWUE increase was not spatially uniform, with the strongest
increase observed and modelled for temperate forests in Central Europe, a region where summer soil-water availability
decreased over the last century. We were able to demonstrate that the combined effects of increasing CO2 and climate change
leading to soil drying have resulted in an accelerated increase in iWUE. These findings will help to reduce uncertainties in the
land surface schemes of global climate models, where vegetation–climate feedbacks are currently still poorly constrained by
observational data.
Keywords: carbon isotope discrimination, climate change, dynamic vegetation model, tree rings
Received 19 February 2014; revised version received 11 June 2014 and accepted 28 June 2014
Introduction
Interactions among direct CO2 (fertilization) effects on
plants and climatic conditions such as drought are of
particular interest for understanding past and for pre-
dicting future forest growth and carbon sequestration.
The continually increasing atmospheric CO2 concentra-
tion and concurrent climatic change are both likely to
strongly affect the physiology of forests ecosystems andCorrespondence: Matthias Saurer, tel. 0041 563102749,
fax 0041 563104525, e-mail: [email protected]
1© 2014 John Wiley & Sons Ltd
Global Change Biology (2014), doi: 10.1111/gcb.12717
Global Change Biology
alter productivity, species distribution and vegetation–climate feedbacks. Yet, both the magnitude and mecha-
nisms of forest response are unclear and furthermore
are expected to be spatially very heterogeneous,
depending at least upon both the local growth limita-
tions (Babst et al., 2013) and the trajectory of future
climate (IPCC, 2013). For many regions, ecosystem tran-
sitions are already underway (Parmesan & Yohe, 2003;
Allen et al., 2010). The effects of climate change and
increasing CO2 concentrations could stimulate tree
growth in some regions via enhanced photosynthesis
through CO2 fertilization (Ainsworth & Long, 2005).
However, adverse effects from an increase in drought
severity, for example, could result in reduced growth
and increased stress and mortality (Zhao & Running,
2010). Such changes will inevitably also modify bio-
spheric CO2 and water fluxes and the relationships
between them (Schimel et al., 2001; Keenan et al., 2013).
The slow adaption of late-successional forests, how-
ever, is difficult to assess either by observations or by
experiments. Therefore, it is not well known how the
physiology of natural forests has already changed due
to the increase in atmospheric CO2 concentration in the
ca. 150 years since major global industrialisation.
Increases in net ecosystem productivity inferred from
small-scale CO2 fumigation or depletion experiments
may overestimate the CO2-response in natural forests
(Norby et al., 2010). Down-regulation of photosynthesis
under elevated CO2 was observed and also the reduc-
tion in transpiration was found to be relatively small in
a mature mixed deciduous forest (Leuzinger & K€orner,
2007). Accurate quantification of changes in water and
CO2 fluxes over the last century, which are spatially
highly variable, would be important because of their
relationship with the carbon sequestration potential of
the forests (Schimel et al., 2001; Pan et al., 2011), and
evaporation–temperature feedbacks, i.e. possibly addi-
tional or reduced warming due to changes in evapo-
transpiration (Betts et al., 1997).
Stable carbon isotope ratios (d13C) of tree rings repre-
sent a valuable tool to improve understanding of forest
response to the combined influence of climate and CO2
over time (McCarroll & Loader, 2004). d13C in plant
organic matter is related to the ratio of net photosynthe-
sis (A) to stomatal conductance to water (g), which is the
intrinsic water-use efficiency (iWUE = A/g), and there-
fore provides a measure for the relative water loss per
molecule carbon acquired at the leaf level (Farquhar
et al., 1982). Plant water-use efficiency (WUE) defined as
the ratio of carbon uptake to actual water loss at the plant
level is an essential element of the survival and produc-
tivity of plants. ActualWUE depends on the evaporative
demand, as transpiration is determined by the product
of stomatal conductance and vapour pressure deficit,
while iWUE may be considered as a potential WUE and
does not consider this variable environmental constraint
and respiratory losses (Seibt et al., 2008). This limitation
of the isotope approach may be overcome by using plant
physiological models to assist data interpretation. For
assessments that strive to consider both spatial and
temporal variability in plant-climatic-CO2 interactions,
a dynamic vegetation model such as the Lund–Potsdam–Jena (LPJ) model that combines process-based
vegetation dynamics with land–atmosphere carbon and
water exchange is particularly useful (Sitch et al., 2003).
Such models have been widely applied to study the
influence of increasing CO2 on net primary productivity
changes (Hickler et al., 2008). Few studies have dis-
cussed possible changes in WUE under variable climate
and CO2 concentrations, and those that do generally find
increasing WUE over time (Tian et al., 2010; De Kauwe
et al., 2013); however, no long-term verification of model
results with carbon isotope data of tree rings has been
carried out. The uncertainty of this forest–climate feed-
back is therefore very high.
Previous tree-ring carbon isotope studies have identi-
fied an increase in iWUE over the 20th century at most
forest sites so far investigated across the globe, including
sites from the tropics (Hietz et al., 2005; Loader et al.,
2011), northern high- and midlatitudes (Saurer et al.,
2004; Waterhouse et al., 2004; Gagen et al., 2011) and the
Mediterranean basin (Linares et al., 2009; Andreu-
Hayles et al., 2011), but to varying degrees. Some studies
indicated a passive response of the plants to increasing
atmospheric CO2 concentration (ca), where the intercel-
lular CO2 concentration (ci) increased by the same
amount as ca (implying ca � ci = constant), which
resulted in no iWUE improvement (Marshall & Monse-
rud, 1996). However, more commonly an active
response was observed, where ci increased more slowly
than ca due to plant adaptation, resulting in higher
iWUE (Feng, 1998). Several studies have reported that
the response to increasing CO2 concentrations changed
from being active (ci/ca constant) to passive (ca � ci con-
stant) around the 1970s (Waterhouse et al., 2004; Gagen
et al., 2011) with an approximate levelling of iWUE, or
even a decrease in polluted areas (Boettger et al., 2014).
No clear spatial pattern of the iWUE increase has
emerged from the published literature, partly due to the
unsystematic and still sparse nature of the data collec-
tion.
In this investigation, we employ a network of tree-ring
sites across Europe to study the spatial and temporal pat-
terns in the carbon towater-use relationships. Thirty-five
old-growth forest sites are investigated that cover a large
climatic gradient from Mediterranean Southern Europe
to the tree line Northern Fennoscandia, including both
coniferous and deciduous species from five genera
© 2014 John Wiley & Sons Ltd, Global Change Biology, doi: 10.1111/gcb.12717
2 M. SAURER et al.
(Abies, Larix, Pinus, Picea, Quercus). The d13C-derivedchanges in iWUE over the 20th century are investigated
as a function of the climate change at each location (tem-
perature, precipitation, soil-water content). The empiri-
cal data are compared to iWUE derived from a dynamic
vegetation model, enabling a detailed assessment of
functional relationships between physiology and climate
for the entire European domain.
Materials and methods
Sampling and isotope analysis
A network of 35 tree-ring sites across Europe was estab-
lished within the two EU-funded projects ISONET (20 sites;
Treydte et al., 2007) and Millennium (15 additional sites,
Table 1). The sampling design considered temperate sites,
where tree growth is governed by a mixture of environmen-
tal factors, as well as ecologically extreme sites near the tree
line, where a single climatic factor dominates tree growth
(Treydte et al., 2007) (Table S1). The altitude range of study
sites is from 5 to 2200 m, with the majority situated in two
elevation bands: 0–500 m and 1500–2200 m. High-altitude
sites are concentrated towards the south of the study region.
We focused on oak as an important deciduous species
together with various coniferous species, selecting the most
abundant and long-lived trees at each location. At least four
trees were sampled at all sites (usually 2 cores per tree), suf-
ficient to develop an isotope site record representative of the
population (Leavitt & Long, 1984). In general, whole rings
(early- and latewood) were analysed for the conifers,
whereas for oaks, latewood was separated from earlywood
because a significant proportion of the carbon incorporated
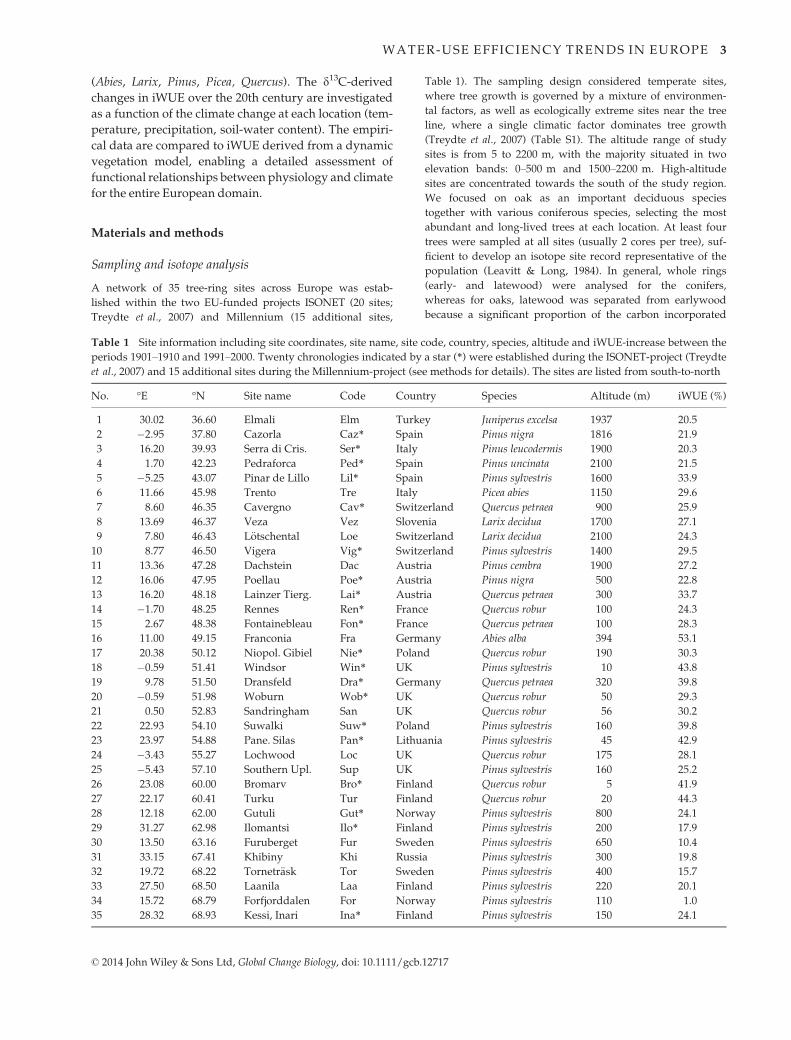
Table 1 Site information including site coordinates, site name, site code, country, species, altitude and iWUE-increase between the
periods 1901–1910 and 1991–2000. Twenty chronologies indicated by a star (*) were established during the ISONET-project (Treydte
et al., 2007) and 15 additional sites during the Millennium-project (see methods for details). The sites are listed from south-to-north
No. °E °N Site name Code Country Species Altitude (m) iWUE (%)
1 30.02 36.60 Elmali Elm Turkey Juniperus excelsa 1937 20.5
2 �2.95 37.80 Cazorla Caz* Spain Pinus nigra 1816 21.9
3 16.20 39.93 Serra di Cris. Ser* Italy Pinus leucodermis 1900 20.3
4 1.70 42.23 Pedraforca Ped* Spain Pinus uncinata 2100 21.5
5 �5.25 43.07 Pinar de Lillo Lil* Spain Pinus sylvestris 1600 33.9
6 11.66 45.98 Trento Tre Italy Picea abies 1150 29.6
7 8.60 46.35 Cavergno Cav* Switzerland Quercus petraea 900 25.9
8 13.69 46.37 Veza Vez Slovenia Larix decidua 1700 27.1
9 7.80 46.43 L€otschental Loe Switzerland Larix decidua 2100 24.3
10 8.77 46.50 Vigera Vig* Switzerland Pinus sylvestris 1400 29.5
11 13.36 47.28 Dachstein Dac Austria Pinus cembra 1900 27.2
12 16.06 47.95 Poellau Poe* Austria Pinus nigra 500 22.8
13 16.20 48.18 Lainzer Tierg. Lai* Austria Quercus petraea 300 33.7
14 �1.70 48.25 Rennes Ren* France Quercus robur 100 24.3
15 2.67 48.38 Fontainebleau Fon* France Quercus petraea 100 28.3
16 11.00 49.15 Franconia Fra Germany Abies alba 394 53.1
17 20.38 50.12 Niopol. Gibiel Nie* Poland Quercus robur 190 30.3
18 �0.59 51.41 Windsor Win* UK Pinus sylvestris 10 43.8
19 9.78 51.50 Dransfeld Dra* Germany Quercus petraea 320 39.8
20 �0.59 51.98 Woburn Wob* UK Quercus robur 50 29.3
21 0.50 52.83 Sandringham San UK Quercus robur 56 30.2
22 22.93 54.10 Suwalki Suw* Poland Pinus sylvestris 160 39.8
23 23.97 54.88 Pane. Silas Pan* Lithuania Pinus sylvestris 45 42.9
24 �3.43 55.27 Lochwood Loc UK Quercus robur 175 28.1
25 �5.43 57.10 Southern Upl. Sup UK Pinus sylvestris 160 25.2
26 23.08 60.00 Bromarv Bro* Finland Quercus robur 5 41.9
27 22.17 60.41 Turku Tur Finland Quercus robur 20 44.3
28 12.18 62.00 Gutuli Gut* Norway Pinus sylvestris 800 24.1
29 31.27 62.98 Ilomantsi Ilo* Finland Pinus sylvestris 200 17.9
30 13.50 63.16 Furuberget Fur Sweden Pinus sylvestris 650 10.4
31 33.15 67.41 Khibiny Khi Russia Pinus sylvestris 300 19.8
32 19.72 68.22 Tornetr€ask Tor Sweden Pinus sylvestris 400 15.7
33 27.50 68.50 Laanila Laa Finland Pinus sylvestris 220 20.1
34 15.72 68.79 Forfjorddalen For Norway Pinus sylvestris 110 1.0
35 28.32 68.93 Kessi, Inari Ina* Finland Pinus sylvestris 150 24.1
© 2014 John Wiley & Sons Ltd, Global Change Biology, doi: 10.1111/gcb.12717
WATER-USE EFFICIENCY TRENDS IN EUROPE 3
in the earlywood is carried over in deciduous species from
carbohydrate reserves established in the previous year (Tre-
ydte et al., 2007). Tree-ring samples were cross-dated to
ensure the correct calendar year was assigned to each annual
ring, and then individual rings separated with a razor-blade
under a microscope. At some sites, tree rings from the same
year were pooled prior to cellulose extraction, while at oth-
ers individual trees were measured, but all analysis here is
based on average site chronologies. Cellulose was extracted
using standard techniques (Boettger et al., 2007). Carbon iso-
tope analysis was conducted on CO2 obtained from combus-
tion of the samples in an elemental-analyser and
measurement in an isotope-ratio mass-spectrometer (McCar-
roll & Loader, 2004). Isotope values are given as d-valuescalculated from the isotope ratios 13C/12C (=R) as
d13C = (Rsample/Rstandard � 1) * 1000& (referring to the inter-
national standard VPDB), and have a long-term estimated
methodological error of <0.2& (Boettger et al., 2007). Most
analyses were performed on the common period from AD
1901 to AD 2000, although some records extend up to 2006.
Data analysis
The isotope discrimination Δ between plant material (d13Cplant)
and atmospheric CO2 (d13Catm) is defined as Δ = (d13Catm �d13Cplant)/(1 + d13Cplant/1000). According to Farquhar et al.
(1982), Δ can be related to plant physiological properties
approximately via the linear relationship Δ = a + (b � a) ci/ca,
where a is the fractionation associated with the diffusion of CO2
through the stomata (a = 4.4&) and b is the fractionation result-
ing from enzymatic C fixation (b = 27&). For the calculation of
Δ for tree rings, d13C-values of the atmosphere (d13Catm)
through time need to be estimated from ice-core data and recent
atmospheric measurements (Leuenberger, 2007). In addition,
we corrected for the isotope offset between cellulose and total
organic matter (d13Cplant-corrected = d13Cplant cellulose �offset) because the leaf-level model for fractionation by Farqu-
har et al. (1982) is more representative for the bulkmatter rather
than a specific chemical compound such as cellulose. We used
as offset the difference between cellulose and wood, which is
1.1 � 0.2& for oak (Borella et al., 1998; Loader et al., 2003) and
1.3 � 0.2& for conifers (Saurer et al., 1997). This offset does, as
a first approximation, consider different postphotosynthetic
fractionations, including respiration, synthesis of secondary
sugars, and fractionations during phloem loading and unload-
ing (Seibt et al., 2008; Gessler et al., 2009). Based on the defini-
tion of the intrinsic water-use efficiency iWUE, the ratio of net
photosynthesis A = gCO2(ca � ci) to conductance for water
vapour gH2O, we obtain iWUE = A/gH2O = gCO2
(ca � ci)/gH2O = (ca � ci)/1.6, which can be calculated using cifrom above (Ehleringer & Cerling, 1995). Accordingly, the final
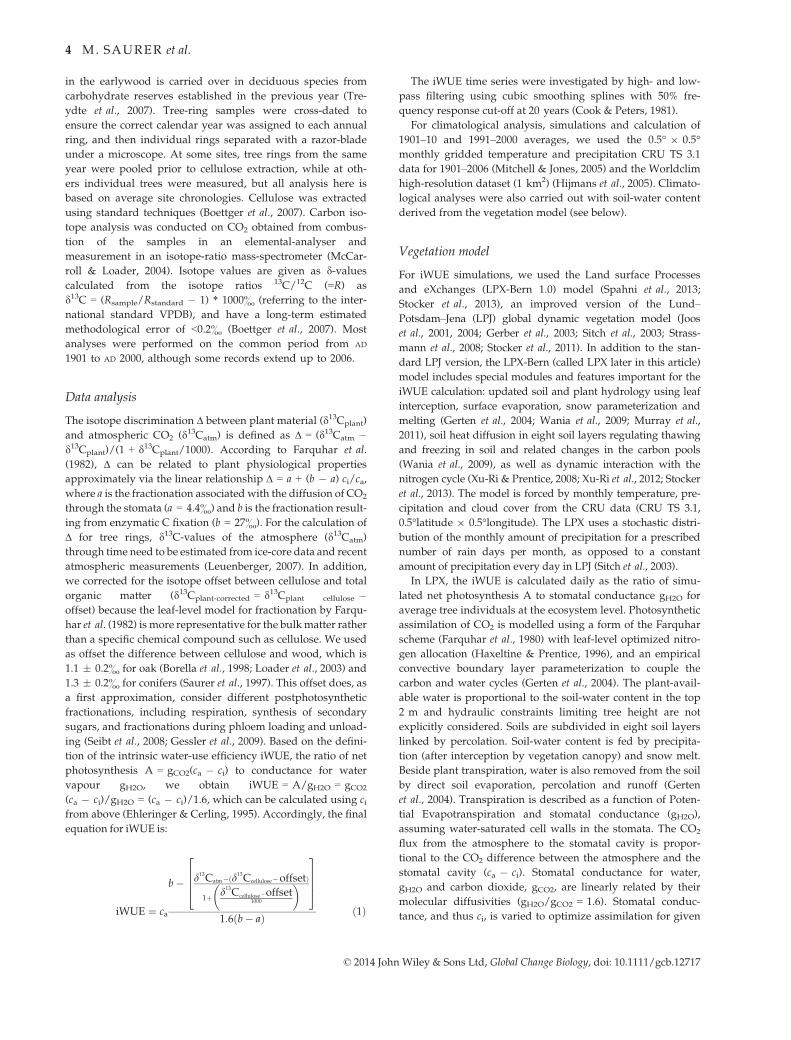
equation for iWUE is:
iWUE ¼ ca
b� d13Catm�ðd13
Ccellulose�offsetÞ
1þ d13Ccellulose�offset
1000
� �2664
3775
1:6ðb� aÞ ð1Þ
The iWUE time series were investigated by high- and low-
pass filtering using cubic smoothing splines with 50% fre-
quency response cut-off at 20 years (Cook & Peters, 1981).
For climatological analysis, simulations and calculation of
1901–10 and 1991–2000 averages, we used the 0.5° 9 0.5°monthly gridded temperature and precipitation CRU TS 3.1
data for 1901–2006 (Mitchell & Jones, 2005) and the Worldclim
high-resolution dataset (1 km2) (Hijmans et al., 2005). Climato-
logical analyses were also carried out with soil-water content
derived from the vegetation model (see below).
Vegetation model
For iWUE simulations, we used the Land surface Processes
and eXchanges (LPX-Bern 1.0) model (Spahni et al., 2013;
Stocker et al., 2013), an improved version of the Lund–
Potsdam–Jena (LPJ) global dynamic vegetation model (Joos
et al., 2001, 2004; Gerber et al., 2003; Sitch et al., 2003; Strass-
mann et al., 2008; Stocker et al., 2011). In addition to the stan-
dard LPJ version, the LPX-Bern (called LPX later in this article)
model includes special modules and features important for the
iWUE calculation: updated soil and plant hydrology using leaf
interception, surface evaporation, snow parameterization and
melting (Gerten et al., 2004; Wania et al., 2009; Murray et al.,
2011), soil heat diffusion in eight soil layers regulating thawing
and freezing in soil and related changes in the carbon pools
(Wania et al., 2009), as well as dynamic interaction with the
nitrogen cycle (Xu-Ri & Prentice, 2008; Xu-Ri et al., 2012; Stocker
et al., 2013). The model is forced by monthly temperature, pre-
cipitation and cloud cover from the CRU data (CRU TS 3.1,
0.5°latitude 9 0.5°longitude). The LPX uses a stochastic distri-
bution of the monthly amount of precipitation for a prescribed
number of rain days per month, as opposed to a constant
amount of precipitation every day in LPJ (Sitch et al., 2003).
In LPX, the iWUE is calculated daily as the ratio of simu-
lated net photosynthesis A to stomatal conductance gH2O for
average tree individuals at the ecosystem level. Photosynthetic
assimilation of CO2 is modelled using a form of the Farquhar
scheme (Farquhar et al., 1980) with leaf-level optimized nitro-
gen allocation (Haxeltine & Prentice, 1996), and an empirical
convective boundary layer parameterization to couple the
carbon and water cycles (Gerten et al., 2004). The plant-avail-
able water is proportional to the soil-water content in the top
2 m and hydraulic constraints limiting tree height are not
explicitly considered. Soils are subdivided in eight soil layers
linked by percolation. Soil-water content is fed by precipita-
tion (after interception by vegetation canopy) and snow melt.
Beside plant transpiration, water is also removed from the soil
by direct soil evaporation, percolation and runoff (Gerten
et al., 2004). Transpiration is described as a function of Poten-
tial Evapotranspiration and stomatal conductance (gH2O),
assuming water-saturated cell walls in the stomata. The CO2
flux from the atmosphere to the stomatal cavity is propor-
tional to the CO2 difference between the atmosphere and the
stomatal cavity (ca � ci). Stomatal conductance for water,
gH2O and carbon dioxide, gCO2, are linearly related by their
molecular diffusivities (gH2O/gCO2 = 1.6). Stomatal conduc-
tance, and thus ci, is varied to optimize assimilation for given
© 2014 John Wiley & Sons Ltd, Global Change Biology, doi: 10.1111/gcb.12717
4 M. SAURER et al.
environmental conditions, namely irradiance, temperature,
water supply from soils and CO2 concentration. This optimi-
zation is performed with the constraints that the CO2 assimila-
tion equals the CO2 flux from the atmosphere into the
stomatal cavity and that transpiration does not exceed water
supply. In summary, assimilation, canopy conductance and
iWUE simulated by LPX depend in a nonlinear and complex
way on environmental conditions.
The plant functional types used in simulations of iWUE
were ‘temperate and boreal needle evergreen’, ‘temperate
broadleaf summergreen’ and ‘boreal needle summergreen’
in LPX, from here on referred to as conifers, oak and larch,
respectively. Simulations were performed using dynamic
fractional plant cover with competing plant functional types.
The iWUE average was weighted by the fractional tree
cover (per year and grid cell) and its net primary productiv-
ity (per month and m2). For the site-by-site evaluation, the
tree-ring based iWUE was compared to the modelled grid
cell average iWUE at the tree site. If the model did not sim-
ulate the growth of the expected tree type, the fractional
tree cover-weighted average of the eight neighbouring grid
cells was used instead. The model results were further tested
in sensitivity runs using constant atmospheric CO2, interactive
nitrogen cycle [which used the deposition map by Lamarque
et al. (2011)], prescribed vegetation type, constant climate or
were forced with a high-resolution climate data set interpolated
to the tree site with corrected altitude. In simulations with an
interactive N cycle, there is no immediate feedback of e.g. a
change in leaf N to iWUE on a daily time scale, but there is a
long-term feedback by annual changes in vegetation structure
and thus photosynthesis and C assimilation.
Results
Temporal trends
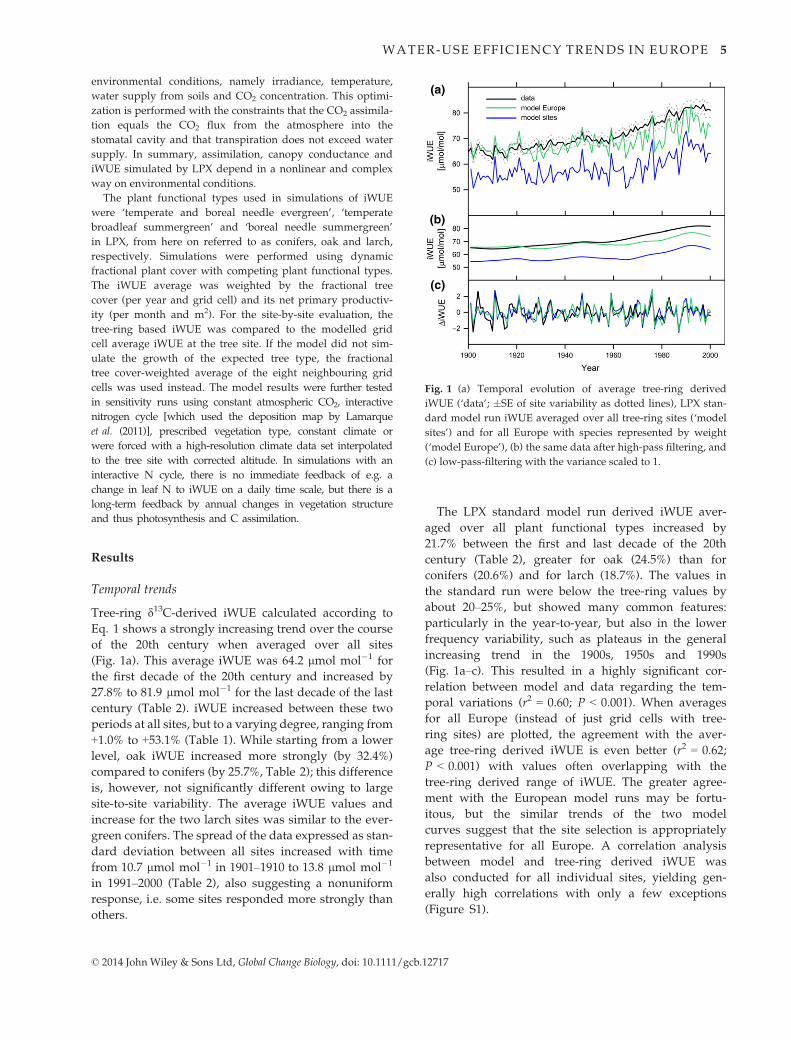
Tree-ring d13C-derived iWUE calculated according to
Eq. 1 shows a strongly increasing trend over the course
of the 20th century when averaged over all sites
(Fig. 1a). This average iWUE was 64.2 lmol mol�1 for
the first decade of the 20th century and increased by
27.8% to 81.9 lmol mol�1 for the last decade of the last
century (Table 2). iWUE increased between these two
periods at all sites, but to a varying degree, ranging from
+1.0% to +53.1% (Table 1). While starting from a lower
level, oak iWUE increased more strongly (by 32.4%)
compared to conifers (by 25.7%, Table 2); this difference
is, however, not significantly different owing to large
site-to-site variability. The average iWUE values and
increase for the two larch sites was similar to the ever-
green conifers. The spread of the data expressed as stan-
dard deviation between all sites increased with time
from 10.7 lmol mol�1 in 1901–1910 to 13.8 lmol mol�1
in 1991–2000 (Table 2), also suggesting a nonuniform
response, i.e. some sites responded more strongly than
others.
The LPX standard model run derived iWUE aver-
aged over all plant functional types increased by
21.7% between the first and last decade of the 20th
century (Table 2), greater for oak (24.5%) than for
conifers (20.6%) and for larch (18.7%). The values in
the standard run were below the tree-ring values by
about 20–25%, but showed many common features:
particularly in the year-to-year, but also in the lower
frequency variability, such as plateaus in the general
increasing trend in the 1900s, 1950s and 1990s
(Fig. 1a–c). This resulted in a highly significant cor-
relation between model and data regarding the tem-
poral variations (r2 = 0.60; P < 0.001). When averages
for all Europe (instead of just grid cells with tree-
ring sites) are plotted, the agreement with the aver-
age tree-ring derived iWUE is even better (r2 = 0.62;
P < 0.001) with values often overlapping with the
tree-ring derived range of iWUE. The greater agree-
ment with the European model runs may be fortu-
itous, but the similar trends of the two model
curves suggest that the site selection is appropriately
representative for all Europe. A correlation analysis
between model and tree-ring derived iWUE was
also conducted for all individual sites, yielding gen-
erally high correlations with only a few exceptions
(Figure S1).
(a)
(b)
(c)
Fig. 1 (a) Temporal evolution of average tree-ring derived
iWUE (‘data’; �SE of site variability as dotted lines), LPX stan-
dard model run iWUE averaged over all tree-ring sites (‘model
sites’) and for all Europe with species represented by weight
(‘model Europe’), (b) the same data after high-pass filtering, and
(c) low-pass-filtering with the variance scaled to 1.
© 2014 John Wiley & Sons Ltd, Global Change Biology, doi: 10.1111/gcb.12717
WATER-USE EFFICIENCY TRENDS IN EUROPE 5
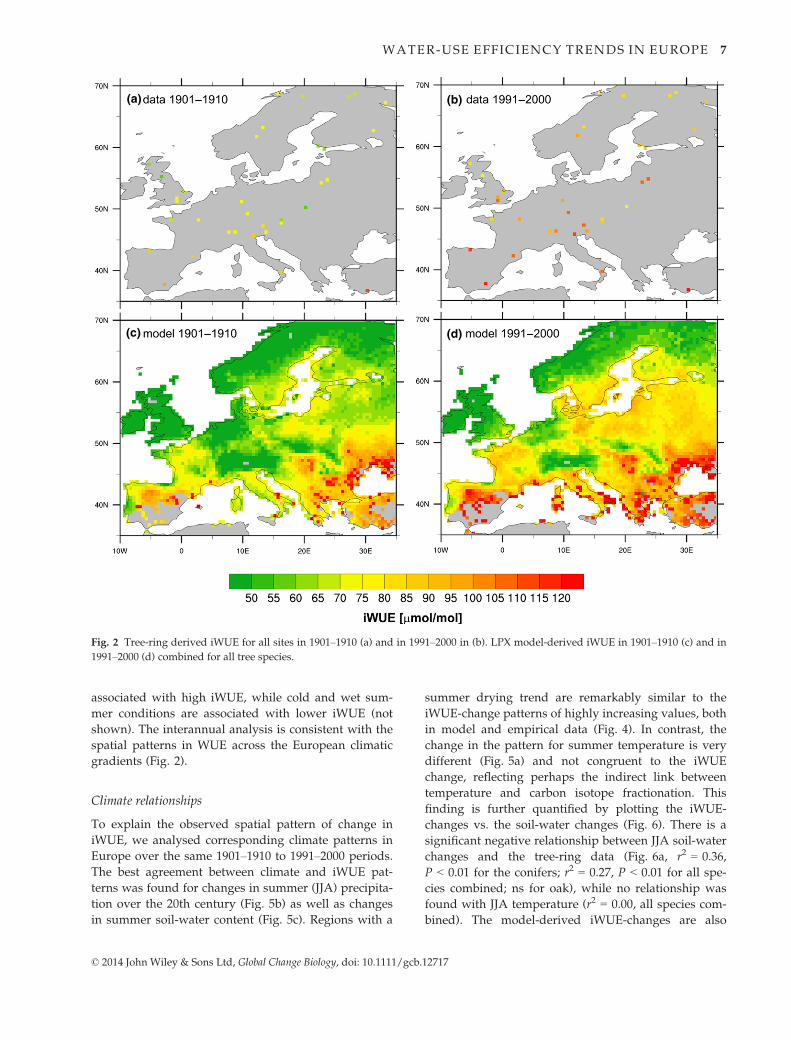
Spatial patterns
Averages for the first and the last decade of the 20th
century were also used to analyse the spatial iWUE
patterns and their changes. Tree-ring derived iWUE
shows a latitudinal gradient with increasing values
from the North to the South for both decades, with the
highest values observed in Turkey and southern Spain
(Fig. 2a and b). This holds even though the results of
different species are displayed together in this plot.
The LPX model results (standard run without dynamic
nitrogen cycle), too, show the North–South gradient
and the general increase from 1901–1910 to 1991–2000(Fig. 2c and d). Although model values are shifted to
lower values as noted above, there is a qualitative
agreement in the spatial patterns of tree ring and
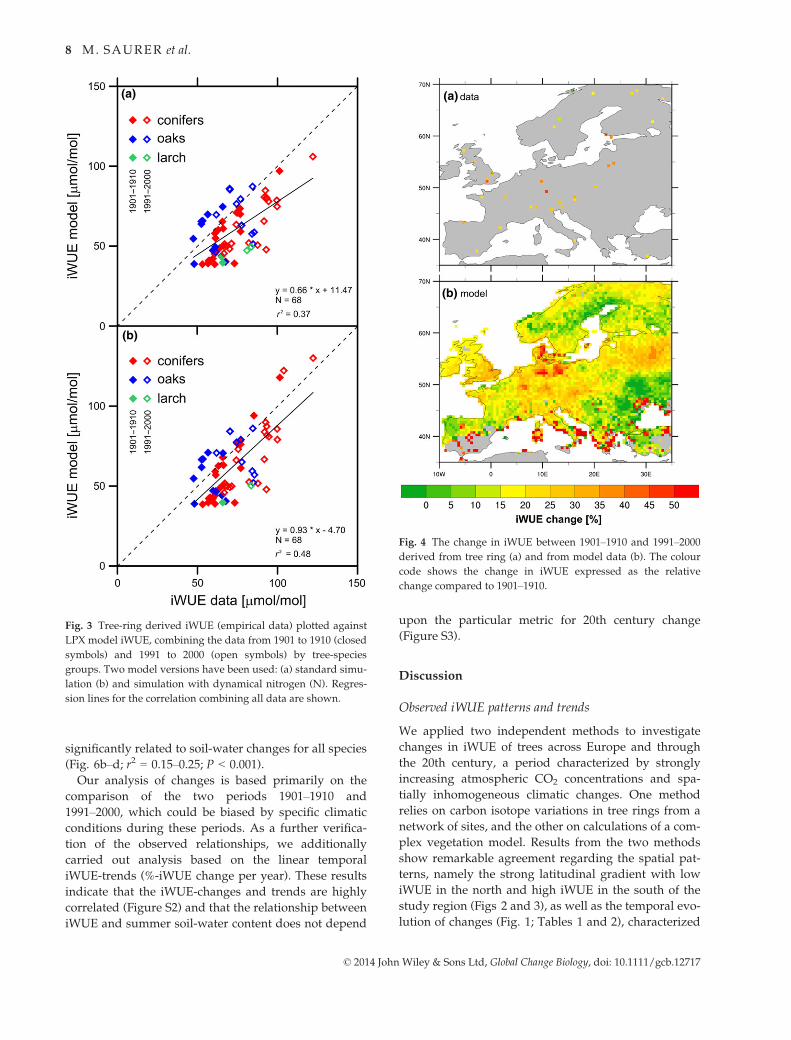
model data illustrated by these maps. The correlation
between independent model and tree-ring data sets
(Fig. 3a) is highly significant (1901–1910: r2 = 0.26; P <0.01; 1991–2000: r2 = 0.30; P < 0.001; combined: r2 =0.37, P < 0.001), which is mainly driven by a strong
relationship for the evergreen conifers (r2 = 0.67–0.69for individual and combined periods, P < 0.001), but
not for oak (r2 = 0.01–0.09).While iWUE increased at all sites, this increase, how-
ever, was not uniform (Table 1; Fig. 4). The tree-ring
data show relatively low increases for the southern and
northern sites, while the highest values are mostly
observed at sites with relatively temperate conditions
in Central Europe (Fig. 4a). The model also shows a
hotspot of increased iWUE in Central Europe, and
additionally in some Mediterranean subregions
(Fig. 4b).
Different simulations were run to test the sensitiv-
ity of the modelled iWUE results. For example a
simulation with dynamic N resulted in a better overall
agreement between model and data (Fig. 3b; r2 = 0.48,
P < 0.001). We further investigated whether observed
iWUE at the tree-ring sites was related to nitrogen
deposition based on the map by Lamarque et al.
(2011), which distinguishes between NOy, NHx and
total N (Ntot). Current Ntot deposition averaged for
1991–2000 was not related to the spatial pattern of
iWUE for the same period (r2 = 0.05). However, signif-
icant correlations were found for the increase in iWUE
to NOy, NHx and Ntot (r2 = 0.17, 0.18 and 0.19, respec-
tively; P < 0.01). Using the high-spatial resolution
climate data set rather than the 0.5° 9 0.5° CRU data
resulted only in marginal differences in iWUE results
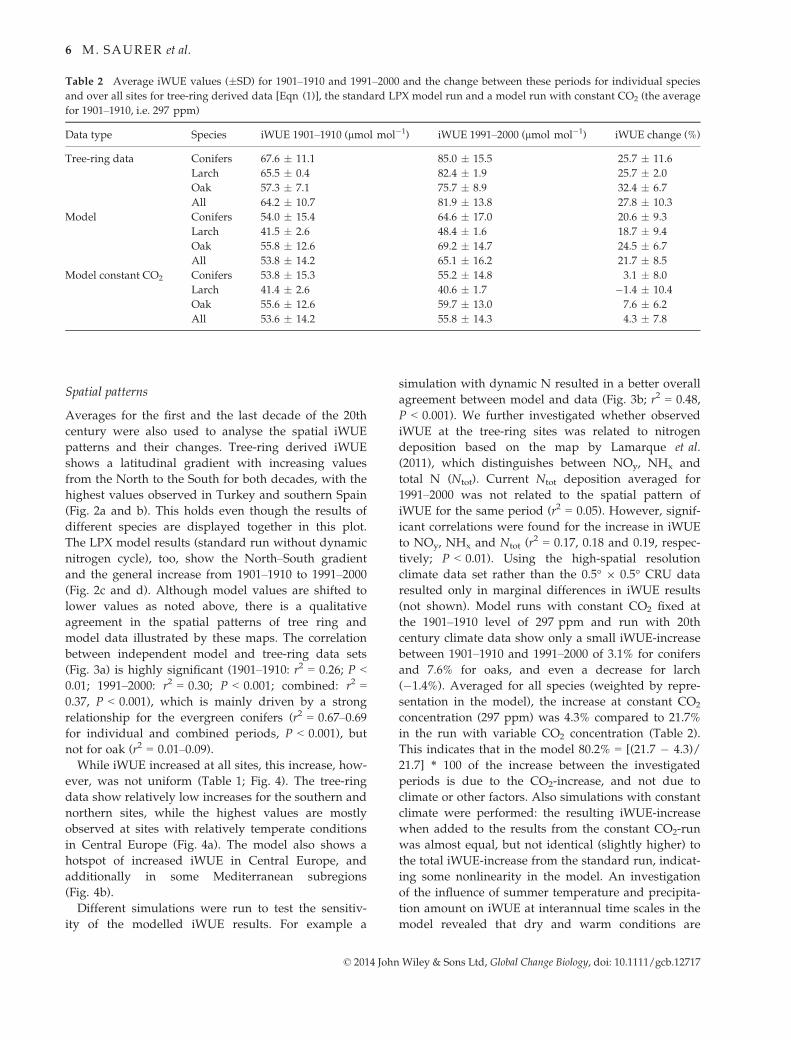
(not shown). Model runs with constant CO2 fixed at
the 1901–1910 level of 297 ppm and run with 20th
century climate data show only a small iWUE-increase
between 1901–1910 and 1991–2000 of 3.1% for conifers
and 7.6% for oaks, and even a decrease for larch
(�1.4%). Averaged for all species (weighted by repre-
sentation in the model), the increase at constant CO2
concentration (297 ppm) was 4.3% compared to 21.7%
in the run with variable CO2 concentration (Table 2).
This indicates that in the model 80.2% = [(21.7 � 4.3)/
21.7] * 100 of the increase between the investigated
periods is due to the CO2-increase, and not due to
climate or other factors. Also simulations with constant
climate were performed: the resulting iWUE-increase
when added to the results from the constant CO2-run
was almost equal, but not identical (slightly higher) to
the total iWUE-increase from the standard run, indicat-
ing some nonlinearity in the model. An investigation
of the influence of summer temperature and precipita-
tion amount on iWUE at interannual time scales in the
model revealed that dry and warm conditions are
Table 2 Average iWUE values (�SD) for 1901–1910 and 1991–2000 and the change between these periods for individual species
and over all sites for tree-ring derived data [Eqn (1)], the standard LPX model run and a model run with constant CO2 (the average
for 1901–1910, i.e. 297 ppm)
Data type Species iWUE 1901–1910 (lmol mol�1) iWUE 1991–2000 (lmol mol�1) iWUE change (%)
Tree-ring data Conifers 67.6 � 11.1 85.0 � 15.5 25.7 � 11.6
Larch 65.5 � 0.4 82.4 � 1.9 25.7 � 2.0
Oak 57.3 � 7.1 75.7 � 8.9 32.4 � 6.7
All 64.2 � 10.7 81.9 � 13.8 27.8 � 10.3
Model Conifers 54.0 � 15.4 64.6 � 17.0 20.6 � 9.3
Larch 41.5 � 2.6 48.4 � 1.6 18.7 � 9.4
Oak 55.8 � 12.6 69.2 � 14.7 24.5 � 6.7
All 53.8 � 14.2 65.1 � 16.2 21.7 � 8.5
Model constant CO2 Conifers 53.8 � 15.3 55.2 � 14.8 3.1 � 8.0
Larch 41.4 � 2.6 40.6 � 1.7 �1.4 � 10.4
Oak 55.6 � 12.6 59.7 � 13.0 7.6 � 6.2
All 53.6 � 14.2 55.8 � 14.3 4.3 � 7.8
© 2014 John Wiley & Sons Ltd, Global Change Biology, doi: 10.1111/gcb.12717
6 M. SAURER et al.
associated with high iWUE, while cold and wet sum-
mer conditions are associated with lower iWUE (not
shown). The interannual analysis is consistent with the
spatial patterns in WUE across the European climatic
gradients (Fig. 2).
Climate relationships
To explain the observed spatial pattern of change in
iWUE, we analysed corresponding climate patterns in
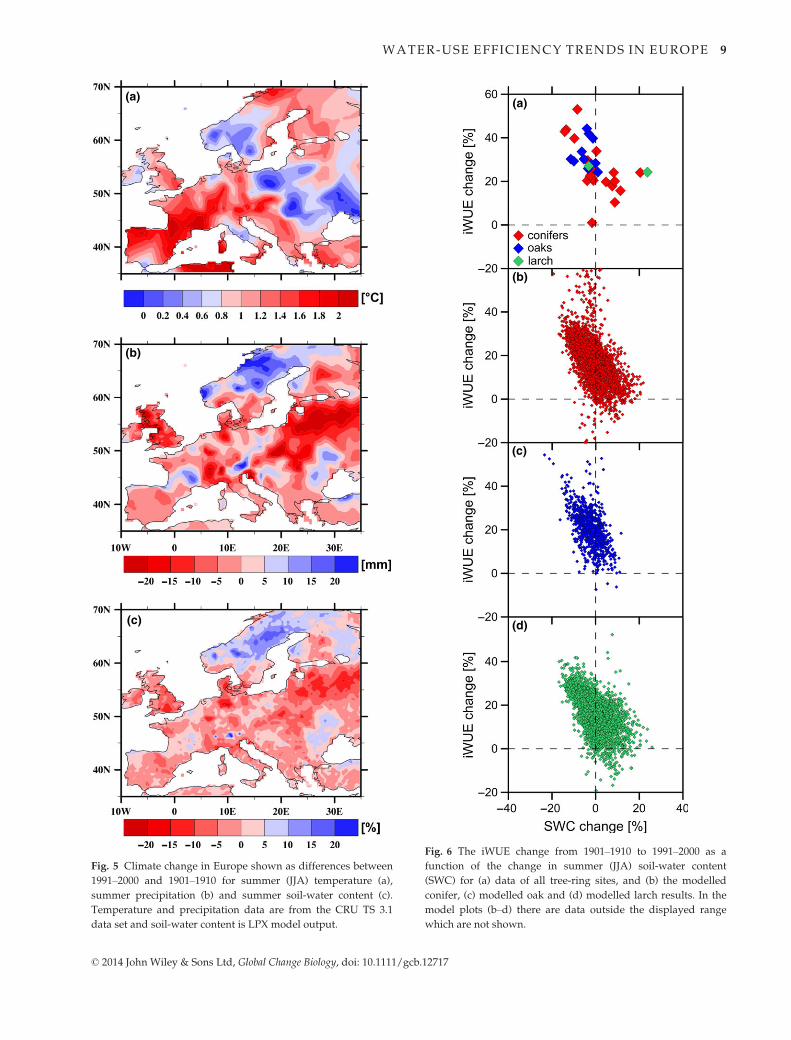
Europe over the same 1901–1910 to 1991–2000 periods.
The best agreement between climate and iWUE pat-
terns was found for changes in summer (JJA) precipita-
tion over the 20th century (Fig. 5b) as well as changes
in summer soil-water content (Fig. 5c). Regions with a
summer drying trend are remarkably similar to the
iWUE-change patterns of highly increasing values, both
in model and empirical data (Fig. 4). In contrast, the
change in the pattern for summer temperature is very
different (Fig. 5a) and not congruent to the iWUE
change, reflecting perhaps the indirect link between
temperature and carbon isotope fractionation. This
finding is further quantified by plotting the iWUE-
changes vs. the soil-water changes (Fig. 6). There is a
significant negative relationship between JJA soil-water
changes and the tree-ring data (Fig. 6a, r2 = 0.36,
P < 0.01 for the conifers; r2 = 0.27, P < 0.01 for all spe-
cies combined; ns for oak), while no relationship was
found with JJA temperature (r2 = 0.00, all species com-
bined). The model-derived iWUE-changes are also
(a) (b)
(c) (d)
Fig. 2 Tree-ring derived iWUE for all sites in 1901–1910 (a) and in 1991–2000 in (b). LPX model-derived iWUE in 1901–1910 (c) and in
1991–2000 (d) combined for all tree species.
© 2014 John Wiley & Sons Ltd, Global Change Biology, doi: 10.1111/gcb.12717
WATER-USE EFFICIENCY TRENDS IN EUROPE 7
significantly related to soil-water changes for all species
(Fig. 6b–d; r2 = 0.15–0.25; P < 0.001).
Our analysis of changes is based primarily on the
comparison of the two periods 1901–1910 and
1991–2000, which could be biased by specific climatic
conditions during these periods. As a further verifica-
tion of the observed relationships, we additionally
carried out analysis based on the linear temporal
iWUE-trends (%-iWUE change per year). These results
indicate that the iWUE-changes and trends are highly
correlated (Figure S2) and that the relationship between
iWUE and summer soil-water content does not depend
upon the particular metric for 20th century change
(Figure S3).
Discussion
Observed iWUE patterns and trends
We applied two independent methods to investigate
changes in iWUE of trees across Europe and through
the 20th century, a period characterized by strongly
increasing atmospheric CO2 concentrations and spa-
tially inhomogeneous climatic changes. One method
relies on carbon isotope variations in tree rings from a
network of sites, and the other on calculations of a com-
plex vegetation model. Results from the two methods
show remarkable agreement regarding the spatial pat-
terns, namely the strong latitudinal gradient with low
iWUE in the north and high iWUE in the south of the
study region (Figs 2 and 3), as well as the temporal evo-
lution of changes (Fig. 1; Tables 1 and 2), characterized
(a)
(b)
Fig. 3 Tree-ring derived iWUE (empirical data) plotted against
LPX model iWUE, combining the data from 1901 to 1910 (closed
symbols) and 1991 to 2000 (open symbols) by tree-species
groups. Two model versions have been used: (a) standard simu-
lation (b) and simulation with dynamical nitrogen (N). Regres-
sion lines for the correlation combining all data are shown.
(a)
(b)
Fig. 4 The change in iWUE between 1901–1910 and 1991–2000
derived from tree ring (a) and from model data (b). The colour
code shows the change in iWUE expressed as the relative
change compared to 1901–1910.
© 2014 John Wiley & Sons Ltd, Global Change Biology, doi: 10.1111/gcb.12717
8 M. SAURER et al.
(a)
(b)
(c)
Fig. 5 Climate change in Europe shown as differences between
1991–2000 and 1901–1910 for summer (JJA) temperature (a),
summer precipitation (b) and summer soil-water content (c).
Temperature and precipitation data are from the CRU TS 3.1
data set and soil-water content is LPX model output.
(a)
(b)
(c)
(d)
Fig. 6 The iWUE change from 1901–1910 to 1991–2000 as a
function of the change in summer (JJA) soil-water content
(SWC) for (a) data of all tree-ring sites, and (b) the modelled
conifer, (c) modelled oak and (d) modelled larch results. In the
model plots (b–d) there are data outside the displayed range
which are not shown.
© 2014 John Wiley & Sons Ltd, Global Change Biology, doi: 10.1111/gcb.12717
WATER-USE EFFICIENCY TRENDS IN EUROPE 9
by an increasing trend in iWUE at almost all places.
The general agreement between the two methods pro-
vides strong evidence for a wide-spread iWUE-increase
in European forests over the 20th century, and suggests
important changes in the biosphere–climate interac-
tions such as reduced transpiration for a given carbon
uptake.
The influence of climate and CO2
The stationary spatial iWUE pattern and the corre-
sponding latitudinal gradient is related to the summer
temperature and precipitation variability in the model,
showing higher iWUE for more water-stressed plants
(growing in more arid conditions), consistent with
studies of gas-exchange and concurrent isotope mea-
surements over climate gradients or seasonal variations
(e.g. Panek & Waring, 1997; Moore et al., 1999). It was
observed for different species that when water stress
resulted in stomatal closure, this was also reflected in
decreasing carbon isotope discrimination as expected
(Farquhar et al., 1982). However, surprisingly, we
found the strongest increase in iWUE over the 20th cen-
tury not at the most southern sites, but rather at more
temperate latitudes (Fig. 4). This phenomenon was sim-
ulated by the model as well as observed in the tree-ring
derived data. Analysing spatial variability in summer
climate trends revealed that this region is generally
characterized by a drying trend, reflected in decreasing
summer soil-water content (Figs 5 and 6). Our results
therefore suggest that the trees (mainly conifers) under-
went an accelerated increase in iWUE in this region, as
the sum of the effects of increasing CO2 and soil drying,
resulting in an effective reduction in stomatal conduc-
tance. A comparison of model simulations alternatively
using observed and fixed (pre-industrial) CO2 concen-
trations reveals significant differences in the magnitude
of iWUE response. The differences between these simu-
lations allow the relative importance of climatic vs. CO2
drivers to be attributed in the model results. Accord-
ingly, about 80% of the average iWUE increase in Euro-
pean forests is due to increased CO2 (Table 2, constant
CO2 run) and the remainder attributable to climatic
change.
Assumptions and uncertainties
The application of dynamic vegetation model under a
range of environmental conditions enables investiga-
tion of biosphere response to future environmental and
climatic change scenarios, as well as the possibility to
upscale these fluxes to larger spatial scales. Similarly,
tree-ring stable isotopes provide an absolutely dated,
replicable historical perspective on past carbon isotopic
fractionation that may be coupled within modelling
experiments to help evaluate and improve the model
performance and resolve the nature/significance of key
feedback mechanisms. But it is also important to stress
that both the LPX model and the tree-ring isotopic
approach to calculating iWUE rely on numerous
assumptions, and should be interpreted cautiously.
Regarding the isotope-derived iWUE, while Seibt et al.
(2008) have pointed out that iWUE and actual whole-
plant WUE do not necessarily need to be related, it was
recently confirmed that d13C in tree rings provides a
good measure of transpiration to assimilation even on a
seasonal scale (Michelot et al., 2011). Further, a large-
scale eddy-flux assessment showed indeed wide-spread
forest WUE increase at least for the last 10–15 years
(Keenan et al., 2013). The use of the LPX helps to
circumvent some of the limitations of the isotope
approach, because we do not need to draw conclusions
about actual fluxes, such as transpiration, directly from
our tree-ring derived iWUE. Modelled iWUE was on
average about 20% lower than the tree-ring derived
values and also the increase from the beginning to the
end of the 20th century was somewhat lower in the
model (Table 2). This suggests some uncertainties
remain in the process and magnitude of iWUE
responses both in the past and for the future. The
agreement between model and data can vary depend-
ing on model assumptions, e.g. variable vs. fixed vege-
tation, but also the values for the isotope offset used in
Eqn (1). We decided to use model settings from previ-
ous investigations (Spahni et al., 2013; Stocker et al.,
2013), i.e. standard parameters, and not to optimize for
best agreement between model and data, because this
would involve some circular reasoning in testing mod-
elled trends. Another implicit assumption of our study
is that age-related trends are not significant. When
trees grow in height, hydraulic resistance increases
and turgor declines. This causes partial stomatal clo-
sure with an increase in iWUE, resulting in a reduction
in height growth (Ryan & Yoder, 1997; Koch et al.,
2004). Accordingly, clear changes of isotope discrimi-
nation with tree height have been reported (McDowell
et al., 2011). However, measuring carbon isotopes in
stem wood sampled at breast height where an average
of carbon from the whole canopy is collected does not
seem to reflect this process. Evidence from several
studies has shown that trees generally do not show
any age-related d13C-trends after an initial juvenile
phase of ca. 50 years (Francey & Farquhar, 1982),
which can be particularly well seen for trees that were
living before the industrial CO2-concentration rise
(Gagen et al., 2007; Loader et al., 2013). Furthermore,
the vast majority of analyses were conducted on trees
that were long-lived (>250 years) additionally reducing
© 2014 John Wiley & Sons Ltd, Global Change Biology, doi: 10.1111/gcb.12717
10 M. SAURER et al.
the chances that the rapid juvenile increase in height
or trends in d13C ratios affect our 20th century analyses.
Physiological responses
The wide-spread iWUE increase was likely caused by a
reduction in stomatal conductance at the leaf level
(Gagen et al., 2011). The results from the LPX model
indeed suggest that the cause of the iWUE increase was
reduced stomatal conductance during recent decades
rather than increased assimilation (Figure S4). How-
ever, the overall changes in canopy transpiration over
the 20th century remain unclear. Other effects of the
CO2 fertilization like structural changes (such as
increased leaf area) may compensate for the physiologi-
cal response (reduced stomatal conductance) of plants
to CO2 (Betts et al., 1997). It is probably unlikely that
runoff increases of rivers have occurred as a result of
a reduced transpiration flux leading to wetter soils
(Huntington, 2008), in contrast to earlier findings
(Gedney et al., 2006). Tree responses in our study can
be compared with elevated CO2/climate experiments
with the caveat that such experimental studies have
most often been conducted on juvenile trees (Wullsch-
leger et al., 2002; Young et al., 2011) in CO2 concentra-
tion ranges from 380 ppm to 500 ppm or more over
short timescales. In contrast, our investigation was
performed on samples of old-growth trees from intact
ecosystems that have experienced CO2 increases from
280 to 380 ppm over the course of a century. It has been
observed in fumigation experiments that elevated CO2
resulted in reduced stomatal conductance and therefore
could ameliorate the negative effects of drought in
many species through increased WUE (Ellsworth,
1999). A number of studies have reported such an
increased plant–growth response to CO2 for trees grow-
ing under water-limiting conditions (Wullschleger
et al., 2002; McMurtrie et al., 2008). Direct evidence for
a sustained adaptation remains limited and it is likely
that the magnitude and rate of this response will
depend upon species as well as local site conditions
(Leuzinger & K€orner, 2007; Linares et al., 2009). A
meta-analysis across different biomes did not detect a
response in the radial growth, despite corresponding
evidence for a significant and widespread increase in
iWUE (Pe~nuelas et al., 2011).
Other factors than CO2 and water
We have considered that factors other than CO2 and
water could also be important for explaining the
observed iWUE patterns and trends. Nitrogen is such a
factor, representing one of the main nutrients for plant
growth and a limiting factor in many ecosystems (Sun
et al., 2010). The correlation between total N deposition
and the tree-ring derived iWUE-increase in our net-
work shows a significant relationship, and we can
therefore not rule out the possibility that nitrogen depo-
sition has partly contributed to the strong iWUE-
increase in Central Europe. Furthermore, our simula-
tions with dynamical N improved correlations to tree-
ring data (Fig. 3b). Other air pollutants, e.g. sulphur
dioxide or ozone, may also influence tree physiological
properties such as stomatal conductance and photosyn-
thesis (Fairchild et al., 2009; Rinne et al., 2010). It was
observed that long-term exposure of trees to back-
ground sulphur dioxide influenced carbon isotope sig-
natures and iWUE of Abies alba Mill remote from
industrial areas in western Germany (Boettger et al.,
2014). However, through pollution reduction measures
and legislation, the influence of nitrogen and especially
sulphur is expected to further decrease in the future rel-
ative to climate change and CO2 effect.
Large-scale implications
Our finding of strongly increasing iWUE in regions of
increasing summer drought is relevant in the context of
refining projections of future climate development and
carbon sequestration. It has been suggested that the dry-
ing trend in summer climate over Central and southern
Europe in recent decades is consistent with model-
derived changes in mean summer precipitation as well
as changes in the large-scale circulation, and that this
trend might continue into the future (Pal et al., 2004;
IPCC, 2013). Therefore, it is likely that trees in Central
Europe will be exposed to even stronger drought stress
in the future to which some species may be poorly
adapted. Accordingly, shifts in species distribution may
occur, as already observed e.g. in the Valais (Switzer-
land), where the current drought-induced decline of
Scots pine leads to a transition of these forests into
mixed oak–deciduous at lower elevations and spruce–fir forests at higher elevations (Bigler et al., 2006). Water
has been identified as a major issue in a high-CO2
world, with the question raised if the effect of elevated
CO2 on forest vegetation is ‘more a water issue than a
carbon issue’ (Holtum & Winter, 2010), emphasizing
the strong link between carbon and water cycles. Land–atmosphere interactions, soil moisture–precipitationand temperature feedbacks play a crucial role in deter-
mining future summer climate variability (Seneviratne
et al., 2006). Model and empirical studies clearly show
the importance of biosphere/carbon-cycle feedbacks
(Frank et al., 2010) and physiological forcing by CO2 for
predicting future climate (Cao et al., 2010). However,
the magnitudes of such feedbacks are still highly uncer-
tain and due to a lack of basic understanding of relevant
© 2014 John Wiley & Sons Ltd, Global Change Biology, doi: 10.1111/gcb.12717
WATER-USE EFFICIENCY TRENDS IN EUROPE 11
processes, terrestrial carbon models differ in their
response to climate change (Plattner et al., 2008; Frank
et al., 2010). Our study enables an assessment of a com-
plex vegetation model with empirical data, which may
ultimately lead to model improvements and better esti-
mations of vegetation–climate feedbacks.
Acknowledgements
This study was supported by the EC projects ISONET (EVK2-CT-2002-00147) and Millennium (FP6-2004-GLOBAL-017008-2)and by the Swiss National Science Foundation (SNFS) iTREE-project (CRSII3_136295). FJ acknowledges support by SNFS andNCCR Climate and by the European Commission through theFP7 projects Past4Future (grant no. 243908) and CARBO-CHANGE (grant 436 no. 264879). MS acknowledges SNFS-project 134864, NJL, IR C3W and NE/B501504, GH: ICLEA-Helmholtz Association, BMBF0315427B.
References
Ainsworth EA, Long SP (2005) What have we learned from 15 years of free-air CO2
enrichment (FACE)? A meta-analytic review of the responses of photosynthesis,
canopy. New Phytologist, 165, 351–371.
Allen CD, Macalady AK, Chenchouni H et al. (2010) A global overview of drought
and heat-induced tree mortality reveals emerging climate change risks for forests.
Forest Ecology and Management, 259, 660–684.
Andreu-Hayles L, Planells O, Gutierrez E, Muntan E, Helle G, Anchukaitis KJ, Schle-
ser GH (2011) Long tree-ring chronologies reveal 20th century increases in water-
use efficiency but no enhancement of tree growth at five Iberian pine forests.
Global Change Biology, 17, 2095–2112.
Babst F, Poulter B, Trouet V et al. (2013) Site- and species-specific responses of forest
growth to climate across the European continent. Global Ecology and Biogeography,
22, 706–717.
Betts RA, Cox PM, Lee SE, Woodward FI (1997) Contrasting physiological and struc-
tural vegetation feedbacks in climate change simulations. Nature, 387, 796–799.
Bigler C, Br€aker OU, Bugmann H, Dobbertin M, Rigling A (2006) Drought as an incit-
ing mortality factor in Scots pine stands of the Valais, Switzerland. Ecosystems, 9,
330–343.
Boettger T, Haupt M, Kn€oller K et al. (2007) Wood cellulose preparation methods and
mass spectrometric analyses of d13C, d18O, and nonexchangeable d2H values in cel-
lulose, sugar, and starch: an interlaboratory comparison. Analytical Chemistry, 79,
4603–4612.
Boettger T, Haupt M, Friedrich M, Waterhouse JS (2014) Reduced climate sensitivity
of carbon, oxygen and hydrogen stable isotope ratios in tree-ring cellulose of silver
fir (Abies alba Mill.) influenced by background SO2 in Franconia (Germany, Central
Europe). Environmental Pollution, 185, 281–294.
Borella S, Leuenberger M, Saurer M, Siegwolf R (1998) Reducing uncertainties in d13C
analysis of tree rings: pooling, milling, and cellulose extraction. Journal of Geophysi-
cal Research: Atmospheres, 103, 19519–19526.
Cao L, Bala G, Caldeira K, Nemani R, Ban-Weiss G (2010) Importance of carbon diox-
ide physiological forcing to future climate change. Proceedings of the National Acad-
emy of Sciences of the United States of America, 107, 9513–9518.
Cook ER, Peters K (1981) The smoothing spline: a new approach to standardizing for-
est interior tree-ring width series for dendroclimatic studies. Tree Ring Bulletin, 41,
45–53.
De Kauwe MG, Medlyn BE, Zaehle S et al. (2013) Forest water use and water use effi-
ciency at elevated CO2: a model-data intercomparison at two contrasting temper-
ate forest FACE sites. Global Change Biology, 19, 1759–1779.
Ehleringer JR, Cerling TE (1995) Atmospheric CO2 and the ratio of intercellular to
ambient CO2 concentrations in plants. Tree Physiology, 15, 105–111.
Ellsworth DS (1999) CO2 enrichment in a maturing pine forest: are CO2 exchange and
water status in the canopy affected? Plant Cell and Environment, 22, 461–472.
Fairchild IJ, Loader NJ, Wynn PM et al. (2009) Sulfur fixation in wood mapped by
synchrotron X-ray studies: implications for environmental archives. Environmental
Science & Technology, 43, 1310–1315.
Farquhar GD, Caemmerer SV, Berry JA (1980) A biochemical model of photosynthetic
CO2 assimilation in leaves of C3 species. Planta, 149, 78–90.
Farquhar GD, O’Leary MH, Berry JA (1982) On the relationship between carbon iso-
tope discrimination and the intercellular carbon dioxide concentration in leaves.
Australian Journal of Plant Physiology, 9, 121–137.
Feng XH (1998) Long-term ci/ca response of trees inwesternNorth America to atmospheric
CO2 concentration derived fromcarbon isotope chronologies.Oecologia, 117, 19–25.
Francey RJ, Farquhar GD (1982) An explanation of 13C/12C variations in tree rings.
Nature, 297, 28–31.
Frank DC, Esper J, Raible CC, B€untgen U, Trouet V, Stocker B, Joos F (2010) Ensemble
reconstruction constraints on the global carbon cycle sensitivity to climate. Nature,
463, 527–U143.
Gagen M, McCarroll D, Loader NJ, Robertson L, Jalkanen R, Anchukaitis KJ (2007)
Exorcising the ‘segment length curse’: summer temperature reconstruction since
AD 1640 using non-detrended stable carbon isotope ratios from pine trees in
northern Finland. Holocene, 17, 435–446.
Gagen M, Finsinger W, Wagner-Cremer F et al. (2011) Evidence of changing intrinsic
water-use efficiency under rising atmospheric CO2 concentrations in Boreal Fenno-
scandia from subfossil leaves and tree ring d13C ratios. Global Change Biology, 17,
1064–1072.
Gedney N, Cox PM, Betts RA, Boucher O, Huntingford C, Stott PA (2006) Detection of a
direct carbon dioxide effect in continental river runoff records.Nature, 439, 835–838.
Gerber S, Joos F, Brugger P, Stocker TF, Mann ME, Sitch S, Scholze M (2003) Con-
straining temperature variations over the last millennium by comparing simulated
and observed atmospheric CO2. Climate Dynamics, 20, 281–299.
Gerten D, Schaphoff S, Haberlandt U, Lucht W, Sitch S (2004) Terrestrial vegetation
and water balance - hydrological evaluation of a dynamic global vegetation model.
Journal of Hydrology, 286, 249–270.
Gessler A, Brandes E, Buchmann N, Helle G, Rennenberg H, Barnard RL (2009) Trac-
ing carbon and oxygen isotope signals from newly assimilated sugars in the leaves
to the tree-ring archive. Plant Cell and Environment, 32, 780–795.
Haxeltine A, Prentice IC (1996) BIOME3: an equilibrium terrestrial biosphere model
based on ecophysiological constraints, resource availability, and competition
among plant functional types. Global Biogeochemical Cycles, 10, 693–709.
Hickler T, Smith B, Prentice IC, Mjofors K, Miller P, Arneth A, Sykes MT (2008) CO2
fertilization in temperate FACE experiments not representative of boreal and trop-
ical forests. Global Change Biology, 14, 1531–1542.
Hietz P, WanekW, Dunisch O (2005) Long-term trends in cellulose d13C and water-use
efficiency of tropicalCedrela and Swietenia from Brazil. Tree Physiology, 25, 745–752.
Hijmans RJ, Cameron SE, Parra JL, Jones PG, Jarvis A (2005) Very high resolution
interpolated climate surfaces for global land areas. International Journal of Climatol-
ogy, 25, 1965–1978.
Holtum JAM, Winter K (2010) Elevated [CO2] and forest vegetation: more a water
issue than a carbon issue? Functional Plant Biology, 37, 694–702.
Huntington TG (2008) CO2-induced suppression of transpiration cannot explain
increasing runoff. Hydrological Processes, 22, 311–314.
IPCC (2013)Climate Change 2013: The Physical Science Basis. Contribution ofWorkingGroup I
to the FifthAssessment Report of the Intergovernmental Panel onClimateChange. Cam-
bridgeUniversity Press, Cambridge, UnitedKingdomandNewYork,NY,USA.
Joos F, Prentice IC, Sitch S et al. (2001) Global warming feedbacks on terrestrial car-
bon uptake under the Intergovernmental Panel on Climate Change (IPCC) emis-
sion scenarios. Global Biogeochemical Cycles, 15, 891–907.
Joos F, Gerber S, Prentice IC, Otto-Bliesner BL, Valdes PJ (2004) Transient simulations
of Holocene atmospheric carbon dioxide and terrestrial carbon since the Last Glacial
Maximum.Global Biogeochemical Cycles, 18, GB2002, doi: 10.1029/2003gb002156.
Keenan TF, Hollinger DY, Bohrer G, Dragoni D, Munger JW, Schmid HP, Richardson
AD (2013) Increase in forest water-use efficiency as atmospheric carbon dioxide
concentrations rise. Nature, 499, 324–327.
Koch GW, Sillett SC, Jennings GM, Davis SD (2004) The limits to tree height. Nature,
428, 851–854.
Lamarque J-F, Kyle GP, Meinshausen M et al. (2011) Global and regional evolution of
short-lived radiatively-active gases and aerosols in the representative concentra-
tion pathways. Climatic Change, 109, 191–212.
Leavitt SW, Long A (1984) Sampling strategy for stable carbon isotope analysis of tree
rings in pine. Nature, 311, 145–147.
Leuenberger M (2007) To what extent can ice core data contribute to the understand-
ing of plant ecological developments of the past? In: Stable Isotopes as Indicators of
Ecological Change (eds Dawson TE, Siegwolf RTW), pp. 211–233. Elsevier Academic
Press, London.
Leuzinger S, K€orner C (2007) Water savings in mature deciduous forest trees under
elevated CO2. Global Change Biology, 13, 2498–2508.
© 2014 John Wiley & Sons Ltd, Global Change Biology, doi: 10.1111/gcb.12717
12 M. SAURER et al.
Linares J-C, Delgado-Huertas A, Julio Camarero J, Merino J, Carreira JA (2009) Compe-
tition and drought limit the response of water-use efficiency to rising atmospheric
carbon dioxide in theMediterranean firAbies pinsapo.Oecologia, 161, 611–624.
Loader NJ, Robertson I, McCarroll D (2003) Comparison of stable carbon isotope
ratios in the whole wood, cellulose and lignin of oak tree-rings. Palaeogeography
Palaeoclimatology Palaeoecology, 196, 395–407.
Loader NJ, Walsh RPD, Robertson I et al. (2011) Recent trends in the intrinsic water-
use efficiency of ringless rainforest trees in Borneo. Philosophical Transactions of the
Royal Society B: Biological Sciences, 366, 3330–3339.
Loader NJ, Young GHF, Grudd H, McCarroll D (2013) Stable carbon isotopes from Tor-
netr€ask, northern Sweden provide a millennial length reconstruction of summer sun-
shine and its relationship toArctic circulation.Quaternary Science Reviews, 62, 97–113.
Marshall JD, Monserud RA (1996) Homeostatic gas-exchange parameters inferred
from 13C/12C in tree rings of conifers. Oecologia, 105, 13–21.
McCarroll D, Loader NJ (2004) Stable isotopes in tree rings. Quaternary Science
Reviews, 23, 771–801.
McDowell N, Bond B, Dickman L, Ryan M, Whitehead D (2011) Relationships
between tree height and carbon isotope discrimination. In: Size- and Age-Related
Changes in Tree Structure (eds Meinzer F, Lachenbruch B, Dawson T), pp 255–286.
Springer, Dordrecht, the Netherlands.
McMurtrie RE, Norby RJ, Medlyn BE, Dewar RC, Pepper DA, Reich PB, Barton CVM
(2008) Why is plant-growth response to elevated CO2 amplified when water is lim-
iting, but reduced when nitrogen is limiting? A growth-optimisation hypothesis.
Functional Plant Biology, 35, 521–534.
Michelot A, Eglin T, Dufrene E, Lelarge-Trouverie C, Damesin C (2011) Comparison
of seasonal variations in water-use efficiency calculated from the carbon isotope
composition of tree rings and flux data in a temperate forest. Plant Cell and Envi-
ronment, 34, 230–244.
Mitchell TD, Jones PD (2005) An improved method of constructing a database of
monthly climate observations and associated high-resolution grids. International
Journal of Climatology, 25, 693–712.
Moore DJ, Nowak RS, Tausch RJ (1999) Gas exchange and carbon isotope discrimina-
tion of Juniperus osteosperma and Juniperus occidentalis across environmental gradi-
ents in the Great Basin of western North America. Tree Physiology, 19, 421–433.
Murray SJ, Foster PN, Prentice IC (2011) Evaluation of global continental hydrology
as simulated by the Land-surface Processes and eXchanges Dynamic Global Vege-
tation Model. Hydrology and Earth System Sciences, 15, 91–105.
Norby RJ,Warren JM, Iversen CM,Medlyn BE,McMurtrie RE (2010) CO2 enhancement
of forest productivity constrained by limited nitrogen availability. Proceedings of the
National Academy of Sciences of the United States of America, 107, 19368–19373.
Pal JS, Giorgi F, Bi XQ (2004) Consistency of recent European summer precipitation
trends and extremes with future regional climate projections. Geophysical Research
Letters, 31, L13202, doi: 10.1029/2004gl019836.
Pan Y, Birdsey RA, Fang J et al. (2011) A large and persistent carbon sink in the
world’s forests. Science, 333, 988–993.
Panek JA, Waring RH (1997) Stable carbon isotopes as indicators of limitations to for-
est growth imposed by climate stress. Ecological Applications, 7, 854–863.
Parmesan C, Yohe G (2003) A globally coherent fingerprint of climate change impacts
across natural systems. Nature, 421, 37–42.
Pe~nuelas J, Canadell JG, Ogaya R (2011) Increased water-use efficiency during the
20th century did not translate into enhanced tree growth. Global Ecology and Bioge-
ography, 20, 597–608.
Plattner GK, Knutti R, Joos F et al. (2008) Long-term climate commitments projected
with climate-carbon cycle models. Journal of Climate, 21, 2721–2751.
Rinne KT, Loader NJ, Switsur VR, Treydte KS, Waterhouse JS (2010) Investigating the
influence of sulphur dioxide (SO2) on the stable isotope ratios (d13C and d18O) of
tree rings. Geochimica Et Cosmochimica Acta, 74, 2327–2339.
Ryan MG, Yoder BJ (1997) Hydraulic limits to tree height and tree growth. BioScience,
47, 235–242.
Saurer M, Aellen K, Siegwolf R (1997) Correlating d13C and d18O in cellulose of trees.
Plant Cell and Environment, 20, 1543–1550.
Saurer M, Siegwolf RTW, Schweingruber FH (2004) Carbon isotope discrimination
indicates improving water-use efficiency of trees in northern Eurasia over the last
100 years. Global Change Biology, 10, 2109–2120.
Schimel DS, House JI, Hibbard KA et al. (2001) Recent patterns and mechanisms of
carbon exchange by terrestrial ecosystems. Nature, 414, 169–172.
Seibt U, Rajabi A, Griffiths H, Berry JA (2008) Carbon isotopes and water use effi-
ciency: sense and sensitivity. Oecologia, 155, 441–454.
Seneviratne SI, Luethi D, Litschi M, Schaer C (2006) Land-atmosphere coupling and
climate change in Europe. Nature, 443, 205–209.
Sitch S, Smith B, Prentice IC et al. (2003) Evaluation of ecosystem dynamics, plant
geography and terrestrial carbon cycling in the LPJ dynamic global vegetation
model. Global Change Biology, 9, 161–185.
Spahni R, Joos F, Stocker BD, Steinacher M, Yu ZC (2013) Transient simulations of the
carbon and nitrogen dynamics in northern peatlands: from the Last Glacial Maxi-
mum to the 21st century. Climate of the Past, 9, 1287–1308.
Stocker BD, Strassmann K, Joos F (2011) Sensitivity of Holocene atmospheric CO2 and
the modern carbon budget to early human land use: analyses with a process-based
model. Biogeosciences, 8, 69–88.
Stocker BD, Roth R, Joos F et al. (2013) Multiple greenhouse-gas feedbacks from the land
biosphereunder future climate change scenarios.NatureClimate Change, 3, 666–672.
Strassmann KM, Joos F, Fischer G (2008) Simulating effects of land use changes on
carbon fluxes: past contributions to atmospheric CO2 increases and future commit-
ments due to losses of terrestrial sink capacity. Tellus Series B: Chemical and Physical
Meteorology, 60, 583–603.
Sun F, Kuang Y, Wen D, Xu Z, Li J, Zuo W, Hou E (2010) Long-term tree growth rate,
water use efficiency, and tree ring nitrogen isotope composition of Pinus massoni-
ana L. in response to global climate change and local nitrogen deposition in South-
ern China. Journal of Soils and Sediments, 10, 1453–1465.
Tian HQ, Chen GS, Liu ML et al. (2010) Model estimates of net primary productivity,
evapotranspiration, and water use efficiency in the terrestrial ecosystems of the south-
ernUnited States during 1895–2007. Forest Ecology andManagement, 259, 1311–1327.
Treydte K, Frank D, Esper J et al. (2007) Signal strength and climate calibration of a
European tree ring isotope network. Geophysical Research Letters, 34, L24302, doi:
10.1029/2007GL031106.
Wania R, Ross I, Prentice IC (2009) Integrating peatlands and permafrost into a
dynamic global vegetationmodel: 1. Evaluation and sensitivity of physical land sur-
face processes.Global Biogeochemical Cycles, 23, GB3014, doi: 10.1029/2008gb003412.
Waterhouse JS, Switsur VR, Barker AC, Carter AHC, Hemming DL, Loader NJ,
Robertson I (2004) Northern European trees show a progressively diminishing
response to increasing atmospheric carbon dioxide concentrations. Quaternary
Science Reviews, 23, 803–810.
Wullschleger SD, Tschaplinski TJ, Norby RJ (2002) Plant water relations at elevated CO2-
implications for water-limited environments. Plant Cell and Environment, 25, 319–331.
Xu-Ri, Prentice IC (2008) Terrestrial nitrogen cycle simulation with a dynamic global
vegetation model. Global Change Biology, 14, 1745–1764.
Xu-Ri, Prentice IC, Spahni R, Niu HS (2012) Modelling terrestrial nitrous oxide emis-
sions and implications for climate feedback. New Phytologist, 196, 472–488.
Young GHF, Demmler JC, Gunnarson BE, Kirchhefer AJ, Loader NJ, McCarroll D
(2011) Age trends in tree ring growth and isotopic archives: a case study of Pinus
sylvestris L. from northwestern Norway. Global Biogeochemical Cycles, 25, GB2020,
doi: 10.1029/2010gb003913.
Zhao M, Running SW (2010) Drought-induced reduction in global terrestrial net pri-
mary production from 2000 through 2009. Science, 329, 940–943.
Supporting Information
Additional Supporting Information may be found in theonline version of this article:
Table S1. Long-term annual temperature and precipitationfor all study sites.Figure S1. Correlation analysis between the 35 tree-ringderived iWUE time series from 1901 to 2000 and the outputfrom the LPX model standard run for the nearest pixel.Figure S2. Relationship between iWUE change in % (calcu-lated as the relative difference between iWUE in the periods1901–1910 and 1991–2000) and the iWUE trends (slope ofthe linear regression between iWUE and time for 1901–2000)for each tree-ring site.Figure S3. The iWUE trends for the tree-ring sites as a func-tion of the 20th century trends in summer (JJA) soil-watercontent (SWC).Figure S4. LPX standard model calculated assimilation andstomatal conductance averaged for all Europe.
© 2014 John Wiley & Sons Ltd, Global Change Biology, doi: 10.1111/gcb.12717
WATER-USE EFFICIENCY TRENDS IN EUROPE 13