Embed Size (px)
Citation preview
The Pennsylvania State University
The Graduate School
College of Agricultural Sciences
SPATIAL AND TEMPORAL VARIABILITY OF NITROGEN
TRANSPORT IN RIPARIAN ZONE SEEPS
A Dissertation in
Agricultural and Biological Engineering
by
Mark R. Williams
© 2013 Mark R. Williams
Submitted in Partial Fulfillment
of the Requirements
for the Degree of
Doctor of Philosophy
August 2013

ii
The dissertation of Mark R. Williams was reviewed and approved* by the following:
Herschel A. Elliott
Professor of Agricultural and Biological Engineering
Dissertation Adviser, Chair of Committee
Anthony R. Buda
Hydrologist, USDA-ARS PSWMRU
Special Member
James M. Hamlett
Associate Professor of Agricultural and Biological Engineering
Kamini Singha
Associate Professor of Hydrologic Science and Engineering
Curtis J. Dell
Soil Scientist, USDA-ARS PSWMRU
Paul H. Heinemann
Professor of Agricultural and Biological engineering
Head of the Department of Agricultural and Biological Engineering
*Signatures are on file in the Graduate School

iii
ABSTRACT
Excess nitrate-nitrogen (NO3-N) in terrestrial and aquatic ecosystems has resulted in
numerous water quality problems throughout the U.S., which emphasizes the need to develop
effective management plans to deal with NO3-N pollution, especially in agricultural catchments.
Emergent groundwater-fed seeps have been identified as a potentially significant source of water
and NO3-N to streams in headwater catchments, yet few studies have evaluated NO3-N transport
in seeps and their influence on downstream water quality. To address this need, four studies were
undertaken to better understand the role of seeps in FD36 and RS, two small (0.40 and 0.45 ha,
respectively) agricultural headwater catchments located in the Ridge and Valley physiographic
region of central Pennsylvania.
The first study (Chapter 2) examined spatial and temporal variations in NO3-N
concentration and transport potential in shallow groundwater of three seep and adjacent non-seep
areas in the riparian zone. Results showed that NO3-N concentrations within the seep areas were
significantly greater than NO3-N concentrations in the non-seep areas. Water table depth was also
more spatially variable in the seep areas compared to the non-seep areas, which indicated less
uniform flow, shorter residence times for groundwater, and greater potential for NO3-N delivery
to the stream from seep areas.
The second study (Chapter 3) used electrical resistivity imaging (ERI) to visualize seep
zone formation in order to enhance our understanding of the chemical-hydrologic interactions in
the riparian zone. ERI data showed large, localized decreases in resistivity within a seep area
following a series of three precipitation events, which suggested that groundwater was upwelling
through discontinuities in the fragipan. The non-seep area showed no such response. The changes
in resistivity within the seep area coincided with increased NO3-N concentrations. Results
iv
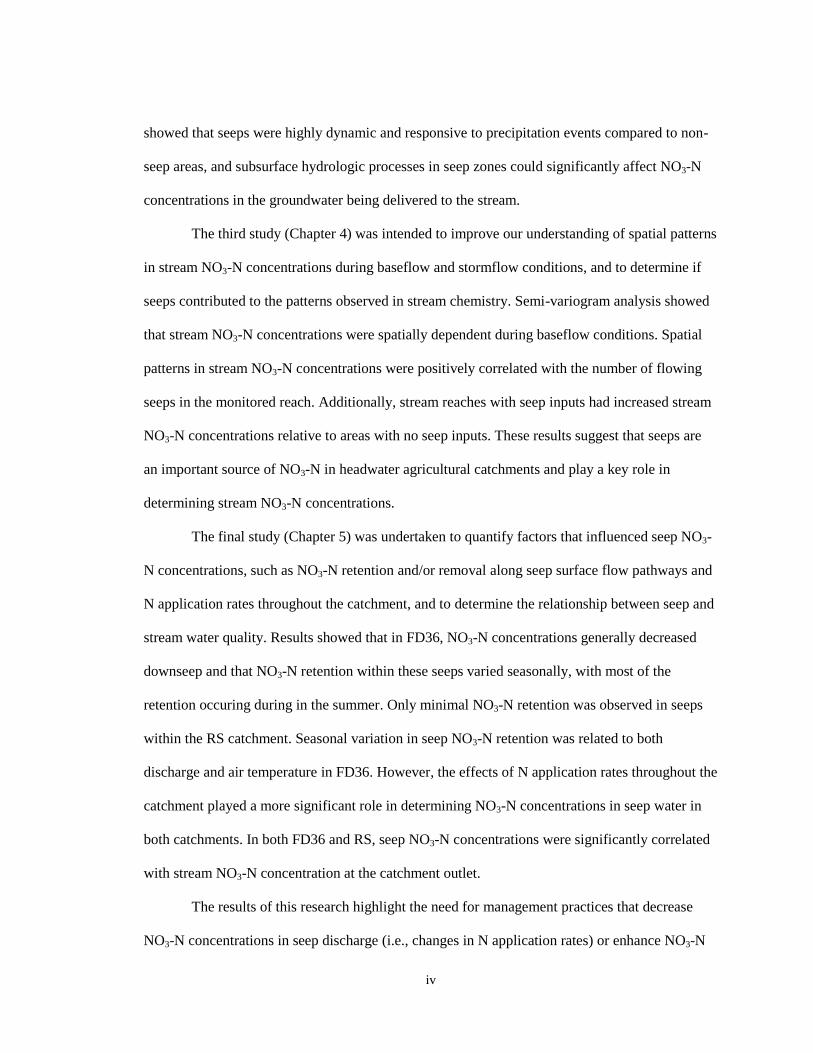
showed that seeps were highly dynamic and responsive to precipitation events compared to non-
seep areas, and subsurface hydrologic processes in seep zones could significantly affect NO3-N
concentrations in the groundwater being delivered to the stream.
The third study (Chapter 4) was intended to improve our understanding of spatial patterns
in stream NO3-N concentrations during baseflow and stormflow conditions, and to determine if
seeps contributed to the patterns observed in stream chemistry. Semi-variogram analysis showed
that stream NO3-N concentrations were spatially dependent during baseflow conditions. Spatial
patterns in stream NO3-N concentrations were positively correlated with the number of flowing
seeps in the monitored reach. Additionally, stream reaches with seep inputs had increased stream
NO3-N concentrations relative to areas with no seep inputs. These results suggest that seeps are
an important source of NO3-N in headwater agricultural catchments and play a key role in
determining stream NO3-N concentrations.
The final study (Chapter 5) was undertaken to quantify factors that influenced seep NO3-
N concentrations, such as NO3-N retention and/or removal along seep surface flow pathways and
N application rates throughout the catchment, and to determine the relationship between seep and
stream water quality. Results showed that in FD36, NO3-N concentrations generally decreased
downseep and that NO3-N retention within these seeps varied seasonally, with most of the
retention occuring during in the summer. Only minimal NO3-N retention was observed in seeps
within the RS catchment. Seasonal variation in seep NO3-N retention was related to both
discharge and air temperature in FD36. However, the effects of N application rates throughout the
catchment played a more significant role in determining NO3-N concentrations in seep water in
both catchments. In both FD36 and RS, seep NO3-N concentrations were significantly correlated
with stream NO3-N concentration at the catchment outlet.
The results of this research highlight the need for management practices that decrease
NO3-N concentrations in seep discharge (i.e., changes in N application rates) or enhance NO3-N
v
retention and/or removal within seep surface flow paths (i.e., riparian zone wetlands or
bioreactors) in order to improve stream water quality in agricultural streams. Future studies are
needed to improve our ability to identify seepage inputs to streams, as well as to predict where
seepage zones are likely to occur on the landscape. Seeps should be considered critical source
areas for NO3-N delivery to streams since they have been shown to contribute higher fluxes of
water and nutrients to streams relative to the surrounding riparian zone. Overall, the four studies
in this dissertation demonstrated that seeps exert a strong influence on streamflow generation and
NO3-N fluxes in headwater catchments. Dissertation results also showed that an improved
understanding of seep formation, hydrology, and biogeochemistry is necessary for evaluating the
potential effectiveness of management practices aimed at improving stream water quality in
headwater catchments.

vi
TABLE OF CONTENTS
LIST OF FIGURES .............................................................................................................. x
LIST OF TABLES ................................................................................................................ xv
ACKNOWLEDGEMENTS .................................................................................................. xvii
CHAPTER 1. Introduction and Literature Review ............................................................... 1
Excess Nutrients in the Environment ....................................................................... 2
Riparian Zones for Controlling Nonpoint Pollution ................................................ 4
Surface Water, Groundwater, and their Interaction ................................................. 7
Occurrence and Hydrology of Seeps ....................................................................... 8
Nitrogen Dynamics in Seeps .................................................................................... 11
Research Objectives ................................................................................................. 14
References ................................................................................................................ 16
CHAPTER 2. Groundwater Flow Path Dynamics and Nitrogen Transport Potential
in the Riparian Zone of an Agricultural Headwater Catchment ........................................... 20
Abstract .................................................................................................................... 20
Introduction .............................................................................................................. 21
Materials and Methods ............................................................................................. 24
Site Location and Characteristics
Field Sampling and Laboratory Analysis
Statistics and Data Analysis
Results ...................................................................................................................... 28
Piezometer N Concentration
Monitoring Well N Concentration
Groundwater Flow Paths and Patterns
Relationship between N Concentration and Hydrology
Discussion ................................................................................................................ 39
Hydrology of Seep and Non-seep Areas of the Riparian Zone
Influence of Hydrology on N Concentrations in Seep and Non-seep
Areas
N Transport Potential in Seep and Non-seep Areas
Conclusions .............................................................................................................. 44
References ............................................................................................................... 45
CHAPTER 3. Imaging Riparian Seepage Zones Using Electrical Resistivity: Linking
Hydrology and Nitrogen Transport ....................................................................................... 50
Abstract .................................................................................................................... 50
Introduction .............................................................................................................. 51
Materials and Methods ............................................................................................. 54
vii
Site Location and Characteristics
Field Sampling and Laboratory Analysis
Statistics and Data Analysis
Electrical Resistivity Imaging
Results ...................................................................................................................... 59
Water Table Dynamics and Seep Area Formation
Water Chemistry: NO3-N and Cl-
Imaging Subsurface Hydrologic Processes with Electrical Resistivity
Discussion ................................................................................................................ 70
Riparian Zone Hydrology and Seep Area Formation
Linking Hydrology and Nitrogen Transport
Conceptual Model of Groundwater and Nitrogen Transport in the
Riparian Zone of FD36
Conclusions .............................................................................................................. 77
References ................................................................................................................ 77
CHAPTER 4. Influence of Riparian Seepage Zones on Nitrate Variability in Stream
Water During Baseflow and Stormflow in Two Agricultural Headwater Catchments ......... 83
Abstract .................................................................................................................... 83
Introduction .............................................................................................................. 84
Material and Methods .............................................................................................. 86
Site Location and Characteristics
Stream and Seep Water Sampling
Water Quality Analysis
Statistics and Data Analysis
Semi-variogram Analysis
Results ...................................................................................................................... 93
General Trends in Precipitation and Streamflow
Stream Water NO3-N Concentration and Spatial Variability
Baseflow
Stormflow
Seep NO3-N Concentration Variability
The Influence of Seeps on Stream Water NO3-N Concentration and
Variability
Discussion ................................................................................................................ 105
Variability of NO3-N in Stream and Seep Waters
Effects of Seeps on Stream Water NO3-N Variability
Influence of Storm Events on In-stream NO3-N Variability
Conclusions .............................................................................................................. 109
References ................................................................................................................ 110
CHAPTER 5. Linking Nitrogen Management, Seep Chemistry, and Stream Water
Quality in Two Agricultural Headwater Catchments ........................................................... 114
Abstract .................................................................................................................... 114
Introduction .............................................................................................................. 115
Material and Methods .............................................................................................. 118
Site Location and Characteristics

viii
Seep and Stream Water Sampling
Water Quality Analysis
Statistics and Data Analysis
Results ...................................................................................................................... 123
Nitrogen Management in FD36 and RS
Nitrogen Application Rate along Groundwater Flow Paths to Seeps
NO3-N Retention in Seeps
Stream NO3-N Concentration at the Catchment Outlet
Discussion ................................................................................................................ 133
Seep Characteristics and Hydrology
Nitrogen Application Rates and Seep NO3-N Concentration
NO3-N Retention in Riparian Zone Seeps
Seep Controls on Catchment-scale NO3-N
Conclusions .............................................................................................................. 140
References ................................................................................................................ 141
CHAPTER 6. Nitrogen Transport in Riparian Zone Seeps: Conclusions and Future
Research ................................................................................................................................ 146
Summary of Major Findings and Conclusions ........................................................ 146
Potential Effectiveness of BMPs in Agricultural Catchments with Seeps ............... 150
Fertilizer and Manure Management
N Application Rate
Timing of N Application
Method of N Application
Soil Management
Tillage
Crop Management
Cover Crops
Diversified Crop Rotations
Edge of Stream Management
Riparian Zones
Bioreactors
Future Research ....................................................................................................... 156
References ................................................................................................................ 157
APPENDIX A. Groundwater Table and Piezometer Data for Chapter Two ........................ 160
Groundwater Table Depth........................................................................................ 160
Piezometer NH4-N, NO3-N, and Cl- Concentrations ............................................... 167
NH4-N Concentrations
NO3-N Concentrations
Cl- Concentrations
APPENDIX B. Groundwater Table, Piezometer, and Electrical Resistivity Imaging
Data for Chapter Three ......................................................................................................... 176
Groundwater Table Depth........................................................................................ 176
Non-seep Electrical Resistivity ................................................................................ 177

ix
Seep Electrical Resistivity ....................................................................................... 180
Piezometer NO3-N Concentration ............................................................................ 182
Piezometer Cl- Concentration .................................................................................. 183
APPENDIX C. Stream and Seep Nitrate Data for Chapter Four .......................................... 184
Baseflow Stream and Seep NO3-N Concentrations ................................................. 184
Storm Event Stream and Seep NO3-N Concentrations ............................................ 188
Semi-variogram Analysis of Stream NO3-N Concentration .................................... 190
APPENDIX D. Stream, Seep, and Groundwater Data for Chapter Five .............................. 196
Seep Top and Bottom NO3-N Concentrations ......................................................... 196
Seep Top and Bottom Cl- Concentrations ................................................................ 199
Stream Discharge ..................................................................................................... 201
Stream NO3-N Concentration .................................................................................. 203
Groundwater NO3-N Concentration......................................................................... 203
Nitrogen Management Data ..................................................................................... 205

x
LIST OF FIGURES
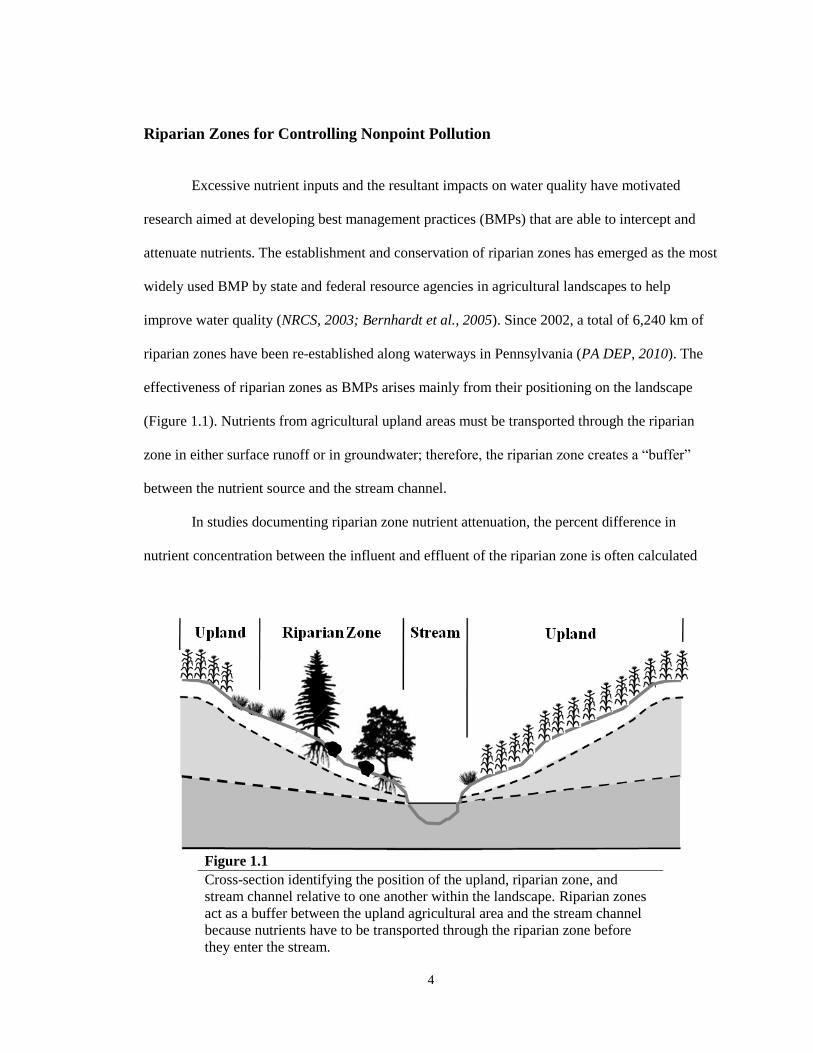
Figure 1.1 Cross-section identifying the position of the upland, riparian zone, and
stream channel relative to one another within the landscape. Riparian zones act as a
buffer between the upland agricultural area and the stream channel because nutrients
have to be transported through the riparian zone before they enter the stream. ................... 4
Figure 1.2 Major water and nutrient flow pathways through the riparian zone: a)
shallow groundwater flow; b) deep groundwater flow; c) surface runoff; and d) spring
and seepage flow. .................................................................................................................. 8
Figure 1.3 Seeps located in a central Pennsylvania headwater catchment following a
precipitation event. The blue line indicates the location of the stream channel, which
flows from left to right. ......................................................................................................... 9
Figure 2.1 (A) Aerial photo of FD36, an agricultural headwater catchment located in
central Pennsylvania, with three study sites marked. FD36 is a sub-catchment of East
Mahantango Creek, which flows into the Susquehanna River and ultimately the
Chesapeake Bay. (B) Instrumentation at study site 2. One study area was located
where an emergent groundwater seep was present (seep area). The other area was
located where there were no seeps (non-seep area). Site 2 is shown, but all three study
sites have identical instrumentation. ..................................................................................... 25
Figure 2.2 Mean groundwater NO3-N concentration measured from piezometers in
seep and non-seep areas of three riparian zone study sites in FD36. (A) Site 1; (B) Site
2; and (C) Site 3. Lower case letters denote statistical significance (p < 0.05) between
depths (20 and 60 cm) within each seep or non-seep area. Upper case letters denote
statistical significance (p < 0.05) between seep and non-seep areas. Differences in
concentration among sites were not analyzed. Error bars represent standard error.
Temporal patterns were based on NO3-N concentrations from both 20- and 60-cm
depths. ................................................................................................................................... 30
Figure 2.3 Spatial distribution of water table depth in seep (left column) and non-seep
(right column) areas of three riparian zone study sites in FD36 on Mar. 14, 2011. (A)
Site 1; (B) Site 2; and (C) Site 3. The land surface is located at 0 cm. Water table depths
were measured from the 60-cm deep piezometers in each area. The stream is located
below all three study sites; thus, groundwater flow is from the top of the image toward
the bottom of the image for all areas. Highlighted (dashed) areas on the seep figures
indicate regions where positive vertical hydraulic gradients were observed throughout
the study. Arrows indicate seep surface flow paths... ........................................................... 34
Figure 2.4 Mean percentage of groundwater that was attributed to either perched
groundwater on top of the fragipan or the shallow fractured aquifer. Percentages
were calculated from mean piezometer (20- and 60-cm depths) and monitoring well
Cl- concentrations with a two component mixing model. (A) Seep area; (B) Non-seep
area. ....................................................................................................................................... 36

xi
Figure 2.5 Mean Cl- concentration (A) and water table depth (B) measured in
piezometers at site 2 compared with mean NO3-N concentration during the study
period (p < 0.001 and p = 0.004, respectively). Both 20- and 60-cm deep piezometers
were used in the analysis of Cl- concentration vs. NO3-N, whereas only the 60-cm
deep piezometers were used for the water table depth vs. NO3-N because the 20-cm
deep piezometers were often dry. Site 2 was chosen as an example; data for all three
study sites are shown in Table 2.4. ..................................................................................... 37
Figure 2.6 Comparison of mean NH4-N, NO3-N, and Cl- concentrations in
piezometers and surface seep discharge from three seep areas in the riparian zone of
FD36. Surface seep discharge was collected (when present) on the same day as samples
were taken from piezometers as part of a separate study in FD36 (Chapter 5). Error
bars represent standard error. Lower case letters denote statistical significance
(p < 0.05) between groundwater and surface discharge within each site and nutrient. ........ 38
Figure 3.1 Instrumentation at the study site in FD36. One study site is located where
an emergent groundwater seep is present (seep area). The other site is an area without an
emergent groundwater seep (non-seep area). FD36 is a sub-catchment of WE-38, which
has been a primary research site of the USDA-Agricultural Research Service for over 40
years. The water leaving WE-38 flows into East Mahantango Creek, which is a tributary
of the Susquehanna River and ultimately the Chesapeake Bay. ........................................... 57
Figure 3.2 (A) Cumulative precipitation measured at a rain gauge approximately
100 m south-west of the study site in FD36. (B) Daily average stream discharge
measured at a recording H-flume in FD36 from April 14, 2012 to May 22, 2012 with
sample dates labeled. ............................................................................................................ 60
Figure 3.3 (A-D) Depth of the water table below the land surface. (A) Apr. 23; (B)
Apr. 25; (C) May 2; (D) May 21. The left column is the seep area and the right column
is the non-seep area. Depths were measured from the 60 cm piezometers in each area.
On Apr. 21 and 22, the water table was > 60 cm in both areas (not shown). ....................... 61
Figure 3.4 Spatial patterns of NO3-N concentration measured in seep area piezometers
in FD36. The left and right columns are NO3-N concentrations in the 20 cm and 60 cm
piezometers, respectively. (A) Apr. 23; (B) Apr. 25; (C) May 2; (D) May 21. No water
samples were collected on Apr. 21 and 22............................................................................ 63
Figure 3.5 Changes in mean seep and non-seep Cl- and NO3-N concentrations during
and following a series of precipitation events compared to shallow fractured aquifer
(deep GW) and perched groundwater (shallow GW) concentrations. Data for deep and
shallow groundwater is from Williams et al., (Chapter 2). For the seep data: 1 = Apr.
23; 2 = Apr. 25; 3 = May 2; and 4 = May 21. The non-seep concentration is from May
21. Error bars represent ± 1 standard error. .......................................................................... 65
Figure 3.6 (A) Electrical resistivity measured in the non-seep area on April 21, 2012.
Data were collected before a series of three precipitation events and were used as a
comparion for subsequent time steps. (B-F) Change in electrical resistivity relative to
background conditions (April 21, 2012). (B) April 22,2012 (C) April 23, 2012 (D)
April 25, 2012 (E) May 2, 2012 (F) May 21, 2012. .............................................................. 67
xii
Figure 3.7 (A) Electrical resistivity measured in the seep area on April 21, 2012. Data
were collected before a series of three precipitation events and were used as a comparion
for subsequent time steps. (B-F) Change in electrical resistivity relative to background
conditions (April 21, 2012). (B) April 22,2012 (C) April 23, 2012 (D) April 25, 2012
(E) May 2, 2012 (F) May 21, 2012. ...................................................................................... 68
Figure 3.8 Conceptual diagram of groundwater and N transport in the seep and non-
seep areas of the riparian zone in FD36. Arrows represent groundwater flow paths and
the thickness of the arrows is the relative NO3-N concentration (e.g., thick arrow =
higher concentration). (A) Seep area expansion; (B) Saturation; and (C) Seep area
contraction. ........................................................................................................................... 75
Figure 4.1 Aerial photo of FD36 and RS with locations of groundwater-fed seeps.
FD36 and RS are sub-catchments of WE-38 (7.3 km2), which is located in central
Pennsylvania and has been a primary research site of the USDA-Agricultural Research
Service for over 40 years. ..................................................................................................... 87
Figure 4.2 Semi-variogram models, showing the semi-variance (γ) as a function of
increasing lag distance (h). For spatially independent data, semi-variance does not
increase with lag (Random Model). For spatially dependent data, semi-variance may
increase for all lags (Linear Model) or level off to an asymptote, called the sill
(Spherical Model). The range indicates the distance over which data are spatially
correlated. Figure adapted from Dent and Grimm (1999). ................................................... 92
Figure 4.3 Daily average stream discharge at the outlet of FD36 from April 2009
through January 2012. Stream discharge was measured with a recording H-flume at
5-min. intervals and averaged daily. Stream discharge from FD36 was representative
of stream discharge in RS. .................................................................................................... 94
Figure 4.4 (A) Baseflow stream water NO3-N concentrations from FD36 and RS
(Apr. 2009 – Jan. 2012). Seasons were defined as spring (Mar. – May), summer (Jun. –
Aug.), fall (Sept. – Nov.), and winter (Dec. – Feb.). (B) Spatial patterns in baseflow
stream water NO3-N concentrations from FD36 and RS. Semi-variogram range values
indicate the distance over which stream water NO3-N concentrations are spatially
dependent. Error bars represent one standard error. Letters above bars denote
statistical significance (p < 0.05). ......................................................................................... 96
Figure 4.5 Stream water NO3-N concentration (left column) and semi-variograms
(right column) from FD36 before (July 22), immediately following (July 29), and 24 h
after (July 30) a storm event (2.9 cm). Spherical models were fit to the July 22 and 29
semi-variograms. A linear model was used to describe the July 30 semi-variogram.
Semi-variance was standardized by dividing through by its maximum value on each
date. Indices of spatial variability are given in Table 4.2. .................................................... 98
Figure 4.6 Changes in stream water NO3-N concentration in FD36 and RS. Seasons
were defined as spring (Mar.-May), summer (Jun.-Aug.), fall (Sept.-Nov.), and winter
(Dec.-Feb.). Seasonal data only includes baseflow sampling. Changes were calculated
over a 550 and 490 m stream reach in FD36 and RS, respectively, at 10 m intervals.
Stream segments with seep inputs were classified as ‘seep’ and all other stream

xiii
segments as ‘non-seep’. Error bars represent one standard deviation. Asterisks indicate
that the change was significantly different from zero (p < 0.05). ......................................... 103
Figure 4.7 Number of seeps sampled on each date compared with the semi-variogram
range (m) for stream water NO3-N concentration. Both baseflow and stormflow
comparisons are shown. The range indicates the distance over which stream water
NO3-N concentrations were spatially dependent. ................................................................. 104
Figure 5.1 Aerial photo of FD36 and RS with locations of groundwater-fed seeps
shown. FD36 and RS are small agricultural sub-catchments of WE-38 (7.3 km2), which
is located in central Pennsylvania and has been a primary research site of the USDA-
Agricultural Research Service for over 40 years. Stream water leaving WE-38 flows
into East Mahantango Creek, which flows into the Susquehanna River and ultimately
the Chesapeake Bay. ............................................................................................................. 119
Figure 5.2 Mean N application rates in FD36 and RS from 2007 through 2011. Data
were collected from annual farmer surveys in both catchments. The amount of N
applied in FD36 and RS was a combination of commercial fertilizer, dairy manure,
and swine manure. Nitrogen content in dairy and swine manure was determined using
standard formulae from the Penn State Agronomy Guide (2011).Seep flow paths were
delineated using surface topography and extended from the seep discharge location to
the catchment boundary. ....................................................................................................... 125
Figure 5.3 Mean N application rate in FD36 and RS compared with seep NO3-N
concentration (p < 0.001). Nitrogen application rates from individual fields were used
to calculate the mean N application rate along flow paths. Nitrogen application rates
were inversely weighted along topographic flow paths from the seep outlet to the
catchment divide. Seep NO3-N concentrations were from the seep top (i.e., emergence
point) when seep length > 3m; otherwise, concentrations represent the seep bottom. ......... 126
Figure 5.4 (A) Air temperature and log Q (stream discharge) at the catchment outlet
of FD36. (B) Percentage of seeps exhibiting NO3-N bypass events. Seep NO3-N bypass
occurred when NO3-N concentration remained constant or increased downseep................. 131
Figure 5.5 Mean monthly seep bottom NO3-N concentration compared with stream
(catchment outlet) NO3-N concentration during the study period (p < 0.001). The
dashed line represents a 1:1 relationship between seep bottom and stream NO3-N
concentration. ........................................................................................................................ 133
xiv
LIST OF TABLES
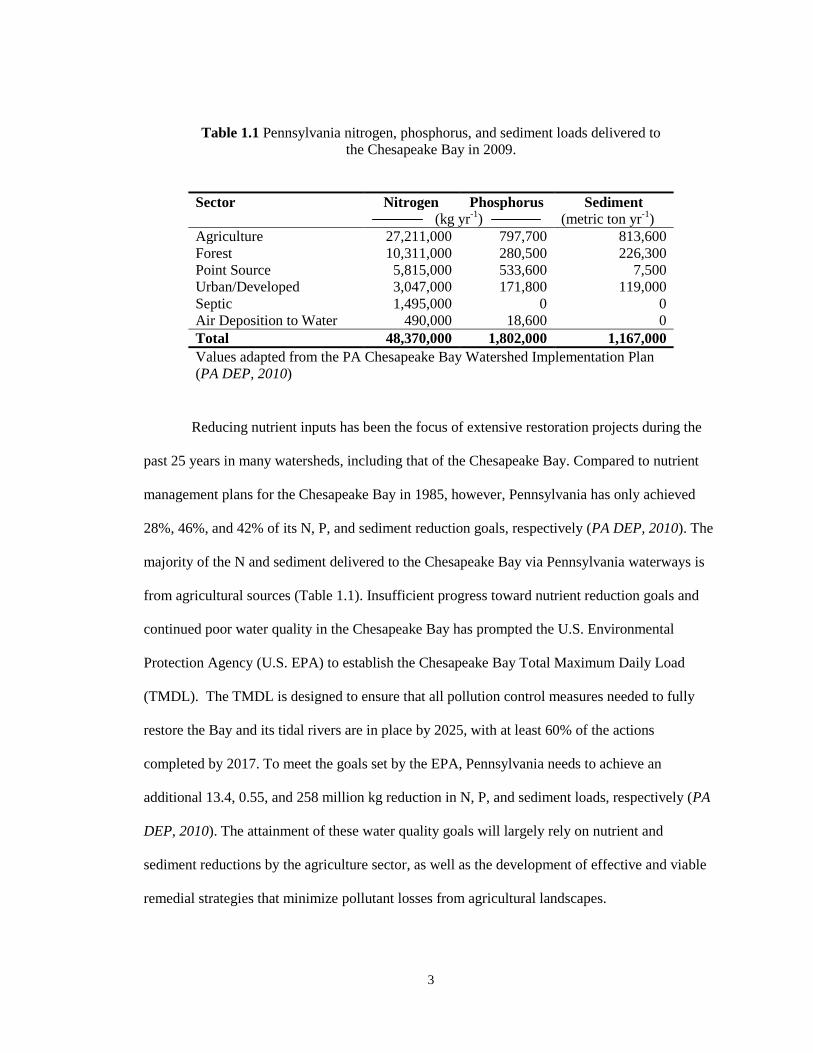
Table 1.1 Pennsylvania nitrogen, phosphorus, and sediment loads delivered to the
Chesapeake Bay in 2009. ...................................................................................................... 3
Table 1.2 Percent effectiveness of riparian zones at removing N based on width,
hydrology, and vegetation type. ............................................................................................ 6
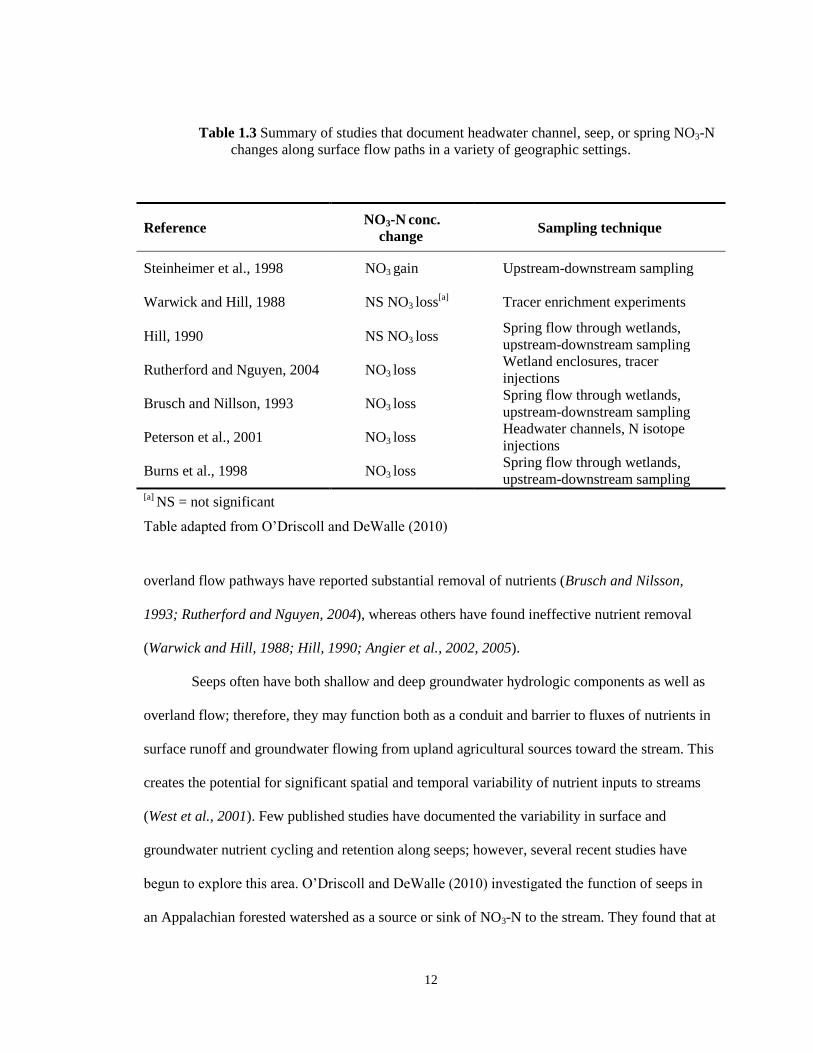
Table 1.3 Summary of studies that document headwater channel, seep or spring
NO3-N changes along surface flow paths in a variety of geographic settings. ..................... 12
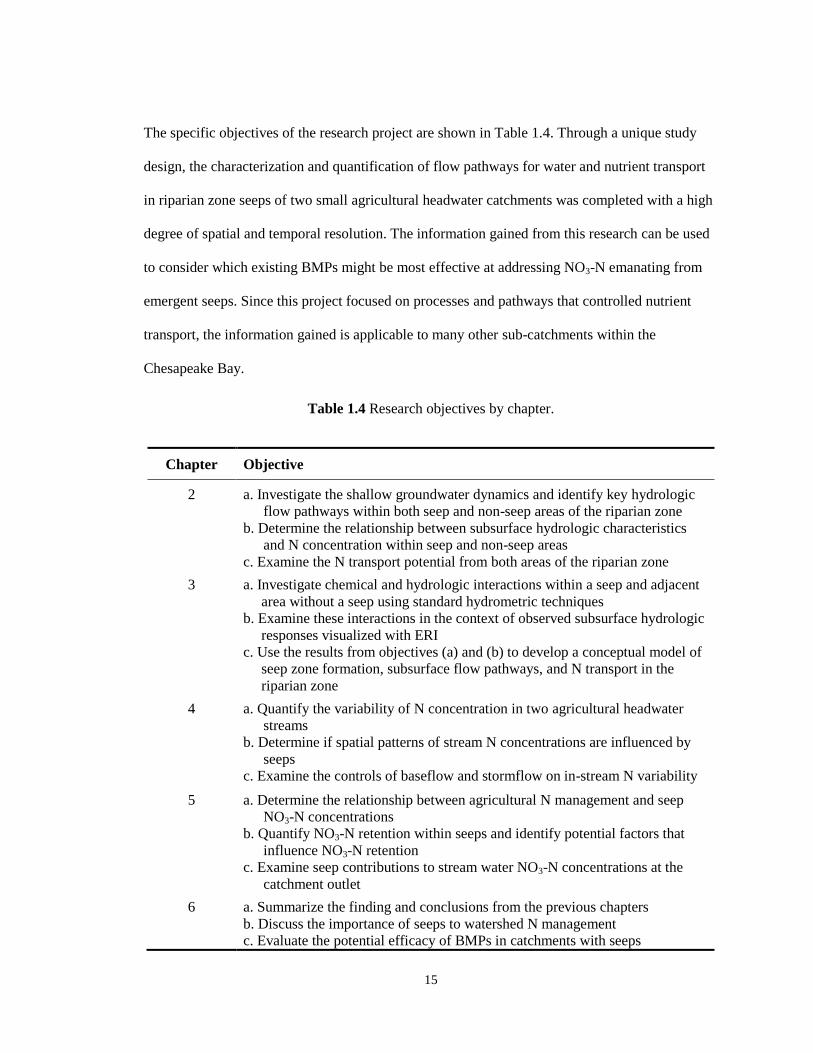
Table 1.4 Research project objectives by chapter. ............................................................... 15
Table 2.1 Mean and range of monitoring well groundwater NO3-N concentration in
FD36 between October 2010 and May 2012. ....................................................................... 31
Table 2.2 Water table elevation and variability in seep and non-seep areas of three
riparian zone study sites in FD36 from October 2010 to May 2012. .................................... 32
Table 2.3 Mean Cl- concentration from piezometers in seep and non-seep areas of
three riparian zone study sites, as well as mean monitoring well Cl- concentration. ............ 35
Table 2.4 Pearson correlation coefficients and p values (in parentheses) for
correlations among piezometer NH4-N concentration, NO3-N concentration, Cl-
concentration, and water table depth from three riparian zone seep areas in FD36.
Italics indicate correlation is significant at p < 0.05. ............................................................ 37
Table 3.1 Nitrate-N and Cl- concentration in piezometers at the study sites in FD36
from April 23 to May 21, 2012. No samples were collected on April 21 or 22. .................. 62
Table 3.2 Soil water content at the study sites in FD36 from April 21 to May 21,
2012. Soil water content was measured at 20-cm intervals with time-domain
reflectometry (TDR). See Figure 3.1 for locations of TDR access tubes. ............................ 69
Table 4.1 Nitrogen management data from FD36 and RS (2007 – 2011). Data were
collected from annual surveys of farmers in both catchments. The amount of N applied
in FD36 and RS was a combination of fertilizer, dairy manure, and swine manure.
Nitrogen content in manure was determined using the Penn State Agronomy Guide
(2011). ................................................................................................................................... 89
Table 4.2 Nitrate-N concentrations, downstream trends, and indices of spatial
variability for stream water in FD36 and RS (April 2009 to January 2012).
Highlighted rows indicate sampling dates that coincided with storm events. ...................... 95
Table 4.3 Seep NO3-N concentrations and variability from FD36 and RS (April
2009 to January 2012). Highlighted rows indicate sampling dates that coincided with
xv
storm events. ......................................................................................................................... 100
Table 4.4 Estimated seep contributions to streamflow in FD36 and RS (April 2009 to
January 2012). Estimations are based on stream and seep water chloride concentrations.
Highlighted rows indicate sampling dates that coincided with storm events. ...................... 101
Table 5.1 Nitrogen management data from FD36 and RS (2007 – 2011). Data were
collected from annual farmer surveys in both catchments. The amount of N applied in
FD36 and RS was a combination of commercial fertilizer, dairy manure, and swine
manure. Nitrogen content in dairy and swine manure was determined using standard
formulae from the Penn State Agronomy Guide (2011). ...................................................... 124
Table 5.2 Seep characteristics from FD36 and RS including site, number of samples,
length, slope, bypass events, percentage of sampling events that were bypass events,
mean top and bottom seep NO3-N concentration, and downseep NO3-N concentration
change. Nitrate concentration data was collected from both catchments between May
2010 and April 2012. ............................................................................................................ 128
Table 5.3 Mean monthly NO3-N concentration at the top and bottom of seeps in
FD36 and RS, and the downseep change in NO3-N concentration between May 2010
and April 2012. ..................................................................................................................... 129
Table 5.4 Pearson correlation coefficients and p values (in parentheses) for correlations
among seep NO3-N concentration, air temperature, and log Q (stream discharge at the
catchment outlet). Italics indicate correlation is significant at p < 0.05 ............................... 132

xvi
ACKNOWLEDGEMENTS
This Ph. D. dissertation is the culmination of my hard work and long hours over the past
nine years (2004-2013) at Penn State University. During my time at Penn State, I have obtained
three degrees, learned how to design and conduct sound research projects, collaborated with some
of the top scientists and engineers in the field, and collected thousands of soil and water samples.
I have not only grown professionally, but also personally as a husband, colleague, and friend. I
could not have done this all on my own. I would like to thank the people who have provided me
with support, advice, and guidance throughout my journey.
I would first like to extend my sincerest thanks to Dr. John Schmidt for his contributions
to the design of this project and his thoughtful advice during the initial stages of sample
collection. I would also like to thank my committee members: Dr. Herschel Elliott, Dr. Anthony
Buda, Dr. James Hamlett, Dr. Kamini Singha, and Dr. Curtis Dell. I truly appreciate your
willingness to be actively involved in my research and I am grateful for your support and
guidance. In addition, I would like to thank the Department of Agricultural and Biological
Engineering and Dr. Paul Heinemann for offering me the financial support to complete my
graduate studies at Penn State. In addition, I would like to acknowledge Dr. Elizabeth Boyer for
her assistance with sample analysis and her interest in this project.
I would like to extend a very warm thank you to all of the research scientists and
technicians at the USDA-Agricultural Research Service in University Park, PA and
Klingerstown, PA. In particular, I would like to thank Michael Reiner and Todd Strohecker for all
of their help in collecting and processing over 6,000 water samples. Rain, snow, freezing-cold, or
extreme heat, they were always willing to offer assistance. Over the past three years,
Klingerstown and FD36 have been my second home and I am sure going to miss it. I would also

xvii
like to thank Sarah Fishel for her help in collecting samples and her assistance in the laboratory.
Without her help, I think I would still be sitting in the laboratory doing Murphy-Riley extractions
and washing bottles.
I would like to express my deepest gratitude to my parents who throughout the years have
supported and loved me. Without your support and love, none of this would have been possible.
Lastly, I would like to thank my wife Rachel. You have been by my side through the good times
and bad times. Whether it was late night talks about statistics, trips to Klingerstown in the rain, or
all of the pairs of jeans I ruined working in the laboratory, you have always been there for me and
I am forever thankful for your constant support. Your friendship and love have shaped who I am
today.

1
CHAPTER 1
Introduction and Literature Review
Located at the interface between terrestrial and aquatic ecosystems, riparian zones
function as areas of transition that are often distinguished by hydrology, vegetation, and soils
(Swanson et al., 1982; Lowrance et al., 1985). Hence, riparian zones are complex environments
that exhibit a high degree of spatial and temporal variability with respect to hydrological and
biogeochemical processes. The overall goal of this research project was to better understand how
groundwater-fed seeps affect nitrogen (N) transport in riparian zones and ultimately N delivery to
streams. To accomplish this goal, four studies were completed in two central Pennsylvania
agricultural headwater catchments (FD36 and RS) in order to evaluate seep area formation,
hydrology, and biogeochemistry.
This first chapter provides the rationale for the current research project and highlights
previous work and information on riparian zones, seeps, and N transport. Following the literature
review, chapter two examines the spatial and temporal variation of N concentrations in shallow
groundwater within three seep and adjacent non-seep areas of the riparian zone. Chapter three
describes the visualization of subsurface flow pathways using electrical resistivity imaging (ERI).
Chapter four presents results from a study evaluating spatial patterns in stream N concentrations
during baseflow and precipitation events and describes how seeps contribute to the patterns
observed in stream chemistry. Chapter five quantifies N retention and transport in seep-fed
surface flow pathways and examines potential relationships between N application rates
throughout the catchment, seeps, and stream water quality. The final chapter, chapter six,
summarizes the principal findings of this research and discusses the importance of understanding
2
dynamic hydrologic processes and the implications of these processes on watershed N
management.
Excess Nutrients in the Environment
In order to maintain profitable crop production, manure and commercial fertilizers are
often applied on agricultural lands. Manure and fertilizers provide plants with essential nutrients,
such as N and phosphorus (P), which are required for their growth and development. In many
instances, however, nutrient additions to agricultural systems have overwhelmed natural nutrient
cycles. Globally, more nutrients are added as fertilizers than are removed as produce (Carpenter
et al., 1998). Excess nutrients that are transported from agricultural lands can become
environmental contaminants and result in the eutrophication and degradation of surface water
bodies (Carpenter et al., 1998; Correll, 1998; Daniel et al., 1998; Boesch et al., 2001).
Eutrophication caused by excessive inputs of nutrients is the most common impairment
of surface waters in the U.S. (U.S. EPA, 2008). Impairment is measured as the area of surface
water not suitable for designated uses such as drinking, irrigation, industry, recreation, or fishing.
Across the U.S., eutrophication accounts for approximately 50% of the impaired lake area and
60% of impaired rivers (U.S. EPA, 2008). It is also the most widespread pollution problem of
U.S. estuaries (NRCS, 2003). An increased incidence of nuisance algal blooms and proliferation
of aquatic weeds is often evidence of eutrophication. Not only are algal blooms and aquatic
weeds aesthetically unappealing, but their death and decomposition can cause anoxia (i.e., no
oxygen) and hypoxia (i.e., low oxygen) in stratified waters. Low levels of dissovled oxygen can
result in significant losses of fish and shellfish resources (Baden et al., 1990; Hansson and
Rudstam, 1990), which negatively impacts recreational and commercial fishing.
3
Table 1.1 Pennsylvania nitrogen, phosphorus, and sediment loads delivered to
the Chesapeake Bay in 2009.
Sector Nitrogen Phosphorus Sediment
(kg yr-1
)
(metric ton yr-1
)
Agriculture 27,211,000 797,700 813,600
Forest 10,311,000 280,500 226,300
Point Source 5,815,000 533,600 7,500
Urban/Developed 3,047,000 171,800 119,000
Septic 1,495,000 0 0
Air Deposition to Water 490,000 18,600 0
Total 48,370,000 1,802,000 1,167,000
Values adapted from the PA Chesapeake Bay Watershed Implementation Plan
(PA DEP, 2010)
Reducing nutrient inputs has been the focus of extensive restoration projects during the
past 25 years in many watersheds, including that of the Chesapeake Bay. Compared to nutrient
management plans for the Chesapeake Bay in 1985, however, Pennsylvania has only achieved
28%, 46%, and 42% of its N, P, and sediment reduction goals, respectively (PA DEP, 2010). The
majority of the N and sediment delivered to the Chesapeake Bay via Pennsylvania waterways is
from agricultural sources (Table 1.1). Insufficient progress toward nutrient reduction goals and
continued poor water quality in the Chesapeake Bay has prompted the U.S. Environmental
Protection Agency (U.S. EPA) to establish the Chesapeake Bay Total Maximum Daily Load
(TMDL). The TMDL is designed to ensure that all pollution control measures needed to fully
restore the Bay and its tidal rivers are in place by 2025, with at least 60% of the actions
completed by 2017. To meet the goals set by the EPA, Pennsylvania needs to achieve an
additional 13.4, 0.55, and 258 million kg reduction in N, P, and sediment loads, respectively (PA
DEP, 2010). The attainment of these water quality goals will largely rely on nutrient and
sediment reductions by the agriculture sector, as well as the development of effective and viable
remedial strategies that minimize pollutant losses from agricultural landscapes.
4
Riparian Zones for Controlling Nonpoint Pollution
Excessive nutrient inputs and the resultant impacts on water quality have motivated
research aimed at developing best management practices (BMPs) that are able to intercept and
attenuate nutrients. The establishment and conservation of riparian zones has emerged as the most
widely used BMP by state and federal resource agencies in agricultural landscapes to help
improve water quality (NRCS, 2003; Bernhardt et al., 2005). Since 2002, a total of 6,240 km of
riparian zones have been re-established along waterways in Pennsylvania (PA DEP, 2010). The
effectiveness of riparian zones as BMPs arises mainly from their positioning on the landscape
(Figure 1.1). Nutrients from agricultural upland areas must be transported through the riparian
zone in either surface runoff or in groundwater; therefore, the riparian zone creates a “buffer”
between the nutrient source and the stream channel.
In studies documenting riparian zone nutrient attenuation, the percent difference in
nutrient concentration between the influent and effluent of the riparian zone is often calculated
Figure 1.1
Cross-section identifying the position of the upland, riparian zone, and
stream channel relative to one another within the landscape. Riparian zones
act as a buffer between the upland agricultural area and the stream channel
because nutrients have to be transported through the riparian zone before
they enter the stream.
5
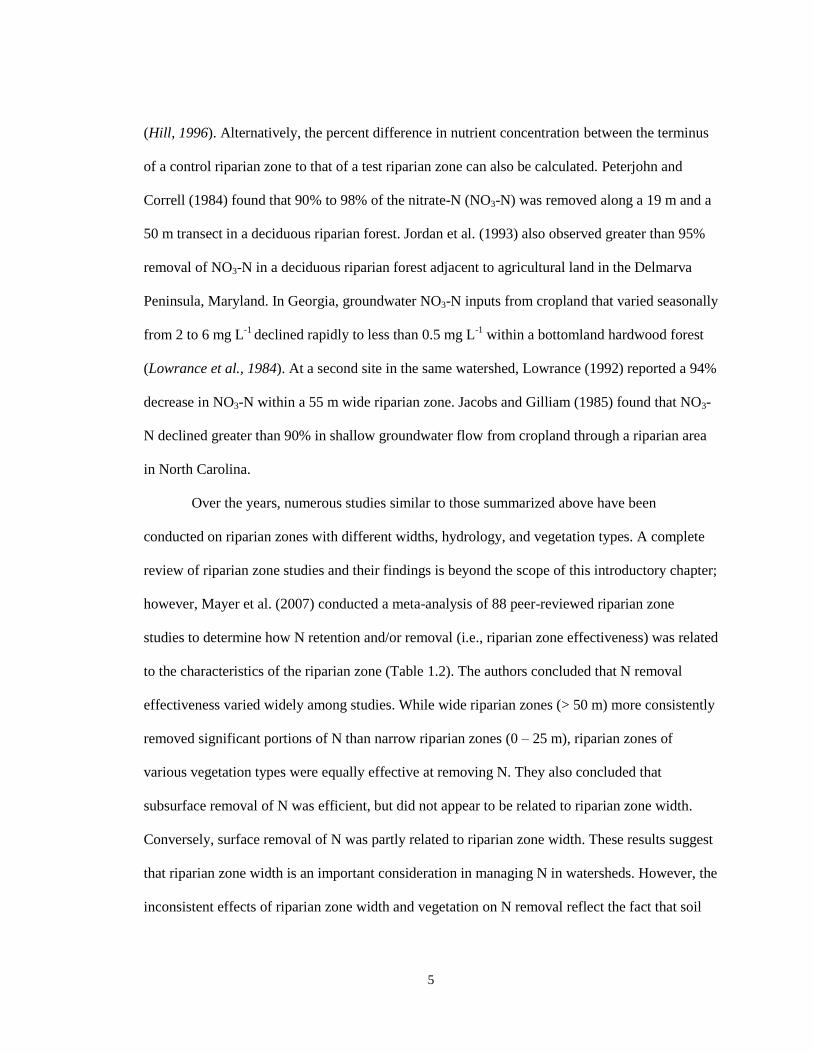
(Hill, 1996). Alternatively, the percent difference in nutrient concentration between the terminus
of a control riparian zone to that of a test riparian zone can also be calculated. Peterjohn and
Correll (1984) found that 90% to 98% of the nitrate-N (NO3-N) was removed along a 19 m and a
50 m transect in a deciduous riparian forest. Jordan et al. (1993) also observed greater than 95%
removal of NO3-N in a deciduous riparian forest adjacent to agricultural land in the Delmarva
Peninsula, Maryland. In Georgia, groundwater NO3-N inputs from cropland that varied seasonally
from 2 to 6 mg L-1
declined rapidly to less than 0.5 mg L-1
within a bottomland hardwood forest
(Lowrance et al., 1984). At a second site in the same watershed, Lowrance (1992) reported a 94%
decrease in NO3-N within a 55 m wide riparian zone. Jacobs and Gilliam (1985) found that NO3-
N declined greater than 90% in shallow groundwater flow from cropland through a riparian area
in North Carolina.
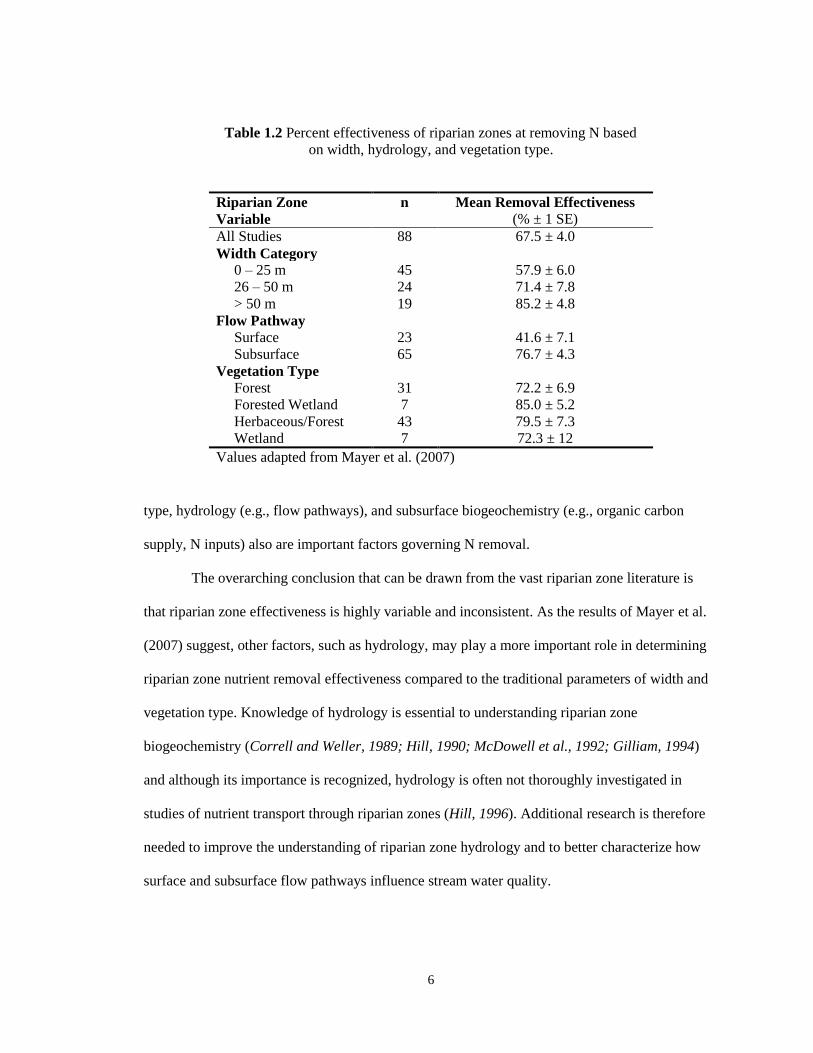
Over the years, numerous studies similar to those summarized above have been
conducted on riparian zones with different widths, hydrology, and vegetation types. A complete
review of riparian zone studies and their findings is beyond the scope of this introductory chapter;
however, Mayer et al. (2007) conducted a meta-analysis of 88 peer-reviewed riparian zone
studies to determine how N retention and/or removal (i.e., riparian zone effectiveness) was related
to the characteristics of the riparian zone (Table 1.2). The authors concluded that N removal
effectiveness varied widely among studies. While wide riparian zones (> 50 m) more consistently
removed significant portions of N than narrow riparian zones (0 – 25 m), riparian zones of
various vegetation types were equally effective at removing N. They also concluded that
subsurface removal of N was efficient, but did not appear to be related to riparian zone width.
Conversely, surface removal of N was partly related to riparian zone width. These results suggest
that riparian zone width is an important consideration in managing N in watersheds. However, the
inconsistent effects of riparian zone width and vegetation on N removal reflect the fact that soil
6
Table 1.2 Percent effectiveness of riparian zones at removing N based
on width, hydrology, and vegetation type.
Riparian Zone n Mean Removal Effectiveness
Variable (% ± 1 SE)
All Studies 88 67.5 ± 4.0
Width Category
0 – 25 m 45 57.9 ± 6.0
26 – 50 m 24 71.4 ± 7.8
> 50 m 19 85.2 ± 4.8
Flow Pathway
Surface 23 41.6 ± 7.1
Subsurface 65 76.7 ± 4.3
Vegetation Type
Forest 31 72.2 ± 6.9
Forested Wetland 7 85.0 ± 5.2
Herbaceous/Forest 43 79.5 ± 7.3
Wetland 7 72.3 ± 12
Values adapted from Mayer et al. (2007)
type, hydrology (e.g., flow pathways), and subsurface biogeochemistry (e.g., organic carbon
supply, N inputs) also are important factors governing N removal.
The overarching conclusion that can be drawn from the vast riparian zone literature is
that riparian zone effectiveness is highly variable and inconsistent. As the results of Mayer et al.
(2007) suggest, other factors, such as hydrology, may play a more important role in determining
riparian zone nutrient removal effectiveness compared to the traditional parameters of width and
vegetation type. Knowledge of hydrology is essential to understanding riparian zone
biogeochemistry (Correll and Weller, 1989; Hill, 1990; McDowell et al., 1992; Gilliam, 1994)
and although its importance is recognized, hydrology is often not thoroughly investigated in
studies of nutrient transport through riparian zones (Hill, 1996). Additional research is therefore
needed to improve the understanding of riparian zone hydrology and to better characterize how
surface and subsurface flow pathways influence stream water quality.

7
Surface water, Groundwater, and their Interaction
Over the past two decades, researchers and conservationists have worked diligently to
develop BMPs to intercept and attenuate nutrients before they enter surface water bodies. While
there has been some success, the effectiveness of these BMPs has varied (Mayer et al., 2007).
Nutrients are typically transported from the agricultural source to the surface water body with the
movement of water; therefore, in order to increase BMP efficacy, it is important to identify and
understand hydrologic processes. In general, there are four major pathways for water and nutrient
transport through the riparian zone to a surface water body (Figure 1.2). Water and nutrients may
move laterally along a shallow confining layer or bedrock (Figure 1.2a), or they may move into
deeper and longer groundwater flow pathways if a confining layer is absent (Figure 1.2b). During
and following precipitation events, water can also be transported across the land surface via faster
flow pathways such as surface runoff (Figure 1.2c). Additionally, water and nutrients moving
through the shallow subsurface may emerge onto the surface as either a seep or spring (Figure
1.2d).
The major problem that has challenged researchers and hindered the success of many
BMPs is that the transport of water and nutrients from agricultural sources to surface water is
typically through a combination of these four major flow pathways. Hydrologic processes can
also vary among seasons, in response to precipitation events, and spatially across the landscape.
The high degree of spatial and temporal variability in hydrologic processes can alter the location,
timing, and duration of N transport from the source to the stream, which makes the design and
placement of BMPs difficult. Emergent groundwater seeps, in many ways, embody the spatial
and temporal variability of hydrologic processes observed in the riparian zone. Water and N are
transported in both surface and subsurface hydrologic components in seeps. Discharge from seeps
can be intermittent and originate from both shallow and deep groundwater flow paths. Seeps also

8
Figure 1.2
Major water and nutrient flow pathways through the riparian zone: a)
shallow groundwater flow; b) deep groundwater flow; c) surface runoff;
and d) spring and seepage flow.
change rapidly in response to precipitation events by expanding and contracting in size. While
seeps are only one of the major flow pathways of water and nutrients through the riparian zone,
their ever-changing characteristics makes them an ideal candidate for studying how dynamic
hydrologic processes affect nutrient transport.
Occurrence and Hydrology of Seeps
Seeps can be found in many watersheds across the U.S. (Pionke et al., 1988) and are
often the predominant source of streamflow in headwater streams (O’Driscoll and DeWalle,
2010). They may occur as simple point sources that emerge at a single location and only gain
groundwater at this emergence point. Seep discharge may interact with vegetation and sediments
A
B
C
D

9
as it flows to the stream channel or it may infiltrate back into the subsurface before entering the
stream. Alternatively, groundwater seepage may emerge at multiple locations along the length of
the seep. It is also likely that a mixture of discrete point inputs, return flows, and new seepage
inputs exist along a single seep (Figure 1.3).
The formation of seep areas in the riparian zone typically takes place in watersheds where
substantial percolation occurs seasonally and the downslope transmission capacity of the
subsurface flow system is restricted due to geologic, geometric, or hydrologic properties (Pionke
et al., 1988). Geologic, geometric, and hydrologic properties that result in seep formation include
low or decreased downslope water table gradients (e.g., decreasing land slope without increased
water storage) (Pionke et al., 1988), small cross-sectional areas (e.g., slope break or reduced
aquifer thickness) (Stein et al., 2004), and reduced permeability (e.g., downgradient shifts from
coarser to finer textured soils or geologic deposits) (Vidon and Hill, 2004). While these properties
establish a large-scale control on the extent and location of seeps, individual or a short series of.
Figure 1.3
Seeps located in a central Pennsylvania headwater catchment
following a precipitation event. The blue line indicates the location of
the stream channel, which flows from left to right.
Seep Seep
10
precipitation events can also serve to generate new seeps or expand existing seepage zones.
Seep hydrologic processes are often hard to quantify due to the complexities and
difficulties associated with accurate discharge measurements in shallow, ill-defined seep channels
(Hill, 1996; O’Driscoll and DeWalle, 2010). Several studies, however, have successfully
measured seep discharge (Baedke and Krothe, 2001; Amit et al., 2002; Gentry and Burbey,
2004). Monitoring of seep discharge and evaluation of hydrographs can provide information on
aquifer properties, such as transmissivity or specific yield, and flow pathways that may be
supplying water to a seep. It also is useful for determining seep contributions to streamflow. In
some instances, seep discharge can constitute more than 95% of streamflow in between
precipitation events (Srinivasan et al., 2002).
Spatial and temporal patterns in stream and seep hydrologic processes in response to
precipitation have also been observed and characterized in a small headwater catchment in the
northeastern U.S. (Pionke et al., 1988). This research has resulted in a conceptual model that
details the hydrologic sources of stream flow during an event and the contributions of seeps.
During a typical event, the source of stream flow cycles from (1) baseflow dominated to (2)
rainfall-diluted baseflow to (3) surface-runoff-dominated flow to (4) a progressively subsurface-
discharge-dominated flow, which then drains back to (5) normal baseflow (Pionke et al., 1988). It
is evident from this model that seeps play an important role in headwater catchment hydrology.
Not only do seeps generate streamflow between precipitation events (i.e., baseflow), but they also
affect streamflow during precipitation events. Seeps can discharge subsurface waters to the land
surface, which can then drain to the stream, and can also be major surface runoff producers.
Additionally, expanding seeps during a precipitation event may interact with previously
unsaturated areas, which impart a different chemical signature than that of the initial contributing
area. Both the expanding seep and the ratio of seepage to surface runoff can result in concomitant
changes in stream water quality.
11
The study by Pionke et al. (1988) highlights the importance of seep hydrologic processes;
yet, few studies have documented the relationship between hydrologic flow pathways in seeps
and water quality. The spatial and temporal patterns in seep water flow pathways likely have a
significant impact on stream water quality. Water and N flowing across the surface or in deep
groundwater flow pathways may bypass the riparian zone, whereas water and N moving in
shallow groundwater may interact with riparian zone sediments and vegetation where the N can
be retained or removed. A better understanding of the chemical-hydrologic interactions in seeps is
therefore needed for more effective BMP design and placement in agricultural headwater
catchments.
Nutrient Dynamics in Seeps
While riparian zones have been commonly shown to reduce N in groundwater by 90% or
more, significant variability in N removal efficiency has been documented (Hill, 1996; Mayer et
al., 2007). Inconsistencies in nutrient removal efficiency may be due to differences in hydrologic
flow pathways through the riparian zone. Previous research has indicated that riparian zones are
highly effective in removing nutrients from shallow groundwater flow pathways that increase
interaction with organic-rich surface soils favoring denitrification and plant uptake (Peterjohn
and Correll, 1984; Haycock and Burt, 1993). In contrast, in landscapes where a shallow
confining layer is absent, groundwater can be transported along deep, slower flow pathways
through the riparian zone. Nutrient removal in these riparian zones has been shown to be less
effective and dependent on interactions with sufficient supplies of electron donors such as organic
carbon and reduced forms of sulfur or iron (Bohlke and Denver, 1995; Devito et al., 2000;
Puckett and Cowdery, 2002; Puckett and Hughes, 2005). Lastly, overland flow produced by
groundwater discharge has resulted in inconsistent nutrient removal (Table 1.3). Some studies of
12
Table 1.3 Summary of studies that document headwater channel, seep, or spring NO3-N
changes along surface flow paths in a variety of geographic settings.
Reference NO3-N conc.
change Sampling technique
Steinheimer et al., 1998 NO3 gain Upstream-downstream sampling
Warwick and Hill, 1988 NS NO3 loss[a]
Tracer enrichment experiments
Hill, 1990 NS NO3 loss Spring flow through wetlands,
upstream-downstream sampling
Rutherford and Nguyen, 2004 NO3 loss Wetland enclosures, tracer
injections
Brusch and Nillson, 1993 NO3 loss Spring flow through wetlands,
upstream-downstream sampling
Peterson et al., 2001 NO3 loss Headwater channels, N isotope
injections
Burns et al., 1998 NO3 loss Spring flow through wetlands,
upstream-downstream sampling [a]
NS = not significant
Table adapted from O’Driscoll and DeWalle (2010)
overland flow pathways have reported substantial removal of nutrients (Brusch and Nilsson,
1993; Rutherford and Nguyen, 2004), whereas others have found ineffective nutrient removal
(Warwick and Hill, 1988; Hill, 1990; Angier et al., 2002, 2005).
Seeps often have both shallow and deep groundwater hydrologic components as well as
overland flow; therefore, they may function both as a conduit and barrier to fluxes of nutrients in
surface runoff and groundwater flowing from upland agricultural sources toward the stream. This
creates the potential for significant spatial and temporal variability of nutrient inputs to streams
(West et al., 2001). Few published studies have documented the variability in surface and
groundwater nutrient cycling and retention along seeps; however, several recent studies have
begun to explore this area. O’Driscoll and DeWalle (2010) investigated the function of seeps in
an Appalachian forested watershed as a source or sink of NO3-N to the stream. They found that at
13
the top of the seep (i.e., emergence point) concentrations of NO3-N were relatively stable year-
round. Seep top groundwater had higher median annual NO3-N concentrations than seep bottom
waters (i.e., where the seep enters the stream channel) (0.51 and 0.35 mg L-1
, respectively), which
suggested an annual retention of NO3-N by seeps. Overall, the study found a high positive
correlation between seep bottom NO3-N and stream outlet NO3-N concentrations, indicating that
seep processes are linked with stream NO3-N concentrations.
A tracer study conducted in New Zealand by Rutherford and Nguyen (2004) provides
further insight into seep nutrient retention and hydrologic processes. Their tracer results showed
that approximately 24% of NO3-N could be removed along a 1.5-m long flow pathway and that
removal efficiency decreased during higher discharge periods because more of the downseep flow
was moving along rapid surface flow pathways as opposed to slower, subsurface pathways. The
tracer concentration data indicated that NO3-N diffusion from high concentration surface waters
to low concentration groundwater may have played an important role in downseep losses of N.
Subsurface residence times on the order of 1 day were deemed sufficient to achieve significant
NO3-N reductions. This suggested that downseep NO3-N concentration bypass events likely
occurred when surface flow pathways dominated the seep discharge. Vertical exchange between
surface water, soil water, and groundwater allowed seep water to spend more time in the
subsurface environment, thereby increasing the potential for biotic assimilation of N or
denitrification, as suggested by Gold et al. (2001) and Rosenblatt et al. (2001).
Spatial and temporal variability in nutrient transport and retention has also been
characterized in terms of ‘hotspots’ and ‘hot moments’ (McClain et al., 2003). Hotspots are
defined as regions that exhibit disproportionately high reaction rates relative to the surrounding
area (matrix). Hot moments are defined as short periods of time that display disproportionately
high reaction rates relative to longer intervening time periods. McCain et al. (2003) proposed that
these phenomena, which are localized in space and time, have large impacts on the fluxes of

14
solutes and thus are critical to furthering our understanding of nutrient cycling. Research indicates
that the development of biogeochemical hotspots and/or hot moments in riparian systems is
generally governed by subtle changes in electron accepter and donor availability, redox
conditions, and hydrologic conditions. Although limited in space and time, biogeochemical
hotspots and hot moments have the ability to alter annual catchment nutrient budgets (Gold et al.,
2001; McClain et al., 2003; Vidon and Hill, 2004; Groffman et al., 2009). Furthermore, transport
hot phenomena are also critical to developing accurate annual nutrient budgets across the stream,
riparian zone, and upland continuum (Wigington et al., 2003). Often, transport hot moments are
associated with episodic hydrological events that occur in response to rainfall or snowmelt.
Transport hotspots generally occur where the water table is closer to the land surface and where
groundwater fluxes can be much larger and of longer duration. Seeps exhibit characteristics that
favor both biogeochemical and transport-driven hotspots and moments. Dynamic hydrologic
conditions, favorable redox potential, and potentially large fluxes of electron donors and
acceptors all occur within a seep. Understanding the spatial and temporal patterns in seep nutrient
retention and the relationship between hydrologic flow pathway and water quality is therefore
critical to managing catchment nutrient budgets. Although seeps are a very small part of a
catchment, they have the potential to exert major controls on streamflow chemistry and
hydrology. Identifying and quantifying seep processes is an important step in understanding how
landscape-level hydrologic dynamics contribute to whole catchment hydrologic and solute
responses.
Research Objectives
The information that is presented in subsequent chapters is an extension of previous work
on seep hydrologic processes and their influence on nutrient transport and stream water quality.
15
The specific objectives of the research project are shown in Table 1.4. Through a unique study
design, the characterization and quantification of flow pathways for water and nutrient transport
in riparian zone seeps of two small agricultural headwater catchments was completed with a high
degree of spatial and temporal resolution. The information gained from this research can be used
to consider which existing BMPs might be most effective at addressing NO3-N emanating from
emergent seeps. Since this project focused on processes and pathways that controlled nutrient
transport, the information gained is applicable to many other sub-catchments within the
Chesapeake Bay.
Table 1.4 Research objectives by chapter.
Chapter Objective
2 a. Investigate the shallow groundwater dynamics and identify key hydrologic
flow pathways within both seep and non-seep areas of the riparian zone
b. Determine the relationship between subsurface hydrologic characteristics
and N concentration within seep and non-seep areas
c. Examine the N transport potential from both areas of the riparian zone
3 a. Investigate chemical and hydrologic interactions within a seep and adjacent
area without a seep using standard hydrometric techniques
b. Examine these interactions in the context of observed subsurface hydrologic
responses visualized with ERI
c. Use the results from objectives (a) and (b) to develop a conceptual model of
seep zone formation, subsurface flow pathways, and N transport in the
riparian zone
4 a. Quantify the variability of N concentration in two agricultural headwater
streams
b. Determine if spatial patterns of stream N concentrations are influenced by
seeps
c. Examine the controls of baseflow and stormflow on in-stream N variability
5 a. Determine the relationship between agricultural N management and seep
NO3-N concentrations
b. Quantify NO3-N retention within seeps and identify potential factors that
influence NO3-N retention
c. Examine seep contributions to stream water NO3-N concentrations at the
catchment outlet
6 a. Summarize the finding and conclusions from the previous chapters
b. Discuss the importance of seeps to watershed N management
c. Evaluate the potential efficacy of BMPs in catchments with seeps
16
References
Amit, H., V. Lyakhovsky, A. Katz, A. Starinsky, and A. Burg. 2002. Interpretation of spring
recession curves. Groundwater 40:543-551.
Angier, J.T., G.W. McCarty, and K.L. Prestegaard. 2005. Hydrology of a first-order riparian zone
and stream, mid-Atlantic coastal plain, Maryland. J. Hydrol. 309:149-166.
Angier, J.T., G.W. McCarty, C.P. Rice, and K. Bialek. 2002. Influence of a riparian wetland on
nitrate and herbicides exported from a field applied with agrochemicals. Journal of
Agriculture and Food Chemistry 50:4424-4429.
Baden, S.P., L. Pihl, and R. Rosenberg. 1990. Effects of oxygen depletion on the ecology, blood
physiology, and fishery of the Norway lobster Nephrops norvegicus. Marine Ecological
Progress Series 67:141-155.
Baedke, S.J., and N.C. Krothe. 2001. Derivation of effective hydraulic parameters of a karst
aquifer from discharge hydrograph analysis. Water Resour. Res. 37:13-19.
Bernhardt, E.S., M.A. Palmer, J.D. Allen, G. Alexander, K. Barnas, S. Brooks, J. Carr, S.
Clayton, C. Dahm, J. Follstad-Shah, D. Galat, S. Gloss, P. Goodwin, D. Hart, B. Hassett,
R. Jenkinson, S. Katz, G.M. Kondolf, P.S. Lake, J.L. Meyer, T.K. O’Donnell, L Pagano,
B. Powell, and E. Sudduth. 2005. Synthesizing U.S. river restoration efforts. Science 308:
636-637.
Boesch, D.F., R.B. Brinsfield, and R.E. Magnien. 2001. Chesapeake Bay eutrophication:
Scientific understanding, ecosystem restoration, and challenges for agriculture. J.
Environ. Qual. 30: 303-320.
Bohlke, J.K., and J.M. Denver. 1995. Combined use of groundwater dating, chemical, and
isotopic analysis to resolve the history and fate of nitrogen contamination in two
agricultural watersheds, Atlantic coastal plain, Maryland. Water Resour. Res. 31: 2319-
2339.
Brusch, W., and B. Nilsson. 1993. Nitrate transformation and water movement in a wetland area.
Hydrobiologia 251: 103-111.
Burns, D.A., P.S. Murdoch, G.B. Lawrence, and R.L. Michel. 1998. Effects of groundwater
springs on NO3- concentration during summer in Catskill Mountain streams. Water
Resour. Res. 34:1987-1996.
Carpenter, S.R., N.F. Caraco, D.L. Correll, R.W. Howarth, A.N. Sharpley, and V.H. Smith. 1998.
Nonpoint pollution of surface waters with phosphorus and nitrogen. Ecol. Appl. 8: 559-
568.
Correll, D.L. 1998. The role of phosphorus in the eutrophication of receiving waters: A review. J.
Environ. Qual. 27: 261-266.
17
Correll, D.L. and D.E. Weller. 1989. Factors limiting processes in freshwater wetlands: An
agricultural primary stream riparian forest. p. 9-23. In R.R. Sharitz and J.W. Gibbons
(ed.) Freshwater wetlands and wildlife. Conf. 8603101. DOE Symp. Sur. U.S. Dep. of
Energy, Washington, DC.
Daniel, T.C., A.N. Sharpley, and J.L. Lemunyon. 1998. Agricultural phosphorus and
eutrophication: A symposium overview. J. Environ. Qual. 27:251-257.
Devito, K.J., D. Fitzgerald, A.R. Hill, and R. Aravena. 2000. Nitrate dynamics in relation to
lithology and hydrologic flow path in a river riparian zone. J. Environ. Qual. 29:1075-
1084.
Gentry, W.M., and T.J. Burbey. 2004. Characterization of groundwater flow from spring
discharge in a crystalline rock environment. J. Am. Water Resour. Assoc. 40:1205-1217.
Gilliam, J.W. 1994. Riparian wetlands and water quality. J. Environ. Qual. 23: 896-900.
Gold, A.J., P.M. Groffman, K. Addy, D.Q. Kellogg, M. Stolt, and A.E. Rosenblatt. 2001.
Landscape attributes as controls on groundwater nitrate removal capacity of riparian
zones. J. Am. Water Res. Assoc. 37:1457-1464.
Groffman, P.M., K. Butterbach-Bahl, W. Fulweiler, A.J. Gold, J. Morse, E. Stander, C. Tague, C.
Tonitto, and P. Vidon. 2009. Incorporating spatially and temporally explicit phenomena
(hotspots and hot moments) in denitrification models. Biogeochemistry 93: 49-77.
Hansson, S., and L.G. Rudstam. 1990. Eutrophication and Baltic fish communities. Ambio
19:123-125.
Haycock, N.E., and T.P. Burt. 1993. Role of floodplain sediments in reducing the nitrate
concentration of subsurface runoff: a case study in the Cotswold, UK. Hydrol. Process.
7:287-295.
Hill, A.R. 1990. Groundwater flow paths in relation to nitrogen chemistry in the near-stream
zone. Hydrobiologia 206:39-52.
Hill, A.R. 1996. Nitrate removal in stream riparian zones. J. Environ. Qual. 25: 743-755.
Jacobs, T.C., and J.W. Gilliam. 1985. Riparian losses of nitrate from agricultural drainage
waters. J. Environ. Qual. 14: 472-478.
Jordan, T.E., D.L. Correll, and D.E. Weller. 1993. Nutrient interception by a riparian forest
receiving inputs from adjacent cropland. J. Environ. Qual. 22:467-473.
Lowrance, R.R. 1992. Groundwater nitrate and denitrification in a coastal riparian forest. J.
Environ. Qual. 21:401-405.
Lowrance, R.R., R. Leonard, and J. Sheridan. 1985. Managing riparian ecosystems to control
nonpoint pollution. J. Soil Water Conserv. 40: 87-91.
18
Lowrance, R.R., R. Todd, J. Fail, O. Hendrickson, R. Leonard, and L. Asmussen. 1984.
Riparian forests as nutrient filters in agricultural watersheds. Bioscience 34:374-377.
Mayer, P.M., S.K. Reynolds Jr., M.D. McCutchen, and T.J. Canfield. 2007. Meta-analysis of
nitrogen removal in riparian buffers. J. Environ. Qual. 36: 1172-1180.
McClain, M.E., E.W. Boyer. C.L. Dent, S.E. Gergel, N.B. Grimm, P.M. Groffman, S.C. Hart,
J.W. Harvey, C.A. Johnson, E. Mayorga, W.H. McDowell, and G. Pinay. 2003.
Biogeochemical hotspots and hot moments at the interface of terrestrial and aquatic
ecosystems. Ecosystems 6:301-312.
McDowell, W.H., W.B. Bowden, and C.E. Asbury. 1992. Riparian nitrogen dynamics in two
geomorphologically distinct tropical rain forest watersheds: Subsurface solute patterns.
Biogeochemistry 18: 53-75.
National Resources Conservation Service. 2003. National handbook of conservation
practices. USDA, Washington, DC.
O’Driscoll, M.A., and D.R. DeWalle. 2010. Seeps regulate stream nitrate concentration in
forested Appalachian catchments. J. Environ. Qual. 39:420-431.
Pennsylvania Department of Environmental Protection. 2010. Pennsylvania watershed
implementation plan. Harrisburg, PA.
Peterjohn, W.T., and D.L. Correll. 1984. Nutrient dynamics in an agricultural watershed:
observations on the role of a riparian forest. Ecology 65:1466-1475.
Peterson, B.J., W.M. Wolheim, P.J. Mulholland, J.R. Webster, J.L. Meyer, J.L. Tank, E. Marti,
W.B. Bowden, H.M. Valett, A.E. Hershey, W.H. McDowell, W.K. Dodds, S.K.
Hamilton, S. Gregory, and D.D. Morrall. 2001. Control of nitrogen export from
watersheds by headwater streams. Science 292:86-90.
Pionke, H.B., J.R. Hoover, R.R. Schnabel, W.J. Gburek, J.B. Urban, and A.S. Rogowski. 1988.
Chemical-hydrologic interactions in the near-stream zone. Water Resour. Res. 24:1101-
1110.
Puckett, L.J., and T.K. Cowdery. 2002. Transport and fate of nitrate in a glacial outwash aquifer
in relation to groundwater age, land use practices, and redox processes. J. Environ. Qual.
31:782-796.
Puckett, L.J., and W.B. Hughes. 2005. Transport and fate of nitrate and pesticides: hydrogeology
and riparian zone processes. J. Environ. Qual. 34:2278-2292.
Rosenblatt, E., A.J. Gold, H.P. Stolt, P.M. Groffman, and D.Q. Kellogg. 2001. Identifying
riparian sinks for watershed nitrate using soil surveys. J. Environ. Qual. 30: 1596-1604.
Rutherford, J.C., and M.L. Nguyen. 2004. Nitrate removal in riparian wetlands: interactions
between surface flow and soils. J. Environ. Qual. 33:1133-1143.

19
Srinivasan, M.S., W.J. Gburek, and J.M. Hamlett. 2002. Dynamics of stormflow generation - a
hillslope-scale field study in east-central Pennsylvania, USA. Hydrol. Process. 16:649-
665.
Steinheimer, T.R., K.D. Scoggin, and L.A. Kramer. 1998. Agricultural chemical movement
through a field-size watershed in Iowa: Subsurface hydrology and nitrate losses in
discharge. Environ. Sci. Technol. 32:1048-1052.
Swanson, F.J., S.V. Gregory, J.R. Sedell, and A.G. Campbell. 1982. Land-water interactions:
The riparian zone. p. 267-291. In R.L. Edmonds (ed.) Analysis of coniferous forest
ecosystems in the western United States. US/IBP Synthesis Ser. 14. Hutchinson Ross
Publ. Co., Stroudsburg, PA.
U.S. Environmental Protection Agency. 2008. National water quality inventory: 2008.
Washington, DC.
Vidon, P.G.F., and A.R. Hill. 2004. Landscape controls on nitrate removal in stream riparian
zones. Water Resour. Res. 40:1-14.
Warwick, J., and A.R. Hill. 1988. Nitrate depletion in the riparian zone of a small woodland
stream. Hydrobiologia 157:231-240.
West, A.J., S.E. Findlay, D.A. Burns, K.C. Weathers, and C.M. Lovett. 2001. Catchment-scale
variation in the nitrate concentration of groundwater seeps in the Catskill Mountains,
New York, USA. Water Air Soil Poll. 132:389-400.
Wigington, P.J., S.M. Griffith, J.A. Field, J.E. Baham, W.R. Horwath, J. Owen, J.H. Davis, S.C.
Rain, and J.J. Steiner. 2003. Nitrate removal effectiveness of a riparian buffer along a
small agricultural stream in western Oregon. J. Environ. Qual. 32: 162-170.
20
CHAPTER 2
Groundwater Flow Path Dynamics and Nitrogen Transport Potential in
the Riparian Zone of an Agricultural Headwater Catchment
Abstract
Stream riparian zones are often thought of as areas that provide natural remediation for
groundwater contaminants, especially agricultural nitrogen (N). While denitrification and
vegetative uptake tend to be efficient processes in slow moving shallow groundwater, these N
removal mechanisms decrease in effectiveness as faster flows through soil macropores and other
preferential flow pathways become dominant. The objective of our study was to characterize N
concentration variability and hydrologic transport pathways through shallow groundwater
draining areas of the riparian zone with and without emergent groundwater seeps. The study was
conducted within FD36, an agricultural headwater catchment in the Ridge and Valley
physiographic region of central Pennsylvania. Three seep and adjacent non-seep areas were
instrumented with a field of 40 piezometers installed in a grid pattern (1.5-m spacing) at both 20-
and 60-cm depths. The piezometers were monitored seasonally for a period of two years (Oct.
2010 – May 2012). Results showed that water table depths within seep areas were variable and
some regions in the seep areas exhibited positive vertical hydraulic gradients of 5 to 10 cm. Non-
seep areas were characterized by a uniform water table surface and were hydrostatic. Discharge
of groundwater onto the land surface was also common in seep areas, but was not observed in
non-seep areas. Ammonium-N (NH4-N) concentrations were mostly low (< 0.1 mg L-1
) and
relatively similar between seep and non-seep areas at each of the three study sites. In contrast,
21
nitrate-N (NO3-N) concentrations in seep areas were significantly greater than the non-seep
areas at two of the study sites. A two-component mixing model indicated that groundwater in
seep areas of FD36 was primarily (53% - 75%) comprised of water from a shallow fractured
aquifer (6-m deep monitoring wells), which was high in NO3-N concentration. Non-seep areas,
however, were comprised (58% - 82%) of perched water on top of the fragipan (1-m deep
monitoring wells) that was likely recharged locally in the riparian zone and was low in NO3-N
concentration. Higher NO3-N concentrations, variable water table elevation, and groundwater
emergence onto the land surface in seep areas provided evidence that preferential flow paths
were an important pathway for water and N in these areas of the riparian zone. Thus, the
potential for N delivery to the stream in FD36 was much greater from seep areas compared to
non-seep areas. To increase N removal efficiency in catchments with seeps, management
practices that target seep areas need to be developed.
Introduction
Nitrogen (N) is one of the most common agricultural contaminants found in groundwater
and surface water around the world (Craig and Weil, 1993; Tesoriero et al., 2000). Due to its
high solubility, N is easily transported in water from agricultural fields to nearby waterways
(Lowrance et al., 1983; Crum et al., 1990; Simmons et al., 1992). Excess N loading of
groundwater and surface water is of concern because it can create conditions that lead to negative
impacts on water quality (e.g., Correll, 1998). For example, eutrophication caused by excessive
inputs of nutrients, such as N, is the most common impairment of surface waters in the U.S. (U.S.
EPA, 2008). Insufficient progress toward N reduction goals and continued poor water quality in
many surface water bodies emphasizes the need to develop management plans to deal with N
pollution from agricultural landscapes.

22
Riparian corridors are often considered to be effective sites for remediation of
agricultural N (Peterjohn and Correll, 1984; Jordan et al., 1993), especially those located along
first-order streams (Peterson et al., 2001). Indeed, a meta-analysis by Mayer et al. (2007)
demonstrated the influence of riparian zones on the supply, transport, and fate of solutes in
headwater catchments. Despite setting aside vegetated riparian zones along waterways in these
headwater settings, significant N loads are still measured at watershed outlets (e.g., Koerkle,
1992). Guidelines for N mitigation measures in riparian zones have typically focused on factors
such as width and vegetation (Mayer et al., 2007), but limited consideration has been given to
hydrologic factors that affect N transport and removal in the riparian zone (Hill, 1996; Angier and
McCarty, 2008). Since water is the medium of transport for N, hydrological processes and
properties of the riparian zone have an impact on N transport and delivery to streams. For
instance, the transmissivity of riparian sediments can influence N dynamics, as groundwater
residence time within the subsurface affects N behavior (Jacinthe et al., 1998; Rutherford and
Nyugen, 2004). Differences in flow paths can also affect groundwater (Calver, 1990) and
contaminant delivery patterns (Harvey and Nuttle, 1995; Angier et al., 2001).
Most conceptual models of riparian zone hydrology in agricultural catchments assume
uniform, lateral subsurface flow from an upland field, through the riparian zone, and ultimately to
a stream (Jordan et al., 1993; Bosch et al., 1994). These models suggest a scenario in which there
is sufficient contact time between groundwater and the soil matrix to facilitate N removal. While
many riparian zones have sediment layers with high N removal potential (Groffman et al., 1992),
the presence of environmental conditions suitable for N removal (e.g., soils high in organic
carbon, anaerobic conditions, vegetation) alone may be insufficient to remove N from
groundwater if flow paths deviate from uniform lateral flow. Recent research has suggested that
much of the groundwater may travel through preferential subsurface flow paths, even in the
presence of an aquiclude (e.g., fragipan) occurring at shallow depth (Hill et al., 2000; Angier et
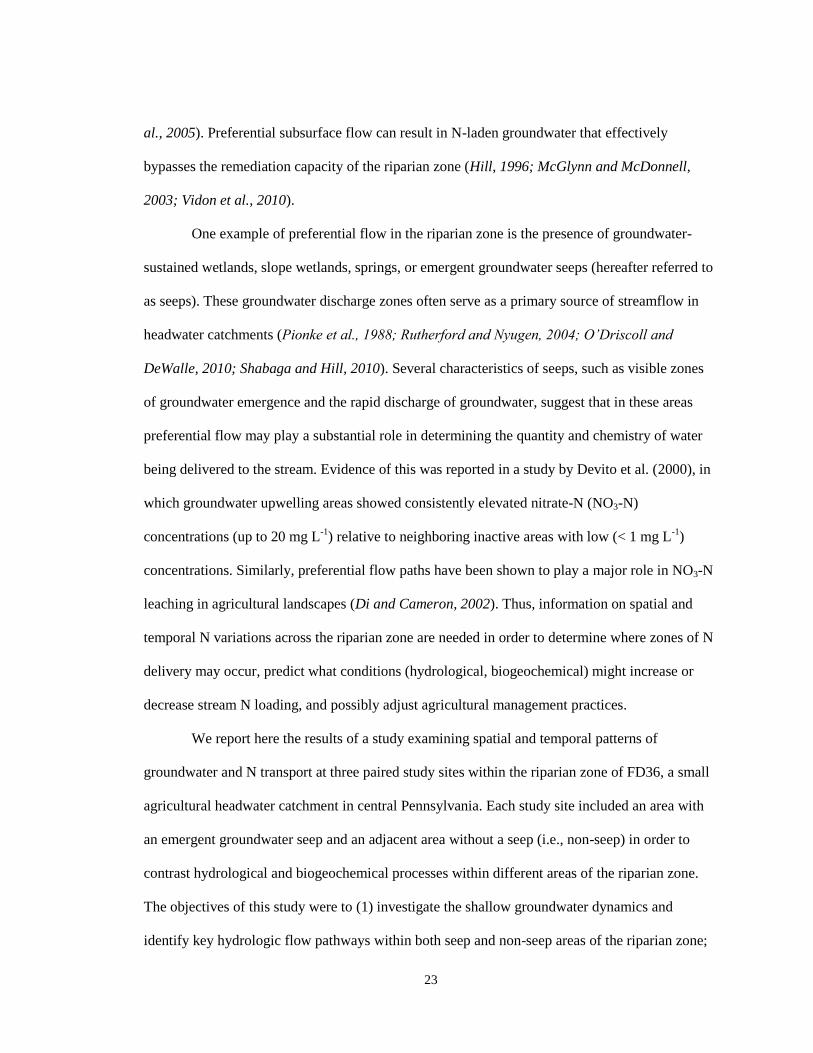
23
al., 2005). Preferential subsurface flow can result in N-laden groundwater that effectively
bypasses the remediation capacity of the riparian zone (Hill, 1996; McGlynn and McDonnell,
2003; Vidon et al., 2010).
One example of preferential flow in the riparian zone is the presence of groundwater-
sustained wetlands, slope wetlands, springs, or emergent groundwater seeps (hereafter referred to
as seeps). These groundwater discharge zones often serve as a primary source of streamflow in
headwater catchments (Pionke et al., 1988; Rutherford and Nyugen, 2004; O’Driscoll and
DeWalle, 2010; Shabaga and Hill, 2010). Several characteristics of seeps, such as visible zones
of groundwater emergence and the rapid discharge of groundwater, suggest that in these areas
preferential flow may play a substantial role in determining the quantity and chemistry of water
being delivered to the stream. Evidence of this was reported in a study by Devito et al. (2000), in
which groundwater upwelling areas showed consistently elevated nitrate-N (NO3-N)
concentrations (up to 20 mg L-1
) relative to neighboring inactive areas with low (< 1 mg L-1
)
concentrations. Similarly, preferential flow paths have been shown to play a major role in NO3-N
leaching in agricultural landscapes (Di and Cameron, 2002). Thus, information on spatial and
temporal N variations across the riparian zone are needed in order to determine where zones of N
delivery may occur, predict what conditions (hydrological, biogeochemical) might increase or
decrease stream N loading, and possibly adjust agricultural management practices.
We report here the results of a study examining spatial and temporal patterns of
groundwater and N transport at three paired study sites within the riparian zone of FD36, a small
agricultural headwater catchment in central Pennsylvania. Each study site included an area with
an emergent groundwater seep and an adjacent area without a seep (i.e., non-seep) in order to
contrast hydrological and biogeochemical processes within different areas of the riparian zone.
The objectives of this study were to (1) investigate the shallow groundwater dynamics and
identify key hydrologic flow pathways within both seep and non-seep areas of the riparian zone;
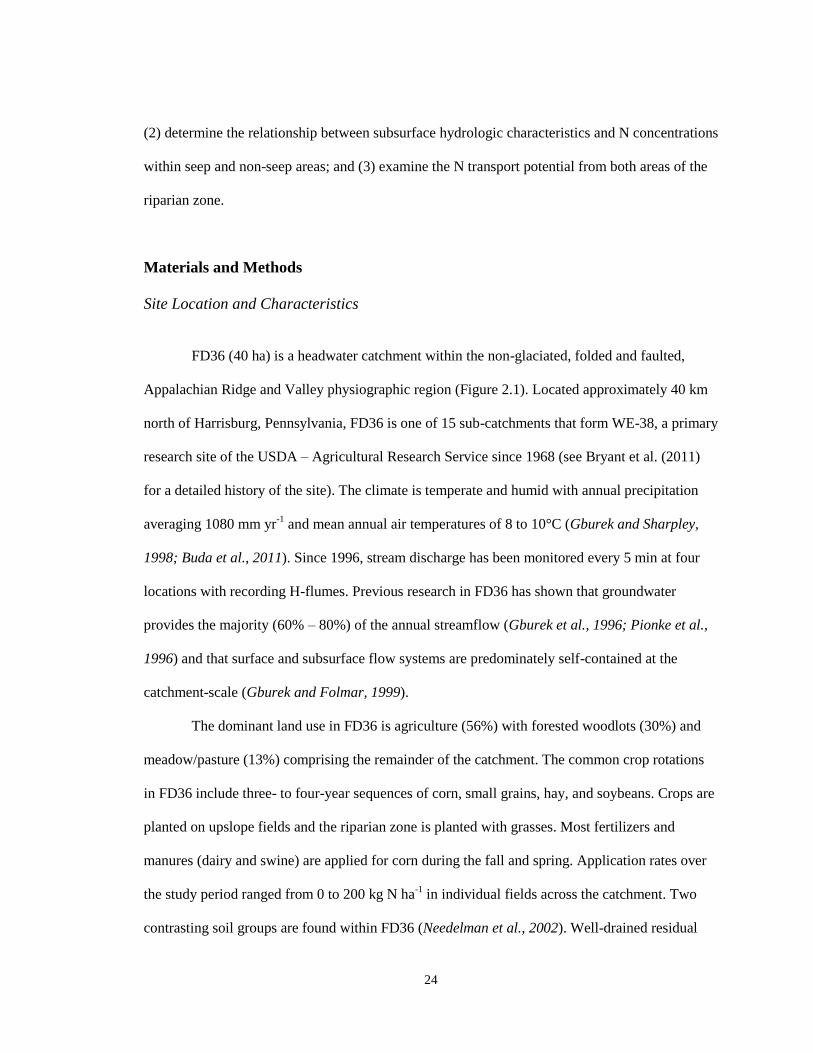
24
(2) determine the relationship between subsurface hydrologic characteristics and N concentrations
within seep and non-seep areas; and (3) examine the N transport potential from both areas of the
riparian zone.
Materials and Methods
Site Location and Characteristics
FD36 (40 ha) is a headwater catchment within the non-glaciated, folded and faulted,
Appalachian Ridge and Valley physiographic region (Figure 2.1). Located approximately 40 km
north of Harrisburg, Pennsylvania, FD36 is one of 15 sub-catchments that form WE-38, a primary
research site of the USDA – Agricultural Research Service since 1968 (see Bryant et al. (2011)
for a detailed history of the site). The climate is temperate and humid with annual precipitation
averaging 1080 mm yr-1
and mean annual air temperatures of 8 to 10°C (Gburek and Sharpley,
1998; Buda et al., 2011). Since 1996, stream discharge has been monitored every 5 min at four
locations with recording H-flumes. Previous research in FD36 has shown that groundwater
provides the majority (60% – 80%) of the annual streamflow (Gburek et al., 1996; Pionke et al.,
1996) and that surface and subsurface flow systems are predominately self-contained at the
catchment-scale (Gburek and Folmar, 1999).
The dominant land use in FD36 is agriculture (56%) with forested woodlots (30%) and
meadow/pasture (13%) comprising the remainder of the catchment. The common crop rotations
in FD36 include three- to four-year sequences of corn, small grains, hay, and soybeans. Crops are
planted on upslope fields and the riparian zone is planted with grasses. Most fertilizers and
manures (dairy and swine) are applied for corn during the fall and spring. Application rates over
the study period ranged from 0 to 200 kg N ha-1
in individual fields across the catchment. Two
contrasting soil groups are found within FD36 (Needelman et al., 2002). Well-drained residual
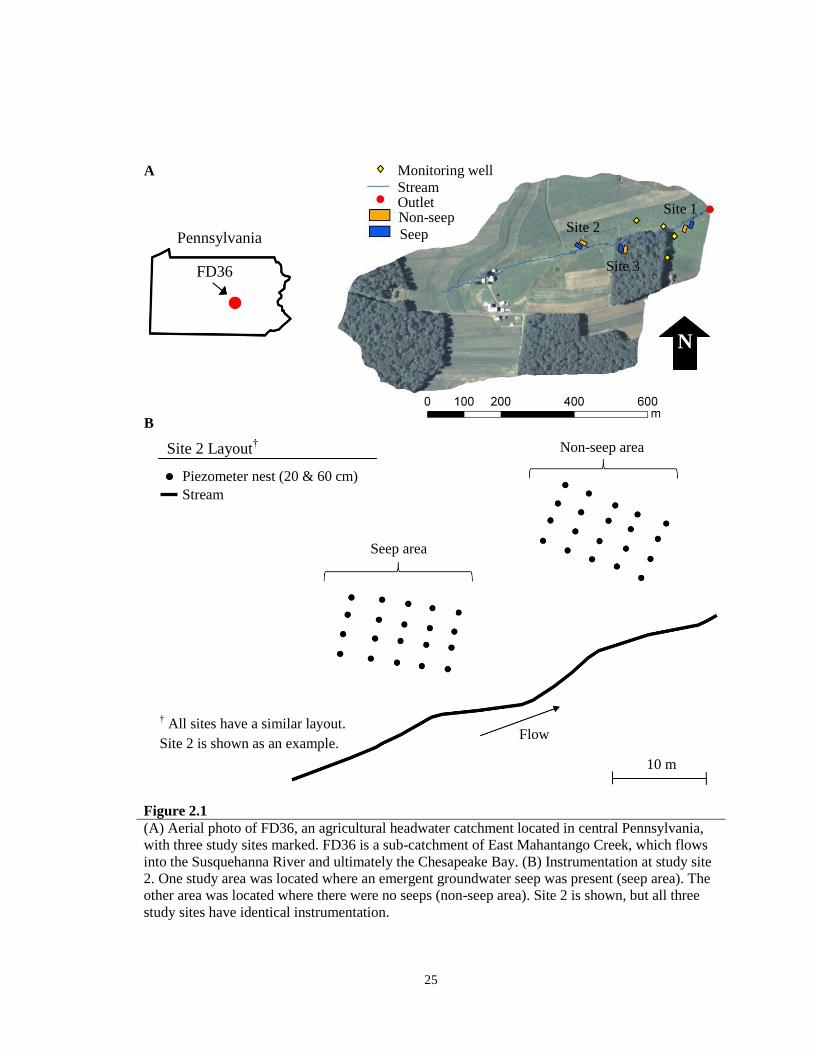
25
Figure 2.1
(A) Aerial photo of FD36, an agricultural headwater catchment located in central Pennsylvania,
with three study sites marked. FD36 is a sub-catchment of East Mahantango Creek, which flows
into the Susquehanna River and ultimately the Chesapeake Bay. (B) Instrumentation at study site
2. One study area was located where an emergent groundwater seep was present (seep area). The
other area was located where there were no seeps (non-seep area). Site 2 is shown, but all three
study sites have identical instrumentation.
N
Stream Outlet Non-seep
Seep Pennsylvania
FD36
Site 2
Site 3
Site 1
Non-seep area
Seep area
10 m
Flow
Site 2 Layout†
Piezometer nest (20 & 60 cm)
† All sites have a similar layout.
Site 2 is shown as an example.
Stream
A
B
Monitoring well
26
soils that are typically stony, silt loams (Leck Kill, Calvin, Berks series) line the hillslopes, while
colluvial soils (Albrights and Hustontown series) are distributed along the stream and valley
floor. The Albrights and Hustontown soils in the riparian zone have a moderately well-developed
fragipan beginning at a depth of 0.5 to 0.7 m and have low permeability. Slopes in FD36 range
from 1% to 20%. The steepest slopes are found on the midslopes (~20%), while gentler slopes
occur on the shoulders and on the footslopes.
Three study sites within the riparian zone of FD36 were chosen for intensive monitoring
of subsurface hydrology and N transport potential (Figure 2.1). The study sites were chosen to
represent areas of the riparian zone downslope of the three main land uses within the catchment
(i.e., agriculture [site 2], forest [site 3], and meadow/pasture [site 1]). At each study site,
monitoring was conducted in a zone of emergent groundwater seepage (seep area), as well as in
an adjacent region without an emergent groundwater seep (non-seep area) (Figure 2.1). Both seep
and non-seep areas at all three study sites were instrumented identically with five transects (6-m
long) of nested piezometers (Figure 2.1), which were installed perpendicular to the flow of water
in the riparian zone. Each piezometer transect contained four pairs of piezometers installed at
depths of 20 and 60 cm with a spacing of 1.5 m between pairs of piezometers. All piezometers
were screened at the bottom 8 cm. The depths of the piezometers were chosen to best represent
the soil properties at the study sites (20 cm – Ap horizon boundary; 60 cm – top of fragipan). In
addition, four pairs of monitoring wells (1- and 6-m deep) were installed outside of the study sites
and were sampled concurrently with the piezometers (Figure 2.1). All monitoring wells were
screened at the bottom 0.5 m. The shallow wells (1 m) sampled perched water above the fragipan
that is likely recharged locally. In contrast, the deep wells (6 m) sampled a fractured aquifer
below the fragipan that provides the majority of streamflow in FD36 (Pionke and Urban, 1985;
Schnabel et al., 1993; Lindsey et al, 2003).
27
Field Sampling and Laboratory Analysis
Water samples were collected from the piezometers at each study site as well as the
monitoring wells on nine occasions between October 2010 and May 2012. Sample collection
immediately followed precipitation events in order to ensure that water samples could be
collected from the non-seep areas within each site. Within one week following a precipitation
event, approximately one well volume of water was removed from the piezometers using a
peristaltic pump. Then, two days later, the depth of the water table was measured in both the 20-
and 60-cm deep piezometers at each site and water samples were collected in 125 mL plastic
(HDPE) bottles. On return to the laboratory, water samples were filtered (0.45 µm) and then later
analyzed with a Lachat QuikChem FIA+ autoanalyzer (QuikChem Methods FIA+ 8000 Series,
Lachat Instruments, Loveland, Colorado) to determine concentrations of NO3-N, ammonium-N
(NH4-N), and chloride (Cl-). Total N was determined on unfiltered samples following alkaline
persulfate digestion (Patton and Kryskalla, 2003). Concentrations of dissolved inorganic-N (NO3-
N + NH4-N) comprised, on average, 95% of total N. Thus, the main focus of this paper is on
NO3-N and NH4-N.
Statistics and Data Analysis
To determine spatial patterns of shallow groundwater flow, ordinary kriging was used to
interpolate water table depth measurements within each study site. In addition, Moran’s I was
calculated to examine spatial autocorrelation in water table depth within seep and non-seep areas
for all sampling dates (O’Sullivan and Unwin, 2010). Statistical significance of spatial
autocorrelation was completed with a Monte Carlo simulation, which randomly shuffled the
observed water table depth values on a single sampling date and recalculated Moran’s I to
determine a sampling distribution. Differences in water table depth and N concentration within a
28
single site (i.e., seep area vs. non-seep area) were evaluated by ANOVA. Pairwise comparisons
were made using Tukey’s Studentized Range (HSD) test in order to separate treatment means.
Furthermore, the least squares estimation method was performed to obtain Pearson correlation
coefficients to measure the strength of linear relationship between NH4-N concentration, NO3-N
concentration, Cl- concentration, and water table depth within a site.
A two-component mixing model (Hill, 1991) was used to ascertain the relative
contributions of perched water above the fragipan (1-m deep wells) and groundwater from the
fractured aquifer (6-m deep wells) to seep and non-seep areas. Chloride was used to separate
these two water sources because it is non-reactive and serves as an ideal conservative tracer of
water flow pathways (Davis et al., 2006). The model was calculated as QFractured/QPiezometer =
(CPiezometer – CPerched)/(CFractured – CPerched), where QFractured/QPiezometer is the proportion of
groundwater from the fractured aquifer to seep and non-seep areas, CPiezometer is the Cl-
concentration of the 60-cm deep piezometers, CFractured is the Cl- concentration of the 6-m deep
monitoring wells, and CPerched is the Cl- concentration of the 1-m deep monitoring wells. All
statistical analyses were completed in R statistical software package (R Foundation for Statistical
Computing, 2011). A probability level of 0.05 was used to evaluate statistical significance in all
analyses.
Results
Piezometer N Concentration
Ammonium-N concentration measured in piezometers comprised a relatively small
fraction (1% - 5%) of the total inorganic N (NH4-N + NO3-N) in seep and non-seep areas at all
three study sites. On most sampling dates, mean NH4-N concentrations were 0.1 mg L-1
or less
(data not shown). The highest mean NH4-N concentration for all three sites occurred on May 31,
29
2012 in which concentrations averaged 0.3 mg L-1
. In contrast to piezometer NH4-N
concentrations, piezometer NO3-N concentrations varied spatially within each site as well as
temporally throughout the study period (Figure 2.2). Mean NO3-N concentration was
significantly greater in seep areas compared to non-seep areas in sites 1 and 2, but not in site 3 (p
< 0.03) (Figure 2.2). Nitrate-N concentrations in the seep areas averaged 1.9, 2.6, and 1.3 mg L-1
in sites 1, 2, and 3, respectively, and NO3-N concentrations did not vary significantly by depth
(Figure 2.2). Depth, however, was a significant factor affecting NO3-N concentrations in non-
seep areas of sites 1 and 3. Mean NO3-N concentration at the 60-cm depth was significantly
greater than mean NO3-N concentration at the 20-cm depth (p < 0.01) (Figure 2.2).
Temporal patterns in piezometer NO3-N concentrations at site 1, which was downslope of
a pasture/meadow land use, were relatively stable over the study period in both seep and non-seep
areas, except on Aug. 31, 2011 when mean NO3-N concentrations of 5.9 and 4.2 mg L-1
,
respectively, were measured. Site 2, which was downslope of cropped fields, exhibited the most
variability in NO3-N concentration over the study period compared to sites 1 and 3, especially in
the seep area (Figure 2.2). Nitrate-N concentration in the seep area of site 2 ranged between 1.3
and 5.0 mg L-1
over the study period. The non-seep area in site 2 was also the only area that was
dry (i.e., water table depth > 60 cm) on several sampling dates (3 out of 9 sampling dates; 33%).
The seep and non-seep areas in site 3, the forested site, showed little variability in NO3-N
concentrations compared to sites 1 and 2.
Monitoring Well N Concentration
Similar to NH4-N concentrations measured in piezometers, NH4-N concentrations in the
four monitoring wells were low and were often less than 0.1 mg L-1
(data not shown). Mean NH4-
N concentrations were between 0.1 and 0.3 mg L-1
for all monitoring wells and NH4-N

30
Area Time
Figure 2.2
Mean groundwater NO3-N concentration measured from piezometers in seep and non-seep areas
of three riparian zone study sites in FD36. (A) Site 1; (B) Site 2; and (C) Site 3. Lower case
letters denote statistical significance (p < 0.05) between depths (20 and 60 cm) within each seep
or non-seep area. Upper case letters denote statistical significance (p < 0.05) between seep and
non-seep areas. Differences in concentration among sites were not analyzed. Error bars represent
standard error. Temporal patterns were based on mean NO3-N concentrations from both 20- and
60-cm depths.
0
1
2
3
4
Non-seep Seep
a
b
a a
B A
0
2
4
6
8
9/1 11/1 1/1 3/3 5/3 7/3 9/2 11/2 1/2 3/3 5/3 7/3
0
1
2
3
4
Non-seep Seep
a a
a a
B A
0
2
4
6
8
9/1 11/1 1/1 3/3 5/3 7/3 9/2 11/2 1/2 3/3 5/3 7/3
0
1
2
3
4
Non-seep Seep
a
b
a a
A A
0
2
4
6
8
9/1 11/1 1/1 3/3 5/3 7/3 9/2 11/2 1/2 3/3 5/3 7/3
2010
Nov. Mar. Jul. Nov. Mar. Jul.
2010 2011 2012
Seep Non-seep
20 cm 60 cm
Nov. Nov. Mar. Mar. Jul. Jul.
2011 2012
Nov. Nov. Mar. Mar. Jul. Jul.
2010 2011 2012
NO
3-N
Con
cen
trati
on
(m
g L
-1)
B (Site 2)
A (Site 1)
C (Site 3)
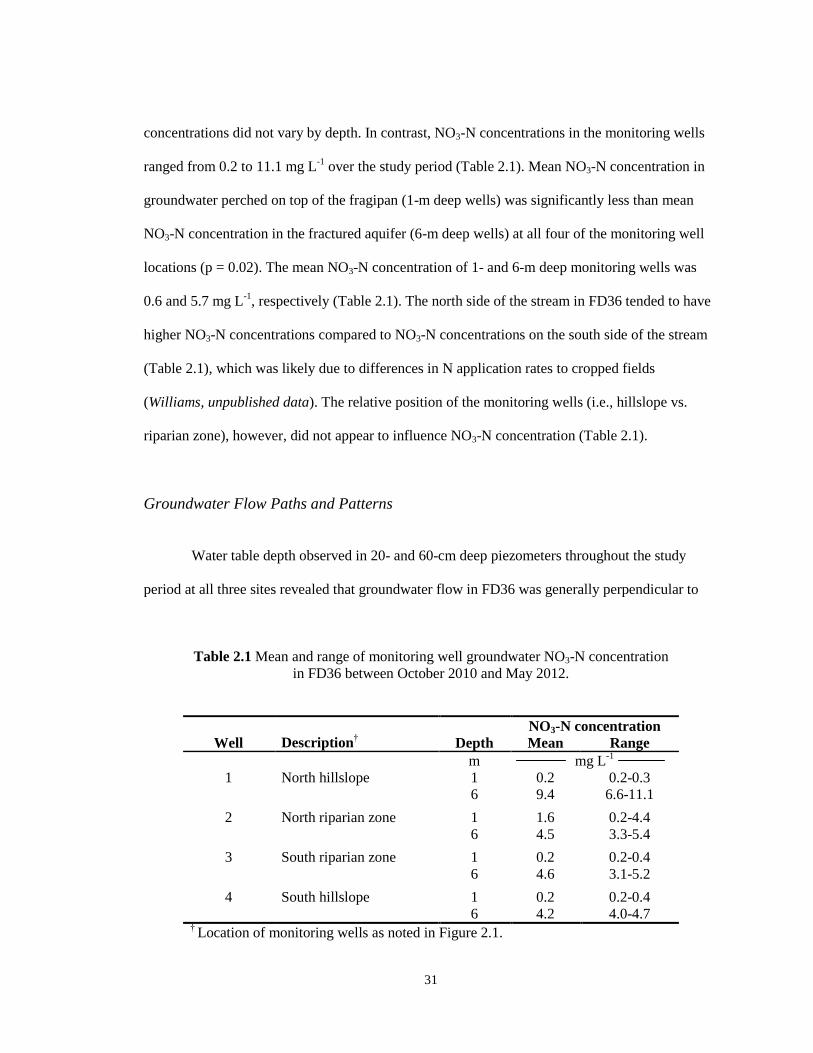
31
concentrations did not vary by depth. In contrast, NO3-N concentrations in the monitoring wells
ranged from 0.2 to 11.1 mg L-1
over the study period (Table 2.1). Mean NO3-N concentration in
groundwater perched on top of the fragipan (1-m deep wells) was significantly less than mean
NO3-N concentration in the fractured aquifer (6-m deep wells) at all four of the monitoring well
locations (p = 0.02). The mean NO3-N concentration of 1- and 6-m deep monitoring wells was
0.6 and 5.7 mg L-1
, respectively (Table 2.1). The north side of the stream in FD36 tended to have
higher NO3-N concentrations compared to NO3-N concentrations on the south side of the stream
(Table 2.1), which was likely due to differences in N application rates to cropped fields
(Williams, unpublished data). The relative position of the monitoring wells (i.e., hillslope vs.
riparian zone), however, did not appear to influence NO3-N concentration (Table 2.1).
Groundwater Flow Paths and Patterns
Water table depth observed in 20- and 60-cm deep piezometers throughout the study
period at all three sites revealed that groundwater flow in FD36 was generally perpendicular to
Table 2.1 Mean and range of monitoring well groundwater NO3-N concentration
in FD36 between October 2010 and May 2012.
NO3-N concentration
Well Description† Depth Mean Range
m mg L-1
1 North hillslope 1 0.2 0.2-0.3
6 9.4 6.6-11.1
2 North riparian zone 1 1.6 0.2-4.4
6 4.5 3.3-5.4
3 South riparian zone 1 0.2 0.2-0.4
6 4.6 3.1-5.2
4 South hillslope 1 0.2 0.2-0.4
6 4.2 4.0-4.7 † Location of monitoring wells as noted in Figure 2.1.

32
the stream. Site 2 tended to have a water table depth that was closer to the land surface compared
to sites 1 and 3; however, mean water table depth did not differ significantly among sites (Table
2.2). Within each site, mean water table depth in seep and non-seep areas was also not
significantly different on any sampling date; although, the water table in seep areas was typically
closer to the land surface (Table 2.2). While mean water table depth was similar between seep
and non-seep areas within each site, water table depth was substantially more variable in seep
Table 2.2 Water table depth and variability in seep and non-seep areas of three riparian zone study
sites in FD36 from October 2010 to May 2012.
Site 1 Site 2 Site 3
Date Area† n
‡
Mean ±
Std. Dev. Range n‡
Mean ±
Std. Dev. Range n‡
Mean ±
Std. Dev. Range
cm cm cm
2010
Oct. 5 S 16 22 ± 18* 50 20 11 ± 15* 43 n/a n/a§ n/a
NS 14 36 ± 14 43 20 26 ± 5 16 n/a n/a n/a
Nov. 23 S 10 44 ± 9 29 7 45 ± 10 26 14 36 ± 16* 56
NS 4 52 ± 1 3 0 19 37 ± 6 17
2011
Mar. 14 S 20 10 ± 21* 50 20 -1 ± 7* 27 20 10 ± 17* 56
NS 20 15 ± 11 39 20 7 ± 3 12 20 8 ± 7 22
May 6 S 17 24 ± 23* 52 20 4 ± 14* 45 20 4 ± 12* 48
NS 14 36 ± 14 43 20 6 ± 7 29 20 14 ± 14 36
Aug. 30 S 18 19 ± 13* 40 20 19 ± 7* 30 9 26 ± 11* 50
NS 20 24 ± 2 8 18 38 ± 8 25 5 46 ± 2 6
Sept. 13 S 19 19 ± 16* 38 20 10 ± 8* 20 20 30 ± 16* 55
NS 20 13 ± 4 13 17 28 ± 5 16 19 25 ± 9 31
2012
Jan. 11 S 15 41 ± 8 30 7 45 ± 13 35 20 24 ± 16* 58
NS 15 47 ± 4 14 0 20 25 ± 8 23
Apr. 25 S 16 24 ± 17* 51 7 37 ± 10 29 20 5 ± 12* 34
NS 19 25 ± 13 40 0 20 17 ± 6 23
May 31 S 20 10 ± 12* 33 19 1 ± 3* 16 20 1 ± 10* 35
NS 20 9 ± 3 10 20 3 ± 3 15 20 11 ± 6 21 † S = Seep; NS = Non-seep
‡ Number of 60-cm deep piezometers that had a measurable water depth (max. = 20).
§ Site 3 was not instrumented until after the Oct. 5, 2010 sampling date.
* Visible discharge of groundwater onto the land surface was observed.
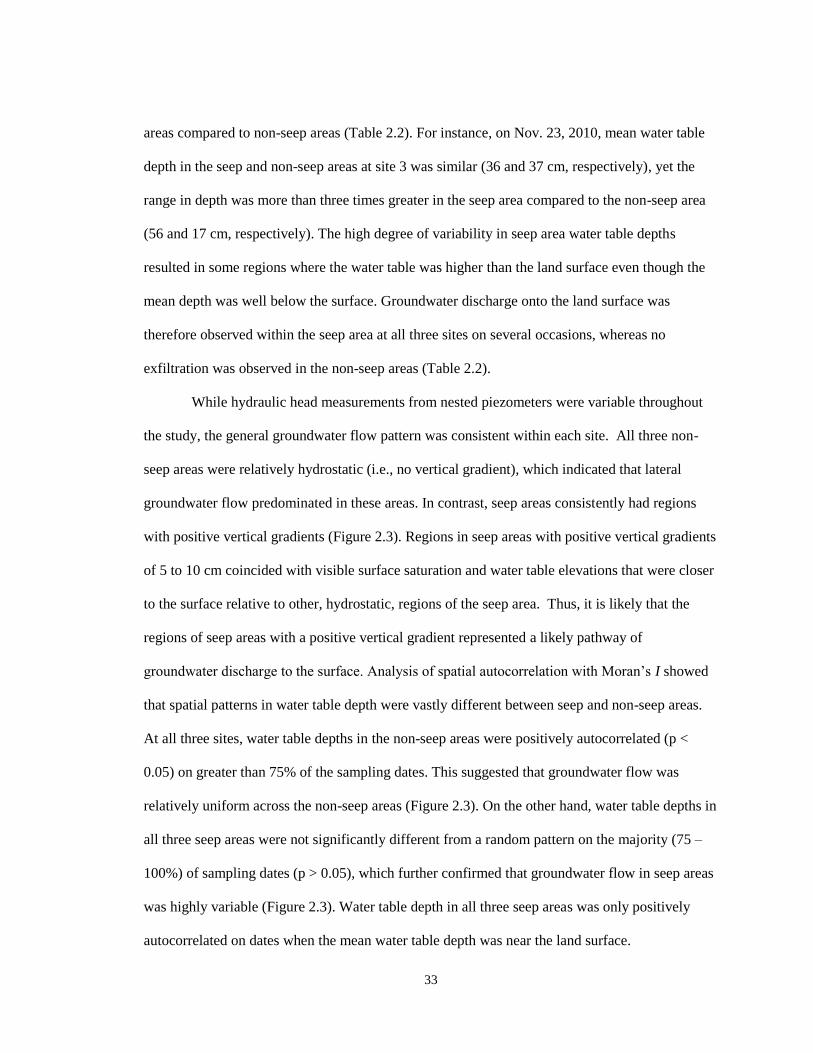
33
areas compared to non-seep areas (Table 2.2). For instance, on Nov. 23, 2010, mean water table
depth in the seep and non-seep areas at site 3 was similar (36 and 37 cm, respectively), yet the
range in depth was more than three times greater in the seep area compared to the non-seep area
(56 and 17 cm, respectively). The high degree of variability in seep area water table depths
resulted in some regions where the water table was higher than the land surface even though the
mean depth was well below the surface. Groundwater discharge onto the land surface was
therefore observed within the seep area at all three sites on several occasions, whereas no
exfiltration was observed in the non-seep areas (Table 2.2).
While hydraulic head measurements from nested piezometers were variable throughout
the study, the general groundwater flow pattern was consistent within each site. All three non-
seep areas were relatively hydrostatic (i.e., no vertical gradient), which indicated that lateral
groundwater flow predominated in these areas. In contrast, seep areas consistently had regions
with positive vertical gradients (Figure 2.3). Regions in seep areas with positive vertical gradients
of 5 to 10 cm coincided with visible surface saturation and water table elevations that were closer
to the surface relative to other, hydrostatic, regions of the seep area. Thus, it is likely that the
regions of seep areas with a positive vertical gradient represented a likely pathway of
groundwater discharge to the surface. Analysis of spatial autocorrelation with Moran’s I showed
that spatial patterns in water table depth were vastly different between seep and non-seep areas.
At all three sites, water table depths in the non-seep areas were positively autocorrelated (p <
0.05) on greater than 75% of the sampling dates. This suggested that groundwater flow was
relatively uniform across the non-seep areas (Figure 2.3). On the other hand, water table depths in
all three seep areas were not significantly different from a random pattern on the majority (75 –
100%) of sampling dates (p > 0.05), which further confirmed that groundwater flow in seep areas
was highly variable (Figure 2.3). Water table depth in all three seep areas was only positively
autocorrelated on dates when the mean water table depth was near the land surface.

34
Seep area Non-seep area
Figure 2.3
Spatial distribution of water table depth in seep (left column) and non-seep (right column) areas
of three riparian zone study sites in FD36 on Mar. 14, 2011. (A) Site 1; (B) Site 2; and (C) Site 3.
Water table depths were interpolated with ordinary kriging. The land surface is located at 0 cm.
Water table depths were measured from the 60-cm deep piezometers in each area, which are
labeled with an x in the figure. The stream channel is located below all three study sites; thus,
groundwater flow is from the top of the image toward the bottom of the image for all areas.
Highlighted (dashed) areas on the seep figures indicate regions where positive vertical hydraulic
gradients were observed throughout the study. Arrows indicate seep surface flow paths that were
the result of groundwater upwelling.
Kriging Prediction
0
10
20
30
40
50
60
Kriging Prediction
0
10
20
30
40
50
60
Kriging Prediction
0
10
20
30
40
50
60
Kriging Prediction
0
10
20
30
40
50
60
Kriging Prediction
-5
0
5
10
15
20
Kriging Prediction
0
10
20
30
40
50
60
Kriging Prediction
0
10
20
30
40
50
60
0
10
20
30
40
50
60
Wate
r ta
ble
dep
th b
elo
w t
he
lan
d
surf
ace
(cm
)
A (Site 1)
B (Site 2)
C (Site 3)
6 m
1.5 m

35
Relationship between N Concentration and Hydrology
Seep areas in all three study sites had significantly greater Cl- concentrations in
piezometers compared to non-seep areas (p < 0.001) (Table 2.3). On average, Cl- concentrations
in seep areas were 1.5 to 2.0 times greater in seep areas compared to non-seep areas. Piezometer
Cl- concentrations within seep areas were also significantly greater at the 60-cm depth compared
to the 20-cm depth (Table 2.3). Chloride concentrations in monitoring wells also varied
significantly by depth (p < 0.001) (Table 2.3). Using the monitoring well Cl- concentrations as
end-members in a two-component mixing model, the contribution of groundwater from the
fractured aquifer (6-m deep wells) to seep and non-seep areas was calculated (Figure 2.4). In all
three study sites, the majority of groundwater in seep areas appeared to originate from the
fractured aquifer, whereas, in the non-seep areas, the majority of water was from perched
groundwater on top of the fragipan. The fractured aquifer comprised 69%, 53%, and 75% of the
groundwater in seep areas at sites 1, 2, and 3, respectively (Figure 2.4). In contrast, it only
Table 2.3 Mean Cl- concentration from piezometers in seep and non-seep
areas of three riparian zone study sites, as well as mean monitoring well Cl-
concentration.
Piezometer Cl- conc.
Monitoring well
Cl- conc.
Area Depth Site 1 Site 2 Site 3 Depth All wells
cm mg L-1
m mg L-1
Seep 20 5.5b†
A‡ 4.2b
A 5.6b
A 1.0 1.5b
60 6.0a 5.3a 6.6a 6.0 7.7a
Non-seep 20 2.5a B
3.3a B
3.9a B
60 2.7a 3.6a 4.3a † Lower case letters denote statistical significance (p < 0.05) between depths
(20 and 60 cm) within each seep or non-seep area. ‡ Upper case letters denote statistical significance (p < 0.05) between seep and
non-seep areas. Differences in concentration among sites were not analyzed.

36
comprised 18%, 32%, and 42% of groundwater in the non-seep areas of sites 1, 2, and 3,
respectively (Figure 2.4).
Piezometer NO3-N and Cl- concentrations were positively correlated at sites 1 and 2, but
not at site 3 (R2 = 0.67 and 0.43, respectively) (Table 2.4, Figure 2.5). Similarly, piezometer NO3-
N concentrations at sites 1 and 2 were significantly correlated with water table depth (Table 2.4,
Figure 2.5). Piezometer Cl- concentrations and water table depths, however, were significantly
correlated at all three sites (R2 = -0.20, -0.39, and -0.33, respectively) (Table 2.4, Figure 2.5).
Ammonium-N concentrations in piezometers were not related to NO3-N concentrations, Cl-
concentrations, or water table depths at any of the three sites.
Site 1 Site 2 Site 3
Figure 2.4
Mean percentage of groundwater that was attributed to either perched
groundwater on top of the fragipan or the shallow fractured aquifer.
Percentages were calculated from mean piezometer (20- and 60-cm depths)
and monitoring well Cl- concentrations with a two component mixing model.
(A) Seep area; (B) Non-seep area.
31% 69%
A (Seep)
47% 53% 25% 75%
82%
18%
Perched groundwater on
top of the fragipan (1-m
deep well)
B (Non-seep)
32% 68%
Groundwater from the
shallow fractured aquifer
(6-m deep well)
58% 42%

37
Cl
- concentration (mg L
-1) Water table elevation (cm)
Figure 2.5
Mean Cl- concentration (A) and water table depth (B) measured in piezometers at site 2 compared
with mean NO3-N concentration during the study period (p < 0.001 and p = 0.004, respectively).
Both 20- and 60-cm deep piezometers were used in the analysis of Cl- concentration vs. NO3-N,
whereas only the 60-cm deep piezometers were used for the water table depth vs. NO3-N because
the 20-cm deep piezometers were often dry. Site 2 was chosen as an example; data for all three
study sites are shown in Table 2.4.
Table 2.4 Pearson correlation coefficients and p values (in parentheses) for correlations
among piezometer NH4-N concentration, NO3-N concentration, Cl- concentration, and
water table depth from three riparian zone seep areas in FD36. Italics indicate correlation
is significant at p < 0.05.
NH4-N NO3-N Cl-
mg L-1
Site 1
NO3-N mg L-1
-0.12 (0.187)
Cl- mg L
-1 -0.05 (0.244) 0.67 (<0.001)
Water table depth cm -0.01 (0.563) -0.27 (0.001) -0.20 (0.004)
Site 2 NO3-N mg L
-1 0.01 (0.730)
Cl- mg L
-1 0.00 (0.909) 0.42 (<0.001)
Water table depth cm 0.06 (0.118) -0.38 (<0.001) -0.39 (<0.001)
Site 3 NO3-N mg L
-1 0.01 (0.776)
Cl- mg L
-1 -0.03 (0.165) 0.04 (0.084)
Water table depth cm 0.07 (0.092) -0.03 (0.269) -0.33 (<0.001)
0
2
4
6
0 3 6 9
R2 = 0.43
A
0
2
4
6
0 10 20 30 40
R2 = 0.38
B Seep
Non-seep
NO
3-N
co
nc.
(m
g L
-1)
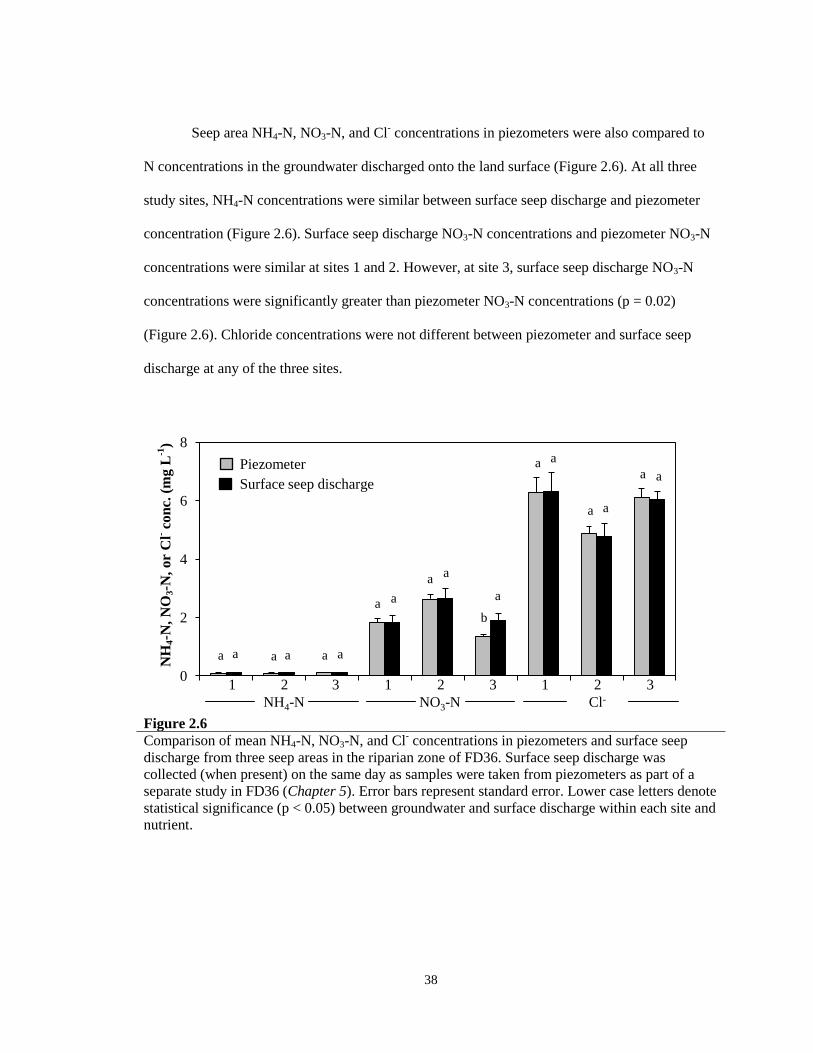
38
Seep area NH4-N, NO3-N, and Cl- concentrations in piezometers were also compared to
N concentrations in the groundwater discharged onto the land surface (Figure 2.6). At all three
study sites, NH4-N concentrations were similar between surface seep discharge and piezometer
concentration (Figure 2.6). Surface seep discharge NO3-N concentrations and piezometer NO3-N
concentrations were similar at sites 1 and 2. However, at site 3, surface seep discharge NO3-N
concentrations were significantly greater than piezometer NO3-N concentrations (p = 0.02)
(Figure 2.6). Chloride concentrations were not different between piezometer and surface seep
discharge at any of the three sites.
Figure 2.6
Comparison of mean NH4-N, NO3-N, and Cl- concentrations in piezometers and surface seep
discharge from three seep areas in the riparian zone of FD36. Surface seep discharge was
collected (when present) on the same day as samples were taken from piezometers as part of a
separate study in FD36 (Chapter 5). Error bars represent standard error. Lower case letters denote
statistical significance (p < 0.05) between groundwater and surface discharge within each site and
nutrient.
0
2
4
6
8
1 2 3 4 5 6 7 8 9
Piezometer
Surface seep discharge
1 1 1 2 3 2 3 2 3
NH4-N NO3-N Cl-
a a a a a a
b a a
a a
a
a a
a a
a a
NH
4-N
, N
O3-N
, or
Cl- c
on
c. (
mg L
-1)
39
Discussion
Hydrology of Seep and Non-seep Areas of the Riparian Zone
Water table depths were measured in nested piezometers at three sites in FD36 to
investigate groundwater flow paths and patterns in seep and non-seep areas of the riparian zone.
Results showed that non-seep areas were characterized by a water table that was relatively
uniform, whereas seep areas were characterized by a water table that was highly variable. In
addition, regions of the seep areas exhibited positive (i.e., upward) vertical gradients and
discharge of groundwater onto the land surface that corresponded with the location of seep
surface flow paths. No vertical movement of groundwater was observed in the non-seep areas. A
comparison of water table patterns in seep and non-seep areas of the riparian zone in FD36
indicated that the hydrology of these areas was substantially different. Specifically, groundwater
flow in non-seep areas of the riparian zone was predominately lateral flow through the soil
matrix. Seep areas, however, showed evidence for groundwater upwelling and preferential flow
paths through the subsurface.
Spatial patterns of water table depth in the non-seep areas of FD36 were typical of
groundwater flow in riparian zones underlain by a restrictive soil layer (Hill, 1996). That is,
groundwater flow was mainly in a lateral direction through the shallow subsurface. Analysis of
spatial autocorrelation in the non-seep areas showed that water table depths were clustered (i.e.,
positive autocorrelation), which indicated that water table depths in piezometers were dependent
on their spatial location. Combined with visual observations, these data demonstrated that
groundwater flow was uniform across the monitored area and resulted from a consistent
downward gradient toward the stream channel. In these hydrogeologic settings, the limited
thickness of the soil above the fragipan (or other soil restrictive layers) can often result in
groundwater inputs that are small and seasonally variable (Pinay et al., 1993; Jordan et al.,

40
1993). For example, the non-seep area in site 2 became hydrologically disconnected from the
upland on several occasions throughout the study and exhibited fluctuations in water table
elevation of over 0.5 m. Therefore, contributions of groundwater to streamflow from non-seep
areas are likely variable and dependent on several factors such as rainfall depth from a single
event or series of events, and antecedent soil moisture.
In contrast to the non-seep areas, positive vertical gradients in nested piezometers and
visible exfiltration of groundwater in the seep areas of the riparian zone in FD36 documented the
importance of groundwater upwelling in these areas. Indeed, several studies have indicated that
vertical discharge can predominate in riparian environments (Devito et al., 2000; Angier et al.,
2002), even in the presence of a restrictive layer (Angier et al., 2005). Once discharged onto the
land surface, groundwater often was transported in small rivulets across the seep area toward the
stream channel. Highly variable water table depths also suggested that groundwater upwelling
occurred at discrete locations within a seep area. These observations indicated that localized
regions within a seep area were likely locations of preferential groundwater flow. Preferential
flow can occur due to macropores, animal burrows, soil pipes, or discontinuities in soil layers
(Allaire et al., 2009). While the exact mechanism for preferential flow was difficult to determine,
a two-component mixing model suggested that the fractured aquifer system, which has the
highest NO3-N concentrations (Pionke and Urban, 1985; Schnabel et al., 1993; Lindsey et al.,
2003), contributed groundwater to seepage zones during and after storm events. This implies that
groundwater from the fractured aquifer was transported vertically upward through the fragipan in
seep areas, whereas in non-seep areas, perched water above the fragipan was the primary source
of groundwater. Seep area contributions to streamflow are therefore likely based on longer-term
factors, such as seasonal or annual groundwater recharge.
41
Influence of Hydrology on N Concentrations in Seep and Non-seep Areas
Nitrogen concentrations among study sites in FD36 were more similar than was initially
expected. Based on land use and N management above the three study sites, we expected that a
site below agricultural land (site 2) would have substantially higher N concentration compared to
a site below a pasture/meadow (site 1) and a forested area (site 3). While the observed trend was
similar to what we anticipated (site 2 > 1 > 3), the magnitude of concentration differences
between the three sites was relatively small. Mean NO3-N concentration in seep areas of all three
sites only ranged from 1 to 3 mg L-1
. Temporal patterns in NO3-N concentration suggest that land
management may still play an important role in the timing of N delivery to the stream. For
example, the peaks in seep area NO3-N concentration occurred in both the early-spring and late-
summer at site 2. Manure is applied during the spring before planting and during the late fall
(typically November) above site 2. Therefore, the seasonal peaks in NO3-N concentration were
likely tied to the timing of manure application to cropped fields upslope of site 2. In contrast, no
manure or fertilizer was applied to the pasture/meadow above site 3, which had seasonally
invariable NO3-N concentrations in the seep area throughout the study period.
Sampling of piezometers in this study also only represented several snapshots in time. If
samples were collected at multiple times during and following a storm event or immediately after
manure application, greater differences in N concentration would have likely been observed
among sites. It is also important to note that we were unable to determine the location or extent of
the contributing area draining to each site. Groundwater patterns suggest that seep areas are fed
by groundwater from the fractured aquifer, whereas non-seep areas appear to be more locally
controlled (e.g., water that is perched above the fragipan). Depending on the extent of the
contributing area, N concentrations could vary greatly due to differences in management practices
or land use. In addition to land use, the ratio of groundwater from the fractured aquifer to perched
42
water above the fragipan in seep areas varied throughout the study period. At sites 1 and 2, results
suggested that NO3-N concentration was dependent on the amount of groundwater from the
fractured aquifer; thus, the timing of sample collection in relation to a storm event, the size of the
storm, and the antecedent conditions prior to the storm event likely played a role in the NO3-N
concentrations that we observed.
Within each study site, NO3-N concentrations in non-seep areas were low compared to
seep areas and averaged less than 0.7 mg L-1
. This finding is consistent with previous studies in
which riparian zones underlain by a fragipan or other impermeable layer are effective in
removing NO3-N from shallow groundwater (e.g., Peterjohn and Correll, 1984; Jordan et al.,
1993). Shallow lateral subsurface flow paths maximize the interaction between groundwater and
riparian soils and vegetation. Longer residence times in the riparian zone promote NO3-N
removal via denitrification and vegetative uptake (Vidon and Hill, 2004). While NO3-N removal
was not observed along groundwater flow paths in non-seep areas during this study, it is possible
that the majority of NO3-N removal occurred at the upland-riparian zone interface (Hill et al.,
2000) and the low NO3-N concentrations reflected the effectiveness of the riparian zone in
removing N in shallow groundwater. Differences in NO3-N concentrations were however
observed at all three non-seep areas between depths. Near the surface (20 cm), mean NO3-N
concentration was less compared to mean NO3-N concentration deeper in the soil profile (60 cm).
In contrast, mean Cl- concentrations were not different between the two depths. Changes in the
NO3-N to Cl- ratio with depth in the non-seep areas suggests that NO3-N removal in non-seep
areas may be more efficient in near-surface riparian soils that are typically higher in organic
material (Addy et al., 1999).
Groundwater upwelling through preferential flow paths in seep areas of site 1 and 2
resulted in higher NO3-N concentrations compared to non-seep areas. At both sites, NO3-N
concentrations were significantly correlated with water table depth. Areas within the seep where
43
the water table was closer to the land surface (i.e., areas of groundwater upwelling) had higher
NO3-N concentrations than areas where the water table elevation was deeper. Preferential flow
paths have been shown to decrease residence times of groundwater (Su et al., 2001), which could
limit interaction with riparian zone soils. In many instances, preferential flow paths have been
shown to increase the potential for NO3-N leaching down through the soil profile (e.g., Di and
Cameron, 2002). In this case, however, they served as foci for discharging groundwater. Similar
NO3-N concentrations between depths in the seep areas at sites 1 and 2 suggest that groundwater
was being transported quickly toward the surface with minimal NO3-N removal occurring in
near-surface soils. Nitrate-N concentrations, however, were similar in seep and non-seep areas at
site 3; although, patterns in water table depth suggested that groundwater upwelling occurred in
the seep area similar to the seep areas in sites 1 and 2. Nitrate-N concentration in seep surface
flow paths have been shown to be correlated with dissolved organic carbon (DOC) concentrations
(O’Driscoll and DeWalle, 2010). Dissolved organic carbon concentrations are often higher in
forested areas compared to agricultural areas due to leaf litter inputs (Boyer and Groffman, 1996).
While DOC was not measured as part of this study, it is possible that higher DOC concentrations
in the soil at site 3 resulted in greater NO3-N removal and decreased NO3-N concentrations in the
seep area relative to sites 1 and 2.
N Transport Potential in Seep and Non-seep Areas
The combination of preferential flow paths, discharge of groundwater onto the land
surface, and longer periods of saturation in seep areas of the riparian zone in FD36 suggest that
the potential for N delivery, especially NO3-N, to streams is much greater in seep areas compared
to non-seep areas. Preferential flow paths in seep areas resulted in upwelling of groundwater from
below the fragipan, which had higher NO3-N concentrations than the water perched above it.
44
Once the groundwater reached the surface, it was transported in small rivulets towards the stream
channel. Research has shown that NO3-N retention and/or removal can occur along seep surface
pathways (Blackwell et al., 1999; Rutherford and Nguyen, 2004; O’Driscoll and DeWalle, 2010),
but in many instances groundwater bypasses the N mitigating benefits of the riparian zone
(Warwick and Hill, 1988; Hill, 1990). High NO3-N concentrations observed in seep areas
therefore have the potential to be delivered to the stream without any significant remediation.
Visual observations also indicate that seep areas in FD36 are saturated for a greater portion of the
year compared to non-seep areas. The total volume of groundwater delivered to the stream from
seep areas is therefore likely much greater than adjacent non-seep areas of similar size, which
tend to be dry for extended periods of time throughout the year. Even if a seep and an adjacent
non-seep area had similar NO3-N concentrations, such as site 3, NO3-N loads would be expected
to be much higher from the seep area due to the potential for larger volumes of groundwater to be
delivered to the stream. Few studies, however, have focused on seeps and their effect on stream
water quality. Future research should examine hydrologic processes in seeps, as results from this
study show that N concentrations and transport potential are strongly influenced by the hydrology
of the riparian zone. Management practices aimed at improving stream water quality in FD36 and
other headwater agricultural catchments with seeps, should target seep areas since the potential
for NO3-N delivery is much greater compared to adjacent non-seep areas.
Conclusions
The results of this study showed that the potential for NO3-N transport to the stream in
FD36 is greater from seep areas of the riparian zone compared to areas without seeps (non-seep
areas). Spatial patterns in water table depth indicated that groundwater flow paths in non-seep
areas were dominated by uniform, lateral flow through the subsurface. Lateral subsurface flow is
45
characterized by longer residence times in which groundwater can interact with riparian soils and
vegetation, which promote N removal and uptake. In contrast, water table depths in seep areas
were highly variable with some regions having positive upward vertical gradients, which
suggested that groundwater upwelling via preferential flow was an important pathway for
groundwater discharge in seep areas. Preferential flow paths limit N removal because
groundwater typically has short residence times within the subsurface. In seep and non-seep areas
at two of the three study sites, NO3-N concentrations were significantly correlated with water
table depths. Groundwater from the fractured aquifer, which had higher NO3-N concentration,
was also the primary source of water to seep areas at all three study sites. Thus, groundwater flow
paths in the riparian zone of FD36 played a significant role in the NO3-N transport potential of
these areas. Future research should examine hydrologic processes in areas of the riparian zone
that differ hydrologically, such as seep and non-seep areas, to better understand how groundwater
flow paths influence N transport. Results from this study show that management practices aimed
at improving stream water quality in FD36 and other headwater agricultural catchments with
seeps, should target these areas since the potential for NO3-N delivery is much greater compared
to adjacent areas without seeps.
References
Addy, K.L., A.J. Gold, P.M. Groffman, and P.A. Jacinthe. 1999. Ground water nitrate removal in
subsoil of forested and mowed riparian buffer zones. J. Envrion. Qual. 28:962-970.
Allaire, S.E., S. Roulier, and A.J. Cessna. 2009. Quantifying preferential flow in soils: a review
of different techniques. J. Hydrol. 378:179-204.
Angier, J.T., and G.W. McCarty. 2008. Variations in baseflow nitrate flux in a first order stream
and riparian zone. J. Am. Water Resour. Assoc. 44:367-380.
Angier, J.T., G.W. McCarty, and K.L. Prestegaard. 2005. Hydrology of a first-order riparian zone
and stream, mid-Atlantic Coastal Plain Maryland. J. Hydrol. 309:149-166.

46
Angier, J.T., G.W. McCarty, T.J. Gish, and C.S.T. Daughtry. 2001. Impact of a first-order
riparian zone on nitrogen removal and export from an agricultural ecosystem. The Sci.
World 1. 2: 642-651.
Blackwell, M.S.A., D.V. Hogan, and E. Maltby. 1999. The use of conveniently and alternatively
located buffer zones for the removal of nitrate from diffuse agricultural run-off. Water
Sci. Technol. 39:157-164.
Bosch, D.D., R.K. Hubbard, L.T. West, and R.R. Lowrance. 1994. Subsurface flow patterns in a
riparian buffer system. Trans. ASAE 37:1783-1790.
Boyer, J.N., and P.M. Groffman. 1996. Bioavailability of water extractable organic carbon
fractions in forest and agricultural soil profiles. Soil Biol. Biochem. 28:783-790.
Bryant, R.B., T.L. Veith, G.W. Feyereisen, A.R. Buda, C.D. Church, G.J. Folmar, J.P. Schmidt,
C.J. Dell, and P.J.A. Kleinman. 2011. U.S. Department of Agriculture Agricultural
Research Service Manhantango creek watershed, Pennsylvania, United States:
phsiography and history. Water Resour. Res. 47: DOI: 10.1029/2010WR010056.
Buda, A.R., T.L. Veith, G.J. Folmar, G.W. Feyereisen, R.B. Bryant, C.D. Church, J.P. Schmidt,
C.J. Dell, and P.J.A. Kleinman. 2011. U.S. Department of Agriculture Agricultural
Research Service Manhantango creek watershed, Pennsylvania, United States: long-term
precipitation database. Water Resour. Res. 47: DOI: 10.1029/2010WR010058.
Calver, A. 1990. Stream head migration: an indicator of runoff processes on chalklands. Catena
17:399-408.
Correll, D.L. 1998. The role of phosphorus in the eutrophication of receiving waters: A review. J.
Environ. Qual. 27:261-266.
Craig, J.P., and R.R. Weil. 1993. Nitrate leaching to a shallow mid-Atlantic coastal plain aquifer
as influenced by conventional no-till and low-input sustainable grain production systems.
Water. Sci. Technol. 28:691-700.
Crum, J.R., F.J. Pierce, M.L. Vitosh, and B.D. Knezek. 1990. Potential nitrogen contamination of
groundwater as affected by soil, water, and land use relationships. Institute of Water
Research, MI.
Davis, S.N., G.M. Thomson, H.W. Bently, and G. Stiles. 2006. Groundwater tracers: a short
review. Groundwater. 18:14-23.
Devito, K.J., D. Fitzgerald, A.R. Hill, and R. Aravena. 2000. Nitrate dynamics in relation to
lithology and hydrologic flow path in a river riparian zone. J. Environ. Qual. 29:1075-
1084.
Di, H.J., and K.C. Cameron. 2002. Nitrate leaching in temperate agroecosystems: sources,
factors, and mitigating strategies. Nutrient Cycling in Agroecosystems 46:237-256.

47
Gburek, W.J., and A.N. Sharpley. 1998. Hydrologic controls on phosphorus loss from upland
agricultural watersheds. J. Environ. Qual. 27:267-277.
Gburek, W.J., A.N. Sharpley, and H.B. Pionke. 1996. Identification of critical source areas for
phosphorus export from agricultural catchments. In: Advances in hillslope processes.
M.G. Anderson and S.M. Brooks (Editors) Vol. 1. John Wiley and Sons, New York, NY,
pp. 263-282.
Gburek, W.J., and G.J. Folmar. 1999. Patterns of contaminant transport in a layered fractured
aquifer. J. Contam. Hydrol. 37:87-109.
Groffman, P.M., A.J. Gold, and R.C. Simmons. 1992. Nitrate dynamics in riparian forests:
microbial studies. J. Environ. Qual. 21:666-671.
Harvey, J.W., and W.K. Nuttle. 1995. Fluxes of water and solute in a coastal wetland sediment. 2.
Effect of macropores on solute exchange with surface water. J. Hydrol. 164:109-125.
Hill, A.R. 1991. A groundwater nitrogen budget for a headwater swamp in an area of permanent
groundwater discharge. Biogeochemistry. 14:209-224.
Hill, A.R. 1990. Groundwater flow paths in relation to nitrogen chemistry in the near-stream
zone. Hydrobiologia 206:39-52.
Hill, A.R. 1996. Nitrate removal in stream riparian zones. J. Environ. Qual. 25: 743-755.
Hill, A.R., K.J. Devito, S. Campangnolo, and K. Sanmugadas. 2000. Substrate denitrification in a
forest riparian zone: interactions between hydrology and supplies of nitrate and organic
carbon. Biogeochemistry 51:193-223.
Jacinthe, P.A., P.M. Groffman, A.J. Gold, and A. Mosier. 1998. Patchiness in microbial nitrogen
transformations in groundwater in a riparian forest. J. Environ. Qual. 27:156-164.
Jordan, T.E., D.L. Correll, and D.E. Weller. 1993. Nutrient interception by a riparian forest
receiving inputs from adjacent cropland. J. Environ. Qual. 22:467-473.
Koerkle, E.H. 1992. Effects of nutrient management on surface water quality in a small watershed
in Pennsylvania. p. 193-207, In: The Natural Rural Clean Water Program Symposium,
Sept. 1992, Orlando, FL. ORD EPA/625/R-92/006. US EPA, Washington DC.
Lindsey, B.D., S.W. Phillips, C.A. Donnelly, G.K. Speiran, L.N. Plummer, J.K. Bohlke, M.J.
Focazio, W.C. Burton, and E. Busenberg. 2003. Residence times and nitrate transport in
groundwater discharging to streams in the Chesapeake Bay watershed. U.S. Geological
Survey Water Resources Investigations Report 03-4035.
Lowrance, R.R., R.L. Todd, and L.E. Asmussen. 1983. Waterborne nutrient budgets for the
riparian zone of an agricultural watershed. Ag. Ecosys. Environ. 10:371-384.
Mayer, P.M., S.K. Reynolds Jr., M.D. McCutchen, and T.J. Canfield. 2007. Meta-analysis of
nitrogen removal in riparian buffers. J. Environ. Qual. 36: 1172-1180.

48
McGlynn, B.L., and J.J. McDonnell. 2003. Quantifying the relative contributions of riparian and
hillslope zones to catchment runoff. Water Resour. Res. 39:1310-1330.
Needlelman, B.A. 2002. Surface runoff hydrology and phosphorus transport along two
agricultural hillslopes with contrasting soils. Ph.D. Thesis. The Pennsylvania State
University, University Park, PA.
O’Driscoll, M.A., and D.R. DeWalle. 2010. Seeps regulate stream nitrate concentration in
forested Appalachian catchments. J. Environ. Qual. 39:420-431.
O’Sullivan, D. and J.J. Unwin. 2010. Geographic Information Analysis. John Wiley & Sons, Inc.
New York, NY.
Patton, C.J., and J.R. Kryskalla. 2003. Methods of analysis by the U.S. Geological Survey
National Water Quality Laboratory: evaluation of alkaline persulfate digestion as an
alternative to Kjeldahl digestion for determination of total dissolved nitrogen and
phosphorus in water. U.S. Geological Survey water resources investigations report 03-
4174, 33 p.
Peterjohn, W.T., and D.L. Correll. 1984. Nutrient dynamics in an agricultural watershed:
observations on the role of a riparian forest. Ecology 65:1466-1475.
Peterson, B.J., W.M. Wolheim, P.J. Mulholland, J.R. Webster, J.L. Meyer, J.L. Tank, E. Marti,
W.B. Bowden, H.M. Valett, A.E. Hershey, W.H. McDowell, W.K. Dodds, S.K.
Hamilton, S. Gregory, and D.D. Morrall. 2001. Control of nitrogen export from
watersheds by headwater streams. Science 292:86-90.
Pinay, G., L. Rogues, and A. Fabre. 1993. Spatial and temporal patterns of denitrification in a
riparian forest. J. Appl. Ecol. 30:581-591.
Pionke, H.B., and J.B. Urban. 1985. Effect of agriculture land use on ground-water quality in a
small Pennsylvania watershed. Groundwater. 23:68-80.
Pionke, H.B., J.R. Hoover, R.R. Schnabel, W.J. Gburek, J.B. Urban, and A.S. Rogowski. 1988.
Chemical-hydrologic interactions in the near-stream zone. Water Resour. Res. 24:1101-
1110.
Pionke, H.B., W.J. Gburek, and R.R. Schnabel. 1996. Flow and nutrient transport patterns for an
agricultural hill-land watershed. Water Resour. Res. 32:1795-1804.
R Development Core Team. 2011. R: a language and environment for statistical computing. R
Foundation for Statistical Computing, Vienna, Austria.
Rutherford, J.C., and M.L. Nguyen. 2004. Nitrate removal in riparian wetlands: interactions
between surface flow and soils. J. Environ. Qual. 33:1133-1143.
Schnabel, R.R., J.B. Urban, and W.J. Gburek. 1993. Hydrologic controls in nitrate, sulfate, and
chloride concentrations. J. Environ. Qual. 22:589-596.
49
Shabaga, J.A., and A.R. Hill. 2010. Groundwater-fed surface flow path hydrodynamics and
nitrate removal in three riparian zones in southern Ontario, Canada. J. Hydrol. 388:52-64.
Simmons, R.C., A.J. Gold, and P.M. Groffman. 1992. Nitrate dynamics in riparian forests:
groundwater studies. J. Environ. Qual. 21:659-665.
Su, G.W., J.T. Geller, K. Pruess, and J.R. Hunt. 2001. Solute transport along preferential flow
paths in unsaturated fractures. Water Resour. Res. 37:2481-2491.
Tesoriero, A.J., H. Liebsecher, and S.E. Cox. 2000. Mechanisms and rate of denitrification in an
agricultural watershed: electron and mass balance along groundwater flow paths. Water
Resour. Res. 36:1545-1559.
U.S. Environmental Protection Agency. 2008. National water quality inventory: 2008.
Washington, DC.
Vidon, P., and A.R. Hill. 2004. Landscape controls on nitrate removal in stream riparian zones.
Water Resour. Res. 40: DOI: 10.1029/2003WR002473.
Vidon, P., C. Allen, D. Burns, T.P. Duval, N. Gurwick, S. Inamdar, R. Lowrance, J. Okay, D.
Scott, and S. Sebestyen. 2010. Hot spots and hot moments in riparian zones: potential for
improved water quality management. J. Am. Water. Resour. Assoc. 46:278-298.
Warwick, J., and A.R. Hill. 1988. Nitrate depletion in the riparian zone of a small woodland
stream. Hydrobiologia 157:231-240.
50
CHAPTER 3
Imaging Riparian Seepage Zones Using Electrical Resistivity: Linking
Hydrology and Nitrogen Transport
Abstract
The activation of subsurface seepage in response to precipitation events represents a
potentially important pathway of nitrogen (N) delivery to streams in agricultural catchments. In
this study, we used electrical resistivity imaging (ERI) and shallow piezometers to elucidate how
seep and non-seep areas within the riparian zone responded to a series of three precipitation
events that occurred over a one-month period (mid-April to mid-May, 2012). Two study areas
were established on soils possessing a fragipan (0.6-m deep) in FD36, an agricultural catchment
(40 ha) in the Ridge and Valley physiographic region of central Pennsylvania. On six occasions,
ERI data were collected across 32 electrodes (0.5 m spacing) in both areas. A network of 40
piezometers in each area (20- and 60-cm deep) was also monitored for water table depth and N
chemistry. Soil conditions prior to the rainfall events were dry (soil water content (Ө) = 21%);
however, the first rainfall event (41 mm) was sufficient to activate subsurface discharge within
the seep area. The non-seep area showed no such response. Specifically, ERI data showed large,
localized decreases in resistivity (30% - 40%) within the seep area, suggesting groundwater was
upwelling via preferential flow pathways through the fragipan. After the second and third events
(100 mm total), both seep and non-seep areas were saturated (Ө = 47%), with overland flow
visible within the seep area. The activation and expansion of the seep zone coincided with
significant changes in seep discharge N concentration. Nitrate-N concentrations averaged 1.4 mg

51
L-1
when the subsurface initially became hydrologically active, but increased to 5.0 mg L-1
as
upwelling groundwater expanded the seep zone. Upon saturation, seep nitrate-N concentration
returned to 1.3 mg L-1
. Mean NO3-N concentration in the non-seep area was 0.2 mg L-1
. Results
from ERI and hydrometric monitoring of the riparian zone show that seep areas are highly
dynamic and responsive to rainfall events compared to non-seep areas, and that subsurface
hydrologic processes in seep zones can significantly affect N concentrations in the groundwater
being delivered to the stream.
Introduction
Streamflow in headwater catchments is often sustained by seeps or seepage zones, which
supply a source of groundwater during low-flow periods between rainfall and snowmelt events. In
these settings, groundwater from seeps can often account for 50% to 80% of annual stream
discharge (Srinivasan et al., 2002; O’Driscoll and DeWalle, 2010; Morley et al., 2011). Seep
zones are also dynamic and responsive during precipitation events, both expanding and then
contracting rapidly (Pionke et al., 1988). These expansions and contractions of the seep zone are,
in part, due to activation of subsurface groundwater flow pathways, which can change the
quantity and chemistry of groundwater being delivered to the stream. To date, our understanding
of chemical and hydrological interactions in seeps has been hampered by an inability to describe
and quantify seep zone formation over space and time. Improved characterization of hydrological
processes in emergent groundwater seeps is therefore critical to characterizing their role in
generating streamflow and influencing water quality.
In headwater catchments, riparian zone seeps are commonly found where substantial
percolation occurs annually or seasonally, and where the downslope transmission capacity of the
subsurface flow system is restricted due to low hydraulic gradients (Pionke et al., 1988), small

52
cross sectional areas (Stein et al., 2004), or decreased permeability (Vidon and Hill, 2004). While
these properties establish a large-scale control on the extent and location of seep zones,
precipitation events can serve to generate new seeps or expand existing seeps over short time
scales. Hence, recent investigations of seep discharge have suggested that multiple flow pathways
may be responsible for variations in seep flow during and following precipitation events. For
example, studies in Virginia and New York found that seep baseflow was generated from a
regional groundwater flow system (e.g., shallow aquifers) and discharge was maintained even
during periods of prolonged drought (Burns et al., 1998; Gentry and Burbey, 2004). The authors
also found that increased seep discharge identified on hydrograph peaks was the result of rapid
flow through a local groundwater flow system (e.g., infiltration of rainwater, soil water, and
perched water on top of aquicludes) that was formed within a small radius of the seep orifice.
The activation of seepage zones has the potential to be a significant source of nitrogen
(N) to streams, especially nitrate-N (NO3-N), in agricultural landscapes (e.g., Chapter 2). In many
non-glaciated areas in the northeastern U.S., catchments are underlain by bedrock that is severely
weathered at a shallow depth as a result of stress-relief fracturing (Gburek and Folmar, 1999).
This highly conductive fractured layer can support lateral saturated flows that contribute directly
to seeps and influence both hydrology and water quality within these catchments (Lindsey et al.,
2003). Indeed, water quality within these fractured aquifers has been shown to be affected
directly by the overlying and immediately upgradient land use. Pionke and Urban (1985) found
that NO3-N concentrations representing a fractured aquifer (10 – 60 m deep) in central
Pennsylvania were lowest beneath forest (0.7 mg L-1
) and highest under cropland (4.7 mg L-1
). In
the same catchment, Schnabel et al. (1993) found that the fractured aquifer had high NO3-N
concentrations due to agricultural N inputs compared to a deeper flow system (> 60 m deep),
which had low NO3-N concentrations. The authors also showed that stream NO3-N concentrations
during baseflow were influenced by groundwater contributions from the fractured aquifer.
53
Subsurface hydrologic processes have typically been characterized using local
observation methods, such as time-domain reflectometry (TDR) and monitoring well networks
(Oberdorster et al., 2010; Williams, Chapter 2). For example, on the coastal plain of Maryland,
Angier et al. (2005) examined spatial and temporal differences in subsurface hydrology and
groundwater flow direction within a riparian zone using piezometer transects. Hill (1990) and Hill
et al. (2000) also investigated the interaction between groundwater flow paths and water
chemistry in the riparian zone of a small headwater catchment near Toronto, Ontario using
transects of nested piezometers that extended from the perimeter of the riparian zone to the
stream. In addition, Williams (Chapter 2) monitored groundwater flow patterns and NO3-N
concentrations in three seep and adjacent non-seep areas of a riparian zone using a gridded
network of piezometers. While piezometers and other local observation methods provide point
verification of subsurface hydrologic processes and N transport (Hill, 1990; Hill et al., 2000),
they ultimately lack spatial resolution and often fail to represent the extensive spatial coverage of
the processes being studied (Ward et al., 2010).
Recently, several studies have shown that electrical resistivity imaging (ERI) is a useful
technology for visualizing the impacts of soil state variables and soil physical properties on
subsurface hydrologic processes (Besson et al., 2010). Electrical resistivity has been applied to
investigate water uptake by corn roots and its impact on soil water content (Michot et al., 2003)
and to describe the structural heterogeneity of ploughed soils (Besson et al., 2004; Seger et al.,
2009). Groundwater flow and solute infiltration in the vadose zone have been described by
electrical monitoring during tracer experiments (Slater et al., 2000; Kemna et al., 2002;
Vanderborght et al., 2005; Cassiani et al., 2006). Ward et al. (2010) also used ERI to visualize
the spatial and temporal dynamics of hyporheic exchange along a headwater stream. Therefore,
combining ERI with local observation methods (i.e., monitoring well network and TDR) has the
potential to increase our ability to characterize chemical-hydrologic interactions in seeps and
54
better understand the role of seeps on N dynamics within the riparian zones of headwater
agricultural catchments.
In this study, we apply standard hydrometric measurements and ERI to examine seep
zone formation, subsurface discharge, and N transport potential following a series of three
precipitation events in a central Pennsylvania agricultural headwater catchment. These events
transitioned the landscape from a dry to a wet state and allowed us to track the activation of seep
zones. Our objectives were to (1) investigate chemical and hydrologic interactions within a seep
and in an adjacent area without a seep using standard hydrometric techniques; (2) examine these
interactions in the context of observed subsurface hydrologic responses visualized with ERI; and
(3) use the results from objectives (1) and (2) to develop a conceptual model of seep zone
formation, subsurface flow pathways, and N transport in the riparian zone of this catchment.
Materials and Methods
Site Location and Characteristics
The study was conducted in FD36 (0.40 ha) a small headwater catchment located
approximately 40 km north of Harrisburg, Pennsylvania within the non-glaciated, folded and
faulted, Appalachian Ridge and Valley physiographic region. FD36 is one of 15 sub-catchments
that form WE-38, a primary research site of the USDA – Agricultural Research Service for over
40 years (see Bryant et al. (2011) for a detailed history of the site). The climate is temperate and
humid with annual precipitation averaging 1080 mm yr-1
and mean annual air temperatures of 8 to
10°C (Gburek and Sharpley, 1998; Buda et al., 2011). Previous research in FD36 has shown that
groundwater from a fractured aquifer provides the majority (60% – 80%) of the annual
streamflow (Pionke and Urban, 1985; Schnabel et al., 1993; Lindsey et al, 2003) and that surface
and subsurface flow systems are predominately self-contained at the catchment scale (Gburek and

55
Folmar, 1999). Two contrasting soil groups are also found within FD36 (Needelman et al., 2002).
Well-drained residual soils that are typically stony, silt loams (Leck Kill, Calvin, and Berks
series) line the hillslopes, while colluvial soils (Albrights and Hustontown series) are distributed
along the stream and valley floor. The Albrights and Hustontown soils in the riparian zone have a
moderately well-developed fragipan beginning at a depth of 0.5 to 0.7 m and have low
permeability.
Two adjacent sites on the north hillslope in FD36 were chosen for intensive monitoring
of subsurface flow processes and N transport (Figure 3.1). One study site was located where an
emergent groundwater seep was commonly observed (seep area), while the other study site was
an area without an emergent groundwater seep (non-seep area). The seep was selected because it
flowed consistently, was active during storm events, and was easily paired with an adjacent, less
active area without an emergent seep. Both seep and non-seep sites were instrumented identically
with five transects of piezometers (6-m long) (Figure 3.1). Each piezometer transect contained
four pairs of piezometers installed at depths of 20 and 60 cm with a spacing of 1.5 m between
pairs of piezometers. All piezometers were screened at the bottom 8 cm. The depths of the
piezometers were chosen to best represent the soil properties at the study sites (20 cm – Ap
horizon boundary; 60 cm – top of fragipan). A 4-m deep piezometer was also located at the base
of each seep and non-seep area in order to get an approximate water table depth when the water
table was greater than 60 cm from the land surface (i.e., the depth of the piezometers within each
site). Time-domain reflectometry (TDR) access tubes (1-m deep) were installed at both study
sites (Figure 3.1) in order to monitor soil water content. In addition, four pairs of monitoring
wells (1- and 6-m deep) throughout FD36 were sampled concurrently with the piezometers. All
monitoring wells were screened at the bottom 0.5 m. The shallow monitoring wells (1 m)
sampled perched groundwater above the fragipan. In contrast, the deep monitoring wells (6 m)
sampled water in the fractured aquifer.

56
Field Sampling and Laboratory Analysis
Water samples were collected from piezometers at both study sites on six occasions
between April 21, 2012 and May 21, 2012. This time period coincided with a series of three
precipitation events that transitioned the riparian zone from a dry (soil moisture (Ө) = 21%) to a
wet state (Ө = 50%). Prior to collecting water samples from each piezometer, the depth of the
water table was recorded and the piezometers were purged using a peristalitic pump. Water
samples were collected in 125 mL plastic (HDPE) bottles, transported on ice back to the
laboratory, and then stored at 4°C until analysis. Soil water content was measured concurrently
with sample collection at 20 cm intervals using a TDR probe. All water samples were filtered
(0.45 µm) and then analyzed with a Lachat QuikChem FIA+ autoanalyzer (QuikChem Methods
FIA+ 8000 Series, Lachat Instruments, Loveland, Colorado) to determine concentrations of NO3-
N, ammonium-N (NH4-N), and chloride (Cl-). Total N was determined on unfiltered samples
following alkaline persulfate digestion (Patton and Kryskalla, 2003). Since NO3-N comprised, on
average, 95% of total N, the main focus of this paper is on NO3-N.
Statistics and Data Analysis
Ordinary kriging was used to interpolate spatial patterns of water table depth and NO3-N
concentration within each study site (O’Sullivan and Unwin, 2010). We first created a grid of
unsampled locations at one-third the spacing of the piezometers (0.5 m) and overlaid it on top of
the piezometer network at each study site. This grid served as the locations onto which the
interpolation was completed. Variograms were fit to the observed data in order to determine the
relationship between data points within the piezometer network. Ordinary kriging was then
performed to estimate the values at unknown (i.e., unsampled) locations within each site and the

57
Figure 3.1
Instrumentation at the study site in FD36. One study site is located where an emergent groundwater seep is present (seep area). The other
site is an area without an emergent groundwater seep (non-seep area). FD36 is a sub-catchment of WE-38, which has been a primary
research site of the USDA-Agricultural Research Service for over 40 years. The water leaving WE-38 flows into East Mahantango Creek,
which is a tributary of the Susquehanna River and ultimately the Chesapeake Bay.
Non-seep Area
Seep Area
Stream channel
Recording H-flume
ERT transect
Deep piezometer (4 m)
TDR access tube (1 m)
Piezometer nest
(20 & 60 cm)
Legend
FD36 Headwater Catchment
Study site
10 m
Flow N
57

58
results were plotted on a contour map. All spatial analysis was completed in R statistical package
(R Foundation for Statistical Computing, 2011).
Following the methods described by Williams (Chapter 2), a two-component mixing
model was used to ascertain the relative contributions of perched water above the fragipan (1-m
deep monitoring wells) and groundwater from the fractured aquifer (6-m deep monitoring wells)
in seep and non-seep areas. Briefly, the model was calculated as QFractured/QPiezometer = (CPiezometer –
CPerched)/(CFractured – CPerched), where QFractured/QPiezometer is the proportion of groundwater from the
fractured aquifer to seep and non-seep areas, CPiezometer is the Cl- concentration of the 60-cm deep
piezometers, CFractured is the Cl- concentration of the 6-m deep monitoring wells, and CPerched is the
Cl- concentration of the 1-m deep monitoring wells.
Electrical Resistivity Imaging
Electrical resistivity imaging (ERI) is a geophysical method that can be used to estimate
the spatial and temporal distribution of subsurface electrical resistivity (i.e., reciprocal of
electrical conductivity). ERI data were collected following the methods of Ward et al. (2010).
Briefly, ERI data were collected at the seep and non-seep areas with an IRIS Syscal Pro
Resistivity Meter using a dipole-dipole geometry with 259 quadripoles collected across 32
electrodes set at 0.5 m spacing (Figure 3.1). ERI data collection was completed on the same dates
as the piezometer sampling. During sampling, replicate measurements were collected and
averaged twice by the instrument for data within 3% difference of one another. If this quality
threshold was not met, a third measurement was included in the average. The average standard
deviation between replicate measurements was 0.17 Ωm (0.04%). Inversion of ERI data was
completed using EarthImager2D (Advanced Geosciences, Inc.). Background (pre-storm) data
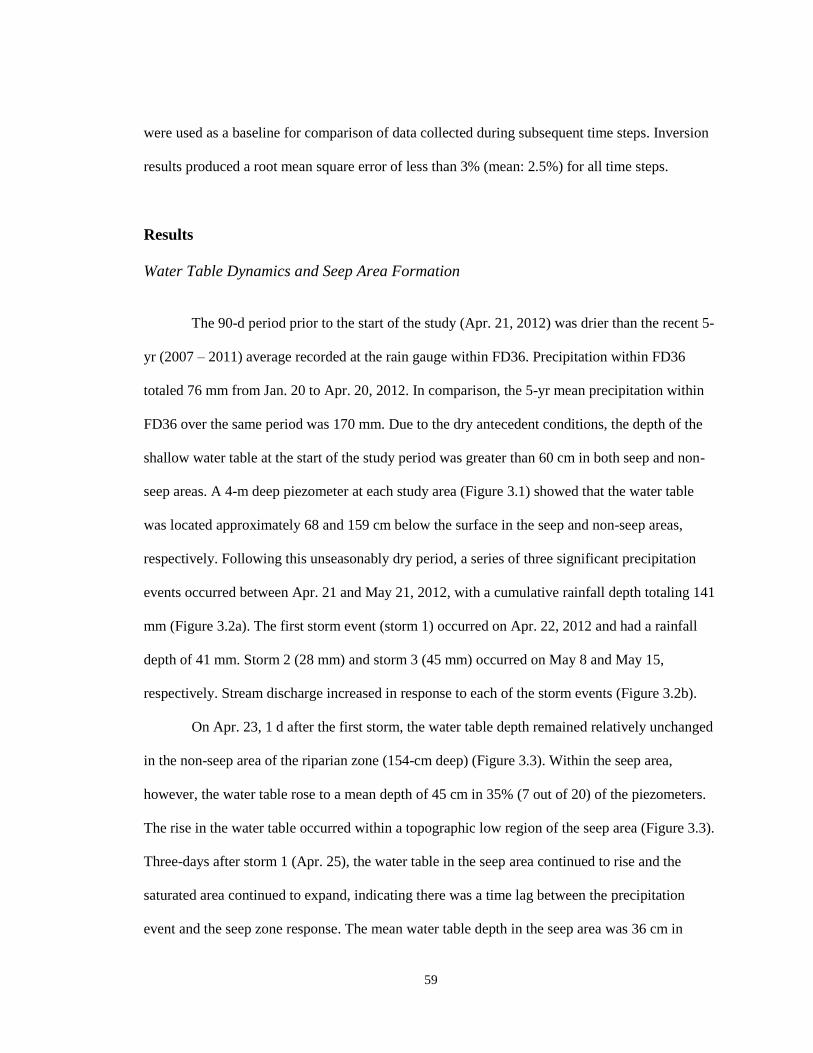
59
were used as a baseline for comparison of data collected during subsequent time steps. Inversion
results produced a root mean square error of less than 3% (mean: 2.5%) for all time steps.
Results
Water Table Dynamics and Seep Area Formation
The 90-d period prior to the start of the study (Apr. 21, 2012) was drier than the recent 5-
yr (2007 – 2011) average recorded at the rain gauge within FD36. Precipitation within FD36
totaled 76 mm from Jan. 20 to Apr. 20, 2012. In comparison, the 5-yr mean precipitation within
FD36 over the same period was 170 mm. Due to the dry antecedent conditions, the depth of the
shallow water table at the start of the study period was greater than 60 cm in both seep and non-
seep areas. A 4-m deep piezometer at each study area (Figure 3.1) showed that the water table
was located approximately 68 and 159 cm below the surface in the seep and non-seep areas,
respectively. Following this unseasonably dry period, a series of three significant precipitation
events occurred between Apr. 21 and May 21, 2012, with a cumulative rainfall depth totaling 141
mm (Figure 3.2a). The first storm event (storm 1) occurred on Apr. 22, 2012 and had a rainfall
depth of 41 mm. Storm 2 (28 mm) and storm 3 (45 mm) occurred on May 8 and May 15,
respectively. Stream discharge increased in response to each of the storm events (Figure 3.2b).
On Apr. 23, 1 d after the first storm, the water table depth remained relatively unchanged
in the non-seep area of the riparian zone (154-cm deep) (Figure 3.3). Within the seep area,
however, the water table rose to a mean depth of 45 cm in 35% (7 out of 20) of the piezometers.
The rise in the water table occurred within a topographic low region of the seep area (Figure 3.3).
Three-days after storm 1 (Apr. 25), the water table in the seep area continued to rise and the
saturated area continued to expand, indicating there was a time lag between the precipitation
event and the seep zone response. The mean water table depth in the seep area was 36 cm in
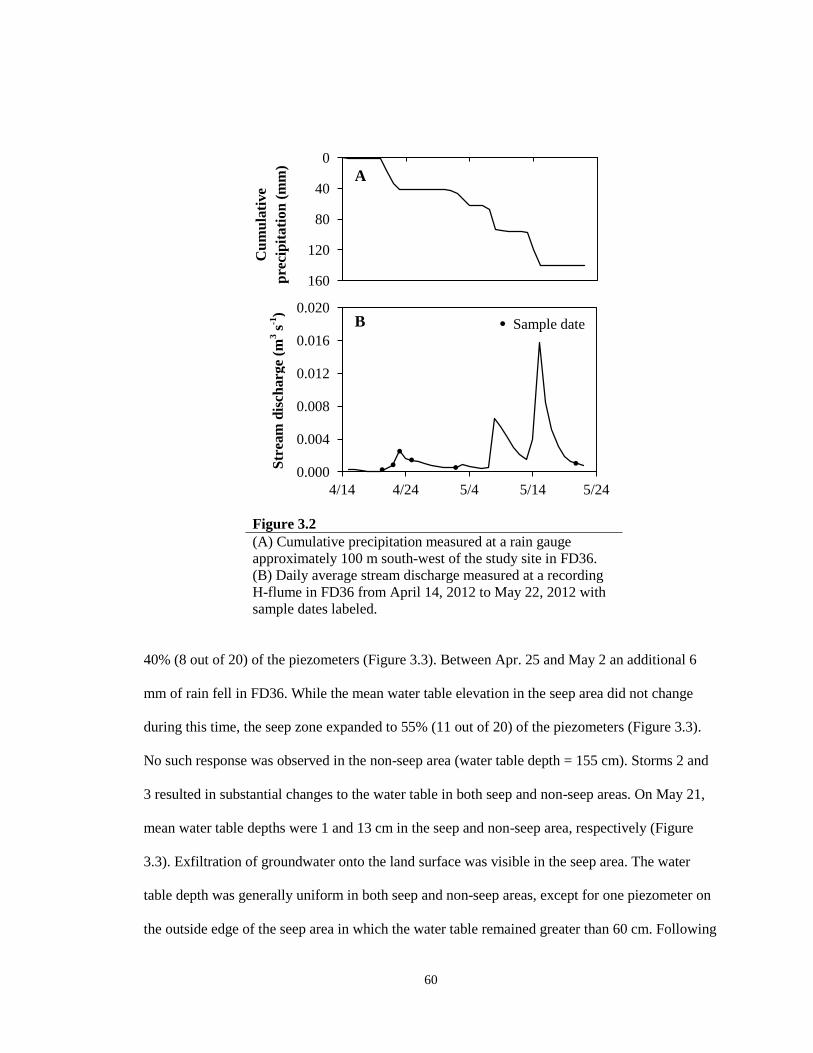
60
Figure 3.2
(A) Cumulative precipitation measured at a rain gauge
approximately 100 m south-west of the study site in FD36.
(B) Daily average stream discharge measured at a recording
H-flume in FD36 from April 14, 2012 to May 22, 2012 with
sample dates labeled.
40% (8 out of 20) of the piezometers (Figure 3.3). Between Apr. 25 and May 2 an additional 6
mm of rain fell in FD36. While the mean water table elevation in the seep area did not change
during this time, the seep zone expanded to 55% (11 out of 20) of the piezometers (Figure 3.3).
No such response was observed in the non-seep area (water table depth = 155 cm). Storms 2 and
3 resulted in substantial changes to the water table in both seep and non-seep areas. On May 21,
mean water table depths were 1 and 13 cm in the seep and non-seep area, respectively (Figure
3.3). Exfiltration of groundwater onto the land surface was visible in the seep area. The water
table depth was generally uniform in both seep and non-seep areas, except for one piezometer on
the outside edge of the seep area in which the water table remained greater than 60 cm. Following
0
40
80
120
160
4/14 4/24 5/4 5/14 5/24
0.000
0.004
0.008
0.012
0.016
0.020
4/14 4/24 5/4 5/14 5/24
Sample date
Cu
mu
lati
ve
pre
cip
ita
tio
n (
mm
) S
trea
m d
isch
arg
e (m
3 s
-1)
A
B

61
Seep area Non-seep area
A (April 23)
B (April 25)
C (May 2)
D (May 21)
Figure 3.3
(A-D) Depth of the water table below the land surface. (A) Apr. 23; (B) Apr. 25; (C) May 2;
(D) May 21. The left column is the seep area and the right column is the non-seep area.
Depths were measured from the 60 cm piezometers in each area. On Apr. 21 and 22, the water
table was > 60 cm in both areas (not shown).
Kriging Prediction
0
10
20
30
40
50
60
Kriging Prediction
0
10
20
30
40
50
60
Kriging Prediction
0
10
20
30
40
50
60
Kriging Prediction
0
10
20
30
40
50
60
Kriging Prediction
0
10
20
30
40
50
60
Kriging Prediction
0
10
20
30
40
50
60
Kriging Prediction
0
10
20
30
40
50
60
Kriging Prediction
0
10
20
30
40
50
60
> 60 cm
> 60 cm
> 60 cm
Kriging Prediction
0
10
20
30
40
50
60
0
10
20
30
40
50
60
Wate
r ta
ble
dep
th (
cm
)
6 m
1.5 m
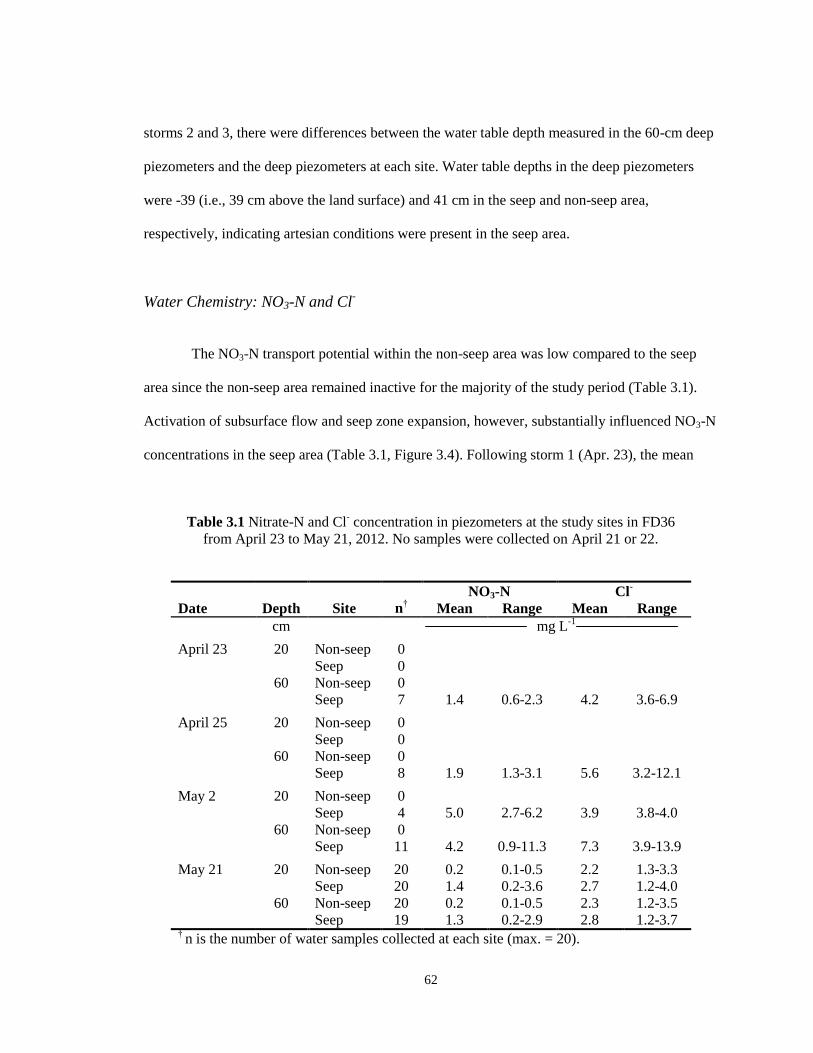
62
storms 2 and 3, there were differences between the water table depth measured in the 60-cm deep
piezometers and the deep piezometers at each site. Water table depths in the deep piezometers
were -39 (i.e., 39 cm above the land surface) and 41 cm in the seep and non-seep area,
respectively, indicating artesian conditions were present in the seep area.
Water Chemistry: NO3-N and Cl-
The NO3-N transport potential within the non-seep area was low compared to the seep
area since the non-seep area remained inactive for the majority of the study period (Table 3.1).
Activation of subsurface flow and seep zone expansion, however, substantially influenced NO3-N
concentrations in the seep area (Table 3.1, Figure 3.4). Following storm 1 (Apr. 23), the mean
Table 3.1 Nitrate-N and Cl- concentration in piezometers at the study sites in FD36
from April 23 to May 21, 2012. No samples were collected on April 21 or 22.
NO3-N Cl-
Date Depth Site n† Mean Range Mean Range
cm mg L-1
April 23 20 Non-seep 0
Seep 0
60 Non-seep 0
Seep 7 1.4 0.6-2.3 4.2 3.6-6.9
April 25 20 Non-seep 0
Seep 0
60 Non-seep 0
Seep 8 1.9 1.3-3.1 5.6 3.2-12.1
May 2 20 Non-seep 0
Seep 4 5.0 2.7-6.2 3.9 3.8-4.0
60 Non-seep 0
Seep 11 4.2 0.9-11.3 7.3 3.9-13.9
May 21 20 Non-seep 20 0.2 0.1-0.5 2.2 1.3-3.3
Seep 20 1.4 0.2-3.6 2.7 1.2-4.0
60 Non-seep 20 0.2 0.1-0.5 2.3 1.2-3.5
Seep 19 1.3 0.2-2.9 2.8 1.2-3.7 † n is the number of water samples collected at each site (max. = 20).

63
20-cm deep piezometers 60-cm deep piezometers
A (April 23)
B (April 25)
C (May 2)
D (May 21)
Figure 3.4
Spatial patterns of NO3-N concentration measured in seep area piezometers in FD36. The left and
right columns are NO3-N concentrations in the 20 cm and 60 cm piezometers, respectively. (A)
Apr. 23; (B) Apr. 25; (C) May 2; (D) May 21. No water samples were collected on Apr. 21 and
22.
Kriging Prediction
0
10
20
30
40
50
60
Kriging Prediction
0
2
4
6
8
10
12
Kriging Prediction
0
10
20
30
40
50
60
Kriging Prediction
0
2
4
6
8
10
12
Kriging Prediction
0
2
4
6
8
10
12
Kriging Prediction
0
2
4
6
8
10
12
Kriging Prediction
0
2
4
6
8
10
12
Kriging Prediction
0
2
4
6
8
10
12
Kriging Prediction
0
2
4
6
8
10
1212.0
10.0
8.0
6.0
4.0
2.0
0.0
Nit
rate
-N c
on
c. (
mg L
-1) > 20 cm
> 20 cm
6 m
1.5 m
64
NO3-N concentration in the seep area was 1.4 mg L-1
. As the water table continued to rise after
storm 1, mean NO3-N concentrations in the seep increased to 1.9 mg L-1
on Apr. 25 and then to
5.0 mg L-1
on May 2. Nitrate-N concentrations were spatially variable in the seep area and ranged
from 0.9 to 11.3 mg L-1
(Table 3.1). In general, NO3-N concentrations in the 60-cm deep
piezometers tended to be greater in areas where the water table was closest to the land surface
(i.e., areas of groundwater upwelling) (Figure 3.4). Nitrate-N concentrations observed in the 20-
cm deep piezometers were less (mean = 4.2 mg L-1
) than NO3-N concentrations in the 60-cm deep
piezometers on May 2 (Table 3.1). When the seep area became fully saturated (May 21), NO3-N
concentrations decreased to 1.4 and 1.3 mg L-1
in the 20- and 60-cm deep piezometers,
respectively (Table 3.1, Figure 3.4). Nitrate-N concentrations, however, remained higher at both
depths within the initial seep zone activation area as shown at the beginning of the sampling
period on Apr. 23 (Figure 3.4). Mean NO3-N concentration in the non-seep area was 0.2 mg L-1
.
Chloride concentrations throughout the study period were also monitored to track
potential sources of water to the seep and non-seep areas. Overall, Cl- concentrations followed a
similar pattern to NO3-N concentrations in both areas (Table 3.1). Mean seep area Cl-
concentration following storm 1 was 4.2 mg L-1
(60-cm deep piezometers) and increased to 5.6
and 7.3 mg L-1
on Apr. 25 and May 2, respectively, as the seep zone expanded. Chloride
concentrations in the 60-cm deep piezometers were similar in the seep (2.8 mg L-1
) and non-seep
(2.3 mg L-1
) areas following storm 3 (p > 0.05; Table 3.1). Comparing NO3-N and Cl-
concentrations collected in piezometers to those measured in groundwater perched on top of the
fragipan (1-m deep monitoring wells) and in the fractured aquifer (6-m deep monitoring wells),
suggests that the source of water to the seep area changed as the seep zone expanded (Figure 3.5).
When the seep area initially became active (Apr. 23 and 25), groundwater from the fractured
aquifer comprised 43% and 66% of the water in the seep area, respectively (Figure 3.5).
However, as the seep zone expanded (May 2), groundwater from the fractured aquifer became the

65
Figure 3.5
Changes in mean seep and non-seep Cl- and NO3-N concentrations
during and following a series of precipitation events compared to
fractured aquifer (deep GW) and perched groundwater (shallow GW)
concentrations. Data for deep and shallow groundwater is from
Williams (Chapter 2). For the seep data: 1 = Apr. 23; 2 = Apr. 25; 3 =
May 2; and 4 = May 21. The non-seep concentration is from May 21.
Error bars represent ± 1 standard error.
predominant source of water to the seep area (~93%). As the seep area approached full saturation
(May 21), groundwater perched on top of the fragipan, which had much lower NO3-N and Cl-
concentrations compared to fractured aquifer, became an important source to the seep area and
comprised 81% of the water. Subsurface water in the non-seep area was largely derived from
perched groundwater on top of the fragipan (~87%) throughout the four-week monitoring period
(Figure 3.5).
Imaging Subsurface Hydrologic Processes with Electrical Resistivity
Electrical resistivity values for both seep and non-seep areas on Apr. 21 (i.e., pre-storm or
background) were between 150 and 650 Ωm, which fall within a typical range of values for soils
0
3
6
9
0 3 6 9
NO
3-N
co
nc.
(m
g L
-1)
Cl- conc. (mg L-1)
Seep
Non-seep
Fractured aquifer (6 m)
Perched GW (1 m)
1 2
3
4

66
and sediments (10 – 1,000 Ωm, Loke, 2001) (Figure 3.6, Figure 3.7). A layer of higher resistivity
(400 – 650 Ωm) between 60 and 160 cm was present in the non-seep area, with lower resistivity
values near the land surface (200 – 300 Ωm) (Figure 3.6). Based on previous soil survey data
from FD36 (Needelman et al., 2002), the layer of higher resistivity corresponded with the
location of a fragipan within the soil profile. The depth and location of the fragipan in the seep
area was not as clearly defined as in the non-seep area (Figure 3.7). The seep area was
characterized by pockets of higher resistivity (400 – 650 Ωm) within the top 80 cm of the soil
profile and low resistivity values (150 – 250 Ωm) between 120 and 160 cm (Figure 3.7). The
antecedent conditions on Apr. 21 were dry in both areas with soil water content in the upper 20
cm ranging from 17% to 22% in the seep area and 14% to 17% in the non-seep areas (Table 3.2).
Soil water content of approximately 40% is representative of saturated conditions in these areas
based on the depth of the water table in the deep piezometer at each site. All changes in resistivity
in subsequent time steps were assumed to be due to variation in soil water content.
Minimal changes in resistivity (0% - 3%) occurred prior to the end of storm 1 (Apr. 22)
in the non-seep area (Figure 3.6). Following storm 1 (Apr. 23), resistivity in the top 60 cm of the
non-seep area decreased between 10% and 25%, which corresponded with a mean increase in soil
water content of 8% (Table 3.2). Declines in resistivity in the non-seep area relative to pre-storm
conditions persisted through May 2 with the vertical migration of water from the surface to
deeper in the soil profile visible with ERI (Figure 3.6). Resistivity in the non-seep area further
decreased following storm 3 in the top 80 cm of the soil profile (Figure 3.6). Decreases in
resistivity of 60% were observed across the entire transect in the non-seep area as the top 80 cm
approached saturation (mean Ө = 46%).
Similar to the non-seep area, small decreases in resistivity (0% - 5%) were observed in
the seep area prior to the end of storm 1 (Figure 3.7). One day following storm 1 (Apr. 23),
resistivity between 0 to 60 cm and 120 and 160 cm in the seep area decreased between 25%

67
Distance (m)
Figure 3.6
(A) Electrical resistivity measured in the non-seep area on April 21, 2012. Data were collected
before a series of three precipitation events and were used as a comparion for subsequent time
steps. (B-F) Change in electrical resistivity relative to background conditions (April 21, 2012).
(B) April 22,2012 (C) April 23, 2012 (D) April 25, 2012 (E) May 2, 2012 (F) May 21, 2012.
0.0
0.4
0.8
1.2
1.6
0 3 6 12 9 15 D
epth
(m
) 650
451
312
216
150 Res
isti
vit
y (Ω
m)
0.0
0.4
0.8
1.2
1.6
0.0
0.4
0.8
1.2
1.6
0.0
0.4
0.8
1.2
1.6
0.0
0.4
0.8
1.2
1.6
0.0
0.4
0.8
1.2
1.6
60
45
30
15
0 D
ecre
ase
in
res
isti
vit
y (
%)
Dep
th (
m)
A
B
C
D
E
F

68
Distance (m)
Figure 3.7
(A) Electrical resistivity measured in the seep area on April 21, 2012. Data were collected before
a series of three precipitation events and were used as a comparion for subsequent time steps. (B-
F) Change in electrical resistivity relative to background conditions (April 21, 2012). (B) April
22,2012 (C) April 23, 2012 (D) April 25, 2012 (E) May 2, 2012 (F) May 21, 2012.
0.0
0.4
0.8
1.2
1.6
0 3 6 12 9 15 D
epth
(m
) 650
451
312
216
150 Res
isti
vit
y (Ω
m)
0.0
0.4
0.8
1.2
1.6
0.0
0.4
0.8
1.2
1.6
0.0
0.4
0.8
1.2
1.6
0.0
0.4
0.8
1.2
1.6
0.0
0.4
0.8
1.2
1.6
60
45
30
15
0 D
ecre
ase
in
res
isti
vit
y (
%)
Dep
th (
m)
A
B
C
D
E
F
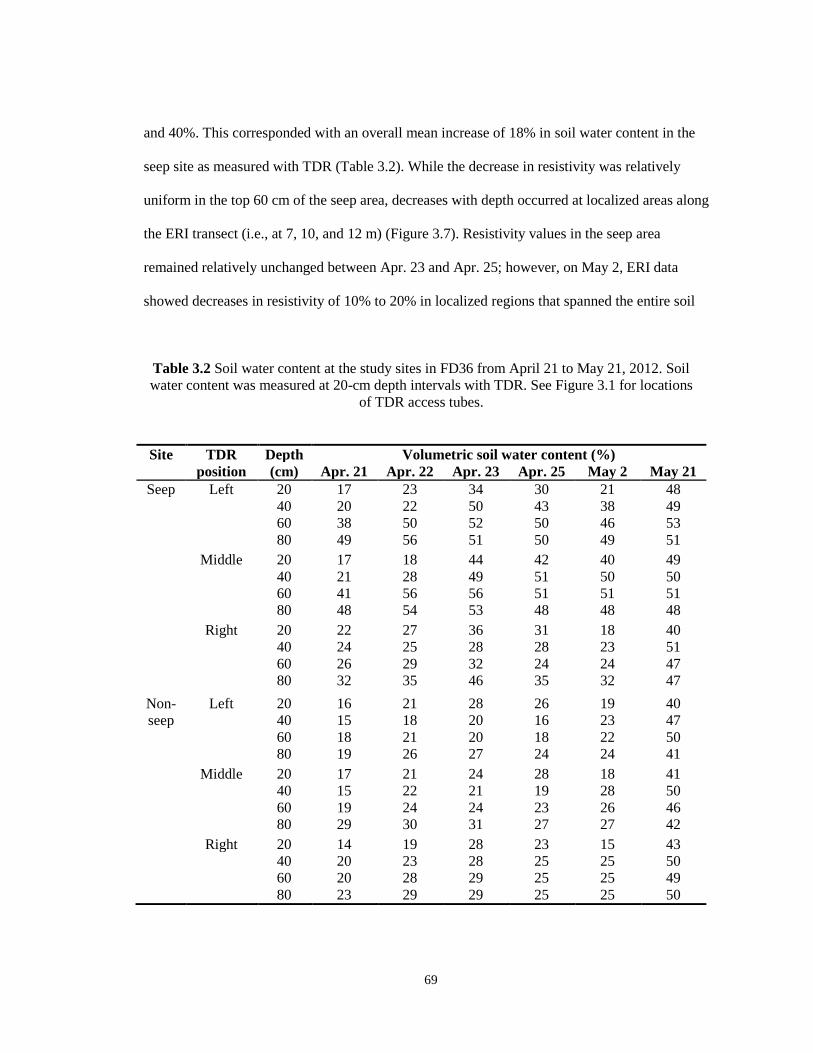
69
and 40%. This corresponded with an overall mean increase of 18% in soil water content in the
seep site as measured with TDR (Table 3.2). While the decrease in resistivity was relatively
uniform in the top 60 cm of the seep area, decreases with depth occurred at localized areas along
the ERI transect (i.e., at 7, 10, and 12 m) (Figure 3.7). Resistivity values in the seep area
remained relatively unchanged between Apr. 23 and Apr. 25; however, on May 2, ERI data
showed decreases in resistivity of 10% to 20% in localized regions that spanned the entire soil
Table 3.2 Soil water content at the study sites in FD36 from April 21 to May 21, 2012. Soil
water content was measured at 20-cm depth intervals with TDR. See Figure 3.1 for locations
of TDR access tubes.
Site TDR Depth Volumetric soil water content (%)
position (cm) Apr. 21 Apr. 22 Apr. 23 Apr. 25 May 2 May 21
Seep Left 20 17 23 34 30 21 48
40 20 22 50 43 38 49
60 38 50 52 50 46 53
80 49 56 51 50 49 51
Middle 20 17 18 44 42 40 49
40 21 28 49 51 50 50
60 41 56 56 51 51 51
80 48 54 53 48 48 48
Right 20 22 27 36 31 18 40
40 24 25 28 28 23 51
60 26 29 32 24 24 47
80 32 35 46 35 32 47
Non- Left 20 16 21 28 26 19 40
seep 40 15 18 20 16 23 47
60 18 21 20 18 22 50
80 19 26 27 24 24 41
Middle 20 17 21 24 28 18 41
40 15 22 21 19 28 50
60 19 24 24 23 26 46
80 29 30 31 27 27 42
Right 20 14 19 28 23 15 43
40 20 23 28 25 25 50
60 20 28 29 25 25 49
80 23 29 29 25 25 50
70
profile in the vertical direction. Following storm 3 (May 21), large decreases in resistivity (60%)
were observed across the entire transect in the seep area, similar to changes in the non-seep area
(Figure 3.7). Large decreases in resistivity were also observed at a depth of 120 – 160 cm and in a
vertical pattern at several localized regions across the monitored seep area (i.e., at 7 and 11 m).
Discussion
Riparian Zone Hydrology and Seep Area Formation
The riparian zone in FD36 is underlain at shallow depth by a fragipan (~60 cm), which
has been shown to affect surface runoff generation (e.g., Gburek et al., 2006; Buda et al., 2009).
Fragipans and other confining layers are common across Pennsylvania (Ciolkosz et al., 2000) and
the eastern U.S. (Grossman and Carlisle, 1969) and are often considered relatively impermeable;
thus, limiting the downward movement of water. Groundwater flow in landscapes with a fragipan
is therefore assumed to move laterally along the fragipan surface before discharging to the stream
(Jordan et al., 1993; Hill, 1996; Bosch et al., 1998). In these settings, upland areas of the
catchment are often considered to be recharge zones and the stream a discharge point. Within
many models of riparian zone hydrology, however, consideration has not been given to the
riparian zone regarding the effects of vertical movement (e.g., infiltration and exfiltration) of
groundwater (Angier et al., 2005). Results from FD36 suggest that in seep areas, even in the
presence of a fragipan at a shallow depth, much of the groundwater travels through the fragipan,
and is delivered to the surface via preferential subsurface flow paths.
Several studies have indicated that vertical groundwater movement via recharge
(O’Connell, 1998; Sharratt, 2001) or discharge (Devito et al., 2000; Angier et al., 2002) is
common in riparian zones, even in those with a restrictive layer. However, characterizing
preferential flow and other rapid transport flow pathways is difficult when using standard
71
hydrometric techniques (Oberdorster et al., 2010). Local observation methods, such as TDR and
monitoring well networks, only sample part of the total soil volume and as a result, their ability to
represent the observed transport may be limited. In this study, we combined standard hydrometric
measurements with ERI in order to improve our concept of riparian zone hydrology in FD36.
Electrical resistivity data provided a distributed assessment of groundwater transport in the
riparian zone, a data set that is impossible to collect using traditional and invasive point
measurements. It also illuminated the spatial and temporal dynamics of groundwater transport by
allowing us to ‘see’ the heterogeneity that existed in subsurface flow pathways. While previous
research in FD36 has documented positive vertical gradients and groundwater upwelling in
several seep areas throughout the catchment (Williams, Chapter 2), we were able to confirm with
ERI that groundwater moved vertically through the fragipan in localized regions within a seep
area following a series of three precipitation events. We were also able to visualize with ERI the
connection between the shallow fractured aquifer below the fragipan and the seepage zone. While
the nature of the preferential flow pathway through the fragipan of the seep area could not be
determined with ERI, fractures in the fragipan, macropores, or the uneven distribution of the
fragipan extent (i.e., heterogeneity) within the riparian zone are possible explanations for
preferential flow paths through the fragipan (Day et al., 1998; Allaire et al., 2009).
Electrical resistivity imaging has the potential to more accurately quantify subsurface
hydrologic processes and provide more spatially complete data than could be collected with
standard methods; however, it remains challenging to correctly interpret and identify processes
when ERI data are the only source of information (Koch et al., 2009). Complementary evidence
from hydrometric measurements is therefore necessary for a more comprehensive interpretation
of subsurface flow paths. In the riparian zone of FD36, water chemistry data aided in the
interpretation of ERI results. The groundwater perched on top of the fragipan and in the shallow
fractured aquifer below the fragipan in FD36 was previously shown to have different

72
concentrations of NO3-N and Cl- that could be used to resolve the relative importance of these
sources of groundwater in seep and non-seep areas (Williams, Chapter 2). In this study, NO3-N
and Cl- concentrations increased over the course of three precipitation events, indicating that
groundwater from the shallow fractured aquifer, which has higher NO3-N concentrations, became
more important over time as the riparian zone wetted up and the seep zone expanded. Indeed,
Burns et al. (1998) also found that groundwater discharging from seeps in the Catskill Mountains
of New York originated from varying sources of water depending on the season and seep
discharge rate. In comparison, the NO3-N and Cl- concentrations of the non-seep area in FD36
were similar to those measured in perched groundwater at saturation, which suggested that in
these areas of the riparian zone, groundwater flow is limited to lateral movement through the
shallow subsurface system above the fragipan and is mostly disconnected from groundwater
below the fragipan. Therefore, the combination of hydrometric and ERI results in FD36
demonstrate that the characteristics of the fragipan appear to control the location of seep areas in
the riparian zone.
Results from standard hydrometric measurements and ERI in the riparian zone of FD36
in this study were in agreement. That is, piezometric, water chemistry, and ERI data all provided
evidence of groundwater upwelling in seep areas and lateral flow on top of the fragipan in non-
seep areas. Other studies, however, have found that observed spatial ERI patterns do not conform
to the subsurface processes supported by previous hydrometric research (e.g., Koch et al., 2009).
The joint interpretation of hydrometric data and ERI in these situations has the potential to
provide new ideas about the possible functioning of a local hydrologic system, allow for
reinterpretation of preconceived hydrologic processes, and generate research questions and
hypotheses.
73
Linking Hydrology and Nitrogen Transport
Stream riparian zones often present conditions (e.g., soils high in organic carbon,
anaerobic conditions, and wide vegetated corridors) that are considered favorable for NO3-N
removal (Emmet et al., 1994; Peterson et al., 2001). Significant groundwater NO3-N, however,
may nevertheless be transported through the riparian zone to the stream (Hill et al., 2000;
McCarty and Angier, 2001). Therefore, knowledge of hydrology has been deemed essential to
further understand riparian zone chemistry (Hill, 1996). In the non-seep area in FD36, NO3-N
concentrations were low (0.2 mg L-1
) following storm 3 (May 21). Electrical resistivity data
showed that lateral subsurface flow on top of the fragipan was the primary pathway for NO3-N
transport in non-seep areas. Low NO3-N concentrations in non-seep areas in FD36 are consistent
with many other studies in which riparian zones underlain by a fragipan or other impermeable
layer are effective in removing NO3-N from groundwater (e.g., Peterjohn and Correll, 1984).
These shallow lateral flow paths often maximize the interaction with riparian soils and vegetation,
which promotes denitrification and vegetative uptake. While NO3-N removal was not observed
within the non-seep area, it is possible that the majority of NO3-N removal occurred at the
upland-riparian zone interface (Hill et al., 2000) and the NO3-N concentrations that were
measured in the piezometers reflected the effectiveness of the riparian zone in removing N along
this flow path.
Differences in NO3-N concentration between the seep and non-seep study areas in FD36
highlight how subtle differences in hydrology can influence groundwater quality and transport
potential. Nitrate-N concentrations measured in the seep area were 8 to 25 times greater than
NO3-N concentrations measured in the non-seep area. Electrical resistivity showed that
groundwater was upwelling through the fragipan via preferential flow paths in the seep area and
as a result, likely had limited interaction with the surface riparian soils and minimal reductions in
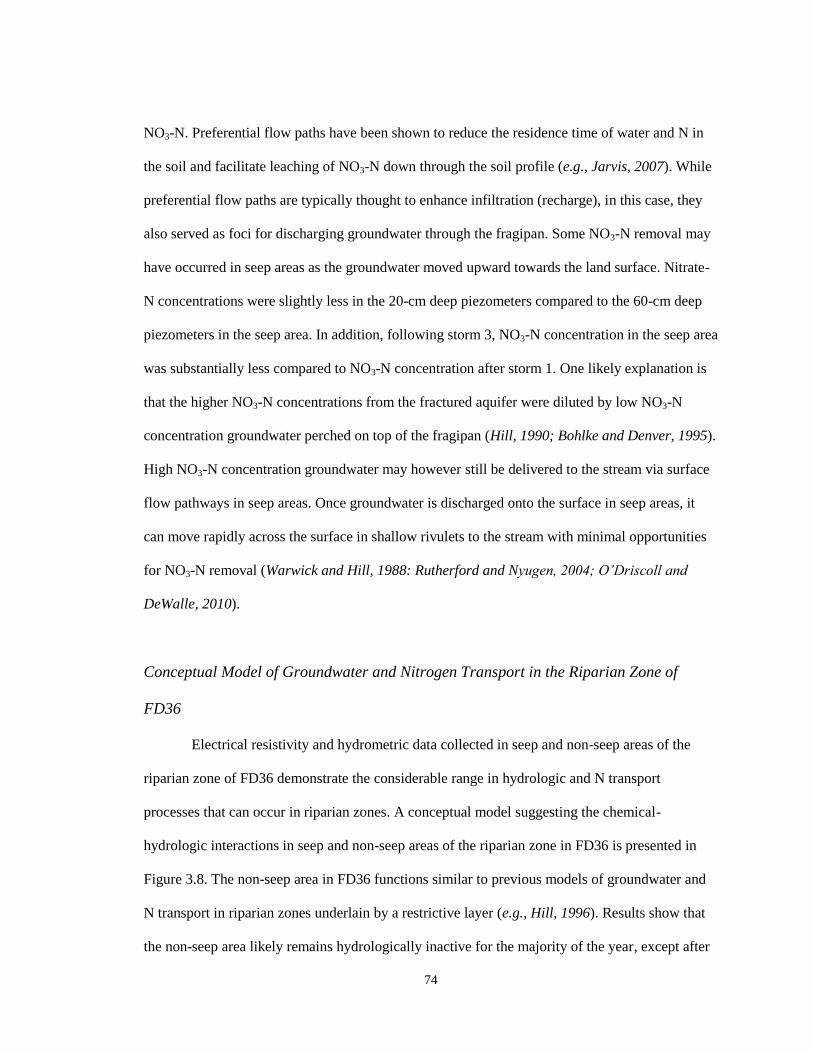
74
NO3-N. Preferential flow paths have been shown to reduce the residence time of water and N in
the soil and facilitate leaching of NO3-N down through the soil profile (e.g., Jarvis, 2007). While
preferential flow paths are typically thought to enhance infiltration (recharge), in this case, they
also served as foci for discharging groundwater through the fragipan. Some NO3-N removal may
have occurred in seep areas as the groundwater moved upward towards the land surface. Nitrate-
N concentrations were slightly less in the 20-cm deep piezometers compared to the 60-cm deep
piezometers in the seep area. In addition, following storm 3, NO3-N concentration in the seep area
was substantially less compared to NO3-N concentration after storm 1. One likely explanation is
that the higher NO3-N concentrations from the fractured aquifer were diluted by low NO3-N
concentration groundwater perched on top of the fragipan (Hill, 1990; Bohlke and Denver, 1995).
High NO3-N concentration groundwater may however still be delivered to the stream via surface
flow pathways in seep areas. Once groundwater is discharged onto the surface in seep areas, it
can move rapidly across the surface in shallow rivulets to the stream with minimal opportunities
for NO3-N removal (Warwick and Hill, 1988: Rutherford and Nyugen, 2004; O’Driscoll and
DeWalle, 2010).
Conceptual Model of Groundwater and Nitrogen Transport in the Riparian Zone of
FD36
Electrical resistivity and hydrometric data collected in seep and non-seep areas of the
riparian zone of FD36 demonstrate the considerable range in hydrologic and N transport
processes that can occur in riparian zones. A conceptual model suggesting the chemical-
hydrologic interactions in seep and non-seep areas of the riparian zone in FD36 is presented in
Figure 3.8. The non-seep area in FD36 functions similar to previous models of groundwater and
N transport in riparian zones underlain by a restrictive layer (e.g., Hill, 1996). Results show that
the non-seep area likely remains hydrologically inactive for the majority of the year, except after
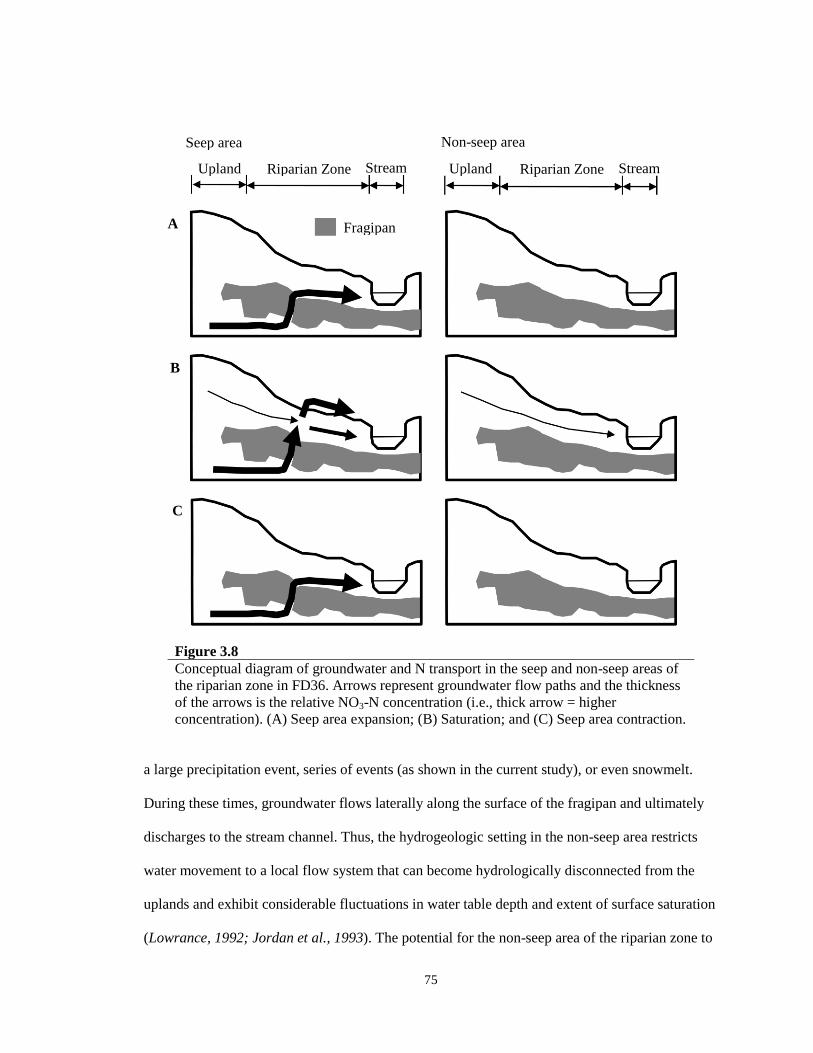
75
Figure 3.8
Conceptual diagram of groundwater and N transport in the seep and non-seep areas of
the riparian zone in FD36. Arrows represent groundwater flow paths and the thickness
of the arrows is the relative NO3-N concentration (i.e., thick arrow = higher
concentration). (A) Seep area expansion; (B) Saturation; and (C) Seep area contraction.
a large precipitation event, series of events (as shown in the current study), or even snowmelt.
During these times, groundwater flows laterally along the surface of the fragipan and ultimately
discharges to the stream channel. Thus, the hydrogeologic setting in the non-seep area restricts
water movement to a local flow system that can become hydrologically disconnected from the
uplands and exhibit considerable fluctuations in water table depth and extent of surface saturation
(Lowrance, 1992; Jordan et al., 1993). The potential for the non-seep area of the riparian zone to
Seep area Non-seep area
Upland Riparian Zone Stream Upland Riparian Zone Stream
A
B
C
Fragipan

76
remove NO3-N is high, due to increased interaction with riparian soils and vegetation as
groundwater moves laterally toward the stream.
In comparison to the non-seep area, the seep area of the riparian zone in FD36 is much
more complex in terms of hydrology and N transport. Electrical resistivity results highlight the
role of preferential flow pathways in connecting deeper groundwater from the fractured aquifer
system to surface seepage zones. While the nature of the preferential flow paths (i.e., fractures,
macropores, etc.) could not be determined with ERI, upwelling groundwater in these localized
regions creates an area of the riparian zone that is hydrologically dynamic. In seep areas, only a
relatively small amount of precipitation (41 mm) was required to activate groundwater flow. The
size of the saturated area and the amount of water table rise will depend on the event duration and
intensity, but the seep area will remain active until another event or series of events continues to
expand the seep area or the groundwater drains to the stream during dry conditions. As the seep
area becomes active, NO3-N removal potential is low due to rapid flows through riparian zone
soils via preferential flow paths. At saturation, however, groundwater flow in the seep area was
found to be a mixture of sources, which results in the dilution of NO3-N concentrations under
these conditions. While this study was focused primarily on seep zone activation and expansion,
results from other studies suggest that that seeps will remain active following precipitation events
and continue to supply baseflow to the stream (Srinivasan et al., 2002; O’Driscoll and DeWalle,
2010). During seep area contraction, NO3-N concentrations will likely increase as groundwater
from the shallow fractured aquifer becomes the predominant source of water in the seep area.
Conclusions
Results of this study show that in FD36, riparian zone hydrology exerts a strong influence
on the chemistry of groundwater being delivered to the stream. During a series of three
77
precipitation events, monitoring of water table fluctuations and NO3-N concentrations in nested
piezometers showed that seep areas were more dynamic (i.e., rapid water table rise) and
transported groundwater higher in NO3-N concentration compared to non-seep areas of the
riparian zone. The interpretation of these results was further enhanced with the use of ERI, which
elucidated differences in subsurface hydrologic processes occurring within the seep and non-seep
areas. In FD36, preferential flow paths through the fragipan where inferred using evidence from
hydrometric measurements and simple mixing models, and then confirmed using data from ERI.
These preferential flow paths likely resulted in shorter groundwater residence times in the
subsurface, which decreased the NO3-N removal potential compared to slower, lateral
groundwater flow paths in non-seep areas of the riparian zone. This study also demonstrates the
utility of ERI as a valuable tool to understand the hydrology and chemistry of riparian zone seeps.
While ERI is clearly useful in riparian zone research, it may not be feasible to image the entire
riparian zone, even within a small catchment like FD36. Therefore, future studies should focus on
better ways to identify zones of seepage in the riparian zone that may contribute higher fluxes of
water and N to streams.
References
Allaire, S.E., S. Roulier, and A.J. Cessna. 2009. Quantifying preferential flow in soils: a review
of different techniques. J. Hydrol. 378:179-204.
Angier, J.T., G.W. McCarty, and K.L. Prestegaard. 2005. Hydrology of a first-order riparian zone
and stream, mid-Atlantic coastal plain, Maryland. J. Hydrol. 309:149-166.
Angier, J.T., G.W. McCarty, C.P. Rice, and K. Bialek. 2002. Influence of a riparian wetland on
nitrate and herbicides exported from a field applied with agrochemicals. Journal of
Agriculture and Food Chemistry. 50:4424-4429.
Besson, A., I. Cousin, A. Samouelian, H. Boizard, and G. Richard. 2004. Structural heterogeneity
of the soil tilled layer as characterized by 2D electrical resistivity surveying. Soil Till.
Res. 79:239-249.

78
Besson, A., I. Cousin, H. Bourennane, B. Nicoullaud, C. Pasquier, G. Richard, A. Dorigny, and
D. King. 2010. The spatial and temporal organization of soil water at the field scale as
described by electrical resistivity measurements. Eur. J. Soil. Sci. 61:120-132.
Bohlke, J.K., and J.M. Denver. 1995. Combined use of groundwater dating, chemical, and
isotopic analysis to resolve the history and fate of nitrate contamination in two
agricultural watersheds, Atlantic coastal plain, Maryland. Water Resour. Res. 31:2319-
2339.
Bosch, D.D., R.K. Hubbard, L.T. West, and R.R. Lowrance. 1998. Subsurface flow patterns in a
riparian buffer system. Trans. ASAE 37:1783-1790.
Bryant, R.B., T.L. Veith, G.W. Feyereisen, A.R. Buda, C.D. Church, G.J. Folmar, J.P. Schmidt,
C.J. Dell, and P.J.A. Kleinman. 2011. U.S. Department of Agriculture Agricultural
Research Service Mahantango creek watershed, Pennsylvania, United States:
phsiography and history. Water Resour. Res. 47: DOI: 10.1029/2010WR010056.
Buda, A.R., P.J.A. Kleinman, M.S. Srinivasan, R.B. Bryant, and G.W. Feyereisen. 2009. Factors
influencing surface runoff generation from two agricultural hillslopes in central
Pennsylvania. Hydrol. Process. 23:1295-1312.
Buda, A.R., T.L. Veith, G.J. Folmar, G.W. Feyereisen, R.B. Bryant, C.D. Church, J.P. Schmidt,
C.J. Dell, and P.J.A. Kleinman. 2011. U.S. Department of Agriculture Agricultural
Research Service Manhantango creek watershed, Pennsylvania, United States: long-term
precipitation database. Water Resour. Res. 47: DOI: 10.1029/2010WR010058.
Burns, D.A., P.S. Murdoch, and G.B. Lawrence. 1998. Effect of groundwater springs on NO3-
concentrations during summer in Catskill Mountain streams. Water Resour. Res.
34:1987-1996.
Cassiani, G., V. Bruno, A. Villa, N. Fusi, and A.M. Binley. 2006. A saline trace test monitored
via time-lapse surface electrical resistivity tomography. J. Appl. Geophys. 59:244-259.
Ciolkosz, E.J., and W.J. Waltman. 2000. Pennsylvania’s fragipans. The Pennsylvania State
University Agronomy Series Number 147. University Park, PA.
Day, R.L., M.A. Calmon, J.M. Stiteler, J.D. Jabro, and R.L. Cunningham. 1998. Water balance
and flow patterns in a fragipan using in situ soil block. Soil Sci. 163:517-528.
Devito, K.J., D. Fitzgerald, A.R. Hill, and R. Aravena. 2000. Nitrate dynamics in relation to
lithology and hydrologic flow path in a river riparian zone. J. Environ. Qual. 29:1075-
1084.
Emmett, B.A., J.A. Hudson, P.A. Coward, and B. Reynolds. 1994. The impact of a riparian
wetland on stream water quality in a recently afforested upland catchment. J. Hydrol.
162:337-353.
Gburek, W.J., and A.N. Sharpley. 1998. Hydrologic controls on phosphorus loss from upland
agricultural watersheds. J. Environ. Qual. 27:267-277.

79
Gburek, W.J., and G.J. Folmar. 1999. Patterns of contaminant transport in a layered fractured
aquifer. J. Contam. Hydrol. 37:87-109.
Gburek, W.J., B.A. Needelman, M.S. Srinivasan. 2006. Fragipan controls on runoff generation:
hydropedological implications at landscape and watershed scales. Geoderma 131:330-
344.
Gentry, W.M., and T.J. Burbey. 2004. Characterization of groundwater flow from spring
discharge in a crystalline rock environment. J. Am. Water Resour. Assoc. 40:1205-1217.
Grossman, R.B., and F.J. Carlisle. 1969. Fragipans of the eastern United States. Adv. Agron.
21:237-239.
Hill, A.R. 1990. Groundwater flow paths in relation to nitrogen chemistry in the near-stream
zone. Hydrobiologia 206:39-52.
Hill, A.R. 1996. Nitrate removal in stream riparian zones. J. Environ. Qual. 25: 743-755.
Hill, A.R., K.J. Devito, S. Campangnolo, and K. Sanmugadas. 2000. Substrate denitrification in a
forest riparian zone: interactions between hydrology and supplies of nitrate and organic
carbon. Biogeochemistry 51:193-223.
Jarvis, N.J. 2007. A review of non-equilibrium water flow and solute transport in soil
macropores: principles, controlling factors and consequences for water quality. Eur. J.
Soil Sci. 58:523-546.
Jordan, T.E., D.L. Correll, and D.E. Weller. 1993. Nutrient interception by a riparian forest
receiving inputs from adjacent cropland. J. Environ. Qual. 22:467-473.
Kemna, A., J. Vanderborght, B. Kulessa, and H. Vereecken. 2002. Imaging and characterization
of subsurface solute transport using electrical resistivity tomography (ERT) and
equivalent transport models. J. Hydrol. 267:125-146.
Koch, K., J. Wenninger, S. Uhlenbrook, and M. Bonell. 2009. Joint interpretation of hydrological
and geophysical data: electrical resistivity tomography results from a process
hydrological research site in the Black Forest Mountains, Germany. Hydrol. Process.
23:1501-1513.
Lindsey, B.D., S.W. Phillips, C.A. Donnelly, G.K. Speiran, L.N. Plummer, J.K. Bohlke, M.J.
Focazio, W.C. Burton, and E. Busenberg. 2003. Residence times and nitrate transport in
groundwater discharging to streams in the Chesapeake Bay watershed. U.S. Geological
Survey Water Resources Investigations Report 03-4035.
Loke, M.H. 2001. Tutorial: 2-D and 3-D electrical imaging surveys. Course notes for USGS
workshop 2-D and 3-D inversion and modeling of surface and borehole resistivity data.
Torrs, CT.
Lowrance, R.R. 1992. Groundwater nitrate and denitrification in a coastal riparian forest. J.
Environ. Qual. 21:401-405.

80
McCarty, G.W., and J.T. Angier. 2001. Impact of preferential flow pathways on ability of riparian
wetlands to mitigate agricultural pollution. Proc. 2nd
International Preferential Flow
Symposium. ASAE. 2001; 53-56. Honolulu, HI.
Michot, D., Y. Benderitter, A. Dorigny, B. Nicoullaud, D. King, and A. Tabbagh. 2003. Spatial
and temporal monitoring of soil water content with an irrigated corn crop cover using
surface electrical resistivity tomography. Water Resour. Res. 39:1138-1144.
Morley, T.R., A.S. Reeve, and A.J.K Calhoun. 2011. The role of headwater wetlands in altering
streamflow and chemistry in a Maine, USA catchment. J. Am. Water. Resour. Assoc.
47:337-349.
Needlelman, B.A. 2002. Surface runoff hydrology and phosphorus transport along two
agricultural hillslopes with contrasting soils. Ph.D. Thesis. The Pennsylvania State
University, University Park, PA.
Oberdorster, C., J. Vanderborght, A. Kemna, and H. Vereecken. 2010. Investigating preferential
flow processes in a forest soil using time-domain reflectometry and electrical resistivity
tomography. Vadose Zone J. 9:350-361.
O’Connell, M. 1998. Combined hydrologic and geochemical study of storm and seasonal delivery
of solutes to streamflows. PhD. Thesis, University of Maryland, College Park.
O’Driscoll, M.A., and D.R. DeWalle. 2010. Seeps regulate stream nitrate concentration in
forested Appalachian catchments. J. Environ. Qual. 39:420-431.
O’Sullivan, D. and J.J. Unwin. 2010. Geographic Information Analysis. John Wiley & Sons, Inc.
New York, NY.
Patton, C.J., and J.R. Kryskalla. 2003. Methods of analysis by the U.S. Geological Survey
National Water Quality Laboratory: evaluation of alkaline persulfate digestion as an
alternative to Kjeldahl digestion for determination of total dissolved nitrogen and
phosphorus in water. U.S. Geological Survey water resources investigations report 03-
4174, 33 p.
Peterjohn, W.T., and D.L. Correll. 1984. Nutrient dynamics in an agricultural watershed:
observations on the role of a riparian forest. Ecology 65:1466-1475.
Peterson, B.J., W.M. Wolheim, P.J. Mulholland, J.R. Webster, J.L. Meyer, J.L. Tank, E. Marti,
W.B. Bowden, H.M. Valett, A.E. Hershey, W.H. McDowell, W.K. Dodds, S.K.
Hamilton, S. Gregory, and D.D. Morrall. 2001. Control of nitrogen export from
watersheds by headwater streams. Science 292:86-90.
Pionke, H.B., and J.B. Urban. 1985. Effect of agriculture land use on ground-water quality in a
small Pennsylvania watershed. Groundwater. 23:68-80.
Pionke, H.B., J.R. Hoover, R.R. Schnabel, W.J. Gburek, J.B. Urban, and A.S. Rogowski. 1988.
Chemical-hydrologic interactions in the near-stream zone. Water Resour. Res. 24:1101-
1110.
81
R Development Core Team. 2011. R: a language and environment for statistical computing. R
Foundation for Statistical Computing, Vienna, Austria.
Rutherford, J.C., and M.L. Nguyen. 2004. Nitrate removal in riparian wetlands: interactions
between surface flow and soils. J. Environ. Qual. 33:1133-1143.
Schnabel, R.R., J.B. Urban, and W.J. Gburek. 1993. Hydrologic controls in nitrate, sulfate, and
chloride concentrations. J. Environ. Qual. 22:589-596.
Seger, M., I. Cousin, A. Frison, H. Boizard, and G. Richard. 2009. Characterization of the
structural heterogeneity of the soil tilled layer by using in situ 2D and 3D electrical
resistivity measurements. Soil Till. Res. 103:387-398.
Sharratt, B.S. 2001. Groundwater recharge during spring thaw in the prairie pothole region via
large, unfrozen preferential pathways. Proc. 2nd
International Preferential Flow
Symposium. ASAE. 2001; 49-52. Honolulu, HI.
Slater, L., A.M. Binley, W. Daily, and R. Johnson. 2000. Cross-hole electrical imaging of a
controlled saline tracer injection. J. Appl. Geophys. 44:85-102.
Srinivasan, M.S., W.J. Gburek, and J.M. Hamlett. 2002. Dynamics of stormflow generation - a
hillslope-scale field study in east-central Pennsylvania, USA. Hydrol. Process. 16:649-
665.
Stein, E.D., M. Mattson, A.E. Fetscher, and K.J. Halama. 2004. Influence of geologic setting on
slope wetland dynamics. Wetlands 24:244-260.
Vanderborght, J., A. Kemna, H. Hardelauf, and H. Vereecken. 2005. Potential of electrical
resistivity tomography to infer aquifer transport characteristics from tracer studies: a
synthetic case study. Water Resour. Res. 41:1-23.
Vidon, P.G.F., and A.R. Hill. 2004. Landscape controls on nitrate removal in stream riparian
zones. Water Resour. Res. 40:1-14.
Ward, A.S., M.N. Gooseff, and K. Singha. 2010. Imaging hyporheic zone solute transport using
electrical resistivity. Hydrol. Process. 24:948-953.
Warwick, J., and A.R. Hill. 1988. Nitrate depletion in the riparian zone of a small woodland
stream. Hydrobiologia 157:231-240.
82
CHAPTER 4
Influence of Riparian Seepage Zones on Nitrate Variability in Stream
Water during Baseflow and Stormflow in Two Agricultural Headwater
Catchments
Abstract
Surface seeps or seepage zones are one of the primary pathways of groundwater
transport to headwater streams. While seeps have been recognized for their contributions to
streamflow, there is little information on how seeps affect stream water quality. The objective of
this study was to examine the influence of seeps on stream nitrate-nitrogen (NO3-N)
concentrations in FD36 and RS, two central Pennsylvania agricultural headwater catchments.
From April 2009 to January 2012, stream water was sampled on 21 occasions (14 during
baseflow; 7 during or following storm events) at 10-m intervals over stream reaches of 550 and
490 m in FD36 and RS, respectively. Nitrate concentrations in seep discharge were measured
concurrent with stream water. Results showed NO3-N concentrations in stream segments with
seeps increased, on average, by 0.25 mg L-1
. In contrast, NO3-N concentrations declined by 0.02
mg L-1
in stream segments with no seep inputs. The number of seep discharge locations was also
positively correlated (R2 = 0.82) to spatial patterns observed in stream NO3-N concentration.
Immediately following storm events, the influence of seeps on stream NO3-N concentration was
less compared to baseflow. The effect of seeps on stream NO3-N concentration was likely
diminished due to increased stream discharge and the addition of rainfall directly into the stream

83
during and immediately following the event. One day after a summer storm in FD36, however, an
increase in the number of seeps and decreasing stream discharge, resulted in the greatest
variability in stream water NO3-N concentration recorded. These results suggest that seeps are
significant sources of NO3-N to the streams in FD36 and RS and play a key role in determining N
fluxes from these catchments.
Introduction
Transfers of nitrogen (N) from terrestrial to aquatic ecosystems contribute to watershed
impairment and can lead to eutrophication of coastal zones (where N is often the limiting
nutrient) (Carpenter et al., 1998). Agriculture is an important source of N to surface waters
(Craig and Weil, 1993; Tesoriero et al., 2000) and accounts for approximately 37% of the N load
delivered to the Chesapeake Bay (U.S. EPA, 2008). Recent work by Peterson et al. (2001) and
Alexander et al. (2007) point to the importance of headwater streams as major contributors of N
to downstream (higher order) systems. Thus, identifying sources of N to headwater streams and
evaluating the effects of these sources on water quality is essential for the attainment of
downstream water quality goals.
In the Northeast U.S., groundwater-sustained wetlands, springs, or emergent groundwater
seeps (hereafter referred to as seeps) represent a potentially significant source of water and N to
many headwater streams. Burns et al. (1998) found that discharge from perennial seeps was the
principal source of streamflow and nitrate-N (NO3-N) in a forested headwater catchment in New
York. Similarly, seep NO3-N concentrations in a forested headwater catchment in Pennsylvania
were linked with stream NO3-N concentrations (O’Driscoll and DeWalle, 2010). In agricultural
headwater catchments, recent work by Shabaga and Hill (2010) and Williams (Chapters 2 and 3)
also suggest that seeps are a potential source of NO3-N to streams.
84
Seeps often discharge groundwater to the surface in the riparian zone, which flows over
land via concentrated flow paths before entering the stream at discrete points along the channel
(Pionke et al., 1988; Rutherford and Nyugen, 2004; O’Driscoll and DeWalle, 2010). As a result,
these point inputs can influence spatial patterns of N concentration in headwater streams similar
to the effects of tributary inputs on higher order streams. Numerous studies have characterized the
effects of tributaries and other point sources on in-stream variability of chemical constituents. For
example, Haggard et al. (2001) examined the effect of point sources on water chemistry and
nutrient retention during baseflow. The effects of wastewater treatment plant effluent on stream
water quality have also been documented (Marti et al., 2004). In addition, the influence of
tributaries on sediment transport (e.g., Boyer et al., 2006), stream organisms (e.g., Fraser et al.,
1995), and water quality (e.g., Scanlon et al., 2010) has been studied extensively. Fewer studies,
however, have looked at how seeps influence the variability of N in streams.
Semi-variogram analysis is a valuable tool for exploring the variability of nutrients, such
as N, in terrestrial and aquatic ecosystems. This method has been used in a variety of fields
including ecology (i.e., organism response to environmental heterogeneity), soil science (i.e.,
distribution of nutrient concentrations over an area), and geology (i.e., estimation of ore reserves).
Semi-variograms quantify the strength, pattern, and extent of spatial dependence by examining
how nutrient concentrations (or other data) co-vary as a function of the distance between
sampling locations (Cooper et al., 1997). That is, semi-variograms can be used to quantify the
distance over which data are spatially correlated (e.g., semi-variogram range) and are no longer
considered spatially dependent (Rossi et al., 1992). The utility of semi-variograms in exploring
longitudinal N variability in streams is that they can aid in the identification of potential causes of
spatial patterns (Legendre and Fortin, 1989; Rossi et al., 1992).
Several recent studies have used semi-variogram analysis to quantify the variability of
nutrients in higher order streams. Dent and Grimm (1999) found that nutrient concentrations were
85
extremely variable along a 10 km stream reach in Arizona. The authors concluded that N was
consistently more spatially heterogeneous than phosphorus or conductivity. Within a large stream
network in Maryland, Peterson et al. (2006) showed that the semi-variogram range and patterns of
spatial correlation differed between chemical response variables, which were influenced by
hydrologic and biogeochemical processes acting along a stream reach. Semi-variogram analysis
has also been used extensively in studies aimed toward the prediction of nutrient concentrations at
unmonitored locations within a stream network (Gardener et al., 2003; Ver Hoef et al., 2006).
While most of these studies have been conducted at baseflow, the study by Dent and Grimm
(1999) indicated that in-stream N variability can change with flow condition. They showed that
flooding substantially decreased spatial variability in stream nutrient concentrations and increased
the semi-variogram range. Distinguishing between different flows (i.e., baseflow vs. stormflow)
is important because seeps are seen as a major contributor at baseflow, but less so during storms.
In this study, we examine the influence of groundwater-fed seeps on the longitudinal
variation of N concentrations in FD36 and RS, two agricultural headwater streams, during
baseflow and stormflow conditions. Specific study objectives were to (1) quantify the variability
of N concentrations in two agricultural headwater streams; (2) determine if spatial patterns of
stream N concentrations are influenced by seeps; and (3) examine the controls of baseflow and
stormflow on in-stream N variability.
Materials and Methods
Site Location and Characteristics
The study was implemented in two headwater catchments (FD36 [40 ha] and RS [45 ha])
with seeps located within the Appalachian Ridge and Valley physiographic region of east-central
Pennsylvania (Figure 4.1). FD36 and RS are sub-catchments of the WE-38 experimental
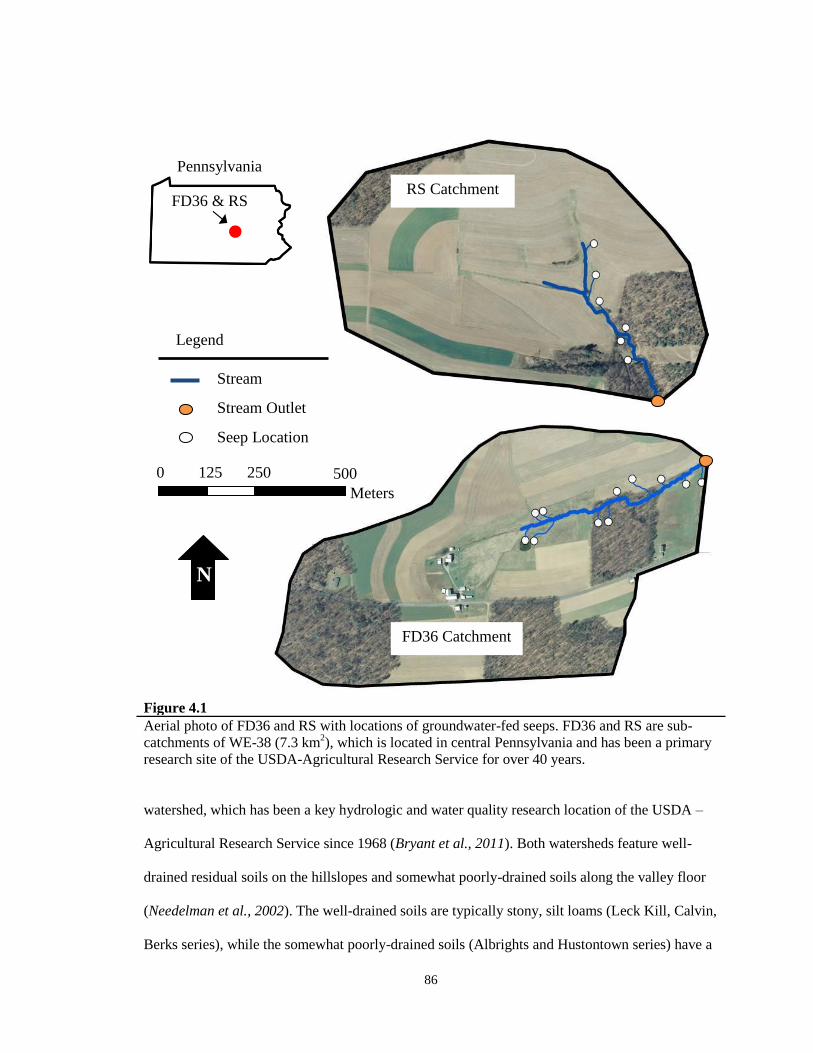
86
Figure 4.1
Aerial photo of FD36 and RS with locations of groundwater-fed seeps. FD36 and RS are sub-
catchments of WE-38 (7.3 km2), which is located in central Pennsylvania and has been a primary
research site of the USDA-Agricultural Research Service for over 40 years.
watershed, which has been a key hydrologic and water quality research location of the USDA –
Agricultural Research Service since 1968 (Bryant et al., 2011). Both watersheds feature well-
drained residual soils on the hillslopes and somewhat poorly-drained soils along the valley floor
(Needelman et al., 2002). The well-drained soils are typically stony, silt loams (Leck Kill, Calvin,
Berks series), while the somewhat poorly-drained soils (Albrights and Hustontown series) have a
N
Meters
0 500 250 125
Pennsylvania
FD36 & RS RS Catchment
FD36 Catchment
Legend
Stream
Stream Outlet
Seep Location
N
87
moderately-well developed fragipan beginning at a depth of 0.5 to 0.7 m and have low
permeability. The dominant land use in FD36 and RS is agriculture, which comprises 56% and
75% of the land area in each catchment, respectively (Figure 4.1). The common crop rotations in
FD36 and RS include three- to four-year sequences of corn, small grains, hay, and soybeans.
Crops are planted on upslope fields in both catchments and the riparian zones in each catchment
are variable in width and planted with grasses. Annual farmer surveys show that most N is
applied during the spring and fall as commercial fertilizer, dairy manure, or swine manure. From
2007 through 2011, surveys showed that mean N application rate was significantly greater in RS
(200 kg ha-1
) compared to mean N application rate in FD36 (133 kg ha-1
) (p < 0.001; Table 4.1).
The streams that drain the FD36 and RS catchments flow for most (if not all) of the year.
The stream channel in FD36 follows a gentle gradient (3%) from the headwaters to the outlet, and
flow rates range from about 5.8 x 10⁻³
m3 s
-1 at baseflow to 3.78 x 10
-2 m
3 s
-1 at stormflow. The
stream channel in RS is much steeper than that of FD36, with a gradient of about 6%. Unlike
FD36, the RS catchment is ungauged, but given the similarity in size, as well as in its soil and
geologic characteristics, we expect the flows to be comparable. Both catchments contain
numerous groundwater seeps, which is the focus of this study. Previous work by Williams
(Chapters 2 and 3) highlights the potential importance of these seeps as sources of NO3-N to
agricultural headwater streams.
Stream and Seep Water Sampling
Stream study reaches were established in FD36 (550-m long) and RS (490-m long) in
order to monitor variations in N concentrations in stream and seep water. In each study reach,
stream and seep water were sampled on 21 occasions (14 at baseflow; 7 during or following
storm events) between April 2009 and January 2012. On each sampling date, stream water was
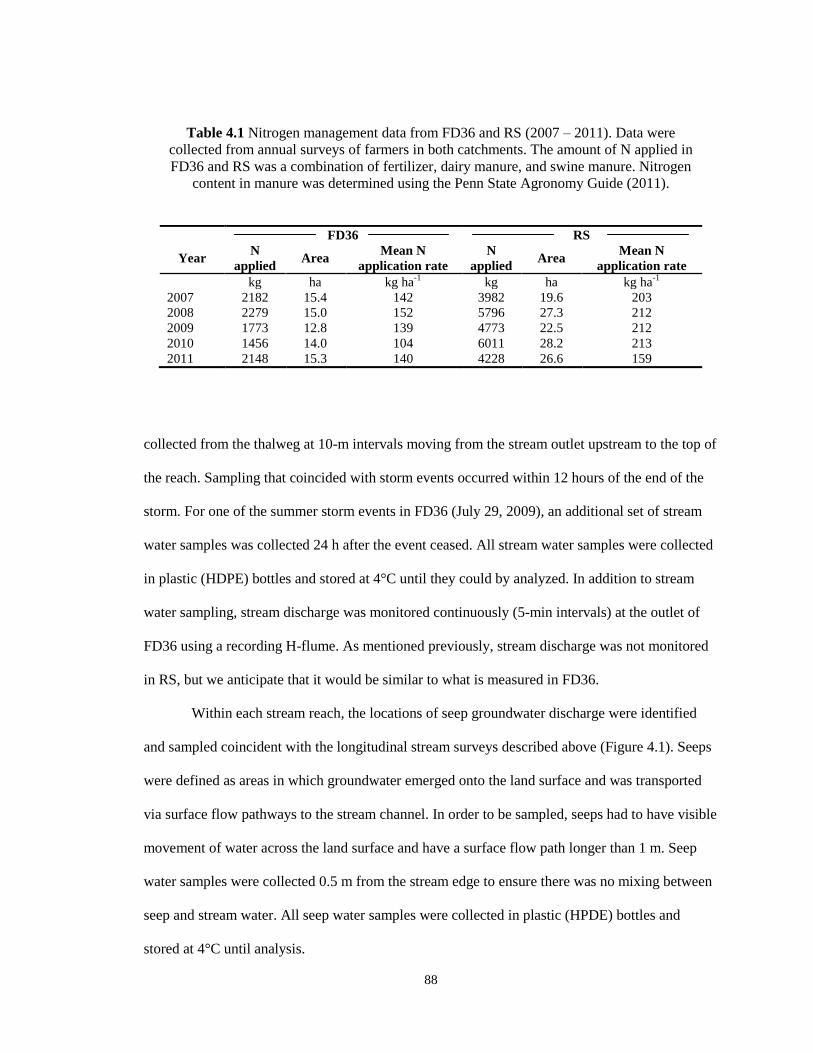
88
Table 4.1 Nitrogen management data from FD36 and RS (2007 – 2011). Data were
collected from annual surveys of farmers in both catchments. The amount of N applied in
FD36 and RS was a combination of fertilizer, dairy manure, and swine manure. Nitrogen
content in manure was determined using the Penn State Agronomy Guide (2011).
FD36 RS
Year N
applied Area
Mean N
application rate
N
applied Area
Mean N
application rate
kg ha kg ha-1
kg ha kg ha-1
2007 2182 15.4 142 3982 19.6 203
2008 2279 15.0 152 5796 27.3 212
2009 1773 12.8 139 4773 22.5 212
2010 1456 14.0 104 6011 28.2 213
2011 2148 15.3 140 4228 26.6 159
collected from the thalweg at 10-m intervals moving from the stream outlet upstream to the top of
the reach. Sampling that coincided with storm events occurred within 12 hours of the end of the
storm. For one of the summer storm events in FD36 (July 29, 2009), an additional set of stream
water samples was collected 24 h after the event ceased. All stream water samples were collected
in plastic (HDPE) bottles and stored at 4°C until they could by analyzed. In addition to stream
water sampling, stream discharge was monitored continuously (5-min intervals) at the outlet of
FD36 using a recording H-flume. As mentioned previously, stream discharge was not monitored
in RS, but we anticipate that it would be similar to what is measured in FD36.
Within each stream reach, the locations of seep groundwater discharge were identified
and sampled coincident with the longitudinal stream surveys described above (Figure 4.1). Seeps
were defined as areas in which groundwater emerged onto the land surface and was transported
via surface flow pathways to the stream channel. In order to be sampled, seeps had to have visible
movement of water across the land surface and have a surface flow path longer than 1 m. Seep
water samples were collected 0.5 m from the stream edge to ensure there was no mixing between
seep and stream water. All seep water samples were collected in plastic (HPDE) bottles and
stored at 4°C until analysis.
89
Water Quality Analysis
All water samples were analyzed for total N, NO3-N, ammonium-N (NH4-N), and
chloride (Cl-) concentrations. Concentrations of total N were determined for unfiltered samples
following alkaline persulfate digestion (Patton and Kryskalla, 2003). For dissolved constituents,
water samples were filtered (0.45 µm) and then analyzed with a Lachat QuikChem FIA+
autoanalyzer (QuikChem Methods FIA+ 8000 Series, Lachat Instruments, Loveland, CO) to
determine concentrations of NH4-N, NO3-N, and Cl-. Ammonium-N concentrations in both
stream and seep water on all sampling dates were low and often below the analytical detection
limit (0.1 mg L-1
); therefore, we chose not to report these values. Nitrate-N comprised 90% to
99% of total N on all sampling dates. Thus, the main focus of this paper is on NO3-N.
Statistics and Data Analysis
Seep contributions to streamflow were estimated based on stream Cl- concentrations.
Chloride was used because it is non-reactive and serves as an ideal conservative tracer of water
flow pathways (Davis et al., 2006). Seep contributions were calculated by Q = [(C2 - C1)/(S -
C1)]100, where Q is the contribution of a seep to streamflow (%), C1 is the stream Cl-
concentration at a location upstream of the seep, C2 is the stream Cl- concentration 10 m
downstream of C1, and S is the Cl- concentration of seep water entering between C1 and C2.
Contributions from individual seeps on each date were added together to estimate total seep
contributions for both catchments.
To determine the effects of seep inputs on NO3-N concentrations, changes in NO3-N
concentrations were evaluated over each 10-m segment within a given stream reach. Briefly, the
NO3-N concentration at the upstream location was subtracted from the NO3-N concentration
measured at the adjacent downstream location. Stream segments with seep inputs were classified
90
as ‘seep’ and all other segments as ‘non-seep’. Seasonal means were then determined for each
stream segment classification. Seasons were defined as spring (Mar. – May), summer (Jun. –
Aug.), fall (Sept. – Nov.), and winter (Dec. – Feb.). Using a one sample t-test, we compared the
mean seasonal change in stream water NO3-N concentration for seep and non-seep segments to
zero change in concentration. In addition, to determine the influence of seeps on spatial patterns
of stream water NO3-N, the least squares estimation method was performed to obtain a Pearson
correlation coefficient to measure the strength of the linear relationship between the number of
seeps discharging groundwater into the stream on each date and the semi-variogram range.
Analysis of variance (ANOVA) was used to assess differences in spatial patterns between
FD36 and RS, stream and seep water NO3-N concentrations within each catchment, and between
baseflow and stormflow. Pairwise comparisons were made using Tukey’s Studentized Range test
in order to separate means. All statistical analyses including ANOVA, semi-variogram
calculation, and model fitting were completed in R statistical package (R Foundation for
Statistical Computing, 2011). A probability level of 0.05 was used to evaluate statistical
significance in all analyses.
Semi-variogram Analysis
Semi-variogram analysis is a valuable tool for quantifying the longitudinal (or spatial)
variability of stream water chemistry (Dent and Grimm, 1999). As depicted in Figure 4.2, semi-
variograms show how differences between data points change with increasing distance between
them (referred to as the lag; h). When semi-variograms are plotted, semi-variance (γ) will not
increase with increasing lag distance if data are spatially independent (Figure 4.2; Random
model). If, however, data points closer together tend to be more similar than data points that are
farther apart, semi-variance will increase with separation distance and the data are considered
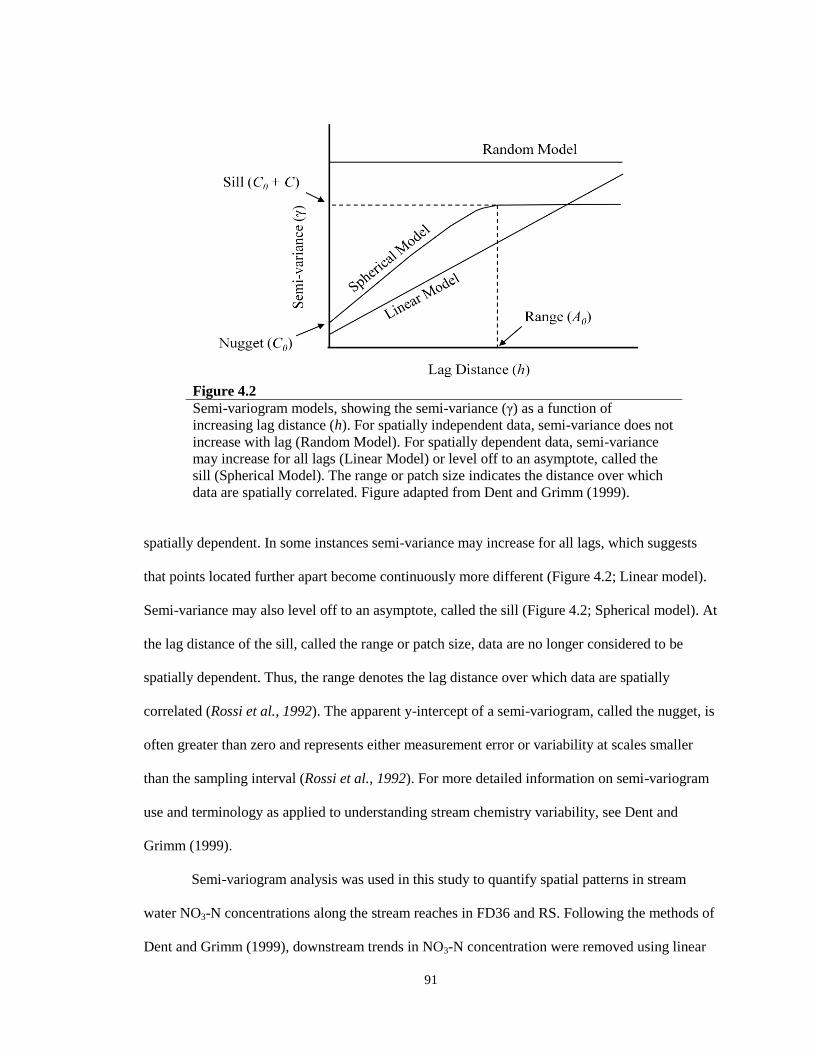
91
Figure 4.2
Semi-variogram models, showing the semi-variance (γ) as a function of
increasing lag distance (h). For spatially independent data, semi-variance does not
increase with lag (Random Model). For spatially dependent data, semi-variance
may increase for all lags (Linear Model) or level off to an asymptote, called the
sill (Spherical Model). The range or patch size indicates the distance over which
data are spatially correlated. Figure adapted from Dent and Grimm (1999).
spatially dependent. In some instances semi-variance may increase for all lags, which suggests
that points located further apart become continuously more different (Figure 4.2; Linear model).
Semi-variance may also level off to an asymptote, called the sill (Figure 4.2; Spherical model). At
the lag distance of the sill, called the range or patch size, data are no longer considered to be
spatially dependent. Thus, the range denotes the lag distance over which data are spatially
correlated (Rossi et al., 1992). The apparent y-intercept of a semi-variogram, called the nugget, is
often greater than zero and represents either measurement error or variability at scales smaller
than the sampling interval (Rossi et al., 1992). For more detailed information on semi-variogram
use and terminology as applied to understanding stream chemistry variability, see Dent and
Grimm (1999).
Semi-variogram analysis was used in this study to quantify spatial patterns in stream
water NO3-N concentrations along the stream reaches in FD36 and RS. Following the methods of
Dent and Grimm (1999), downstream trends in NO3-N concentration were removed using linear

92
regression and then the resultant regression residuals were used in the semi-variogram analysis. A
lag interval of 10 m, which corresponded to our sampling interval, was used and we extended our
analysis to a maximum lag of 200 m. The maximum lag was equivalent to 35% and 40% of the
study reach in FD36 and RS, respectively. We then applied the technique of Cressie (1985) to
determine the values of the sill, range, and nugget. Briefly, spherical models were fit to the semi-
variogram using weighted least-squares analysis. In the spherical model (see Figure 4.2 for
variable descriptions), if h < A0, then γ(h) = C0 + C[1.5(h/A0) – 0.5(h/A0)3], where h is the lag
interval, A0 is the range, γ(h) is the semi-variance at lag h, C0 is the nugget variance, and C is the
structural variance (variance attributed to autocorrelation). If h ≥ A0, then γ(h) = C0 + C.
Results
General Trends in Precipitation and Streamflow
Annual precipitation measured at the rain gauge in FD36 showed that rainfall amounts
were similar in 2009 and 2010, but substantially greater in 2011. In 2009 and 2010, rainfall
amounts were 887 and 914 mm, respectively, which was slightly less than the long-term mean
rainfall of 1,080 mm in FD36 (Buda et al., 2011). The amount of rainfall nearly doubled in 2011,
as 1,811 mm of rain was recorded. The large increase in rainfall in 2011 was caused by two large
storm systems (remnants of Hurricane Irene [Aug. 27] and Tropical Storm Lee [Sept. 8]) that
resulted in 645 mm of rain.
Stream discharge at the outlet of FD36 averaged 7.2 x 10⁻³
m3 s
-1 from April 2009
through January 2012 (Figure 4.3). Flow ranged from dry (i.e., no flow) to 0.4955 m3 s
-1, with the
lowest flow occurring in September 2010 and the highest flow occurring September 2011. On
dates of stream surveys, stream discharge averaged 5.8 x 10⁻³
and 3.78 x 10⁻²
m3 s
-1 for baseflow
and stormflow, respectively (Figure 4.3). Stream discharge during stormflow sampling ranged

93
from 5.0 x 10⁻³
to 0.1240 m3 s
-1, whereas, stream discharge was relatively consistent during
baseflow sampling (Figure 4.3).
Stream Water NO3-N Concentration and Spatial Variability
Baseflow
Stream water NO3-N concentrations over the study period were significantly less in FD36
compared to RS (p < 0.001). Nitrate-N concentrations in FD36 ranged from 1.6 to 6.1 mg L-1
,
whereas in RS, NO3-N concentrations ranged from 10.8 to 14.7 mg L-1
(Table 4.2). Nitrate-N
concentrations were also significantly different among seasons in FD36 (p = 0.005), but not in RS
(Figure 4.4a). In FD36, mean stream water NO3-N concentrations were lower during the summer
(1.5 mg L-1
) compared to the spring and fall (3.8 and 3.1 mg L-1
, respectively), and winter (5.8 mg
L-1
). In both FD36 and RS, there was a strong linear relationship between NO3-N concentration
Time
Figure 4.3
Daily average stream discharge at the outlet of FD36 from April 2009 through January 2012.
Stream discharge was measured with a recording H-flume at 5-min intervals and averaged daily.
0
0.04
0.08
0.12
0.16
3/8/2009 9/24/2009 4/12/2010 10/29/2010 5/17/2011 12/3/2011
0.49 0.21 Baseflow sample
Stormflow sample
Apr Jul Oct Jan Apr Jul Oct Jan Apr Jul Oct Jan
Str
eam
dis
ch
arg
e (m
3 s
-1)

94
Table 4.2 Nitrate-N concentrations, downstream trends, and indices of spatial variability for stream water in FD36 and RS (April 2009
to January 2012). Highlighted rows indicate sampling dates that coincided with storm events.
FD36 RS
Conc. and
downstream trends Spherical model parameters
Conc. and
downstream trends Spherical model parameters
Date NO3-N R2†
Nugget‡ Sill
§ Range
∞ R
2* NO3-N R
2† Nugget
‡ Sill
§ Range
∞ R
2*
mg L-1
C0 C0 + C1 m mg L-1
C0 C0 + C1 m
2009
Apr. 29 2.0 0.52 0.006 0.044 50 0.56 12.0 0.59 0.670 5.87 155 0.99
May 15 2.8 0.51 0.013 0.099 120 0.90 11.6 0.67 0.279 3.55 150 0.99
Jul. 22 1.6 0.85 0.032 0.175 71 0.88 13.8 0.64 0.886 7.44 159 0.99
Jul. 29 0.6 0.57 0.002 0.015 107 0.94 n/a n/a n/a n/a n/a n/a
Jul. 30 1.9 0.49 - - - 0.91 14.3 0.58 - - - 0.95
Oct. 9 1.7 0.84 0.014 0.121 96 0.88 13.4 0.67 0.851 5.60 135 0.97
Nov. 12 3.3 0.51 0.015 0.127 104 0.91 12.9 0.54 4.160 11.36 88 0.82
2010
Jan. 29 5.3 0.87 0.004 0.016 57 0.60 14.7 0.63 0.140 4.41 144 0.98
Mar. 8 5.3 0.85 0.018 0.073 45 0.85 n/a n/a n/a n/a n/a n/a
Mar. 9 4.3 0.76 0.011 0.083 84 0.91 11.2 0.64 0.003 0.97 181 0.98
Mar.15 4.9 0.66 0.006 0.035 60 0.81 13.3 0.78 0.124 3.45 193 0.99
Apr. 22 3.1 0.27 0.005 0.016 89 0.84 13.2 0.56 0.133 6.00 155 0.99
Jul. 14 1.1 0.85 0.023 0.167 151 0.97 10.8 0.49 0.010 6.53 196 0.99
Oct. 4 4.3 0.62 0.022 0.205 134 0.98 14.7 0.66 0.680 6.01 156 0.99
Dec. 13 6.1 0.16 0.012 0.052 68 0.90 13.8 0.65 0.074 2.44 131 0.97
2011
Mar. 1 4.1 0.53 0.005 0.040 56 0.69 13.1 0.56 0.486 4.31 110 0.87
Mar. 11 5.1 0.48 0.006 0.033 86 0.80 13.2 0.74 0.247 1.90 158 0.98
May 5 3.8 0.42 0.001 0.021 49 0.83 12.3 0.68 0.195 4.23 181 0.98
Jul. 6 1.7 0.56 0.038 0.080 132 0.94 13.7 0.57 0.649 5.89 181 0.99
Aug. 30 4.8 0.52 0.034 0.379 168 0.98 15.9 0.63 0.321 5.94 150 0.99
2012
Jan. 5 5.9 0.10 0.002 0.011 50 0.55 11.2 0.48 0.353 3.05 173 0.99 † Linear relationship between NO3-N and downstream distance.
§ Maximum semi-variance (i.e., where semi-variance levels off).
‡ Measurement error or variability at scales < 10 m.
∞ Distance over which NO3-N concentration is spatially dependent.
* Linear relationship between semi-variance and spherical model.
94
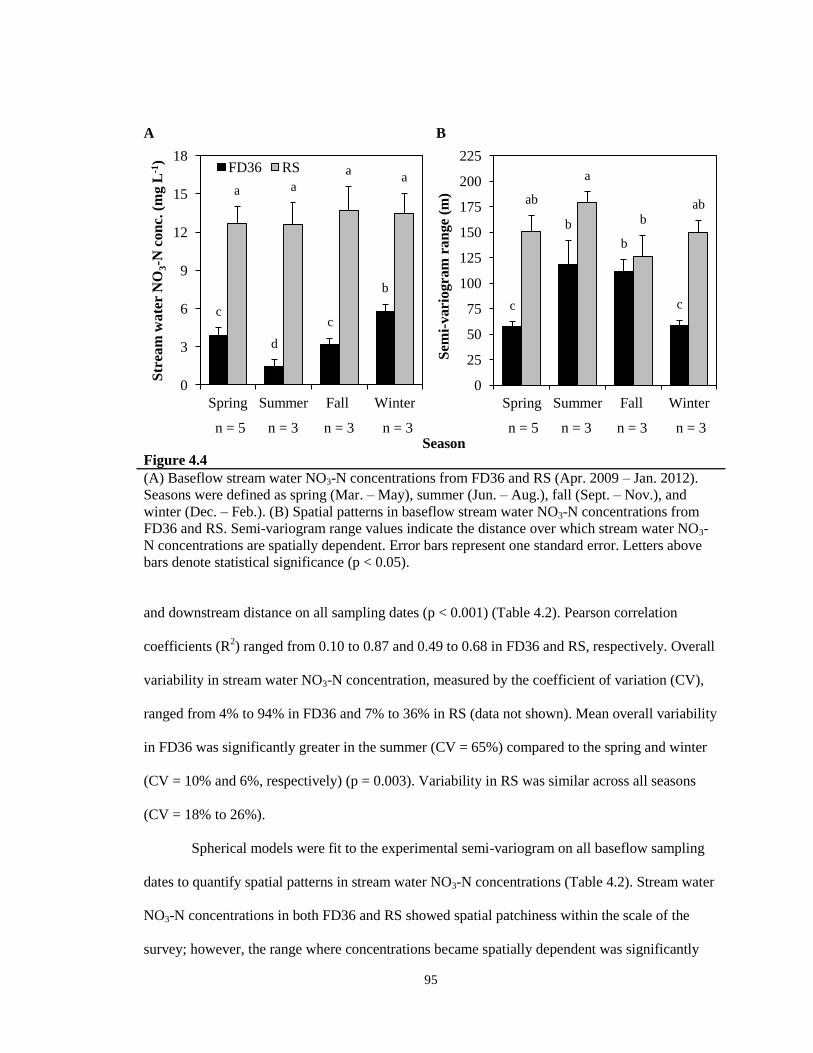
95
A B
Season
Figure 4.4
(A) Baseflow stream water NO3-N concentrations from FD36 and RS (Apr. 2009 – Jan. 2012).
Seasons were defined as spring (Mar. – May), summer (Jun. – Aug.), fall (Sept. – Nov.), and
winter (Dec. – Feb.). (B) Spatial patterns in baseflow stream water NO3-N concentrations from
FD36 and RS. Semi-variogram range values indicate the distance over which stream water NO3-
N concentrations are spatially dependent. Error bars represent one standard error. Letters above
bars denote statistical significance (p < 0.05).
and downstream distance on all sampling dates (p < 0.001) (Table 4.2). Pearson correlation
coefficients (R2) ranged from 0.10 to 0.87 and 0.49 to 0.68 in FD36 and RS, respectively. Overall
variability in stream water NO3-N concentration, measured by the coefficient of variation (CV),
ranged from 4% to 94% in FD36 and 7% to 36% in RS (data not shown). Mean overall variability
in FD36 was significantly greater in the summer (CV = 65%) compared to the spring and winter
(CV = 10% and 6%, respectively) (p = 0.003). Variability in RS was similar across all seasons
(CV = 18% to 26%).
Spherical models were fit to the experimental semi-variogram on all baseflow sampling
dates to quantify spatial patterns in stream water NO3-N concentrations (Table 4.2). Stream water
NO3-N concentrations in both FD36 and RS showed spatial patchiness within the scale of the
survey; however, the range where concentrations became spatially dependent was significantly
0
3
6
9
12
15
18
Spring Summer Fall Winter
FD36 RS S
trea
m w
ate
r N
O3-N
co
nc.
(m
g L
-1)
a a
a a
b
c c
d
0
25
50
75
100
125
150
175
200
225
Spring Summer Fall Winter
ab ab
a
b b
b
c c
Sem
i-v
ari
ogra
m r
an
ge
(m)
n = 5
n = 3
n = 3
n = 3
n = 5
n = 3
n = 3
n = 3
96
less in FD36 compared to RS (p < 0.001). Mean patch sizes in NO3-N concentration of 82 and
151 m were observed for FD36 and RS, respectively. Over the study period, patch sizes in FD36
varied between 45 and 151 m, while patch sizes in RS were between 88 and 196 m (Table 4.2).
Spatial patterns of stream water NO3-N concentrations varied in both catchments with season (p =
0.027) (Figure 4.4b). In FD36, patch sizes of NO3-N concentrations were significantly larger
during the summer and fall (118 and 111 m, respectively) compared to spring and winter (57 and
58 m, respectively). Patch sizes of NO3-N concentrations in RS were significantly larger in the
summer (179 m) compared to the fall (126 m). Semi-variogram nugget values were relatively low
compared to the sill on all baseflow sampling dates, which resulted in high structural variance
(i.e., variance attributed to autocorrelation) (data not shown). Values for structural variance were
between 0.52 and 0.99 for both catchments and averaged 0.85. This suggests that only 15% of the
observed variability in stream water NO3-N concentration was either due to measurement error or
variability at lag distances less than 10 m.
Stormflow
Storm events did not significantly impact mean stream water NO3-N concentration in
either FD36 or RS (Table 4.2). Compared to baseflow NO3-N concentrations before the storm
event, NO3-N concentrations following storm events were slightly lower on average (FD36, 3.3
vs. 3.2 mg L-1
; RS, 13.4 vs. 12.6 mg L-1
). There was also a strong linear relationship between
NO3-N concentration and downstream distance on all storm sampling dates in both FD36 and RS
(p < 0.001). Overall variability of stream water NO3-N concentrations tended to decrease during
storm events compared to baseflow (data not shown). Storm events occurring in the summer
decreased overall variability more than storm events in the spring. For example, in FD36, the CV
changed by less than 1% following spring storm events compared to summer events in which the

97
Figure 4.5
Stream water NO3-N concentration (left column) and semi-variograms (right column) from FD36
before (July 22), immediately following (July 29), and 24 h after (July 30) a storm event (2.9 cm).
Spherical models were fit to the July 22 and 29 semi-variograms. A linear model was used to
describe the July 30 semi-variogram. Semi-variance was standardized by dividing through by its
maximum value on each date. Indices of spatial variability are given in Table 4.2.
0
2
4
6
0 10 20 30 40 50 60
July 22, 2009
0.0
0.4
0.8
1.2
0 55 110 165 220
0
2
4
6
0 10 20 30 40 50 60
July 29, 2009
Str
eam
wate
r N
O3-N
con
c. (
mgL
-1)
0.0
0.4
0.8
1.2
0 55 110 165 220
Sem
i-vari
an
ce (γ)
0
2
4
6
0 10 20 30 40 50 60
July 30, 2009
Distance from stream outlet (101 m)
0.0
0.4
0.8
1.2
0 55 110 165 220
Lag Distance (m)

98
CV decreased by more than 30%. Figure 4.5 shows how stream water NO3-N concentration and
spatial patterns changed from baseflow, to immediately following a summer storm, to 24 h after
the storm in FD36.
Spherical models were fit to storm event semi-variograms on all dates in both FD36 and
RS except for July 30, 2009, which resembled a linear model (Figure 4.2). The range where
stream water NO3-N concentration became spatially dependent was generally greater following a
storm event compared to baseflow conditions prior to the storm (Table 4.2). In FD36, the mean
patch size of stream water NO3-N concentration increased from 71 m at baseflow to 111 m
immediately following the storm event, while an increase from baseflow to stormflow of 151 to
157 m was observed in RS. This indicated that stream water NO3-N concentrations became less
spatially variable following a storm event. However, one day following a summer storm event
(July 2009), NO3-N concentrations in FD36 became continuously more different along the reach
(Figure 4.5), suggesting that concentrations were highly variable compared to baseflow and
immediately following the storm event.
Seep NO3-N Concentration Variability
The number of groundwater-fed seeps identified and sampled in FD36 and RS ranged
from 2 and 13 seeps on all sampling dates (Table 4.3). The mean number of seeps sampled on
each date was significantly greater in FD36 compared to RS (p < 0.001). On each sampling date,
8.7 seeps were sampled in FD36 on average, whereas a mean of 5.0 seeps were sampled in RS
(Table 4.3). Conversely, seep water NO3-N concentrations in FD36 were significantly less than
NO3-N concentrations measured in RS (p < 0.001). Mean seep water NO3-N concentrations of 4.7
and 13.4 mg L-1
were observed in FD36 and RS, respectively (Table 4.3). Seep water NO3-N
concentrations were also significantly different among seasons in FD36 (p = 0.03), but not in RS
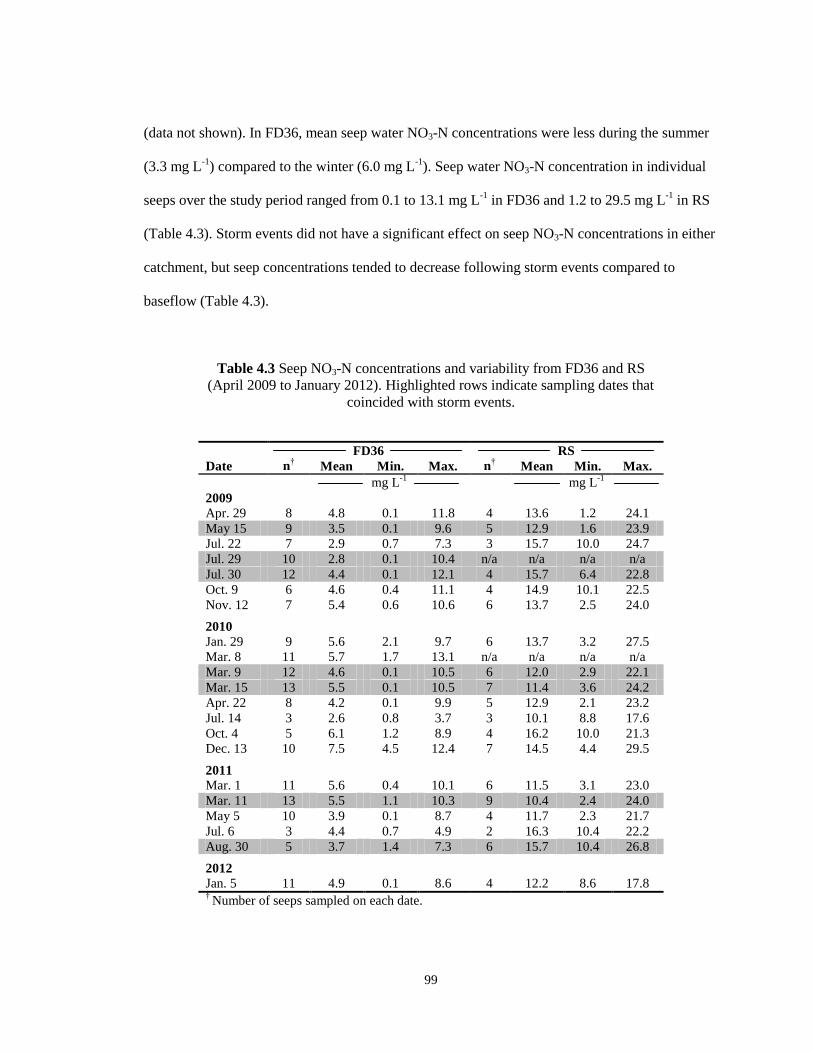
99
(data not shown). In FD36, mean seep water NO3-N concentrations were less during the summer
(3.3 mg L-1
) compared to the winter (6.0 mg L-1
). Seep water NO3-N concentration in individual
seeps over the study period ranged from 0.1 to 13.1 mg L-1
in FD36 and 1.2 to 29.5 mg L-1
in RS
(Table 4.3). Storm events did not have a significant effect on seep NO3-N concentrations in either
catchment, but seep concentrations tended to decrease following storm events compared to
baseflow (Table 4.3).
Table 4.3 Seep NO3-N concentrations and variability from FD36 and RS
(April 2009 to January 2012). Highlighted rows indicate sampling dates that
coincided with storm events.
FD36 RS
Date n† Mean Min. Max. n
† Mean Min. Max.
mg L-1
mg L-1
2009
Apr. 29 8 4.8 0.1 11.8 4 13.6 1.2 24.1
May 15 9 3.5 0.1 9.6 5 12.9 1.6 23.9
Jul. 22 7 2.9 0.7 7.3 3 15.7 10.0 24.7
Jul. 29 10 2.8 0.1 10.4 n/a n/a n/a n/a
Jul. 30 12 4.4 0.1 12.1 4 15.7 6.4 22.8
Oct. 9 6 4.6 0.4 11.1 4 14.9 10.1 22.5
Nov. 12 7 5.4 0.6 10.6 6 13.7 2.5 24.0
2010
Jan. 29 9 5.6 2.1 9.7 6 13.7 3.2 27.5
Mar. 8 11 5.7 1.7 13.1 n/a n/a n/a n/a
Mar. 9 12 4.6 0.1 10.5 6 12.0 2.9 22.1
Mar. 15 13 5.5 0.1 10.5 7 11.4 3.6 24.2
Apr. 22 8 4.2 0.1 9.9 5 12.9 2.1 23.2
Jul. 14 3 2.6 0.8 3.7 3 10.1 8.8 17.6
Oct. 4 5 6.1 1.2 8.9 4 16.2 10.0 21.3
Dec. 13 10 7.5 4.5 12.4 7 14.5 4.4 29.5
2011
Mar. 1 11 5.6 0.4 10.1 6 11.5 3.1 23.0
Mar. 11 13 5.5 1.1 10.3 9 10.4 2.4 24.0
May 5 10 3.9 0.1 8.7 4 11.7 2.3 21.7
Jul. 6 3 4.4 0.7 4.9 2 16.3 10.4 22.2
Aug. 30 5 3.7 1.4 7.3 6 15.7 10.4 26.8
2012
Jan. 5 11 4.9 0.1 8.6 4 12.2 8.6 17.8 † Number of seeps sampled on each date.

100
The Influence of Seeps on Stream Water NO3-N Concentrations and Variability
Estimated seep contributions to streamflow based on stream and seep Cl- concentrations
were between 41% and 136% on all sampling dates (Table 4.4). Seep contributions greater than
100% of streamflow were possible, as losing conditions were often observed during dry periods
along the stream in FD36. Over the entire study period, seeps contributed an estimated 69% and
63% to streamflow in FD36 and RS, respectively. Seep contributions to streamflow were
Table 4.4 Estimated seep contributions to streamflow in FD36 and
RS (April 2009 to January 2012). Estimations are based on stream
and seep water chloride concentrations. Highlighted rows indicate
sampling dates that coincided with storm events.
FD36 RS
Date
Estimated seep contributions
to streamflow
%
2009
Apr. 29 63 56
May 15 44 52
Jul. 22 136 91
Jul. 29 75 n/a
Jul. 30 80 63
Oct. 9 109 76
Nov. 12 84 68
2010
Jan. 29 62 67
Mar. 8 49 n/a
Mar. 9 43 58
Mar. 15 41 61
Apr. 22 58 69
Jul. 14 83 62
Oct. 4 72 58
Dec. 13 71 49
2011
Mar. 1 46 51
Mar. 11 41 47
May 5 80 68
Jul. 6 95 71
Aug. 30 76 76
2012
Jan. 5 58 63

101
significantly greater during baseflow compared to stormflow in FD36 (p = 0.04), but not in RS
(Table 4.4). On average, seeps comprised 76% and 54% of stream discharge during baseflow and
stormflow, respectively. Seeps in FD36 also comprised a larger portion of stream baseflow during
the summer (105%) compared to the spring and winter (61% and 63%, respectively) (p = 0.04).
Mean seep contributions in RS were consistent across seasons and averaged 59% to 75%.
Downstream changes in NO3-N concentrations for stream segments (10 m) with and
without seeps (i.e., non-seep) are shown in Figure 4.6. In both FD36 and RS, seeps resulted in an
increase in stream water NO3-N concentrations. During baseflow, mean increases of 0.24 and
0.26 mg L-1
NO3-N were observed for stream segments with seeps in FD36 and RS, respectively.
Mean increases in NO3-N concentration as a result of seep inputs were significant across all
seasons in FD36, but only during the spring and summer in RS (Figure 4.6). In FD36, increases in
stream water NO3-N concentrations due to seep inputs were greater during the summer and fall
(0.74 and 0.37 mg L-1
, respectively) compared to the spring and winter (0.11 and 0.13 mg L-1
,
respectively). The influence of seeps on changes in stream water NO3-N concentrations was also
significant during stormflow in both FD36 and RS (Figure 4.6). Seeps increased stream water
NO3-N concentrations by 0.15 and 0.19 mg L-1
in FD36 and RS, respectively. In contrast to
stream segments with seeps, non-seep stream segments had a mean downstream decrease in NO3-
N concentrations during baseflow in both FD36 and RS, and during stormflow in RS (Figure 4.6).
Mean decreases in NO3-N concentrations for non-seep stream segments were not significantly
different from zero change in concentration and averaged 0.01 and 0.03 mg L-1
in FD36 and RS,
respectively. One non-seep stream segment in RS, however, consistently resulted in large
increases in stream water NO3-N concentration of up to 6.0 mg L-1
(data not shown). Since there
were no visible additions of water at this location, it was assumed that groundwater high in NO3-
N concentration was discharging directly into the stream channel.

102
Figure 4.6
Changes in stream water NO3-N concentration in FD36 and RS. Seasons were
defined as spring (Mar.-May), summer (Jun.-Aug.), fall (Sept.-Nov.), and winter
(Dec.-Feb.). Seasonal data only includes baseflow sampling. Changes were
calculated over a 550 and 490 m stream reach in FD36 and RS, respectively, at 10
m intervals. Stream segments with seep inputs were classified as ‘seep’ and all
other stream segments as ‘non-seep’. Error bars represent one standard deviation.
Asterisks indicate that the change was significantly different from zero (p < 0.05).
-0.3
-0.1
0.1
0.3
0.5
0.7
0.9
1.1
1.3
Spring Summer Fall Winter Baseflow Stormflow
Seep
Non-seep
*
*
* *
*
*
-0.3
-0.1
0.1
0.3
0.5
0.7
0.9
1.1
1.3
Spring Summer Fall Winter Baseflow Stormflow
Seep
Non-Seep
* * * *
FD36
Mea
n c
han
ge
in s
trea
m w
ate
r N
O3 c
on
cen
tra
tio
n (
mg
L-1
)
RS
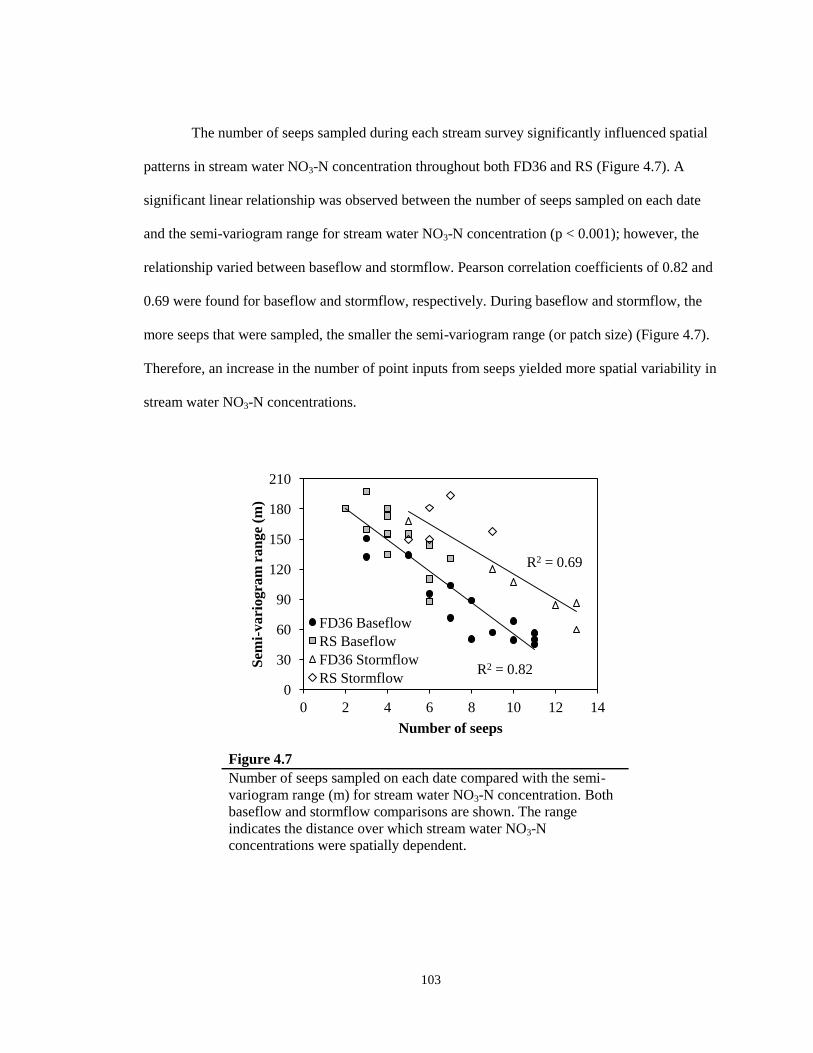
103
The number of seeps sampled during each stream survey significantly influenced spatial
patterns in stream water NO3-N concentration throughout both FD36 and RS (Figure 4.7). A
significant linear relationship was observed between the number of seeps sampled on each date
and the semi-variogram range for stream water NO3-N concentration (p < 0.001); however, the
relationship varied between baseflow and stormflow. Pearson correlation coefficients of 0.82 and
0.69 were found for baseflow and stormflow, respectively. During baseflow and stormflow, the
more seeps that were sampled, the smaller the semi-variogram range (or patch size) (Figure 4.7).
Therefore, an increase in the number of point inputs from seeps yielded more spatial variability in
stream water NO3-N concentrations.
Figure 4.7
Number of seeps sampled on each date compared with the semi-
variogram range (m) for stream water NO3-N concentration. Both
baseflow and stormflow comparisons are shown. The range
indicates the distance over which stream water NO3-N
concentrations were spatially dependent.
0
30
60
90
120
150
180
210
0 2 4 6 8 10 12 14
Sem
i-vari
ogra
m r
an
ge
(m)
Number of seeps
FD36 Baseflow
RS Baseflow
FD36 Stormflow
RS Stormflow R2 = 0.82
R2 = 0.69

104
Discussion
Variability of NO3-N in Stream and Seep Waters
Results from longitudinal monitoring of stream reaches in FD36 and RS suggest that
NO3-N additions primarily occurred where seep discharge entered the stream. Seeps essentially
function as a drainage outlet for larger areas of the catchment (although the extent of this area is
difficult to determine); therefore, they have the potential to deliver large volumes of agriculturally
influenced groundwater to the stream (Angier and McCarty, 2008). In FD36 and RS, stream
segments with seeps comprised between 5% and 16% of the total stream length, but we estimated
that seeps were supplying between 41% and 136% of streamflow. Since NO3-N concentrations
measured in seep discharge were greater than stream water NO3-N concentrations, the addition of
seep discharge to the stream resulted in significant increases in stream water NO3-N
concentrations downstream of the seep input. Stream segments that were not receiving seep
inputs exhibited small decreases in NO3-N concentration indicating that in-stream uptake and/or
denitrification were likely occurring along the stream channel (Peterson et al., 2001; Alexander et
al., 2007). The influence of in-stream NO3-N removal mechanisms, however, was minimal
compared to seep NO3-N inputs as stream water NO3-N concentrations increased downstream
during all stream surveys.
Nitrate-N concentrations varied substantially among individual seeps in FD36 and RS.
On a single sampling date (April 29, 2009), seeps had an absolute range in NO3-N concentration
of 11.7 and 22.9 mg L-1
in FD36 and RS, respectively. Variations in seep water chemistry have
also been documented in a forested catchment in Pennsylvania (O’Driscoll and DeWalle, 2010)
and in the Catskill Mountains of New York (Burns et al., 1998). Seep water NO3-N
concentrations in these forested catchments, however, had a much smaller absolute range (< 2 mg
L-1
) of concentration compared to FD36 and RS. Variability in seep water NO3-N concentrations

105
has been attributed to differences in physical, chemical, and biological processes occurring in the
upslope contributing area (e.g., Cirmo and McDonnell, 1997). In addition to differences in
biogeochemical processes among the areas draining to seeps, N application rates and land use in
agricultural catchments often vary at the field-scale. Nitrogen application rates in areas draining
to seeps are likely related to seep NO3-N concentrations, but there is little research on this
potential link. We hypothesize that in agricultural catchments differences in N management
determine seep NO3-N concentration, whereas in forested catchments, differences in
biogeochemical processes likely play a larger role in seep NO3-N concentration.
Once groundwater is discharged from a seep, flow paths and residence times within the
seep can also affect the chemistry of seep water entering the stream (Hill, 1996). A tracer study in
New Zealand pasture demonstrated that approximately 24% of NO3-N could be removed along a
seep surface flow path (Rutherford and Nguyen, 2004). Groundwater and NO3-N transported in
these flow paths, however, are more likely to bypass the mitigating features of the riparian zone
(Warwick and Hill, 1988; Angier et al., 2002, 2005). In contrast, NO3-N concentrations in
shallow groundwater have been reported to decrease by 90% to 95% due to high denitrification
rates in saturated riparian zone soils (Peterjohn and Correll, 1984; Lowrance, 1992). Since both
surface and subsurface flow paths occur along the length of a seep, it is possible that a single seep
could function as both a conduit and barrier for NO3-N fluxes. In FD36, seep NO3-N
concentrations were greater during the winter and spring compared to the summer. During the
winter and spring, higher seep discharge could lead to more of the downseep flow being
transported along rapid surface flow paths as opposed to slower, subsurface paths. This would
decrease the potential for NO3-N removal and result in higher concentrations delivered to the
stream (Gold et al., 2001). Alternatively, during the summer, lower seep discharge and longer
residence times could promote NO3-N removal.
106
Effects of Seeps on Stream Water NO3-N Variability
Differences in the number of seeps and their NO3-N concentrations among sampling
dates resulted in spatial patterns of stream water NO3-N concentrations that reflected the
variability of seep inputs. Semi-variogram analysis showed that stream water NO3-N
concentrations in FD36 and RS were not only spatially dependent at small scales (i.e., semi-
variance increased with increasing lag distance), but also patchy within the scale of the survey.
Given the unidirectional flow of stream water, it is not surprising that NO3-N concentrations at
nearby locations were more similar than locations separated by longer distances. We found mean
patch sizes of stream water NO3-N concentration were 82 and 151 m in FD36 and RS,
respectively, which suggests that NO3-N in FD36 was more spatially variable than RS. This
coincided with FD36 having more seeps (8.7), on average, compared to RS (5.0). In addition, the
greater the number of seeps in both catchments on a single sampling date, the greater the spatial
variability of stream water NO3-N concentrations (i.e., decreased patch size). This suggests that in
FD36 and RS, spatial patterns of stream water NO3-N concentrations were tightly coupled with
variable inputs of NO3-N from seeps.
Stream water NO3-N concentrations in FD36 and RS exhibited a substantial amount of
longitudinal variation over the study period. For example, the annual variation in NO3-N
concentrations at the outlet of FD36 determined by weekly sampling (Zhu et al., 2011) was 2 to 3
times less than the variation we observed over the 550 m stream reach during the summer (annual
[2009] CV = 32% for 50 samples; CV on July 22, 2009 and July 6, 2011 = 61% and 94%,
respectively, for 55 samples). Few studies, however, have quantitatively assessed spatial patterns
in stream water NO3-N concentrations. Dent and Grimm (1999) found that patch sizes of stream
water NO3-N concentrations were approximately 400 m in length, but their study was conducted
on a much larger desert stream in Arizona. Although the size of the stream was much larger in the
107
study by Dent and Grimm (1999), the controls on spatial patterns of stream water NO3-N
concentrations were similar to the finding from FD36 and RS reported herein. Dent and Grimm
(2001) found that localized groundwater upwelling zones within the stream had a strong influence
on spatial patterns of NO3-N, which is similar to the effects of point inputs from seepage zones.
Research on spatial patterns of nutrients in soils can also provide a useful comparison to
the observations obtained from stream water sampling in FD36 and RS. For example, research
has shown that most nutrients in forest soils are spatially dependent from 2 to 5 m (Palmer, 1990;
Lechowicz and Bell, 1991), whereas in agricultural soils, nutrients are found to be spatially
dependent over distances of up to 100 m (Robertson et al., 1997). The high spatial variability of
nutrient concentrations found within terrestrial soils is likely not reflected in seep discharge as
areas draining to seeps tend to integrate the effects of different land uses, flow paths, and
biogeochemical processes. Stream water NO3-N concentration observed in FD36 and RS would
therefore be expected to be less variable than soil NO3-N concentrations within each catchment.
In addition, downstream transport of NO3-N may lengthen the distance over which concentrations
are spatially dependent compared to soils by carrying products away from where they are formed
or enter the stream (Wagener et al., 1998).
Influence of Storm Events on In-stream NO3-N Variability
Nitrate-N concentrations in stream water became less spatially variable immediately
following storm events compared to baseflow in FD36 and RS. Although the number of flowing
seeps increased following storm events, patch sizes also increased following storm events. The
diminished influence of seeps on spatial patterns in stream water NO3-N concentrations
immediately following storm events compared to baseflow coincided with reduced seep
contributions to streamflow and decreased changes to stream water NO3-N concentrations where

108
seep water entered the stream. During storm events, rain falling directly into the stream channel
and surface runoff from the landscape increased stream discharge and most likely diluted stream
water NO3-N concentrations (Pionke et al., 1988). Increased stream discharge also resulted in
more turbulent streamflow and greater mixing of the stream water, which would have
homogenized NO3-N concentrations throughout the reach. Similar findings to FD36 and RS have
been reported in both aquatic and terrestrial environments. For example, flooding of a desert
stream decreased NO3-N concentration variability (Dent and Grimm, 1999). In addition, the
distance over which soil nutrient concentrations are spatially dependent is typically greater for
cultivated (i.e., well mixed) agricultural fields compared to undisturbed fields (Robertson et al.,
1993).
The increased patch sizes of stream NO3-N concentrations that were observed
immediately following a small summer storm event in FD36 (July 29, 2009; Figure 4.5),
however, were reversed one day following the event as stream water NO3-N concentrations
became continuously more different along the entire reach (July 30, 2009; Figure 4.5). As
streamflow cycled from rainfall-diluted and surface runoff dominated flow to subsurface
discharge dominated flow (Pionke et al., 1988), the influence of seeps on spatial patterns of
stream water NO3-N concentration likely reached its maximum. During this time period, the
number of seeps discharging groundwater was at its greatest and stream discharge was decreasing
back to baseflow. It is also likely that stream water NO3-N concentrations would become less
variable and patch sizes would return to baseflow values as time passed after the storm and seep
discharge declined.

109
Conclusions
The results of this study showed that seeps in FD36 and RS contributed large volumes of
agriculturally-influenced groundwater to the stream. While the magnitude of seep water NO3-N
concentrations varied between catchments and among individual seeps due to differences in
hydrologic and biogeochemical processes and variable N inputs across the landscape, seep
discharge generally resulted in increased in stream water NO3-N concentrations. We found that
stream water NO3-N concentrations, on average, increased by 0.25 mg L-1
over a 10 m distance
when seeps were present compared to a decrease of 0.02 mg L-1
when seeps were not present. The
influence of seeps on stream NO3-N concentrations was further reflected in longitudinal patterns
of stream water NO3-N. We found that as the number of seeps increased, the amount of
longitudinal variability (i.e. patchiness) in stream water NO3-N concentration increased. The
influence of seeps on stream water NO3-N concentrations and variability decreased immediately
following a storm event compared to baseflow. This was likely due to increased stream discharge
and rainfall directly into the stream channel, which decreased the relative contributions of seep
water to stream flow and homogenized NO3-N concentrations over the entire reach. As stream
discharge drained back to baseflow, however, the influence of seeps on stream water quality
likely reached a maximum, as the number of seeps discharging groundwater into the stream was
at its peak. In FD36 and RS, seeps are a significant source of NO3-N to the stream and play a
substantial role in determining N fluxes from these catchments during both baseflow and
stormflow conditions.
References
Alexander, R.B., E.W. Boyer, R.A. Smith, G.E. Schwarz, and R.B. Moore. 2007. The role of
headwater streams in downstream water quality. J. Am.Water Resour. As. 43:41-59.

110
Angier, J.T., and G.W. McCarty. 2008. Variations in baseflow nitrate flux in a first order stream
and riparian zone. J. Am. Water Resour. Assoc. 44:367-380.
Angier, J.T., G.W. McCarty, and K.L. Prestegaard. 2005. Hydrology of a first-order riparian zone
and stream, mid-Atlantic coastal plain, Maryland. J. Hydrol. 309:149-166.
Angier, J.T., G.W. McCarty, C.P. Rice, and K. Bialek. 2002. Influence of a riparian wetland on
nitrate and herbicides exported from a field applied with agrochemicals. Journal of
Agriculture and Food Chemistry. 50:4424-4429.
Boyer, C., A.R. Roy, and J.L. Best. 2006. Dynamics of a river channel confluence with
discordant beds: flow turbulence bed load sediment transport and bed morphology. J.
Geophys. Res. – Earth Surface 111: DOI: 10.102912005/2005JF000458.
Bryant, R.B., T.L. Veith, G.W. Feyereisen, A.R. Buda, C.D. Church, G.J. Folmar, J.P. Schmidt,
C.J. Dell, and P.J.A. Kleinman. 2011. U.S. Department of Agriculture Agricultural
Research Service Mahantango creek watershed, Pennsylvania, United States:
phsiography and history. Water Resour. Res. 47: DOI: 10.1029/2010WR010056.
Buda, A.R., T.L. Veith, G.J. Folmar, G.W. Feyereisen, R.B. Bryant, C.D. Church, J.P. Schmidt,
C.J. Dell, and P.J.A. Kleinman. 2011. U.S. Department of Agriculture Agricultural
Research Service Manhantango creek watershed, Pennsylvania, United States: long-term
precipitation database. Water Resour. Res. 47: DOI: 10.1029/2010WR010058.
Burns, D.A., P.S. Murdoch, G.B. Lawrence, and R.L. Michel. 1998. Effects of groundwater
springs on NO3- concentration during summer in Catskill Mountain streams. Water
Resour. Res. 34:1987-1996.
Carpenter, S.R., N.F. Caraco, D.L. Correll, R.W. Howarth, A.N. Sharpley, and V.H. Smith. 1998.
Nonpoint pollution of surface waters with phosphorus and nitrogen. Ecol. Appl. 8: 559-
568.
Cirmo, C.P., and J.J. McDonnell. 1997. Linking hydrologic and biogeochemical controls of
nitrogen transport in near-stream zones of temperate-forested catchments: a review. J.
Hydrol. 1999:88-120.
Cooper, S.D., L. Barmuta, O. Sarnelle, K. Kratz, and S. Diehl. 1997. Quantifying spatial
heterogeneity in streams. J. N. Am. Benthol. Soc. 16:174-188.
Craig, J.P., and R.R. Weil. 1993. Nitrate leaching to a shallow mid-Atlantic coastal plain aquifer
as influenced by conventional no-till and low-input sustainable grain production systems.
Water. Sci. Technol. 28:691-700.
Cressie, N. 1985. Fitting variogram models by weighted least squares. Math. Geol. 17:563-586.
Davis, S.N., G.M. Thomson, H.W. Bently, and G. Stiles. 2006. Groundwater tracers: a short
review. Groundwater. 18:14-23.
111
Dent, C.L., and N.B. Grimm. 1999. Spatial heterogeneity of stream water nutrient concentrations
over successional time. Ecology 80:2283-2298.
Dent, C.L., N.B. Grimm, and S.G. Fisher. 2001. Multiscale effects of surface-subsurface
exchange on stream water nutrient concentrations. J. N. Am. Benthol. Soc. 20:162-181.
Fraser, D.F., J.F. Gilliam, and T. Yip-Hoi. 1995. Predation as an agent of population
fragmentation in a tropical watershed. Ecology 76:1461-1472.
Gardner, B., P.J. Sullivan, and A.J. Lembo. 2003. Predicting stream temperatures: geostatistical
model comparison using alternative distance metrics. Can. J. Aquatic Sci. 60:344-351.
Gold, A.J., P.M. Groffman, K. Addy, D.Q. Kellogg, M. Stolt, and A.E. Rosenblatt. 2001.
Landscape attributes as controls on groundwater nitrate removal capacity of riparian
zones. J. Am. Water Res. Assoc. 37:1457-1464.
Haggard, B.E., D.E. Storm, and E.H. Stanley. 2001. Effect of a point source input on stream
nutrient retention. J. Am. Water Resour. Assoc. 37:1291-1299.
Hill, A.R. 1996. Nitrate removal in stream riparian zones. J. Environ. Qual. 25: 743-755.
Lechowicz, M.J., and G. Bell. 1991. The ecology and genetics of fitness in forest plants. II.
Microspatial heterogeneity of the edaphic environment. J. Ecol. 79:687-696.
Legendre, P., and M.J. Fortin. 1989. Spatial pattern and ecological analysis. Vegetatio 80:107-
138.
Lowrance, R.R. 1992. Groundwater nitrate and denitrification in a coastal riparian forest. J.
Environ. Qual. 21:401-405.
Marti, E., J. Aumatell, L. Gode, M. Poch, and F. Sabatar. 2004. Nutrient retention efficiency in
streams receiving inputs from waste water treatment plants. J. Environ. Qual. 33:285-
293.
Needlelman, B.A. 2002. Surface runoff hydrology and phosphorus transport along two
agricultural hillslopes with contrasting soils. Ph.D. Thesis. The Pennsylvania State
University, University Park, PA.
O’Driscoll, M.A., and D.R. DeWalle. 2010. Seeps regulate stream nitrate concentration in
forested Appalachian catchments. J. Environ. Qual. 39:420-431.
Palmer, M.W. 1990. Spatial scale and patterns of species-environment relationships in hardwood
forest of the North Carolina piedmont. Coenoses 5:79-87.
Patton, C.J., and J.R. Kryskalla. 2003. Methods of analysis by the U.S. Geological Survey
National Water Quality Laboratory: evaluation of alkaline persulfate digestion as an
alternative to Kjeldahl digestion for determination of total dissolved nitrogen and
phosphorus in water. U.S. Geological Survey water resources investigations report 03-
4174, 33 p.

112
Peterjohn, W.T., and D.L. Correll. 1984. Nutrient dynamics in an agricultural watershed:
observations on the role of a riparian forest. Ecology 65:1466-1475.
Peterson, B.J., W.M. Wolheim, P.J. Mulholland, J.R. Webster, J.L. Meyer, J.L. Tank, E. Marti,
W.B. Bowden, H.M. Valett, A.E. Hershey, W.H. McDowell, W.K. Dodds, S.K.
Hamilton, S. Gregory, and D.D. Morrall. 2001. Control of nitrogen export from
watersheds by headwater streams. Science 292:86-90.
Peterson, E.E., A.A. Merton, D.M. Theobald, and N.S. Urquhart. 2006. Patterns of spatial
autocorrelation in stream water chemistry. Environ. Monit. Assess. 121:571-596.
Pionke, H.B., J.R. Hoover, R.R. Schnabel, W.J. Gburek, J.B. Urban, and A.S. Rogowski. 1988.
Chemical-hydrologic interactions in the near-stream zone. Water Resour. Res. 24:1101-
1110.
R Development Core Team. 2011. R: a language and environment for statistical computing. R
Foundation for Statistical Computing, Vienna, Austria.
Robertson, G.P., K.M. Klingensmith, M.J. Klug, E.A. Paul, J.R. Crum, and B.G. Ellis. 1997. Soil
resources, microbial activity, and primary production across an agricultural ecosystem.
Ecol. Appl. 7:158-170.
Rossi, R.E., D.J. Mulla, A.G. Journel, and E.H. Franz. 1992. Geostatistical tools for modeling and
interpreting ecological spatial dependence. Ecol. Monogr. 62:277-314.
Rutherford, J.C., and M.L. Nguyen. 2004. Nitrate removal in riparian wetlands: interactions
between surface flow and soils. J. Environ. Qual. 33:1133-1143.
Scanlon, T.M., S.M. Ingram, and A.L. Riscassi. 2010. Terrestrial and in-stream influences on the
spatial variability of nitrate in a forested headwater catchment. J. Geophys. Res. 115:
G02022, DOI: 10.1029/2009JG001091.
Shabaga, J.A., and A.R. Hill. 2010. Groundwater-fed surface flow path hydrodynamics and
nitrate removal in three riparian zones in southern Ontario, Canada. J. Hydrol. 388:52-64.
Tesoriero, A.J., H. Liebsecher, and S.E. Cox. 2000. Mechanisms and rate of denitrification in an
agricultural watershed: electron and mass balance along groundwater flow paths. Water
Resour. Res. 36:1545-1559.
U.S. Environmental Protection Agency. 2008. National water quality inventory: 2008.
Washington, DC.
Ver Hoef, J.M., E. Peterson, and D. Theobald. 2006. Spatial statistical models that use flow and
stream distance. Environ. Ecol. Stat. 13:449-464.
Wagener, S.M., M.W. Oswood, and J.P. Schimel. 1998. Rivers and soils: parallels in carbon and
nutrient processing. BioScience 48:104-108.

113
Warwick, J., and A.R. Hill. 1988. Nitrate depletion in the riparian zone of a small woodland
stream. Hydrobiologia 157:231-240.
Zhu, Q., J.P. Schmidt, and R.B. Bryant. 2011. Hot moments and hot spots of nutrient losses from
a mixed land use watershed. J. Hydrol. 414:393-404.

114
CHAPTER 5
Linking Nitrogen Management, Seep Chemistry, and Stream Water
Quality in Two Agricultural Headwater Catchments
Abstract
Groundwater-fed seeps or seepage zones have been shown to contribute substantially to
streamflow and increase nitrogen (N) concentrations, especially nitrate-N (NO3-N), in stream
reaches of agricultural catchments. Knowledge of the factors that influence seep NO3-N
concentrations, however, is still lacking. The objective of this study was to quantify the effects of
N management throughout two headwater catchments and NO3-N retention and removal within
seep surface flow paths on NO3-N concentrations in seep water. In addition, we sought to
examine the effect of seeps on stream water quality at the catchment outlet. Nitrate-N retention
within seeps was evaluated over a 2-year period (May 2010 – April 2012) by measuring the
change in NO3-N concentration along 20 seeps in FD36 and RS, two small agricultural
headwater catchments in the Appalachian Valley and Ridge region of central Pennsylvania.
Stream water samples at the catchment outlets were collected concurrently with seep water.
Annual farmer surveys were also used to collect N management data at the field-scale. Results
showed that the mean N application rate in FD36 (133 kg ha-1
) was significantly less than the
mean N application rate in RS (200 kg ha-1
). Mean N application rate along groundwater flow
paths to seeps in both catchments was significantly correlated (R2 = 0.79) to mean seep top (i.e.,
emergence point) NO3-N concentration. Nitrate-N concentration from the seep top generally
decreased downseep suggesting that most seeps retained NO3-N. Mean NO3-N retention within

115
seep surface flow paths was 0.8 (16%) and 0.2 (1%) mg L-1
in FD36 and RS, respectively;
although, NO3-N retention varied seasonally (-3 to 41%) in FD36. Seasonal variability in seep
NO3-N retention in FD36 was related to both stream discharge (R2 = 0.53) and air temperature
(R2 = -0.64). Mean seep bottom NO3-N concentration was significantly correlated to stream NO3-
N concentration at the catchment outlet in both FD36 and RS with seeps accounting for 80% and
79%, respectively, of the variability in stream NO3-N concentration. The results of this study
suggest that while some NO3-N retention occurs within seep surface flow paths, the primary
factor controlling NO3-N delivery from seeps to streams is N management throughout the
catchment. Thus, in agricultural catchments with seeps, management practices that decrease the
potential for NO3-N leaching have the potential to improve stream water quality.
Introduction
Discharge from groundwater-sustained wetlands, slope wetlands, springs, or emergent
groundwater seeps (hereafter referred to as seeps) in both forested (Burns et al., 1998; O’Driscoll
and DeWalle, 2010) and agricultural (Shabaga and Hill, 2010) headwater catchments represents a
potentially significant source of water and nitrogen (N) to many streams. Recent work by West et
al. (2001) and Williams (Chapter 4) also points to the importance of seeps as variable sources of
N inputs to headwater streams. Indeed, Williams (Chapter 4) found that variable inputs of nitrate-
N (NO3-N) from seeps in two agricultural headwater catchments in Pennsylvania influenced
downstream variations in stream water NO3-N concentration. Variability in seep NO3-N
concentration may arise due to variable sources of N applied across the catchment, N processing
along groundwater flow pathways, or a combination thereof. Few studies, however, have looked
at how these factors might influence seep inputs of N to headwater streams.

116
Research has shown that groundwater N chemistry is generally a reflection of the land
use, the type of N source (i.e., fertilizer, atmospheric deposition, etc.), and the distribution of N
inputs across a catchment (Howarth et al., 1996; Sharpley et al., 1998; Boyer et al., 2002). For
example, in many non-glaciated areas in the northeast U.S., catchments are underlain by bedrock
that is severely weathered at a shallow depth as a result of stress-relief fracturing (Gburek and
Folmar, 1999). Water quality within these shallow fractured aquifers has been shown to be
affected directly by the overlying and immediately upgradient land use (Pionke and Urban,
1985). Differences in management therefore have the potential to result in significant spatial and
temporal variability of seep N concentrations. For instance, O’Driscoll and DeWalle (2010)
monitored 15 seeps in an Appalachian forested headwater catchment and found that NO3-N
concentrations in seeps varied, ranging from 0.1 to 2.15 mg L-1
. In contrast, Williams (Chapter 4)
monitored 17 seeps in two Appalachian agricultural headwater catchments and found that NO3-N
concentrations ranged from 0.1 to 29.5 mg L-1
. Notably, the primary N input in forested
catchments is atmospheric deposition, which is uniformly distributed across small headwater
catchments. Absent any effects of N transformations along groundwater flow pathways, one
would expect little variability in seep NO3-N concentrations. In contrast, agricultural catchments
are typically managed on a field by field basis, and as a result, N application can be quite variable
across the catchment. This variable management can translate to variable seep NO3-N
concentrations (Williams, Chapter 4).
The primary flow pathway for N delivery to seeps in many non-glaciated areas in the
northeast U.S. is a highly conductive fractured aquifer that can support lateral saturated flows
(Lindsey et al., 2003; Williams, Chapters 2 and 3). Williams (Chapters 2 and 3) found that this
shallow fractured aquifer supplied 53% to 75% of groundwater to seeps. Several studies have also
shown that most NO3-N transported in the shallow fractured aquifer system is not altered by
processing along the flow pathway due to short (i.e., several months to 2 years) water residence

117
times (Pionke and Urban, 1985; McGuire et al., 2002; Lindsey et al., 2003). Denitrification in
this setting is mostly confined to a deeper aquifer (Lindsey et al., 2003), which does not
contribute water at the scale of headwater (i.e., first-order) catchments (Gburek and Folmar,
1999). This suggests that management is the main factor influencing the water quality of seeps (a
hypothesis we hope to test), and that any processing of NO3-N is limited to the seep surface flow
pathway.
Seeps often discharge groundwater to the surface in the riparian zone, which flows over
land via concentrated flow paths before entering the stream at discrete points along the channel
(Pionke et al., 1988; Rutherford and Nyugen, 2004; O’Driscoll and DeWalle, 2010). Hydrologic
and biogeochemical processes can either result in NO3-N retention or removal from seep water or
facilitate NO3-N delivery to the stream. For example, seep surface flow paths have the potential
to function as biogeochemical hotspots in the riparian zone (McCain et al., 2003), promoting
conditions that are often favorable for high denitrification rates and vegetative uptake. Dense
vegetation, saturated soils with suitable redox conditions, and large fluxes of electron donors and
acceptors all occur with seeps. In contrast, seep surface flow paths may be transport hotspots
(McCain et al., 2003) and exhibit disproportionately high discharge rates relative to adjacent
areas of the riparian zone. Higher discharge rates can result in decreased interaction between seep
water and riparian soils along surface flow paths (Rutherford and Nyguen, 2004). Inconsistent
results from previous research on NO3-N retention along seep surface flow paths underscore this
paradox. Several studies have reported substantial removal of NO3-N along seep surface flow
paths through the riparian zone (Brusch and Nilsson, 1993; Blackwell et al., 1999; Rutherford
and Nyguen, 2004; O’Driscoll and DeWalle, 2010). Others, however, have found that surface
seep flow paths deliver high NO3-N concentration groundwater directly into the stream,
essentially short-circuiting the remedial benefits of the riparian zone (Warwick and Hill, 1988;
Hill, 1990; Angier et al., 2002, 2005).
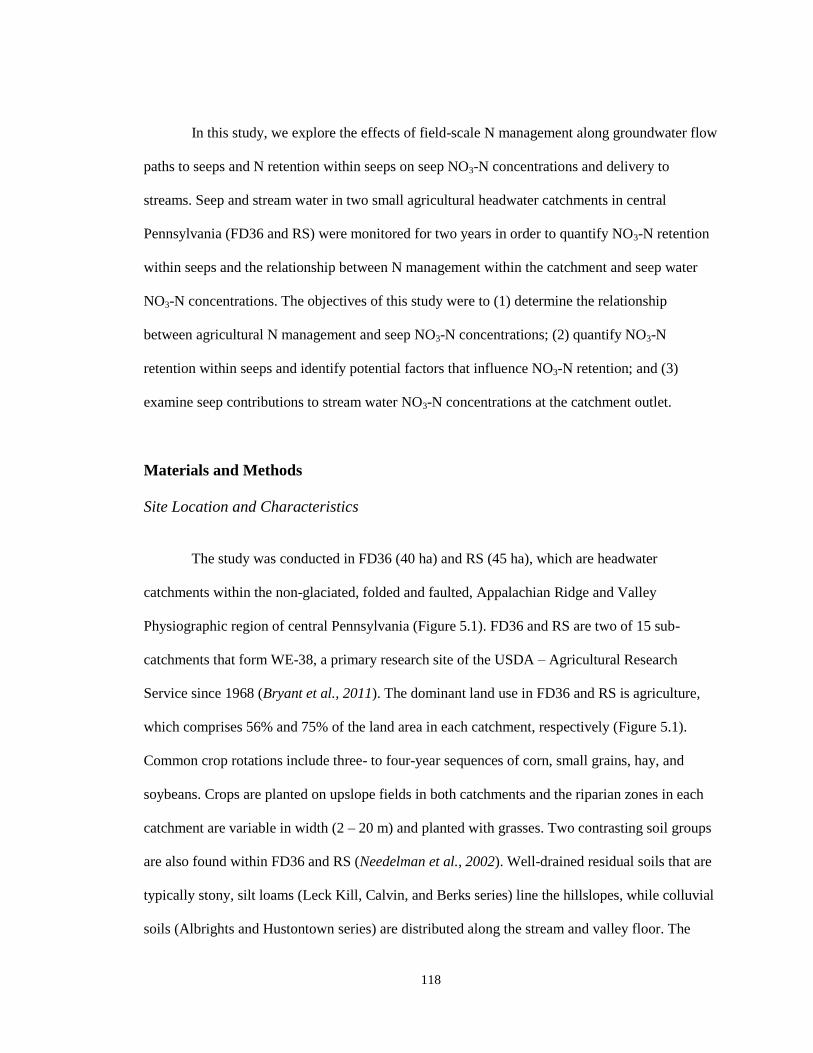
118
In this study, we explore the effects of field-scale N management along groundwater flow
paths to seeps and N retention within seeps on seep NO3-N concentrations and delivery to
streams. Seep and stream water in two small agricultural headwater catchments in central
Pennsylvania (FD36 and RS) were monitored for two years in order to quantify NO3-N retention
within seeps and the relationship between N management within the catchment and seep water
NO3-N concentrations. The objectives of this study were to (1) determine the relationship
between agricultural N management and seep NO3-N concentrations; (2) quantify NO3-N
retention within seeps and identify potential factors that influence NO3-N retention; and (3)
examine seep contributions to stream water NO3-N concentrations at the catchment outlet.
Materials and Methods
Site Location and Characteristics
The study was conducted in FD36 (40 ha) and RS (45 ha), which are headwater
catchments within the non-glaciated, folded and faulted, Appalachian Ridge and Valley
Physiographic region of central Pennsylvania (Figure 5.1). FD36 and RS are two of 15 sub-
catchments that form WE-38, a primary research site of the USDA – Agricultural Research
Service since 1968 (Bryant et al., 2011). The dominant land use in FD36 and RS is agriculture,
which comprises 56% and 75% of the land area in each catchment, respectively (Figure 5.1).
Common crop rotations include three- to four-year sequences of corn, small grains, hay, and
soybeans. Crops are planted on upslope fields in both catchments and the riparian zones in each
catchment are variable in width (2 – 20 m) and planted with grasses. Two contrasting soil groups
are also found within FD36 and RS (Needelman et al., 2002). Well-drained residual soils that are
typically stony, silt loams (Leck Kill, Calvin, and Berks series) line the hillslopes, while colluvial
soils (Albrights and Hustontown series) are distributed along the stream and valley floor. The

119
Figure 5.1
Aerial photo of FD36 and RS with locations of groundwater-fed seeps shown. FD36 and RS are
small agricultural sub-catchments of WE-38 (7.3 km2), which is located in central Pennsylvania
and has been a primary research site of the USDA-Agricultural Research Service for over 40
years. Stream water leaving WE-38 flows into East Mahantango Creek, which flows into the
Susquehanna River and ultimately the Chesapeake Bay.
Albrights and Hustontown soils in the riparian zone have a moderately well-developed fragipan
beginning at a depth of 0.5 to 0.7 m and have low permeability.
The climate in FD36 and RS is temperate and humid with annual precipitation averaging
1080 mm yr-1
(Buda et al., 2011). Previous research in FD36 has shown that groundwater from a
N
Meters
0 500 250 125
Pennsylvania
FD36 & RS RS Catchment
FD36 Catchment
Legend
Stream
Stream Outlet
Seep Location
N
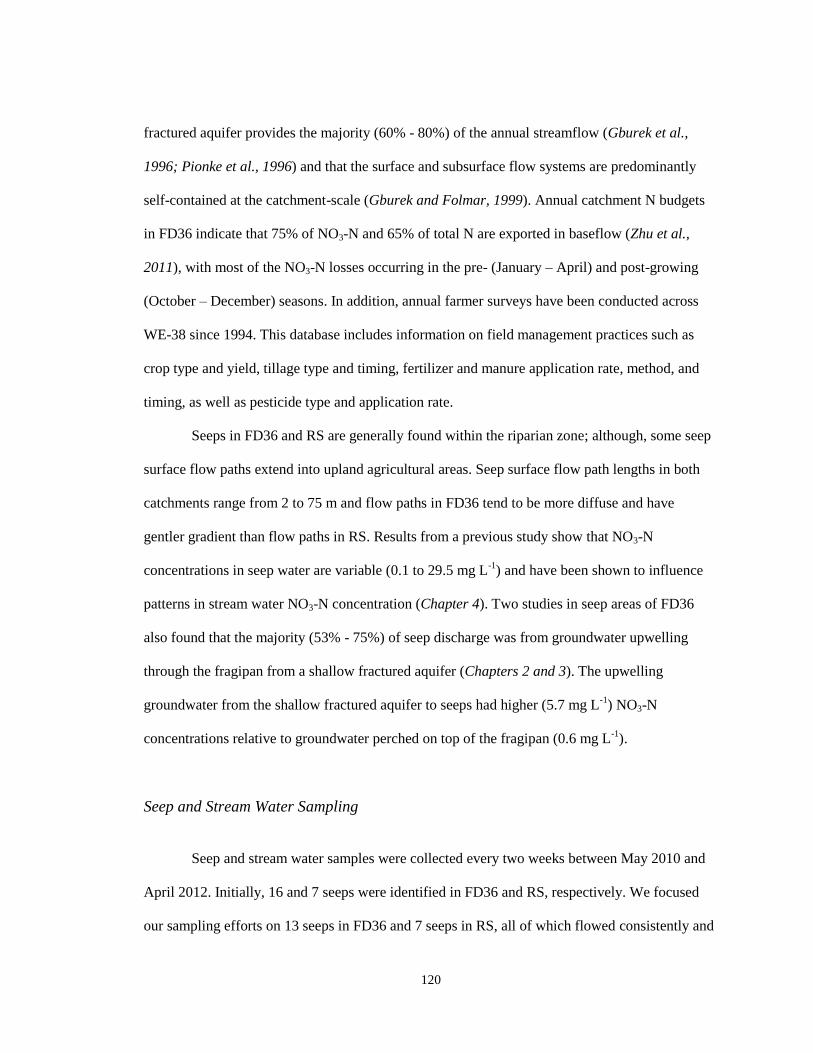
120
fractured aquifer provides the majority (60% - 80%) of the annual streamflow (Gburek et al.,
1996; Pionke et al., 1996) and that the surface and subsurface flow systems are predominantly
self-contained at the catchment-scale (Gburek and Folmar, 1999). Annual catchment N budgets
in FD36 indicate that 75% of NO3-N and 65% of total N are exported in baseflow (Zhu et al.,
2011), with most of the NO3-N losses occurring in the pre- (January – April) and post-growing
(October – December) seasons. In addition, annual farmer surveys have been conducted across
WE-38 since 1994. This database includes information on field management practices such as
crop type and yield, tillage type and timing, fertilizer and manure application rate, method, and
timing, as well as pesticide type and application rate.
Seeps in FD36 and RS are generally found within the riparian zone; although, some seep
surface flow paths extend into upland agricultural areas. Seep surface flow path lengths in both
catchments range from 2 to 75 m and flow paths in FD36 tend to be more diffuse and have
gentler gradient than flow paths in RS. Results from a previous study show that NO3-N
concentrations in seep water are variable (0.1 to 29.5 mg L-1
) and have been shown to influence
patterns in stream water NO3-N concentration (Chapter 4). Two studies in seep areas of FD36
also found that the majority (53% - 75%) of seep discharge was from groundwater upwelling
through the fragipan from a shallow fractured aquifer (Chapters 2 and 3). The upwelling
groundwater from the shallow fractured aquifer to seeps had higher (5.7 mg L-1
) NO3-N
concentrations relative to groundwater perched on top of the fragipan (0.6 mg L-1
).
Seep and Stream Water Sampling
Seep and stream water samples were collected every two weeks between May 2010 and
April 2012. Initially, 16 and 7 seeps were identified in FD36 and RS, respectively. We focused
our sampling efforts on 13 seeps in FD36 and 7 seeps in RS, all of which flowed consistently and
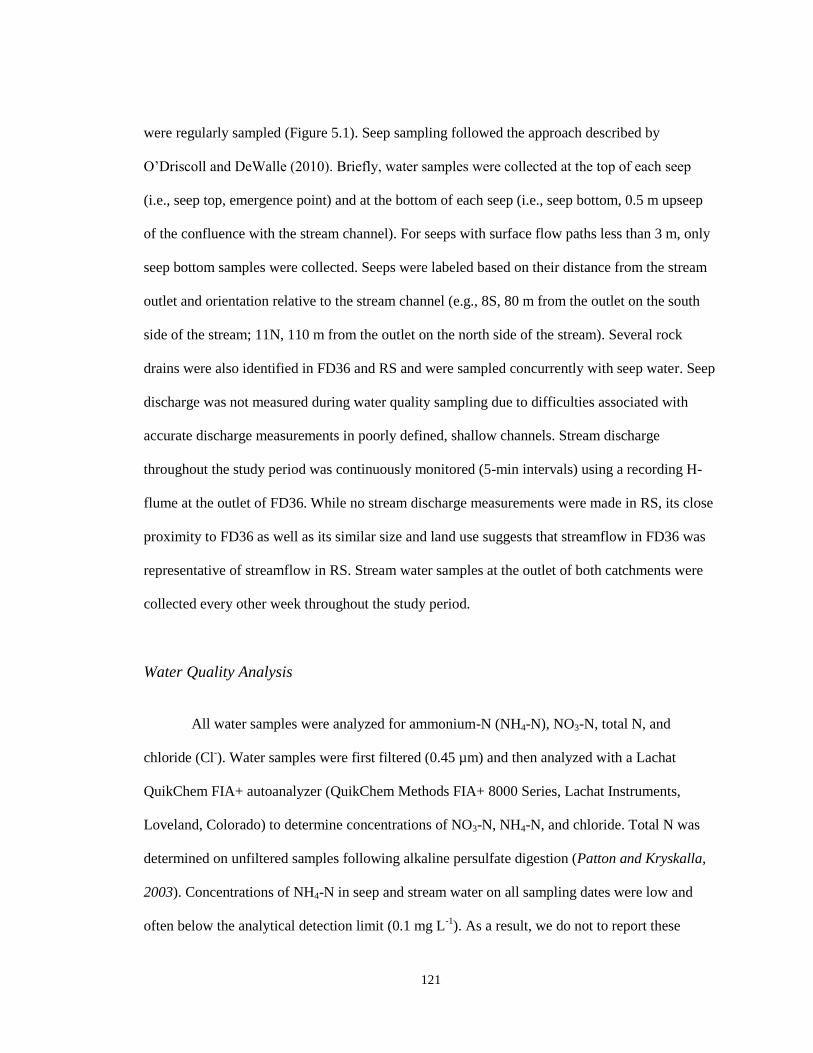
121
were regularly sampled (Figure 5.1). Seep sampling followed the approach described by
O’Driscoll and DeWalle (2010). Briefly, water samples were collected at the top of each seep
(i.e., seep top, emergence point) and at the bottom of each seep (i.e., seep bottom, 0.5 m upseep
of the confluence with the stream channel). For seeps with surface flow paths less than 3 m, only
seep bottom samples were collected. Seeps were labeled based on their distance from the stream
outlet and orientation relative to the stream channel (e.g., 8S, 80 m from the outlet on the south
side of the stream; 11N, 110 m from the outlet on the north side of the stream). Several rock
drains were also identified in FD36 and RS and were sampled concurrently with seep water. Seep
discharge was not measured during water quality sampling due to difficulties associated with
accurate discharge measurements in poorly defined, shallow channels. Stream discharge
throughout the study period was continuously monitored (5-min intervals) using a recording H-
flume at the outlet of FD36. While no stream discharge measurements were made in RS, its close
proximity to FD36 as well as its similar size and land use suggests that streamflow in FD36 was
representative of streamflow in RS. Stream water samples at the outlet of both catchments were
collected every other week throughout the study period.
Water Quality Analysis
All water samples were analyzed for ammonium-N (NH4-N), NO3-N, total N, and
chloride (Cl-). Water samples were first filtered (0.45 µm) and then analyzed with a Lachat
QuikChem FIA+ autoanalyzer (QuikChem Methods FIA+ 8000 Series, Lachat Instruments,
Loveland, Colorado) to determine concentrations of NO3-N, NH4-N, and chloride. Total N was
determined on unfiltered samples following alkaline persulfate digestion (Patton and Kryskalla,
2003). Concentrations of NH4-N in seep and stream water on all sampling dates were low and
often below the analytical detection limit (0.1 mg L-1
). As a result, we do not to report these
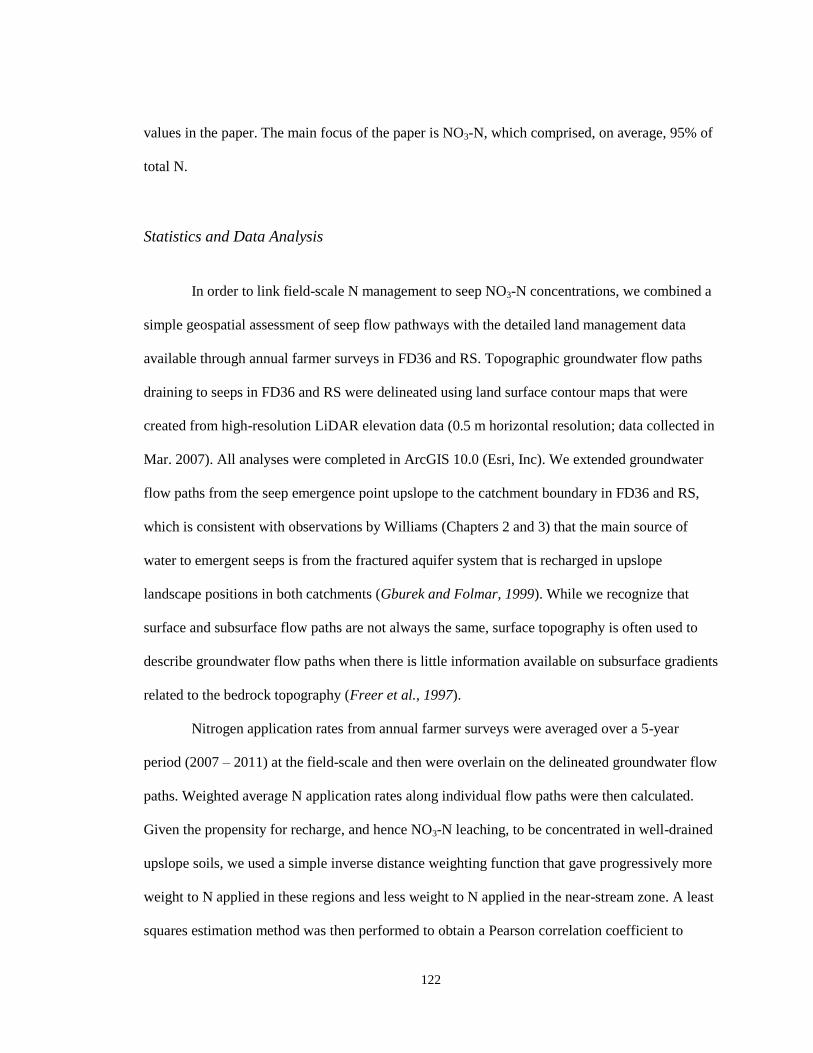
122
values in the paper. The main focus of the paper is NO3-N, which comprised, on average, 95% of
total N.
Statistics and Data Analysis
In order to link field-scale N management to seep NO3-N concentrations, we combined a
simple geospatial assessment of seep flow pathways with the detailed land management data
available through annual farmer surveys in FD36 and RS. Topographic groundwater flow paths
draining to seeps in FD36 and RS were delineated using land surface contour maps that were
created from high-resolution LiDAR elevation data (0.5 m horizontal resolution; data collected in
Mar. 2007). All analyses were completed in ArcGIS 10.0 (Esri, Inc). We extended groundwater
flow paths from the seep emergence point upslope to the catchment boundary in FD36 and RS,
which is consistent with observations by Williams (Chapters 2 and 3) that the main source of
water to emergent seeps is from the fractured aquifer system that is recharged in upslope
landscape positions in both catchments (Gburek and Folmar, 1999). While we recognize that
surface and subsurface flow paths are not always the same, surface topography is often used to
describe groundwater flow paths when there is little information available on subsurface gradients
related to the bedrock topography (Freer et al., 1997).
Nitrogen application rates from annual farmer surveys were averaged over a 5-year
period (2007 – 2011) at the field-scale and then were overlain on the delineated groundwater flow
paths. Weighted average N application rates along individual flow paths were then calculated.
Given the propensity for recharge, and hence NO3-N leaching, to be concentrated in well-drained
upslope soils, we used a simple inverse distance weighting function that gave progressively more
weight to N applied in these regions and less weight to N applied in the near-stream zone. A least
squares estimation method was then performed to obtain a Pearson correlation coefficient to
123
measure the strength of the linear relationship between weighted mean N application rate along
the groundwater flow paths draining to seeps and seep top (or seep bottom, if seep length < 3 m)
NO3-N concentrations.
We also sought to evaluate the potential for NO3-N retention in seeps from the point of
emergence to discharge in streams. To determine the amount of NO3-N retention in seeps,
downseep changes in NO3-N concentration (seep bottom – seep top) were calculated for seeps
with lengths greater than 3 m (following O’Driscoll and DeWalle (2010)). Changes in NO3-N
concentrations from seep top to bottom were compared to zero change in concentration with a
one-sample t-test. Mean monthly seep top and bottom NO3-N concentrations were also compared
with a paired t-test to evaluate whether seeps functioned as NO3-N sources or sinks at the
catchment scale. Pearson correlation coefficients were calculated between stream discharge, air
temperature (recorded at a meteorological station in FD36), and NO3-N concentration change
along seeps to determine factors that were influencing NO3-N transport in seeps. In addition,
Pearson correlation coefficients were calculated for monthly seep bottom NO3-N concentrations
(all seeps and rock drains in the catchment) and stream (catchment outlet) NO3-N concentrations
to evaluate the relationship between seep and stream NO3-N concentrations. All statistical
analyses were completed in R statistical software package (R Foundation for Statistical
Computing, 2011). A probability level of 0.05 was used to evaluate statistical significance in all
analysis.
Results
Nitrogen Management in FD36 and RS
Annual farmer surveys showed that N application occurred in both the spring and fall in
FD36 and RS. A combination of commercial fertilizers, dairy manure, and swine manure was the

124
primary source of applied N in both catchments. From 2007 through 2011, farmer surveys
showed that N was applied to an average of 14.5 and 24.8 ha in FD36 and RS, respectively,
which is equivalent to 36% and 55% of the drainage area in each catchment (Table 5.1). The
mean annual N application rate over the 5-yr period was significantly less in FD36 (133 kg ha-1
)
than in RS (200 kg ha-1
) (p < 0.001; Table 5.1); although, N application rates in individual fields
varied substantially in both catchments from year to year. Nitrogen application rates in RS were
significantly greater than FD36 because large amounts of swine manure were applied twice a year
from a nearby confined animal feeding operation. Nitrogen application rates did not vary
significantly by season (spring or fall) in either catchment.
Nitrogen Application Rate along Groundwater Flow Paths to Seeps
Mean annual N application rate in individual fields of FD36 and RS ranged from 0 to 250
kg ha-1
from 2007 through 2011 (Figure 5.2). In FD36, higher mean annual N application rates
(150 to 200 kg ha-1
) were found on the north side of the stream compared to mean annual N
applications rates (0 to 100 kg ha-1
) on the south side of the stream. In RS, mean annual N
Table 5.1 Nitrogen management data from FD36 and RS (2007 – 2011). Data were collected
from annual farmer surveys in both catchments. The amount of N applied in FD36 and RS
was a combination of commercial fertilizer, dairy manure, and swine manure. Nitrogen
content in dairy and swine manure was determined using typical compositions reported in the
Penn State Agronomy Guide (2011).
FD36 RS
Year N
applied
Area of N
application
Mean N
application rate
N
applied
Area of N
application
Mean N
application rate
kg ha kg ha-1
kg ha kg ha-1
2007 2182 15.4 142 3982 19.6 203
2008 2279 15.0 152 5796 27.3 212
2009 1773 12.8 139 4773 22.5 212
2010 1456 14.0 104 6011 28.2 213
2011 2148 15.3 140 4228 26.6 159

125
Figure 5.2
Mean N application rates in FD36 and RS from 2007 through 2011. Data were collected from
annual farmer surveys in both catchments. The amount of N applied in FD36 and RS was a
combination of commercial fertilizer, dairy manure, and swine manure. Nitrogen content in dairy
and swine manure was determined using typical compositions reported in the Penn State
Agronomy Guide (2011).Seep flow paths were delineated using surface topography and extended
from the seep discharge location to the catchment boundary.
N application rate
(kg ha-1
)
0 – 50
50 – 100
100 – 150
150 – 200
200 – 250
RS
FD36 Stream
Seep flow path
Seep
N
125 250 500 0 Meters
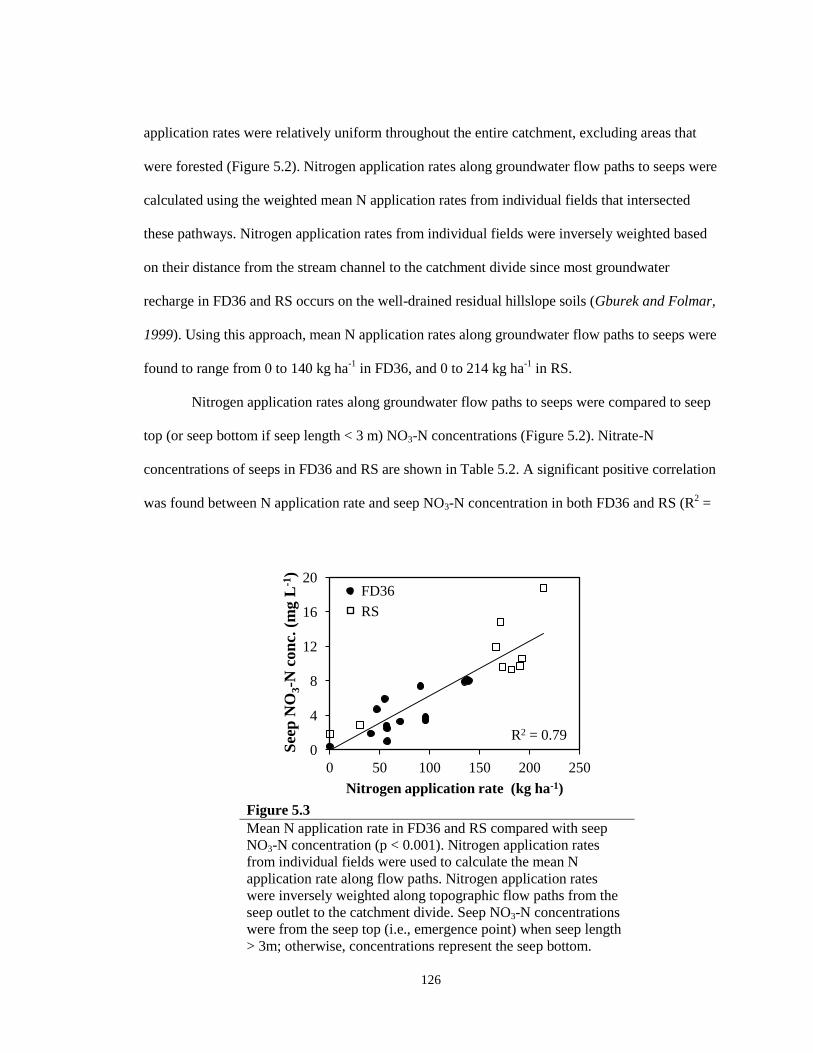
126
application rates were relatively uniform throughout the entire catchment, excluding areas that
were forested (Figure 5.2). Nitrogen application rates along groundwater flow paths to seeps were
calculated using the weighted mean N application rates from individual fields that intersected
these pathways. Nitrogen application rates from individual fields were inversely weighted based
on their distance from the stream channel to the catchment divide since most groundwater
recharge in FD36 and RS occurs on the well-drained residual hillslope soils (Gburek and Folmar,
1999). Using this approach, mean N application rates along groundwater flow paths to seeps were
found to range from 0 to 140 kg ha-1
in FD36, and 0 to 214 kg ha-1
in RS.
Nitrogen application rates along groundwater flow paths to seeps were compared to seep
top (or seep bottom if seep length < 3 m) NO3-N concentrations (Figure 5.2). Nitrate-N
concentrations of seeps in FD36 and RS are shown in Table 5.2. A significant positive correlation
was found between N application rate and seep NO3-N concentration in both FD36 and RS (R2 =
Figure 5.3
Mean N application rate in FD36 and RS compared with seep
NO3-N concentration (p < 0.001). Nitrogen application rates
from individual fields were used to calculate the mean N
application rate along flow paths. Nitrogen application rates
were inversely weighted along topographic flow paths from the
seep outlet to the catchment divide. Seep NO3-N concentrations
were from the seep top (i.e., emergence point) when seep length
> 3m; otherwise, concentrations represent the seep bottom.
0
4
8
12
16
20
0 50 100 150 200 250
See
p N
O3-N
con
c. (
mg L
-1)
Nitrogen application rate (kg ha-1)
FD36
RS
R2 = 0.79
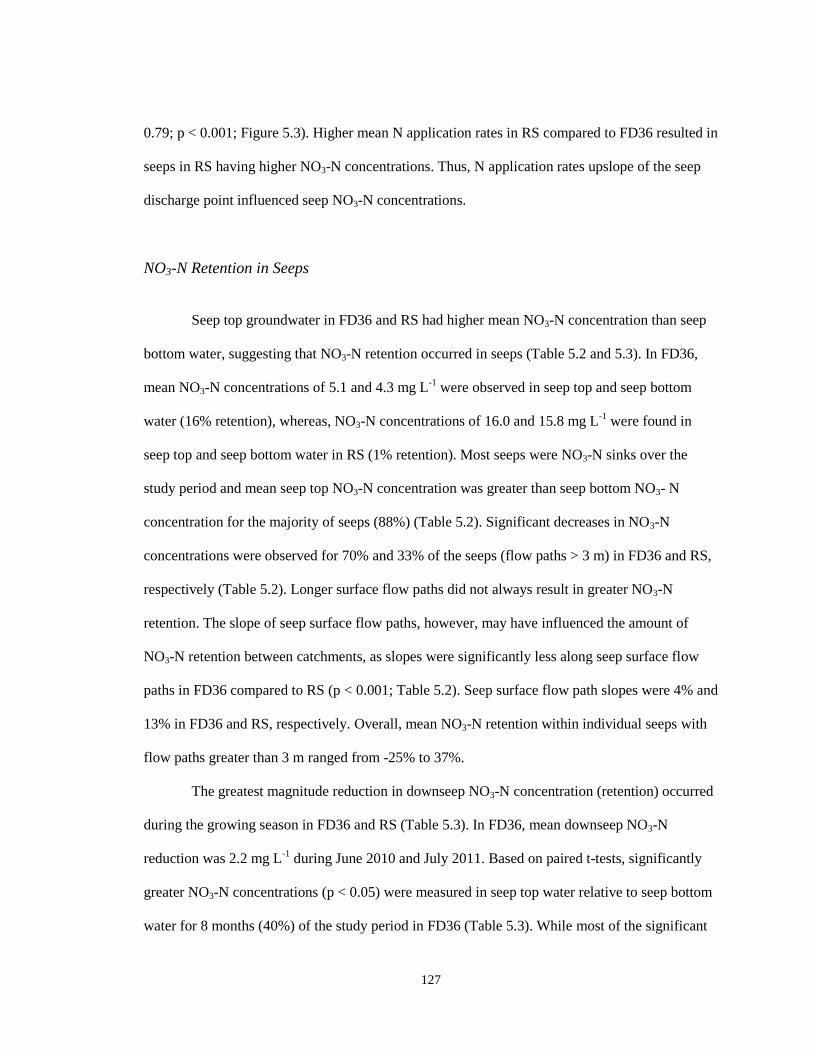
127
0.79; p < 0.001; Figure 5.3). Higher mean N application rates in RS compared to FD36 resulted in
seeps in RS having higher NO3-N concentrations. Thus, N application rates upslope of the seep
discharge point influenced seep NO3-N concentrations.
NO3-N Retention in Seeps
Seep top groundwater in FD36 and RS had higher mean NO3-N concentration than seep
bottom water, suggesting that NO3-N retention occurred in seeps (Table 5.2 and 5.3). In FD36,
mean NO3-N concentrations of 5.1 and 4.3 mg L-1
were observed in seep top and seep bottom
water (16% retention), whereas, NO3-N concentrations of 16.0 and 15.8 mg L-1
were found in
seep top and seep bottom water in RS (1% retention). Most seeps were NO3-N sinks over the
study period and mean seep top NO3-N concentration was greater than seep bottom NO3- N
concentration for the majority of seeps (88%) (Table 5.2). Significant decreases in NO3-N
concentrations were observed for 70% and 33% of the seeps (flow paths > 3 m) in FD36 and RS,
respectively (Table 5.2). Longer surface flow paths did not always result in greater NO3-N
retention. The slope of seep surface flow paths, however, may have influenced the amount of
NO3-N retention between catchments, as slopes were significantly less along seep surface flow
paths in FD36 compared to RS (p < 0.001; Table 5.2). Seep surface flow path slopes were 4% and
13% in FD36 and RS, respectively. Overall, mean NO3-N retention within individual seeps with
flow paths greater than 3 m ranged from -25% to 37%.
The greatest magnitude reduction in downseep NO3-N concentration (retention) occurred
during the growing season in FD36 and RS (Table 5.3). In FD36, mean downseep NO3-N
reduction was 2.2 mg L-1
during June 2010 and July 2011. Based on paired t-tests, significantly
greater NO3-N concentrations (p < 0.05) were measured in seep top water relative to seep bottom
water for 8 months (40%) of the study period in FD36 (Table 5.3). While most of the significant

128
Table 5.2 Seep characteristics from FD36 and RS including site, number of samples, length,
slope, bypass events, percentage of sampling events that were bypass events, mean top and
bottom seep NO3-N concentration, and downseep NO3-N concentration change. Nitrate
concentration data were collected from both catchments between May 2010 and April 2012.
Bypass
events‡
Upslope annual
N appl. rate NO3-N concentration
Site n† Length Slope n % Top Bottom Change
m m m-1
kg ha-1
mg L-1
FD36
2S 12 33 0.028 7 58 0 0.3 0.4 +0.1
8S 26 12 0.051 5 19 57 3.2 2.8 -0.4
11N 25 8 0.076 3 12 139 9.5 8.0 -1.5
14N 15 55 0.030 0 0 135 10.6 7.9 -2.7
22S 6 3 58 1.0
28N 23 2 148 8.1
31S 25 29 0.045 4 16 57 3.0 2.5 -0.5
35S 26 20 0.041 9 35 47 5.0 4.7 -0.3 *36S 32 n/a 65 5.9
43N 6 2 96 3.8
46S 14 76 0.012 4 29 41 3.0 1.9 -1.1
47N 11 35 0.030 3 27 85 4.8 3.4 -1.4
49N 31 17 0.045 8 26 119 7.7 7.4 -0.3
53S 30 17 0.027 13 43 71 3.4 3.3 -0.1
RS
9W 30 8 0.114 12 40 200 14.9 14.8 -0.1
12E 3 19 0.084 0 0 0 2.2 1.8 -0.4
17W 30 10 0.091 14 47 215 18.8 18.8 0.0
19E 24 2 30 2.9
29E 25 14 0.214 5 20 182 10.6 10.2 -0.4
33E 6 64 0.156 3 50 166 9.3 8.7 -0.6 *37W 30 n/a 190 11.9
47E 8 22 0.130 0 0 173 9.7 9.5 -0.2 *48W 29 n/a 171 9.6
† n is the number of sampling events at each individual seep. It is < 32 and < 30 for sites that
ceased to flow for a portion of the study period in FD36 and RS, respectively. ‡ Seep bypass events occurred when seep NO3-N concentration remained stable or increased
downseep. Seep top samples were not collected for seeps with a length < 3 m. § p Value is for one-sample t-test between the change in seep NO3-N concentration and zero
change in concentration. Values in italics represent significant NO3-N concentration changes
downseep (p < 0.05). Seep concentration change calculated as seep bottom concentration
minus seep top concentration. * Rock drain that discharges into the stream.
129
Table 5.3 Mean monthly NO3-N concentration at the top and bottom of seeps
in FD36 and RS, and the downseep change in NO3-N concentration between
May 2010 and April 2012.
FD36 RS
Date Top Bottom Change† Top Bottom Change
†
mg L-1
2010
May 4.1 3.0 -1.1 18.6 18.6 0.0
June 5.4 3.2 -2.2 19.8 20.3 +0.4
Oct. 5.9 5.5 -0.4 19.6 19.3 -0.3
Nov. 6.6 6.0 -0.6 20.4 20.5 +0.1
Dec. 7.4 7.1 -0.3 17.3 17.2 -0.1
2011
Jan. 7.0 6.9 -0.1 21.1 21.4 +0.3
Feb. 6.1 5.3 -0.8 13.9 13.9 0.0
Mar. 5.5 4.9 -0.6 13.0 12.7 -0.3
Apr. 4.6 3.6 -1.0 13.1 12.7 -0.4
May 4.8 3.2 -1.6 12.2 11.7 -0.5
June 5.9 4.2 -1.7 16.7 16.5 -0.2
July 6.9 4.7 -2.2 20.4 20.4 0.0
Sept. 4.4 3.5 -0.9 15.6 15.6 0.0
Oct. 4.8 4.2 -0.6 14.1 13.8 -0.3
Nov. 4.0 3.8 -0.2 14.7 14.4 -0.3
Dec. 3.8 3.2 -0.6 12.0 11.9 -0.1
2012
Jan. 3.8 3.9 +0.1 14.4 14.5 +0.1
Feb. 5.1 4.7 -0.4 13.2 13.1 -0.1
Mar. 3.9 3.7 -0.2 15.8 15.6 -0.2
Apr. 3.4 2.8 -0.8 16.9 16.8 -0.1
All Dates 5.1 4.3 -0.8 16.0 15.8 -0.2 †Seep concentration change calculated as seep bottom concentration minus
seep top concentration. Values in italics represent significant NO3-N
concentration changes downseep (p < 0.05)
NO3-N retention occurred between April and June in FD36, there was also significant retention in
the months before (March) and following (July – October) this period depending on the year.
Although NO3-N retention was also observed in RS, no significant monthly downseep changes in
NO3-N concentrations were found (Table 5.3).
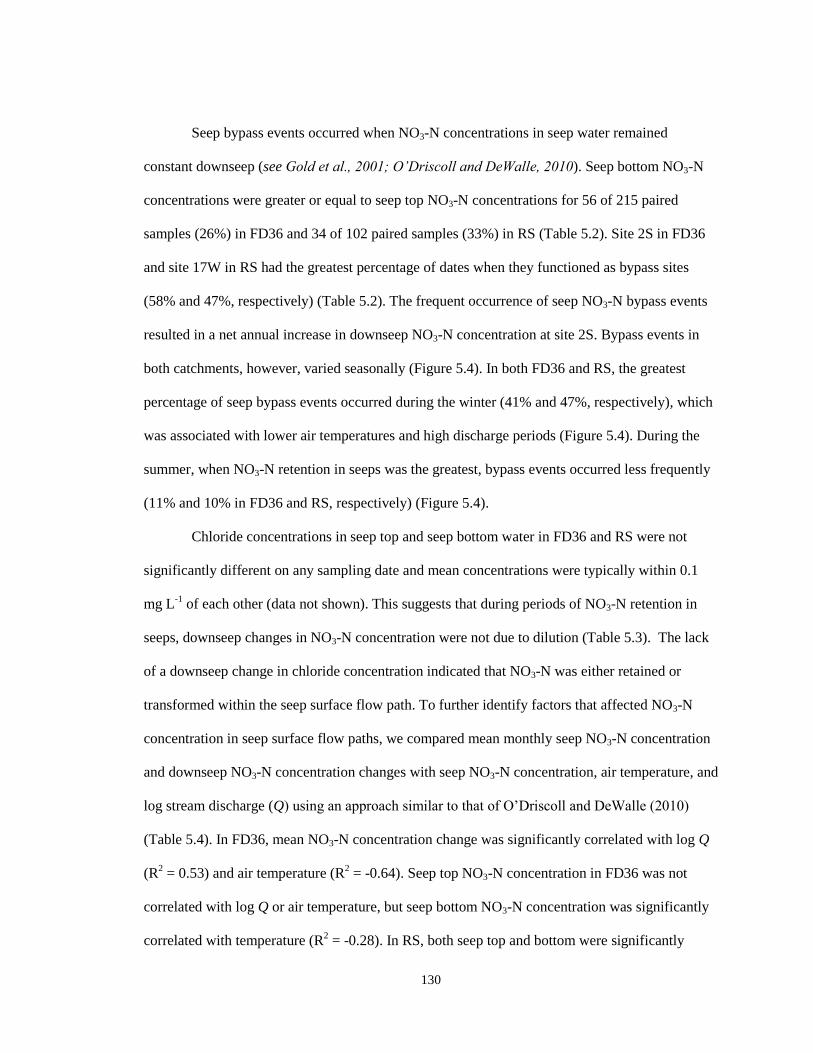
130
Seep bypass events occurred when NO3-N concentrations in seep water remained
constant downseep (see Gold et al., 2001; O’Driscoll and DeWalle, 2010). Seep bottom NO3-N
concentrations were greater or equal to seep top NO3-N concentrations for 56 of 215 paired
samples (26%) in FD36 and 34 of 102 paired samples (33%) in RS (Table 5.2). Site 2S in FD36
and site 17W in RS had the greatest percentage of dates when they functioned as bypass sites
(58% and 47%, respectively) (Table 5.2). The frequent occurrence of seep NO3-N bypass events
resulted in a net annual increase in downseep NO3-N concentration at site 2S. Bypass events in
both catchments, however, varied seasonally (Figure 5.4). In both FD36 and RS, the greatest
percentage of seep bypass events occurred during the winter (41% and 47%, respectively), which
was associated with lower air temperatures and high discharge periods (Figure 5.4). During the
summer, when NO3-N retention in seeps was the greatest, bypass events occurred less frequently
(11% and 10% in FD36 and RS, respectively) (Figure 5.4).
Chloride concentrations in seep top and seep bottom water in FD36 and RS were not
significantly different on any sampling date and mean concentrations were typically within 0.1
mg L-1
of each other (data not shown). This suggests that during periods of NO3-N retention in
seeps, downseep changes in NO3-N concentration were not due to dilution (Table 5.3). The lack
of a downseep change in chloride concentration indicated that NO3-N was either retained or
transformed within the seep surface flow path. To further identify factors that affected NO3-N
concentration in seep surface flow paths, we compared mean monthly seep NO3-N concentration
and downseep NO3-N concentration changes with seep NO3-N concentration, air temperature, and
log stream discharge (Q) using an approach similar to that of O’Driscoll and DeWalle (2010)
(Table 5.4). In FD36, mean NO3-N concentration change was significantly correlated with log Q
(R2 = 0.53) and air temperature (R
2 = -0.64). Seep top NO3-N concentration in FD36 was not
correlated with log Q or air temperature, but seep bottom NO3-N concentration was significantly
correlated with temperature (R2 = -0.28). In RS, both seep top and bottom were significantly

131
Figure 5.4
(A) Air temperature and log Q (stream discharge) at the
catchment outlet of FD36. (B) Percentage of seeps exhibiting
NO3-N bypass events. Seep NO3-N bypass occurred when
NO3-N concentration remained constant or increased
downseep. Gaps in seep data are from times of the year when
no seep flow occurred.
correlated with log Q (R2 = -0.25 and -0.23, respectively); however, NO3-N concentration change
was not correlated to either temperature or log Q.
Stream NO3-N Concentration at the Catchment Outlet
Stream water NO3-N concentrations over the study period were significantly less in FD36
compared to RS (p < 0.001, data not shown). Nitrate-N concentration in FD36 ranged from 1.6 to
-4
-3
-2
-1
0
-10
20
50
80
110
140 A
Log Q Air Temperature
-10
20
50
80
110
140
May Nov. May Nov. 2010 2011 2012
May
Time
B FD36 RS
Tem
per
atu
re (
°C)
Lo
g Q
(m
3 s
-1)
Byp
ass
Even
ts (
%)
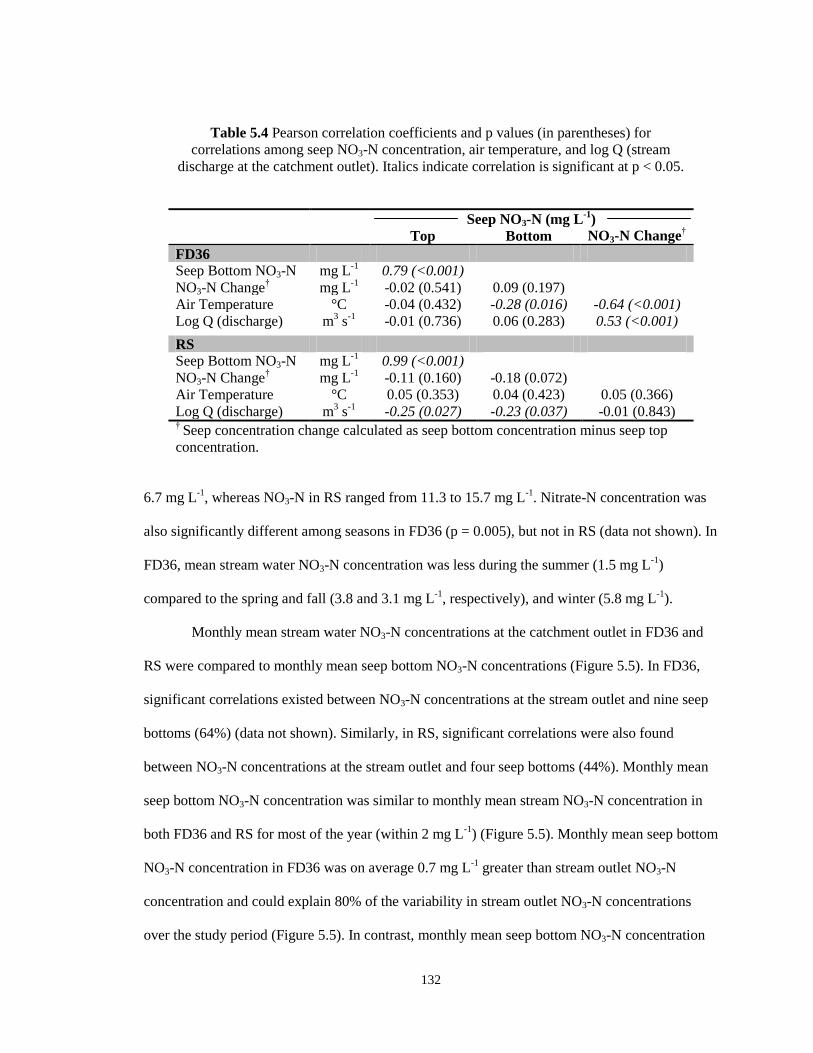
132
Table 5.4 Pearson correlation coefficients and p values (in parentheses) for
correlations among seep NO3-N concentration, air temperature, and log Q (stream
discharge at the catchment outlet). Italics indicate correlation is significant at p < 0.05.
Seep NO3-N (mg L-1
)
Top Bottom NO3-N Change†
FD36
Seep Bottom NO3-N mg L-1
0.79 (<0.001)
NO3-N Change† mg L
-1 -0.02 (0.541) 0.09 (0.197)
Air Temperature °C -0.04 (0.432) -0.28 (0.016) -0.64 (<0.001)
Log Q (discharge) m3 s
-1 -0.01 (0.736) 0.06 (0.283) 0.53 (<0.001)
RS
Seep Bottom NO3-N mg L-1
0.99 (<0.001)
NO3-N Change† mg L
-1 -0.11 (0.160) -0.18 (0.072)
Air Temperature °C 0.05 (0.353) 0.04 (0.423) 0.05 (0.366)
Log Q (discharge) m3 s
-1 -0.25 (0.027) -0.23 (0.037) -0.01 (0.843)
† Seep concentration change calculated as seep bottom concentration minus seep top
concentration.
6.7 mg L-1
, whereas NO3-N in RS ranged from 11.3 to 15.7 mg L-1
. Nitrate-N concentration was
also significantly different among seasons in FD36 (p = 0.005), but not in RS (data not shown). In
FD36, mean stream water NO3-N concentration was less during the summer (1.5 mg L-1
)
compared to the spring and fall (3.8 and 3.1 mg L-1
, respectively), and winter (5.8 mg L-1
).
Monthly mean stream water NO3-N concentrations at the catchment outlet in FD36 and
RS were compared to monthly mean seep bottom NO3-N concentrations (Figure 5.5). In FD36,
significant correlations existed between NO3-N concentrations at the stream outlet and nine seep
bottoms (64%) (data not shown). Similarly, in RS, significant correlations were also found
between NO3-N concentrations at the stream outlet and four seep bottoms (44%). Monthly mean
seep bottom NO3-N concentration was similar to monthly mean stream NO3-N concentration in
both FD36 and RS for most of the year (within 2 mg L-1
) (Figure 5.5). Monthly mean seep bottom
NO3-N concentration in FD36 was on average 0.7 mg L-1
greater than stream outlet NO3-N
concentration and could explain 80% of the variability in stream outlet NO3-N concentrations
over the study period (Figure 5.5). In contrast, monthly mean seep bottom NO3-N concentration
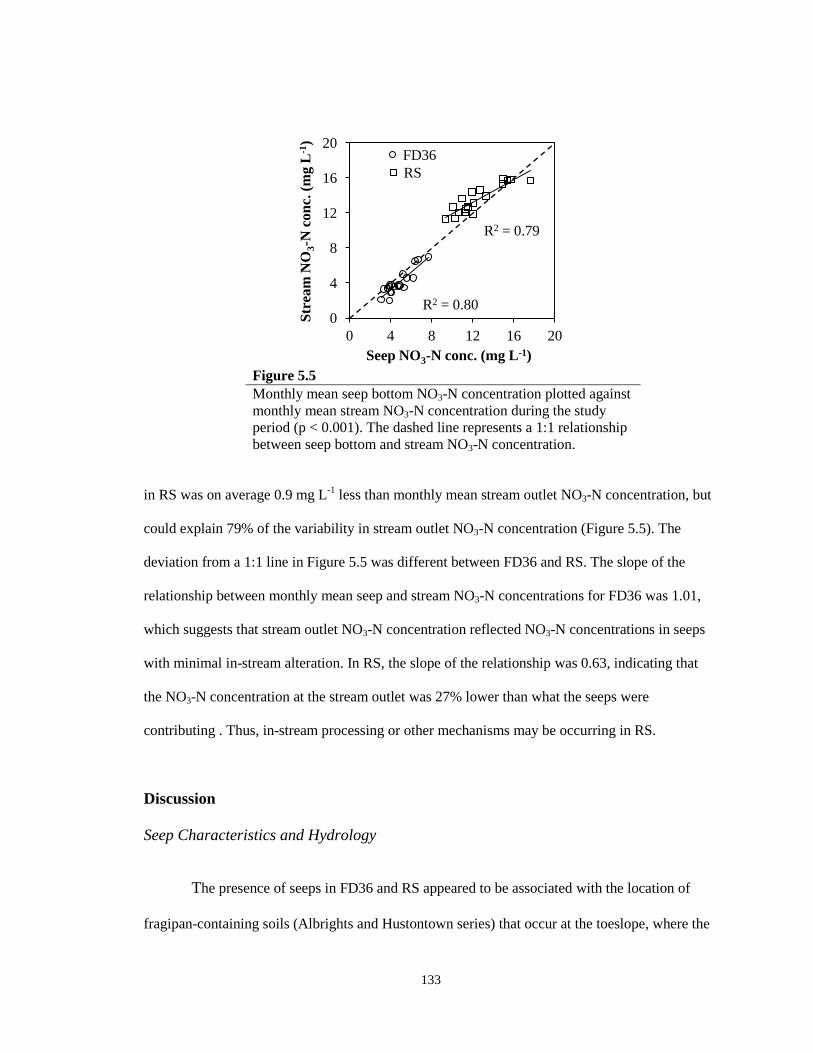
133
Figure 5.5
Monthly mean seep bottom NO3-N concentration plotted against
monthly mean stream NO3-N concentration during the study
period (p < 0.001). The dashed line represents a 1:1 relationship
between seep bottom and stream NO3-N concentration.
in RS was on average 0.9 mg L-1
less than monthly mean stream outlet NO3-N concentration, but
could explain 79% of the variability in stream outlet NO3-N concentration (Figure 5.5). The
deviation from a 1:1 line in Figure 5.5 was different between FD36 and RS. The slope of the
relationship between monthly mean seep and stream NO3-N concentrations for FD36 was 1.01,
which suggests that stream outlet NO3-N concentration reflected NO3-N concentrations in seeps
with minimal in-stream alteration. In RS, the slope of the relationship was 0.63, indicating that
the NO3-N concentration at the stream outlet was 27% lower than what the seeps were
contributing . Thus, in-stream processing or other mechanisms may be occurring in RS.
Discussion
Seep Characteristics and Hydrology
The presence of seeps in FD36 and RS appeared to be associated with the location of
fragipan-containing soils (Albrights and Hustontown series) that occur at the toeslope, where the
0
4
8
12
16
20
0 4 8 12 16 20
Str
eam
NO
3-N
co
nc.
(m
g L
-1)
Seep NO3-N conc. (mg L-1)
R2 = 0.80
R2 = 0.79
FD36
RS
134
uplands transition to the riparian zone. Fragipans have low permeability, often impede the vertical
movement of water (Walter et al., 2000), and have been shown to influence the amount of surface
runoff generation at both hillslope- (Buda et al., 2009) and catchment-scales (Gburek et al.,
2006). However, preferential groundwater upwelling through the fragipan has been found to
contribute 53% to 75% of water to seeps in FD36 (Williams, Chapter 2). In addition, electrical
resistivity imaging (ERI) data from the same sites are also consistent with this interpretation
(Williams, Chapter 3). Other studies have shown that soil-bedrock contacts and bedrock factures
were also possible mechanisms for groundwater upwelling to seeps (O’Driscoll and DeWalle,
2010).
Once upwelling groundwater discharged onto the land surface, there was substantial
variation in seep surface flow paths through the riparian zone in FD36 and RS. In FD36, seep
surface flow paths tended to be diffuse and ill-defined. Surface flow path depths were very
shallow and tended to be spread over a larger wet area compared to flow in small channels or
rivulets; although during high discharge periods (i.e., winter and spring), defined channels were
observed. In contrast, seep surface flow paths in RS were well-defined in small channels from the
seep emergence point to the stream. Seep surface flow paths in RS were also steeper than flow
paths in FD36. Variability in seep surface flow paths between catchments and among seeps can
influence the degree to which seep water interacts with riparian zone soils and vegetation.
Riparian zones with different surface flow patterns can exhibit large differences in NO3-N
removal (Shabaga and Hill, 2010).
Nitrogen Application Rates and Seep NO3-N Concentration
In general, when N application rates exceed crop demands in agricultural landscapes,
NO3-N can leach to groundwater. Many studies have shown a high correlation between
135
agricultural land use and NO3-N concentrations in groundwater (Hallberg and Keeney, 1993;
Ator and Ferrairi, 1997; Harter et al., 2002). For example, Gold et al. (1990) monitored
groundwater NO3-N concentrations under several land uses including forest, residential, and
agriculture. They found that NO3-N concentrations from agricultural landscapes were always
greater than 10 mg L-1
, whereas NO3-N concentrations from forested landscapes were less than 2
mg L-1
. In FD36 and RS, most N applied to agricultural fields is from manure, which can
significantly increase the N content of soil (Paul and Zebarth, 1997). Mineralization of organic-N
from recently applied manure is often a source of NO3-N leaching to groundwater (Hii et al.,
1999) and the water quality effects can persist long after reductions in N loading occur (Carey,
2002). This time lag is related to the mean residence time of groundwater, which at the scale of
FD36 and RS, can be on the order of several months to two years (McGuire et al., 2002; Lindsey
et al., 2003).
Many studies have found relationships between land use and groundwater quality at
larger scales (i.e., forested vs. agricultural catchments), but few studies have shown a link
between field-scale N application rates across a catchment to seep NO3-N concentrations. In this
study we found that as N application rates along groundwater flow paths to seeps increased, seep
NO3-N concentrations also increased (Figure 5.3). The variability in N management across FD36
and RS resulted in seep NO3-N concentrations that ranged from 0.3 to 18.8 mg L-1
, and this
variability imparted longitudinal variations in NO3-N in streams in FD36 and RS (Williams,
Chapter 4). Previous research in FD36 has shown that most groundwater recharge occurs on
upslope soils (Leck Kill, Calvin, and Berks series) that are well drained (Gburek and Folmar,
1999). Therefore, the potential for NO3-N leaching was also greater from these landscape
positions (Pionke et al., 2000). The challenge in connecting N application rates and areas of NO3-
N leaching across the catchment to seep NO3-N concentrations is identifying the groundwater
flow paths from the source of N to the seep discharge point. In this study, we used surface

136
topography to delineate potential groundwater flow paths and assumed that the majority of
recharge, and hence NO3-N leaching, occurred on the upslope soils as opposed to poorly drained
soils closer to the seep discharge locations. Other studies have used the duration of seep flow
(Burns et al., 1998) and bedrock topography (Freer et al., 1997) as potential indicators of
groundwater flow paths to seeps. While the duration of seep flow may provide an estimate on the
size of the area draining to a seep, it provides little information on the location of these areas.
Collecting detailed bedrock topography over an 85 ha area in FD36 and RS with a geophysical
tool, such as ground penetrating radar (GPR), may have also yielded better estimates of
groundwater flow paths compared to using surface topography as a proxy (Freer et al., 1997), but
it was beyond the scope of this study.
NO3-N Retention in Riparian Zone Seeps
Spatial variability in NO3-N retention among seep surface flow paths (-25% to 37%) in
FD36 and RS was similar to NO3-N retention reported along surface flow paths in other studies.
While several studies have shown that seeps retain or remove NO3-N (Brusch and Nillson, 1993;
Burns et al., 1998; O’Driscoll and DeWalle, 2010), others have found no measurable NO3-N
retention (Warwick and Hill, 1988; Hill, 1990) or NO3-N increases (Steinheimer et al., 1998).
The amount of interaction between seep water and groundwater along surface flow paths through
the riparian zone may, in part, elucidate some of the conflicting findings for seep NO3-N retention
from the literature and within FD36 and RS. At one end of the continuum, seep water can be
transported in small rivulets quickly across the riparian zone surface or in shallow pipe networks
that have short water residence times and limited interaction with riparian soils. At the other
extreme are sites with diffuse surface flow where repeated exchanges of water between surface
flow and areas of slower flowing water increase residence times. Research has shown that
137
subsurface residence times on the order of one day are sufficient to achieve significant NO3-N
reductions (e.g., Rutherford and Nguyen, 2004). Therefore, vertical exchange between seep
surface water, soil water, and shallow groundwater along seep flow paths would allow seep water
to spend more time in the subsurface environment and increase the potential for biotic
assimilation of N or denitrification. In FD36, seep surface flow paths were less steep and more
diffuse compared to surface flow paths in RS. Thus, longer residence times along more tortuous
surface flow paths in FD36 likely resulted in seeps retaining more NO3-N compared to RS.
Nitrate-N retention along seep surface flow paths also varied seasonally in FD36 (-3% to
41%) with the greatest amount of retention occurring in the growing season. Retention in FD36
was significantly correlated with both air temperature and stream discharge, which suggests that
hydrological and biogeochemical mechanisms were primarily responsible for downseep NO3-N
concentration changes. While the specific mechanisms for NO3-N retention were not determined
as part this study, we hypothesize that denitrification and vegetative uptake could explain the
seasonal NO3-N concentration declines along seep surface flow paths. During the spring and
summer in FD36, low flows may result in increased interaction between seep water and
groundwater along the surface flow path. In addition, warm air temperatures resulted in increased
growth of grasses and algae along surface flow paths in the riparian zone. Work by Chapman et
al. (1996) points to the importance of increased uptake of NO3-N along surface flow paths as
growth of macrophytes and microflora increases. Indeed, Cooper and Cooke (1984) also showed
that NO3-N retention in the riparian zone was influenced by both vegetative uptake (75%) and
denitrification (25%). In contrast to FD36, while biogeochemical mechanisms undoubtedly affect
seasonal NO3-N retention in RS, faster flows and steeper seep flow paths may not allow sufficient
time for substantial NO3-N removal to occur.
Overall, NO3-N concentrations declined by 16% and 1% from seep top to bottom over
the study period in FD36 and RS, respectively, which suggested that seeps can function as NO3-N

138
sinks at the catchment-scale. Nitrate-N retention along seep surface flow paths in FD36 and RS
(0.8 and 0.2 mg L-1
, respectively) was similar in magnitude to other studies examining seep NO3-
N retention even though NO3-N concentrations were much greater. This suggests that
characteristics of seeps, such as groundwater upwelling and surface flow paths, may restrict or
limit the ability of seeps to remove NO3-N. As a result, NO3-N removal potential in seeps is
substantially less than NO3-N removal potential in shallow groundwater flow paths reported in
the literature. For example, Peterjohn and Correll (1984) found that 90% to 98% of NO3-N was
removed along groundwater flow paths in a deciduous riparian forest. In addition, NO3-N
concentrations in groundwater were decreased by 90% or more when flow paths were sufficiently
long (6 – 176 m) and the riparian aquifer had anaerobic zones and adequate carbon supplies
(Vidon and Hill, 2006). However, since little (if any) NO3-N removal occurs along groundwater
flow paths through the shallow fractured aquifer system in small headwater catchments like FD36
and RS (Pionke and Urban, 1985; Gburek and Folmar, 1999; Lindsey et al., 2003), the riparian
zone is the main area where NO3-N processing can occur before NO3-N is lost to stream water.
Since stream baseflow in headwater catchments is often supplied by seeps, NO3-N processing
along seep surface flow pathways can therefore have a significant effect on stream NO3-N
concentrations (Williams, Chapter 4).
Seep Controls on Catchment-scale NO3-N
Nitrate-N concentrations have been shown to increase downstream in FD36 and RS as a
result of seep inputs to the stream (Williams, Chapter 4). In a previous study, Williams (Chapter
4) found that stream segments (10 m) with seeps increased in NO3-N concentration by 0.25 mg L-
1 during baseflow compared to a 0.02 mg L
-1 decrease in stream water NO3-N concentration when
seeps were not present. In the current study, we found that mean monthly seep bottom NO3-N
139
concentrations were significantly correlated with mean monthly stream NO3-N concentrations at
the catchment outlet of both FD36 and RS, which further suggests that headwater stream NO3-N
concentrations are strongly affected by NO3-N delivery from seep inputs.
Even though seeps comprise a small fraction of the land area in a catchment, seeps
transport agriculturally-influenced water to the stream more rapidly than slower groundwater
flow paths (Srinivasan et al., 2002; Morley et al., 2011). Nitrate-N concentrations at the
catchment outlet in FD36 tended to be less than NO3-N concentrations in seep water indicating
that other flow paths (e.g., shallow groundwater) and processes (e.g., in-channel transformations
and hyporheic exchange) may also influence stream NO3-N concentrations, but to a much lesser
extent than seeps (Scanlon et al., 2010). In contrast, NO3-N concentrations at the catchment outlet
in RS tended to be greater than NO3-N concentrations in seep water. Previous research in RS has
shown that NO3-N concentration in groundwater within RS is the highest of all sub-catchments
that comprise WE-38 (Gburek and Folmar, 1999), indicating that groundwater contributions
directly into the stream channel may also influence stream NO3-N concentration. The effect of
seeps on stream water quality observed in this study has also been shown to occur in other
catchments. O’Driscoll and DeWalle (2010) found that seeps were important for determining
NO3-N fluxes at the catchment outlet of a forested catchment in central Pennsylvania with low
NO3-N concentrations (< 1 mg L-1
). Therefore, regardless of the magnitude of seep NO3-N
concentration, seeps can be one of the primary factors controlling stream water quality in
headwater catchments.
Since surface seep flow paths are a significant source of NO3-N to streams, they also
have the potential to be areas on the landscape where implementation of best management
practices (BMPs) may lead to improvements in stream water quality. In FD36 and RS, both N
management across the catchment and NO3-N retention within seeps were shown to influence
seep delivery to streams. Although the design and implementation of BMPs that increase

140
residence times within seeps in order to promote NO3-N removal is feasible, changes to N
management throughout the catchment, which is the ultimate source of NO3-N to seeps and
streams, may be a better approach. There is currently a suite of BMPs available, such as winter
cover crops, that promote increased crop uptake and decrease the potential for NO3-N leaching
(e.g., Kou et al., 2001). While N management practices within agricultural catchments need to be
assessed on a field by field basis, decreasing NO3-N loss to groundwater through implementation
of BMPs can decrease the amount of NO3-N transported in seep surface flow paths and improve
stream water quality in agricultural headwater catchments.
Conclusions
The objective of this study was to quantify the effects of N management throughout two
agricultural headwater catchments and NO3-N retention within seep surface flow paths on seep
water NO3-N concentrations. In addition, we sought to examine the effect of seeps on stream
water quality at the catchment outlet. Using data from annual farmer surveys in FD36 and RS, we
found that N application rates along groundwater flow paths to seeps were highly correlated with
seep NO3-N concentrations. As the mean annual N application rate along a groundwater flow
path increased, seep NO3-N concentration also increased. Once groundwater discharged from
seeps to surface flow, NO3-N retention along individual seep surface flow paths varied widely
over the study period; however, at the catchment-scale, seeps generally functioned as NO3-N
sinks. We found that NO3-N concentrations decreased by a mean of 16% and 1% from seep top to
seep bottom in FD36 and RS, respectively. Downseep declines in NO3-N concentration were not
due to dilution, but instead appeared to result from retention or transformation within seeps.
Results suggest that during periods of high discharge, seep water will be transported rapidly
across the riparian zone surface, which will result in channelized flow, short water residence

141
times, and limited potential for NO3-N retention. In contrast, when seep discharge is low and air
temperatures are warm (i.e., summer), increased vertical exchange among seep water, soil water,
and groundwater increase water residence times and the potential for vegetative uptake and
denitrification to occur.
Results suggested that seeps in FD36 and RS played a key role in determining N fluxes at
the catchment outlet. We found that surface seeps in FD36 and RS were a significant source of
NO3-N to streams and that both N application rates along groundwater flow paths to seeps and
NO3-N retention within seeps ultimately influenced stream water NO3-N concentrations at the
catchment outlet. Therefore, seeps have the potential to be areas on the landscape where
implementation of BMPs may lead to improvements in stream water quality. Although the design
and implementation of BMPs that increase residence times within seeps in order to promote NO3-
N removal is feasible, changes to N management throughout the catchment, which is the ultimate
source of NO3-N to seeps and streams, may be a better approach. While N management practices
in agricultural catchments need to be assessed at the field-scale, decreasing NO3-N loss to
groundwater through implementation of BMPs can decrease the amount of NO3-N transported in
seep surface flow paths and improve stream water quality in agricultural headwater catchments.
References
Angier, J.T., G.W. McCarty, and K.L. Prestegaard. 2005. Hydrology of a first-order riparian zone
and stream, mid-Atlantic coastal plain, Maryland. J. Hydrol. 309:149-166.
Angier, J.T., G.W. McCarty, C.P. Rice, and K. Bialek. 2002. Influence of a riparian wetland on
nitrate and herbicides exported from a field applied with agrochemicals. Journal of
Agriculture and Food Chemistry. 50:4424-4429.
Ator, S.W., and M.J. Ferrari. 1997. Nitrate and selected pesticides in ground water of the mid-
Atlantic region. U.S. Geological Survey, Water-Resources Investigation Report 97-4139.

142
Blackwell, M.S.A., D.V. Hogan, and E. Maltby. 1999. The use of conveniently and alternatively
located buffer zones for the removal of nitrate from diffuse agricultural run-off. Water
Sci. Technol. 39:157-164.
Boyer, E.W., C.L. Goodale, N.A. Jaworski, and R.W. Howarth. 2002. Anthropogenic nitrogen
sources and relationships to riverine nitrogen export in the northeastern USA.
Biogeochemistry 57:137-169.
Brüsch, W., and B. Nilsson. 1993. Nitrate transformation and water movement in a wetland area.
Hydrobiologia 251: 103-111.
Bryant, R.B., T.L. Veith, G.W. Feyereisen, A.R. Buda, C.D. Church, G.J. Folmar, J.P. Schmidt,
C.J. Dell, and P.J.A. Kleinman. 2011. U.S. Department of Agriculture Agricultural
Research Service Mahantango creek watershed, Pennsylvania, United States:
phsiography and history. Water Resour. Res. 47: DOI: 10.1029/2010WR010056.
Buda, A.R., P.J.A. Kleinman, M.S. Srinivasan, R.B. Bryant, and G.W. Feyereisen. 2009. Factors
influencing surface runoff generation from two agricultural hillslopes in central
Pennsylvania. Hydrol. Process. 23:1295-1312.
Buda, A.R., T.L. Veith, G.J. Folmar, G.W. Feyereisen, R.B. Bryant, C.D. Church, J.P. Schmidt,
C.J. Dell, and P.J.A. Kleinman. 2011. U.S. Department of Agriculture Agricultural
Research Service Manhantango creek watershed, Pennsylvania, United States: long-term
precipitation database. Water Resour. Res. 47: DOI: 10.1029/2010WR010058.
Burns, D.A., P.S. Murdoch, G.B. Lawrence, and R.L. Michel. 1998. Effect of ground water
springs on NO3- concentration during summer in Catskill Mountain streams. Water
Resour. Res. 34:1987-1996.
Carey, B.M. 2002. Effects of land application of manure on ground water at two dairies over the
Sumas-Blaine surficial aquifer. Washington Department of Ecology, Publication No. 02-
03-007.
Chapman, P.J., B. Reynolds, and H.S. Wheater. 1996. Experimental investigation of potassium
and nitrate dynamics in a headwater stream in mid-Wales. Chem. Ecol. 13:1-19.
Cooper, A.B., and J.G. Cooke. 1984. Nitrate loss and transformation in 2 vegetated headwater
streams. N. Z. J. Mar. Freshwater Res. 18:441-450.
Freer, J., J. McDonnell, K.J. Beven, D. Brammer, D. Burns, R.P. Hooper, and C. Kendal. 1997.
Topographic controls on subsurface stormflow at the hillslope-scale for two
hydrologically distinct small catchments. Hydrol. Process. 11:1147-1352.
Gburek, W.J., A.N. Sharpley, and H.B. Pionke. 1996. Identification of critical source areas for
phosphorus export from agricultural catchments. In: Advances in hillslope processes.
M.G. Anderson and S.M. Brooks (Editors) Vol. 1. John Wiley and Sons, New York, NY,
pp. 263-282.
143
Gburek, W.J., and G.J. Folmar. 1999. Patterns of contaminant transport in a layered fractured
aquifer. J. Contam. Hydrol. 37:87-109.
Gburek, W.J., B.A. Needelman, M.S. Srinivasan. 2006. Fragipan controls on runoff generation:
hydropedological implications at landscape and watershed scales. Geoderma 131:330-
344.
Gold, A.J., P.M. Groffman, K. Addy, D.Q. Kellogg, M. Stolt, and A.E. Rosenblatt. 2001.
Landscape attributes as controls on groundwater nitrate removal capacity of riparian
zones. J. Am. Water Res. Assoc. 37:1457-1464.
Hallberg, G.R., and D.R. Keeney. 1993. Nitrate. In: Regional ground-water quality. W.M. Alley
(Editor). U.S. Geological Survey, Van Nostrand Reinhold, New York, NY, pp 297-321.
Harter, T., H. Davis, M. Mathews, and R. Meyer. 2002. Shallow groundwater quality on dairy
farms with irrigated forage crops. J. Contamin. Hydrol. 55:287-315.
Hii, B., H. Liebscher, M. Mazalek, and T. Tuominen. 1999. Ground water quality and flow rates
in the Abbotsford aquifer, British Columbia. Environmental Canada, Vancouver, B.C.
Hill, A.R. 1990. Groundwater flow paths in relation to nitrogen chemistry in the near-stream
zone. Hydrobiologia 206:39-52.
Howarth, R.W., G. Billen, D. Swaney, A. Townsend, N. Jaworski, K. Lajtha, J.A. Downing, R.
Elmgren, N. Caraco, T. Jordan, F. Berendse, J. Freney, V. Kudeyarov, P. Murdoch, and
Z. Zhao-Liang. 1996. Regional nitrogen budgets and riverine N and P fluxes for the
drainages to the North Atlantic Ocean: natural and human influences. Biogeochemistry
35:75-139.
Kou, S., B. Huang, and R. Bembenek. 2001. Effect of winter cover crops on soil nitrogen
availability, corn yield, and nitrate leaching. Sci. World J. 2:22-29.
Lindsey, B.D., S.W. Phillips, C.A. Donnelly, G.K. Speiran, L.N. Plummer, J.K. Bohlke, M.J.
Focazio, W.C. Burton, and E. Busenberg. 2003. Residence times and nitrate transport in
groundwater discharging to streams in the Chesapeake Bay watershed. U.S. Geological
Survey Water Resources Investigations Report 03-4035.
McClain, M.E., E.W. Boyer. C.L. Dent, S.E. Gergel, N.B. Grimm, P.M. Groffman, S.C. Hart,
J.W. Harvey, C.A. Johnson, E. Mayorga, W.H. McDowell, and G. Pinay. 2003.
Biogeochemical hotspots and hot moments at the interface of terrestrial and aquatic
ecosystems. Ecosystems 6:301-312.
McGuire, K.J., D.R. DeWalle, and W.J. Gburek. 2002. Evaluation of mean residence time in
subsurface waters using oxygen-18 fluctuations during drought conditions in the mid-
Appalachians. J. Hydrol. 261:132-149.
Morley, T.R., A.S. Reeve, and A.J.K Calhoun. 2011. The role of headwater wetlands in altering
streamflow and chemistry in a Maine, USA catchment. J. Am. Water. Resour. Assoc.
47:337-349.

144
Needlelman, B.A. 2002. Surface runoff hydrology and phosphorus transport along two
agricultural hillslopes with contrasting soils. Ph.D. Thesis. The Pennsylvania State
University, University Park, PA.
O’Driscoll, M.A., and D.R. DeWalle. 2010. Seeps regulate stream nitrate concentration in
forested Appalachian catchments. J. Environ. Qual. 39:420-431.
Patton, C.J., and J.R. Kryskalla. 2003. Methods of analysis by the U.S. Geological Survey
National Water Quality Laboratory: evaluation of alkaline persulfate digestion as an
alternative to Kjeldahl digestion for determination of total dissolved nitrogen and
phosphorus in water. U.S. Geological Survey water resources investigations report 03-
4174, 33 p.
Paul, J.W., and B.J. Zebarth. 1997. Denitrification and nitrate leaching during the fall and winter
following dairy cattle slurry application. Canadian J. Soil Sci. 77:231-240.
Peterjohn, W.T., and D.L. Correll. 1984. Nutrient dynamics in an agricultural watershed:
observations on the role of a riparian forest. Ecology 65:1466-1475.
Pionke, H.B., and J.B. Urban. 1985. Effect of agriculture land use on ground-water quality in a
small Pennsylvania watershed. Groundwater. 23:68-80.
Pionke, H.B., J.R. Hoover, R.R. Schnabel, W.J. Gburek, J.B. Urban, and A.S. Rogowski. 1988.
Chemical-hydrologic interactions in the near-stream zone. Water Resour. Res. 24:1101-
1110.
Pionke, H.B., W.J. Gburek, and A.N. Sharpley. 2000. Critical source area controls on water
quality in an agricultural watershed located in the Chesapeake basin. Ecol. Eng. 14:325-
335.
Pionke, H.B., W.J. Gburek, and R.R. Schnabel. 1996. Flow and nutrient transport patterns for an
agricultural hill-land watershed. Water Resour. Res. 32:1795-1804.
R Development Core Team. 2011. R: a language and environment for statistical computing. R
Foundation for Statistical Computing, Vienna, Austria.
Rutherford, J.C., and M.L. Nguyen. 2004. Nitrate removal in riparian wetlands: interactions
between surface flow and soils. J. Environ. Qual. 33:1133-1143.
Scanlon, T.M., S.M. Ingram, and A.L. Riscassi. 2010. Terrestrial and in-stream influences on the
spatial variability of nitrate in a forested headwater catchment. J. Geophysic. Res. 115:
doi: 10.1029/2009JG001091.
Shabaga, J.A., and A.R. Hill. 2010. Groundwater-fed surface flow path hydrodynamics and
nitrate removal in three riparian zones in southern Ontario, Canada. J. Hydrol. 388:52-64.
Sharpley, A.N., J.J. Meisinger, A. Breeuswma, J.T. Sims, T.C. Daniel, and J.S. Schepers. 1998.
Impacts of animal manure management on groundwater and surface water quality. In:

145
Animal manure management: effective use of manure as a soil resource. J.L. Hatfield and
B.A. Stewart (Editors) CRC Press LLC, Boca Raton, FL, pp. 173-230.
Srinivasan, M.S., W.J. Gburek, and J.M. Hamlett. 2002. Dynamics of stormflow generation - a
hillslope-scale field study in east-central Pennsylvania, USA. Hydrol. Process. 16:649-
665.
Steinheimer, T.R., K.D. Scoggin, and L.A. Kramer. 1998. Agricultural chemical movement
through a field-size watershed in Iowa: surface hydrology and nitrate losses in discharge.
Environ. Sci. Technol. 32:1048-1052.
Vidon, P.G.F., and A.R. Hill. 2006. A landscape-based approach to estimate riparian hydrological
and nitrate removal functions. J. Am. Water Resour. Assoc. 42:1099-1112.
Walter, M.T., M.F. Walter, E.S. Brooks, T.S. Steenhuis, J. Boll, and K. Weiler. 2000.
Hydrologically sensitive areas: variable source area hydrology implications for water
quality assessment. J. Soil Water Conserv. 3:277-284.
Warwick, J., and A.R. Hill. 1988. Nitrate depletion in the riparian zone of a small woodland
stream. Hydrobiologia 157:231-240.
West, A.J., S.E. Findlay, D.A. Burns, K.C. Weathers, and C.M. Lovett. 2001. Catchment-scale
variation in the nitrate concentration of groundwater seeps in the Catskill Mountains,
New York, USA. Water Air Soil Poll. 132:389-400.
Zhu, Q., J.P. Schmidt, and R.B. Bryant. 2011. Hot moments and hot spots of nutrient losses from
a mixed land use watershed. J. Hydrol. 414:393-404.
146
CHAPTER 6
Nitrogen Transport in Riparian Zone Seeps: Conclusions and Future
Research
Excess nitrogen (N) in terrestrial and aquatic ecosystems has resulted in numerous water
quality problems throughout the U.S. and across the world, which emphasizes the need to develop
effective management plans to deal with N pollution. Previous research has identified emergent
groundwater-fed seeps as a potentially significant source of water and N, especially nitrate-N
(NO3-N), to streams in headwater catchments, yet few studies have evaluated NO3-N transport in
seeps and their influence on stream water quality. The four studies in this dissertation evaluated
seep zone formation, hydrology, and biogeochemistry in order to gain an improved understanding
of NO3-N transport in seeps and their effects on stream water quality in two small headwater
agricultural catchments (FD36 and RS) located in central Pennsylvania. The major findings and
conclusions from the four studies are summarized in this final chapter and future research needs
are addressed. In addition, the results from the four studies are used to evaluate the potential
effectiveness of several management practices aimed at improving water quality in agricultural
headwater catchments with seeps.
Summary of Major Findings and Conclusions
The objective of the first study, chapter two, was to compare hydrological processes and
NO3-N transport in seep areas to adjacent areas of the riparian zone without seeps (i.e., non-seep
areas). Using an extensive network of nested piezometers at three paired study sites in FD36, we

147
found that seep areas had a greater NO3-N transport potential than non-seep areas. Spatial
patterns in water table depth indicated that groundwater flow paths in non-seep areas were
dominated by uniform, lateral flow through the subsurface. Lateral subsurface flow is
characterized by longer residence times in which groundwater can interact with riparian soils and
vegetation, which promote NO3-N removal and uptake. In contrast, water table depth in the seep
areas was highly variable with some regions having positive vertical gradients (e.g. groundwater
upwelling), which suggested that preferential flow was an important flow pathway for
groundwater in seep areas. Preferential flow paths can limit NO3-N removal because groundwater
typically has a shorter residence time within the subsurface. A two-component mixing model also
showed that the groundwater in seep and non-seep areas were from different sources. Water in
seep areas was primarily (53% – 75%) from a shallow fractured aquifer (6-m deep monitoring
wells), whereas, the water in non-seep areas was primarily (58% – 82%) from perched water on
top of the fragipan (1-m deep monitoring well). The upwelling of groundwater from the shallow
fractured aquifer in seep areas, which had high NO3-N concentrations relative to water perched
on top of the fragipan, resulted in seep areas with significantly greater NO3-N concentrations
compared to non-seep areas. Thus, seep areas were shown to be a potentially significant source of
NO3-N to the stream in FD36.
The results of chapter two provided compelling evidence for varying hydrology and NO3-
N transport potential between seep and non-seep areas of the riparian zone. Chapter three built
upon these results by using electrical resistivity imaging (ERI) to visualize subsurface hydrologic
processes in a seep and non-seep area over a series of precipitation events. Results showed that
the seep area of the riparian zone in FD36 was much more complex in terms of hydrology and N
transport compared to the non-seep area. In the seep area, preferential flow paths through the
fragipan served as a location to discharge groundwater to the surface. Upwelling groundwater in
these localized regions created an area of the riparian zone that was extremely hydrologically
148
dynamic. For example, in the seep area, only a small amount of precipitation (41 mm) was
required to activate groundwater flow. While the size of the saturated area and the amount of
water table rise likely depend on the storm event duration and intensity, the seep area will remain
active until another storm event or series of storm events continues to expand the seep area or the
groundwater drains to the stream during dry conditions. We found that as the seep area became
active, the NO3-N transport potential was high due to groundwater and NO3-N bypassing the
remedial benefits of the riparian zone via preferential flow paths. At saturation, however,
groundwater flow in the seep area was found to be a mixture of sources (groundwater from the
shallow fractured aquifer and water perched on top of the fragipan), which resulted in the dilution
of NO3-N concentration. In contrast to the seep area, results from the non-seep area showed that it
remained hydrologically inactive for substantial periods of time and required a large amount of
precipitation (141 mm) to activate. The potential for the non-seep area to deliver NO3-N to the
stream was low since it was disconnected from the high NO3-N source (i.e., shallow fractured
aquifer) and groundwater likely had increased interaction with riparian soils as it moved laterally
toward the stream.
The purpose of the third study, chapter four, was to determine if the potential for NO3-N
delivery from seeps that was observed in the previous two studies, chapters two and three, was
transferred into measurable effects on stream water quality. We found that while the magnitude of
seep water NO3-N concentration varied between FD36 and RS and among individual seeps in
both catchments, seep discharge resulted in an increase in stream water NO3-N concentration.
Results showed that stream water NO3-N concentration increased by 0.25 mg L-1
over a 10 m
reach when seeps were present compared to a decrease of 0.02 mg L-1
when no seeps were
present. The influence of seeps on stream NO3-N concentration was further reflected in
longitudinal patterns of stream water NO3-N in FD36 and RS. We found that as the number of
seeps increased, the amount of longitudinal variability (i.e., patchiness) in stream water NO3-N

149
concentration increased. Results also showed that the influence of seeps on stream water NO3-N
concentration and variability decreased immediately following precipitation events compared to
baseflow. This was likely due to increased stream discharge and rainfall directly into the stream
channel, which decreased the relative contributions of seep water to streamflow and homogenized
NO3-N concentrations over the entire reach. As stream discharge drained back to baseflow,
however, the influence of seeps on stream water quality likely reached a maximum, as the
number of seeps discharging groundwater into the stream was at its peak. Thus, the results of this
study showed that in FD36 and RS, seeps were a significant source of NO3-N to the stream and
played a substantial role in determining N fluxes from these catchments during both baseflow and
stormflow conditions.
Chapter five, the final study, was completed in order to determine what factors influenced
seep NO3-N delivery to streams and how seeps contributed to NO3-N fluxes at the catchment
outlet. Results showed that N application rates along groundwater flow paths to seeps were
significantly correlated to seep top (i.e., emergence point) NO3-N concentration. We found that as
the mean N application along the groundwater flow path to a seep increased, seep top NO3-N
concentration increased. We also found that N retention within seeps influenced seep NO3-N
delivery to streams. Nitrate-N concentration in seep surface flow paths decreased downseep (i.e.,
seep top to seep bottom) by 0.8 (16%) and 0.2 (1%) mg L-1
in FD36 and RS, respectively;
although NO3-N retention varied seasonally (-3% to 41%) in FD36. The seasonal variability in
seep NO3-N retention in FD36 was found to be related to both stream discharge and air
temperature, suggesting that both hydrological and biogeochemical processes affected NO3-N
retention within seeps. At the catchment-scale, mean seep bottom NO3-N concentration was
significantly correlated to stream NO3-N concentration at the stream outlet in both FD36 and RS.
Seeps accounted for 80% and 79% of the variability in stream NO3-N concentration in FD36 and
RS, respectively. The results of this study suggested that while some NO3-N retention occurred

150
within seep surface flow paths, the primary factor controlling NO3-N delivery from seeps to
streams and ultimately NO3-N concentrations at the catchment outlet was N management
throughout the catchment. Thus, in agricultural catchments with seeps, adjusting management
practices in order to decrease the probability of NO3-N leaching has the potential to decrease
NO3-N concentrations in seeps and improve stream water quality.
Potential Effectiveness of BMPs in Agricultural Catchments with Seeps
Manure and Fertilizer N Management
N Application Rate
The results from Williams (Chapter 5) suggest that NO3-N concentrations in seep water
were significantly correlated to the N application rate along the groundwater flow path draining to
the seep. Therefore, one way to decrease NO3-N concentrations in seep water is to decrease the
amount of N applied across the landscape. Indeed, many studies have reported that elevated N
application rates increase the potential for NO3-N leaching (Zvomuya et al., 2003; Guo et al.,
2006). The potential effectiveness of decreasing N application rates was also demonstrated in
chapter 5 where areas of FD36 and RS receiving little or no N application had seep NO3-N
concentrations that were very low. Similarly, in a study by O’Driscoll and DeWalle (2010), a
forested catchment with no N inputs had seeps with NO3-N concentrations that were often less
than 1 mg L-1
. Nitrogen inputs are essential for crop growth in agricultural catchments, but
reducing the N application rate may produce a significant change in stream water quality. For
example, the mean N application rate in FD36 and RS was 133 and 200 kg ha-1
, respectively, and
mean sep NO3-N concentrations were 4.7 and 13.4 mg L-1
. Thus, a 35% reduction in N
application rate in RS (200 to 133 kg ha-1
) could result in a potential decrease of 65% in the mean
seep NO3-N concentration. Reductions in N application rate have the potential to be one of the
151
most effective BMPs in agricultural catchments because it is targeting the source of N. While
farmers may be hesitant to reduce N application rates for fear that crop yield will decline, altering
the timing and method of N application may also decrease the potential for NO3-N leaching
(Power and Schepers, 1989).
Timing of N Application
In order to decrease the risk of NO3-N leaching, the timing of N application should
coincide with crop N demand. Therefore, spring application of N is typically recommended
because the N is available when the crops need it for growth. In FD36 and RS (and in many other
catchments), manure and fertilizer is applied during both the spring and fall. Most of the N in
FD36 and RS is lost during the non-growing season (Zhu et al., 2011; Williams, Chapters 4 and
5), which indicates that N application in the fall may be a significant source of N to seeps. Several
studies have shown that fall application can lead to excess NO3-N leaching (Cookson et al., 2002;
Gupta et al., 2004). In a soil column study, Williams et al. (2012) found that the timing of manure
application in the fall determined the amount of NO3-N lost in leachate. The authors showed that
when manure was applied at soil temperatures greater than 10°C in the early-fall, the potential for
NO3-N leaching is significantly increased compared to when the soil temperature is less than
10°C. Thus, altering the timing of manure application in the fall could decrease the potential for
NO3-N leaching and ultimately seep NO3-N concentrations.
In the spring, splitting N applications and applying N in phase with crop demand may
also minimize the risk for NO3-N leaching (Power et al., 1998). Split applications with pre-
sidedress nitrogen tests (PSNT) have been shown to increase N use efficiency (Musser et al.,
1995). While it is not practical for farmers to split manure applications, lower pre-planting
manure application rates could be used with supplemental sidedress mineral fertilizer as
152
determined by PSNT. Thus, this practice would provide as much N to the crop with less total N
applied.
Method of N Application
The potential for NO3-N leaching and ultimately NO3-N delivery to seeps may also be
influenced by the method of N application (i.e., surface vs. subsurface). Incorporation
technologies, such as shallow disk injection, often reduce volatile N losses, but leave large pools
of ammonium-N (NH4-N) in the soil, which can nitrify and potentially leach if not taken up by
the crop (Dell et al., 2012). However, there have only been a few studies that have compared
NO3-N leaching losses following surface and subsurface N application. Misselbrook et al. (1996)
did not find any significant differences between surface application and shallow knife injection of
cattle slurry. Similarly, no differences in NO3-N leaching were found after shallow injection and
surface band application of liquid swine manure (Weslien et al., 1998). However, while Powell et
al. (2011) found that NO3-N leaching losses were similar with shallow shank injection and
surface broadcasting, manure incorporation with an aerator increased leaching relative to both.
The results from these studies suggest that the method of N application may be less important in
terms of the potential for NO3-N leaching compared to the application rate and timing of
application.
Soil Management
Tillage
In FD36 and RS, the majority of farmers practice no-till farming. Several studies have
shown that differences in tillage (no-till vs. conventional tillage) may play a role in the potential
for NO3-N leaching. Conventional tillage has been shown to lead to elevated oxidation of soil

153
organic matter and mineralization of soil N compared to no-till systems (Randall et al., 1997).
However, conventional tillage could lead to less NO3-N leaching compared to no-till (Kanwar et
al., 1993; Weed et al., 1996). In no-till systems, large soil macropores can form and increase the
risk NO3-N leaching (Di and Cameron, 2002). In contrast, Rasmussen (1999) found that NO3-N
leaching increased with more intensive cultivation (i.e., conventional tillage). While, the results
from these studies are inconsistent, altering the type of tillage could influence the potential for
NO3-N leaching depending on the soil type and climate.
Crop Management
Cover Crops
Growing cover crops, such as rye or oats, is another BMP that has been successful in
reducing the risk of NO3-N leaching. As mentioned previously, most of the N loss in FD36 and
RS occurs during the non-growing season. However, most of the fields are left fallow during this
time. Cover crops planted immediately after harvest or double cropped can take up excess N
remaining in the soil before the winter when the majority of NO3-N loss occurs. Studies have
shown that planting cover crops can reduce NO3-N leaching over the winter (Shrestha and Ladha,
1998) and even reduce the potential for NO3-N leaching from the next crop (Delgado et al.,
2001). For example, planting ryegrass in November reduced NO3-N leaching by 1.4 to 4.3 g N m-
2 yr
-1, but did not affect grain yield the following year (Thomsen, 2005). Similarly, wheat, rye,
and rapeseed planted after sweet corn and incorporated in the spring had a positive effect on the
subsequent potato crop and reduced NO3-N leaching over the winter (Weinert et al., 2002). Thus,
cover crops could be incorporated into the crop rotations in FD36 and RS (and other catchments)
in order to reduce NO3-N leaching and potentially decrease seep NO3-N concentrations.

154
Diversified Crop Rotations
In addition to cover crops, maintaining a diversified crop rotation can help retain N in the
soil and decrease the risk of NO3-N leaching. Several studies have shown that differences in
residue, rooting depths, and soil-plant-water dynamics among various plant species can influence
NO3-N leaching potential (Randall et al., 1997; Malpassi et al., 2000). For example, including
alfalfa in a rotation has been shown to be effective in reducing NO3-N leaching because of its
deep rooting depth and high water usage (Owens, 1987). Diversified crop rotations also have been
shown to reduce N application rates over the course of a rotation compared to continuous corn (Ju
et al., 2007). Indeed, including N-fixing legumes in a crop rotation can provide a gradual release
of N into the soil that is often better synchronized with subsequent plant needs compared to single
applications of fertilizer or manure.
Edge of Stream Management
Riparian Zones
The establishment and conservation of riparian zones can provide many environmental
benefits in agricultural headwater catchments, such as increased wildlife habitat and decreased
stream water temperatures (e.g., Hill, 1996; Cirmo and McDonnell, 1997). Research has also
shown that riparian zones can decrease nutrient concentrations entering the stream by greater than
90% (e.g., Peterjohn and Correll, 1984). Results from this dissertation, however, suggest that in
catchments with seeps, riparian zones may not be an effective management practice to decrease
NO3-N delivery to the stream. Water and NO3-N in seep discharge often flow in surface
pathways. Rapid transport of water and NO3-N through the riparian zone was therefore
commonly observed in FD36 and RS. The results from chapter five indicate that NO3-N removal
in seep surface flow paths through the riparian zone in FD36 and RS was minimal. Riparian
155
zones are also established or conserved over an entire stream reach, whereas seeps only represent
small areas on the landscape. Thus, riparian zones do not specifically target areas on the
landscape, like seeps, for nutrient removal.
In FD36 and RS, riparian zones were not effective at removing NO3-N in seep surface
flow paths; however, altering the riparian zone characteristics has the potential to increase their
effectiveness. For example, in FD36 and RS, the riparian zone often did not extend to the seep top
(i.e., groundwater emergence point). Portions of many seep surface flow paths as a result were
actively farmed (e.g., received nutrient applications, planted with crops, etc). Increasing the width
of the riparian zone to include the entire flow path has the potential to increase the NO3-N
removal potential.
Bioreactors
Bioreactors are designed to remove NO3-N in water by increasing the amount of
denitrification (e.g., Janes et al., 2008). Bioreactors have been successfully used in catchments
with tile drainage, where wood-chips, peat, pine bark, and almond and walnut shells are used as a
carbon source in a bioreactor that is installed at the outlet of the tile drain (e.g., Blowes et al.,
1994). Water and NO3-N from the tile drain is then routed through the bioreactor, which
promotes NO3-N removal, prior to the water entering the stream channel. Seeps in ways are
similar to tile drains, in that they drain areas of a catchment to a single point on the landscape
where water and NO3-N are delivered directly to the stream channel. Thus, bioreactors have the
potential to target seep areas on the landscape similar to tile drains. To our knowledge, however,
the use of bioreactors to mitigate NO3-N concentrations in seep discharge has not been done
previously.

156
If the location of a seep upwelling location was known, like in FD36 and RS, a bioreactor
could be installed at this location. The upwelling groundwater, which is high in NO3-N
concentration, would pass through the wood chips on its way to the surface and NO3-N would be
removed via denitrification. The downside of using a bioreactor is that they can be expensive to
implement and require some maintenance in order to function properly. In addition, in catchments
like FD36 and RS, it is highly unlikely that a bioreactor could be installed at all seep locations.
However, the seeps with the highest NO3-N concentrations could be targeted in order to have the
largest impact on stream water quality.
Future Research
Results from this dissertation have shown that seeps are an important source of N,
especially NO3-N, to agricultural headwater streams. Seeps also play a large role in determining
N fluxes at the catchment outlet. The complexity of seep formation, hydrology, and
biogeochemistry described in FD36 and RS has lead to further questions on seeps and their
influence stream water quality. In this section, the need for future research on seeps is discussed.
The top priority and most challenging need is the development of new methods to
identify the locations of groundwater-fed seeps or zones of seepage. Currently the only accurate
method for determining the location of a seep is to walk the entire length of a stream under wet
conditions. Surface topography can also been used to identify possible locations of seeps (e.g.,
concave landscape positions), but seeps occurred at a variety of landscape positions in FD36 and
RS. In order to asses the impact of seeps at larger scales, we need a better way of not only
determining how many seeps are likely to be found within a catchment, but also the location of
the seeps in relation to different land management practices. In addition to identifying where
seeps occur, more research is needed on seep discharge. Several research questions include 1)
157
under what conditions (i.e., antecedent soil moisture, rainfall depths, seasons, etc.) are seeps
contributing groundwater to streams?; 2) how long does seepage continue after a storm event?;
and 3) how do changes in seep discharge influence N concentration? Results from this
dissertation suggest that there is a time lag between a storm event and seep response; therefore,
more detailed sampling over several storm events is needed in order to better understand seep
formation and hydrology.
More research is also needed on N transport with seep surface flow paths. We found that
NO3-N is removed along seep surface flow paths, but did not isolate the specific mechanisms
responsible for the removal. Both denitrification and vegetative uptake are likely removal
mechanisms along seep surface flow paths. In order to design BMPs that enhance the NO3-N
removal potential in the riparian zone, we need to understand the N cycling and biogeochemistry
along seep flow paths. Several studies have shown that residence time is an important factor in
determining the amount of NO3-N removal. Thus, more research is needed on residence times of
water and NO3-N along seep surface flow paths.
References
Blowes, D.W., W.D. Robertson, C.J. Ptacek, and C. Merkley. 1994. Removal of agricultural
nitrate from tile drain effluent using in line bioreactors. J. Contam. Hydrol. 15:207-221.
Cirmo, C.P., and J.J. McDonnell. 1997. Linking the hydrologic and biogeochemical controls of
nitrogen transport in near-stream zones of temperate-forested catchments: a review. J.
Hydrol. 199:88-120.
Cookson, W.R., I.S. Cookson, and J.S. Rowarth. 2002. Winter soil temperature (2-15C) effects on
nitrogen transformations in clover green manure amended or unamended soils: a
laboratory and field study. Soil Biol. Biochem. 34:1401-1415.
Delagado, A. 2001. Potential use of innovative nutrient management alternatives to increase
nutrient use efficiency, reduce losses, and protect soil and water quality. J.
Communication Soil Sci. Plant Analysis. New York: Marcel Dekker Inc.
158
Dell, C.J., P.J.A. Kleinman, J.P. Schmidt, and D.B. Beegle. 2012. Low-disturbance manure
incorporation effects on ammonia and nitrate loss. J. Environ. Qual. 41:928-937.
Di, H.J., and K.C. Cameron. 2002. Nitrate leaching in temperate agroecosystems: sources,
factors, and mitigating strategies. Nutrient Cycling in Agroecosystems 46:237-256.
Guo, Y., H. Li, Y. Zhang, X. Zhang, and A. Lu. 2006. Effects of water table and fertilization
management on nitrogen loading to groundwater. Ag. Water Manag. 82:86-98.
Gupta, S.C., E. Munyankusi, J.F. Moncrief, F. Zvomuya, and M. Hanewall. 2004. Tillage and
manure application effects on mineral nitrogen leaching from seasonally frozen soils. J.
Environ. Qual. 33:1238-1246.
Hill, A.R. 1996. Nitrate removal in stream riparian zones. J. Environ. Qual. 25: 743-755.
Janes, D.B., T.C. Kapar, T.B. Moorman, and T.B. Parkin. 2008. In situ bioreactors and deep
drain-pipe installation to reduce nitrate loss in artificially drained fields. J. Environ. Qual.
37:429-436.
Ju, T., Q. Gao, P. Christie, and S. Zhang. 2007. Changes in soil environment from excessive
application of fertilizers and manures to two contrasting intensive cropping systems on
the North China Plain. Environ. Pollut. 146:534-542.
Kanwar, S., E. Stolenberg, R. Pfeiffer, L. Karlen, S. Colvin, and W. Simpkins. 1993. Transport of
nitrate and pesticides to shallow groundwater systems as affected by tillage and crop
rotation practices. pp. 270-273. In Proceedings of the Conference, Feb. 21-24,
Minneapolis, MN, USA. ISBN 10 0935734341.
Malpassi, N., C. Kasper, B. Parkin, A. Cambardella, and A. Nubel. 2000. Oat and rye root
decomposition effects on nitrogen mineralization. Soil Sci. Soc. Am. J. 64:208-215.
Misselbrook, T.H., J.A. Laws, and B.F. Pain. 1996. Surface application and shallow injection of
cattle slurry on grassland: nitrogen losses, herbage yields and nitrogen recoveries. Grass
Forage Sci. 51:51-57.
O’Driscoll, M.A., and D.R. DeWalle. 2010. Seeps regulate stream nitrate concentration in
forested Appalachian catchments. J. Environ. Qual. 39:420-431.
Owens, B. 1987. Nitrate leaching losses from monolith lysimeters as influenced by nitrapyrin. J.
Environ. Qual. 16:34-38.
Peterjohn, W.T., and D.L. Correll. 1984. Nutrient dynamics in an agricultural watershed:
observations on the role of a riparian forest. Ecology 65:1466-1475.
Powell, J.M., W.E. Jokela, and T.H. Misselbrook. 2011. Dairy slurry application method impacts
ammonia emission and nitrate leaching in no-till corn silage. J. Environ. Qual. 40:383-
392.
159
Power, F., and S. Schepers. 1998. Nitrate contamination of groundwater in North America. Ag.
Ecosyst. Environ. 26:165-187.
Randall, W., R. Huggins, P. Russell, J. Fuchs, W. Nelson, and L. Anderson. 1997. Nitate losses
through subsurface tile drainage in conservation reserve program, alfalfa, and row crop
systems. J. Environ. Qual. 26:1240-1247.
Rasmussen, J. 1999. Impact of ploughless soil tillage on yield and soil quality: a Scandinavian
review. Soil Till. Res. 53:3-14.
Shrestha, K., and K. Ladha. 1998. Nitrate in groundwater and integration of nitrogen-catch crop
in rice-sweet pepper cropping system. Soil Sci. Soc. Am. J. 62:1610-1619.
Thomsen, K. 2005. Nitrate leaching under spring barley is influenced by the presence of a
ryegrass catch crop: results from a lysimeter experiment. Ag. Ecosyst. Environ. 111:21-
29.
Weed, J. and S. Kanwar. 1996. Nitrate and water present in and flowing from root-zone soil. J.
Environ. Qual. 25:709-719.
Weinert, L., L. Pan, R. Moneymaker, S. Santo, and G. Stevens. 2002. Nitrogen recycling of
nonleguminous winter cover crops to reduce leaching in potato rotations. Agronomy J.
94:365-372.
Weslien, P.L., L. Klemedtsson, L. Svensson, B. Galle, A. Kasimir-Klemedtsson, and A.
Gustafson. 1998. Nitrogen losses following application of pig slurry to arable land. Soil
Use Manage. 14:200-208.
Williams, M.R., G.W. Feyereisen, D.B. Beegle, and R.D. Shannon. 2012. Soil temperature
regulates nitrogen loss from lysimeters following fall and winter manure application. T.
ASABE 55: 861-870.
Zhu, Q., J.P. Schmidt, and R.B. Bryant. 2011. Hot moments and hot spots of nutrient losses from
a mixed land use watershed. J. Hydrol. 414:393-404.
Zvomuya, F., J. Rosen, R. Russell, and C. Gupta. 2003. Nitrate leaching and nitrogen recovery
following application of polyolefin-coated urea to potato. J. Environ. Qual. 32:480-489.

160
APPENDIX A
Groundwater Table and Piezometer Data for Chapter Two
This appendix contains the water table and piezometer data from three seep and three
adjacent non-seep areas of the riparian zone that are presented in chapter two. There are two
sections in this appendix: 1) groundwater table depth measured in piezometers; and 2) piezometer
ammonium-N (NH4-N), nitrate-N (NO3-N), and chloride (Cl-) concentrations. Other data in
chapter two, such as stream discharge as well as groundwater, seep water, and stream
concentrations, are shown in Appendix D. The figures in each section of this appendix are
formatted to display the data and are not meant to show the differences among sampling dates
(i.e., the y-axis varies for each figure); thus, caution must be taken if comparing two sampling
dates or differences between seep and non-seep areas.
Groundwater Table Depth
The x-axis is the piezometer identification number (1 to 40) and the y-axis is the depth of
the groundwater table below (or above) the land surface (cm). The piezometers were installed at
two depths (20 and 60 cm). The black circles represent the 60 cm piezometers and the white
squares represent the 20 cm piezometers. The dashed line at 0 cm represents the relative location
of the land surface. The dotted line shows the depth of the 20 cm piezometers.

161
Site 1: Non-seep Site 1: Seep
-20
0
20
40
60
0 10 20 30 40
October 5, 2010
-20
0
20
40
60
0 10 20 30 40
October 5, 2010
-20
0
20
40
60
0 10 20 30 40
November 23, 2010 -20
0
20
40
60
0 10 20 30 40
November 23, 2010
-20
0
20
40
60
0 10 20 30 40
March 14, 2011 -20
0
20
40
60
0 10 20 30 40
March 14, 2011
-20
0
20
40
60
0 10 20 30 40
May 6, 2011 -20
0
20
40
60
0 10 20 30 40
May 6, 2011

162
Site 1: Non-seep (cont.) Site 1: Seep (cont.)
-20
0
20
40
60
0 10 20 30 40
August 30, 2011 -20
0
20
40
60
0 10 20 30 40
August 30, 2011
-20
0
20
40
60
0 10 20 30 40
September 13, 2011 -20
0
20
40
60
0 10 20 30 40
September 13, 2011
-20
0
20
40
60
0 10 20 30 40
January 11, 2012 -20
0
20
40
60
0 10 20 30 40
January 11, 2012
-20
0
20
40
60
0 10 20 30 40
April 25, 2012 -20
0
20
40
60
0 10 20 30 40
April 25, 2012
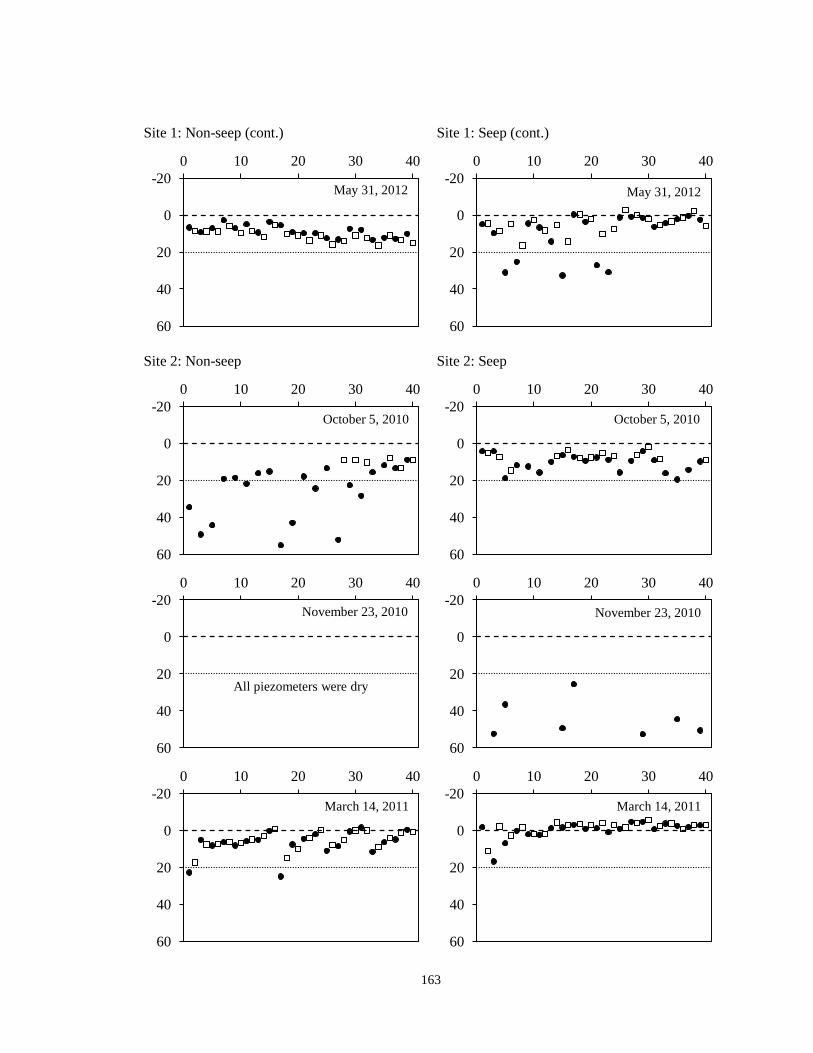
163
Site 1: Non-seep (cont.) Site 1: Seep (cont.)
Site 2: Non-seep Site 2: Seep
-20
0
20
40
60
0 10 20 30 40
May 31, 2012 -20
0
20
40
60
0 10 20 30 40
May 31, 2012
-20
0
20
40
60
0 10 20 30 40
October 5, 2010 -20
0
20
40
60
0 10 20 30 40
October 5, 2010
-20
0
20
40
60
0 10 20 30 40
November 23, 2010
All piezometers were dry
-20
0
20
40
60
0 10 20 30 40
November 23, 2010
-20
0
20
40
60
0 10 20 30 40
March 14, 2011 -20
0
20
40
60
0 10 20 30 40
March 14, 2011
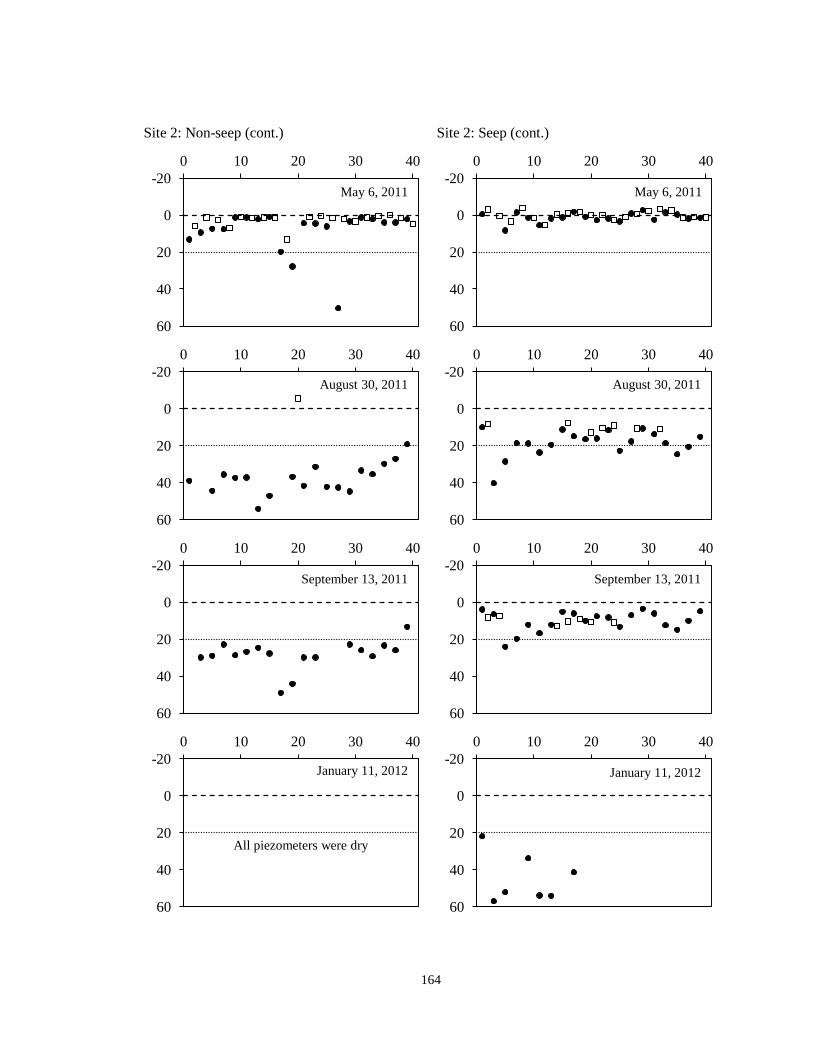
164
Site 2: Non-seep (cont.) Site 2: Seep (cont.)
-20
0
20
40
60
0 10 20 30 40
May 6, 2011 -20
0
20
40
60
0 10 20 30 40
May 6, 2011
-20
0
20
40
60
0 10 20 30 40
August 30, 2011 -20
0
20
40
60
0 10 20 30 40
August 30, 2011
-20
0
20
40
60
0 10 20 30 40
September 13, 2011 -20
0
20
40
60
0 10 20 30 40
September 13, 2011
-20
0
20
40
60
0 10 20 30 40
January 11, 2012
All piezometers were dry
-20
0
20
40
60
0 10 20 30 40
January 11, 2012
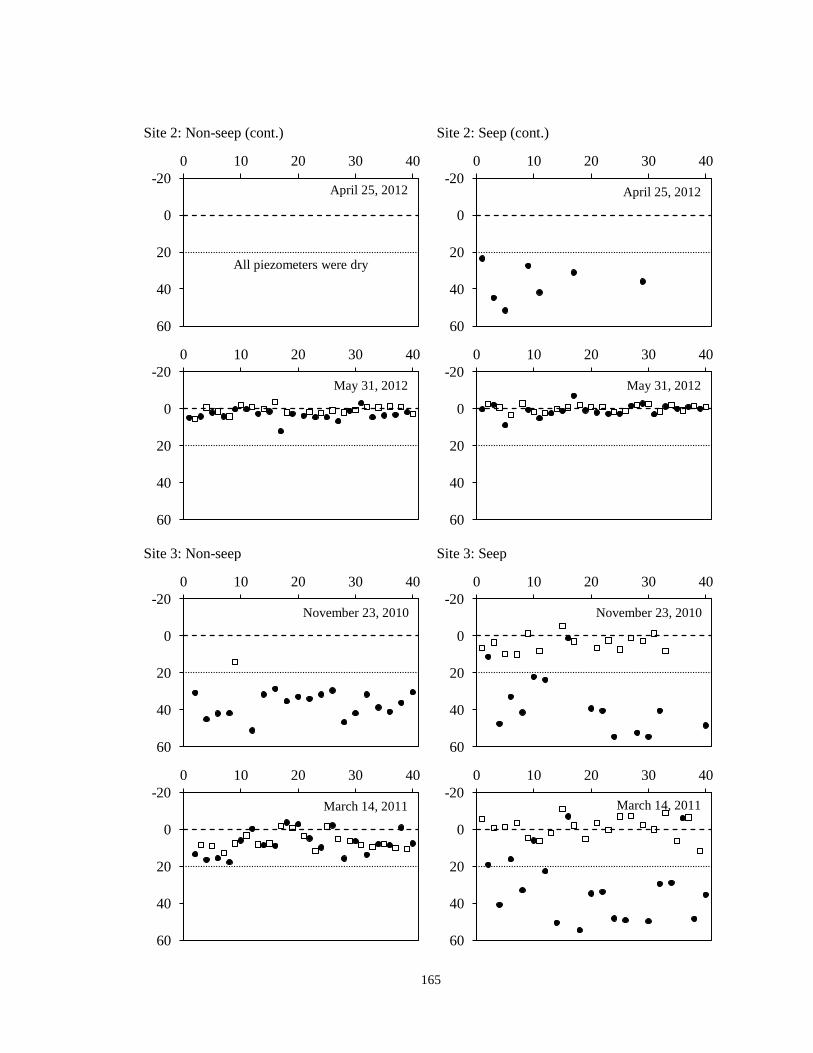
165
Site 2: Non-seep (cont.) Site 2: Seep (cont.)
Site 3: Non-seep Site 3: Seep
-20
0
20
40
60
0 10 20 30 40
April 25, 2012
All piezometers were dry
-20
0
20
40
60
0 10 20 30 40
April 25, 2012
-20
0
20
40
60
0 10 20 30 40
May 31, 2012 -20
0
20
40
60
0 10 20 30 40
May 31, 2012
-20
0
20
40
60
0 10 20 30 40
November 23, 2010 -20
0
20
40
60
0 10 20 30 40
November 23, 2010
-20
0
20
40
60
0 10 20 30 40
March 14, 2011 -20
0
20
40
60
0 10 20 30 40
March 14, 2011

166
Site 3: Non-seep (cont.) Site 3: Seep (cont.)
-20
0
20
40
60
0 10 20 30 40
May 6, 2011 -20
0
20
40
60
0 10 20 30 40
May 6,2011
-20
0
20
40
60
0 10 20 30 40
August 30, 2011 -20
0
20
40
60
0 10 20 30 40
August 30,2011
-20
0
20
40
60
0 10 20 30 40
September 13, 2011 -20
0
20
40
60
0 10 20 30 40
September 13, 2011
-20
0
20
40
60
0 10 20 30 40
January 11, 2012 -20
0
20
40
60
0 10 20 30 40
January 11, 2012
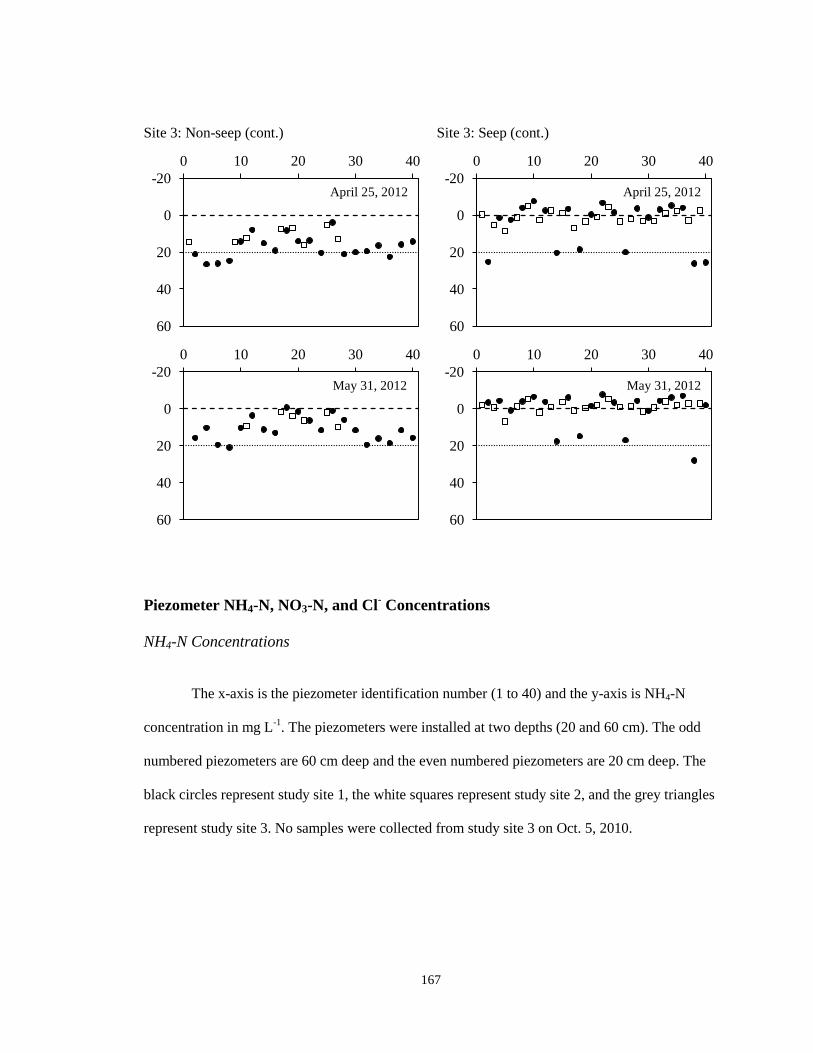
167
Site 3: Non-seep (cont.) Site 3: Seep (cont.)
Piezometer NH4-N, NO3-N, and Cl- Concentrations
NH4-N Concentrations
The x-axis is the piezometer identification number (1 to 40) and the y-axis is NH4-N
concentration in mg L-1
. The piezometers were installed at two depths (20 and 60 cm). The odd
numbered piezometers are 60 cm deep and the even numbered piezometers are 20 cm deep. The
black circles represent study site 1, the white squares represent study site 2, and the grey triangles
represent study site 3. No samples were collected from study site 3 on Oct. 5, 2010.
-20
0
20
40
60
0 10 20 30 40
April 25, 2012 -20
0
20
40
60
0 10 20 30 40
April 25, 2012
-20
0
20
40
60
0 10 20 30 40
May 31, 2012 -20
0
20
40
60
0 10 20 30 40
May 31, 2012

168
Seep Non-seep
0.0
0.1
0.2
0.3
0.4
0.5
0 10 20 30 40
October 5, 2010
0.0
0.1
0.2
0.3
0.4
0.5
0 10 20 30 40
October 5, 2010
0.0
0.5
1.0
1.5
2.0
0 10 20 30 40
November 23, 2010
0.0
0.3
0.6
0.9
0 10 20 30 40
November 23, 2010
0.0
0.5
1.0
1.5
0 10 20 30 40
March 14, 2011
0.0
0.3
0.6
0.9
0 10 20 30 40
March 14, 2011
0.0
0.1
0.2
0.3
0.4
0.5
0 10 20 30 40
May 6, 2011
0.0
0.1
0.2
0.3
0.4
0.5
0 10 20 30 40
May 6, 2011
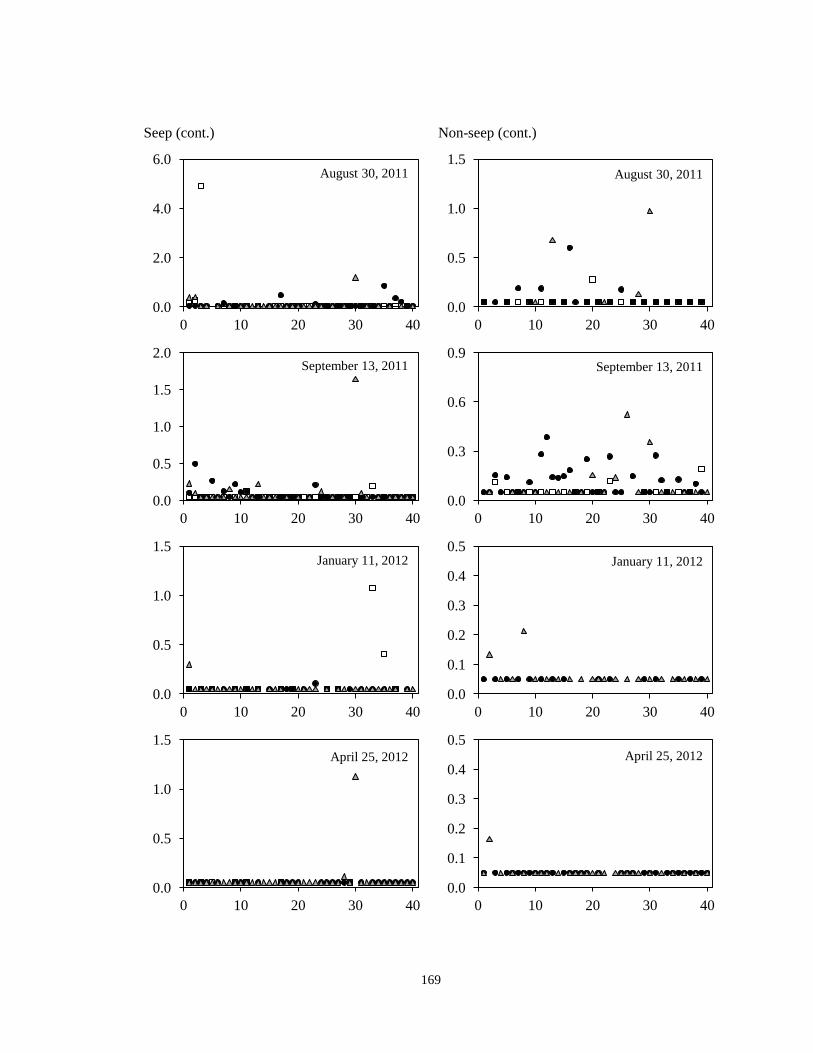
169
Seep (cont.) Non-seep (cont.)
0.0
2.0
4.0
6.0
0 10 20 30 40
August 30, 2011
0.0
0.5
1.0
1.5
0 10 20 30 40
August 30, 2011
0.0
0.5
1.0
1.5
2.0
0 10 20 30 40
September 13, 2011
0.0
0.3
0.6
0.9
0 10 20 30 40
September 13, 2011
0.0
0.5
1.0
1.5
0 10 20 30 40
January 11, 2012
0.0
0.1
0.2
0.3
0.4
0.5
0 10 20 30 40
January 11, 2012
0.0
0.5
1.0
1.5
0 10 20 30 40
April 25, 2012
0.0
0.1
0.2
0.3
0.4
0.5
0 10 20 30 40
April 25, 2012
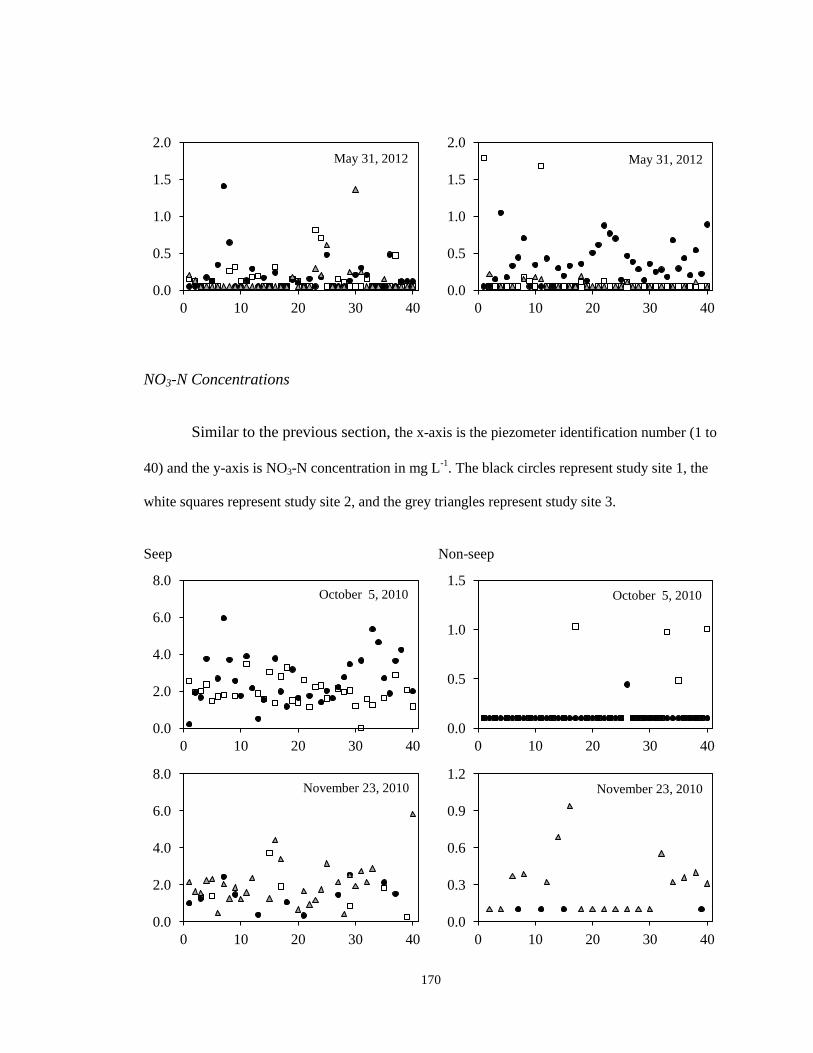
170
NO3-N Concentrations
Similar to the previous section, the x-axis is the piezometer identification number (1 to
40) and the y-axis is NO3-N concentration in mg L-1
. The black circles represent study site 1, the
white squares represent study site 2, and the grey triangles represent study site 3.
Seep Non-seep
0.0
0.5
1.0
1.5
2.0
0 10 20 30 40
May 31, 2012
0.0
0.5
1.0
1.5
2.0
0 10 20 30 40
May 31, 2012
0.0
2.0
4.0
6.0
8.0
0 10 20 30 40
October 5, 2010
0.0
0.5
1.0
1.5
0 10 20 30 40
October 5, 2010
0.0
2.0
4.0
6.0
8.0
0 10 20 30 40
November 23, 2010
0.0
0.3
0.6
0.9
1.2
0 10 20 30 40
November 23, 2010
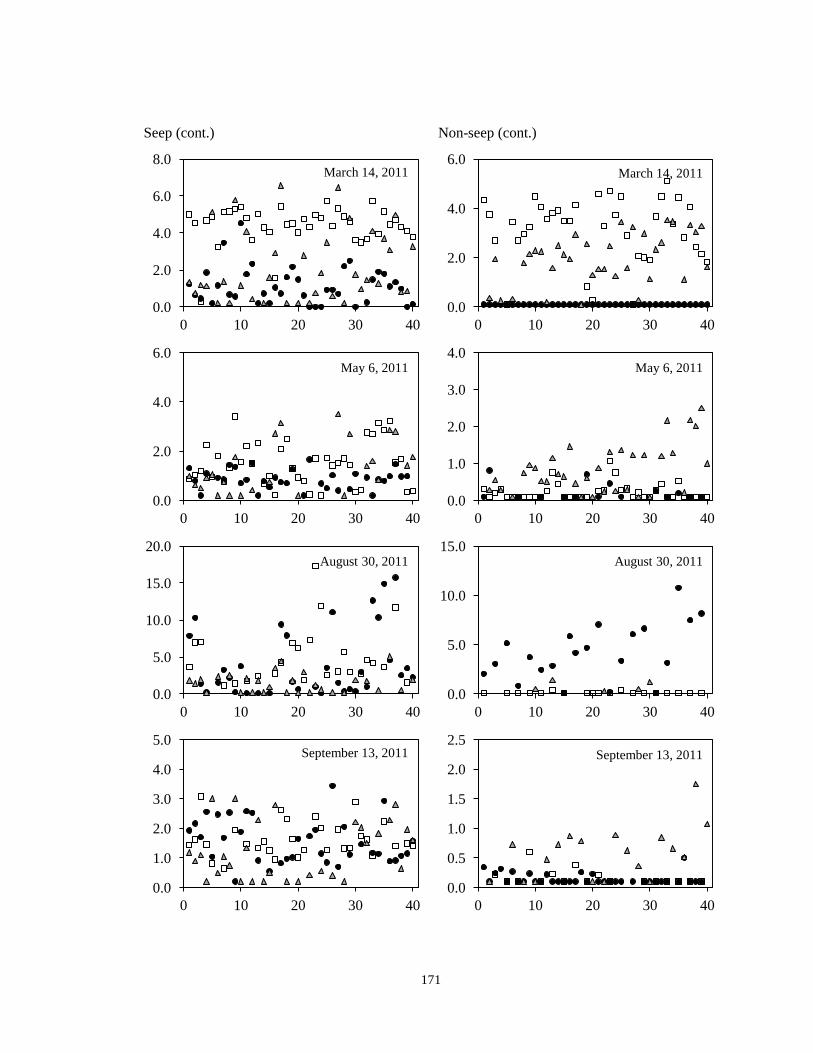
171
Seep (cont.) Non-seep (cont.)
0.0
2.0
4.0
6.0
8.0
0 10 20 30 40
March 14, 2011
0.0
2.0
4.0
6.0
0 10 20 30 40
March 14, 2011
0.0
2.0
4.0
6.0
0 10 20 30 40
May 6, 2011
0.0
1.0
2.0
3.0
4.0
0 10 20 30 40
May 6, 2011
0.0
5.0
10.0
15.0
20.0
0 10 20 30 40
August 30, 2011
0.0
5.0
10.0
15.0
0 10 20 30 40
August 30, 2011
0.0
1.0
2.0
3.0
4.0
5.0
0 10 20 30 40
September 13, 2011
0.0
0.5
1.0
1.5
2.0
2.5
0 10 20 30 40
September 13, 2011
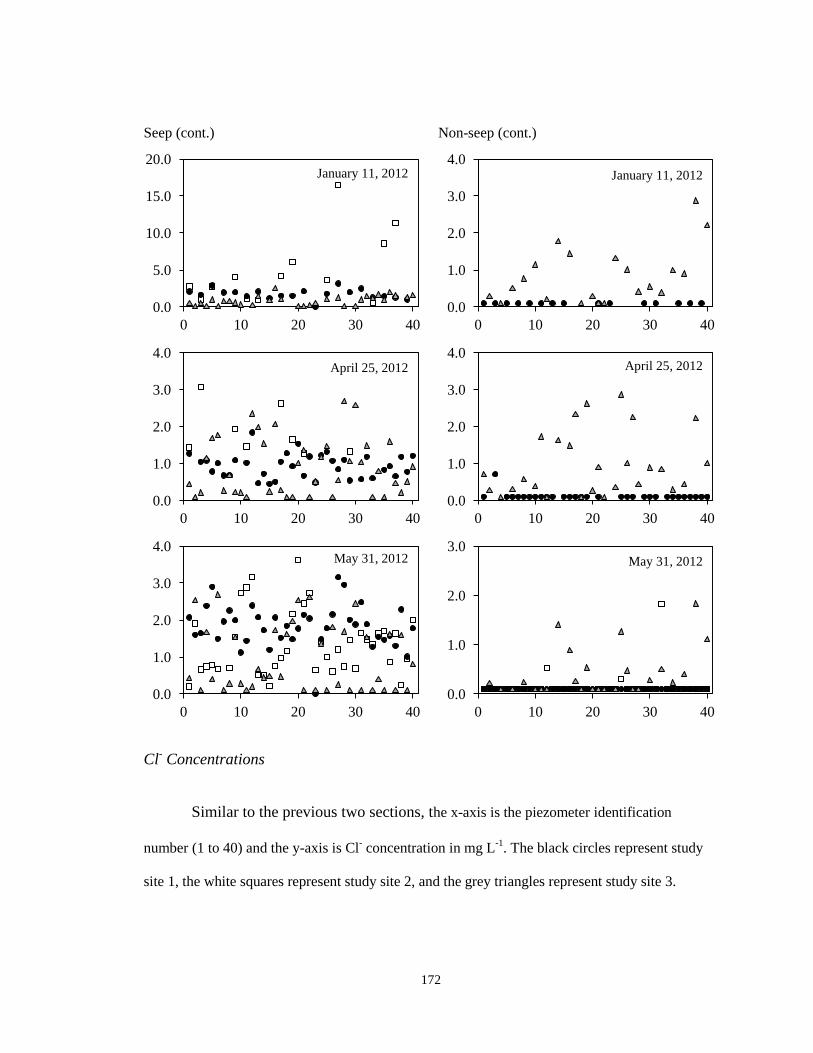
172
Seep (cont.) Non-seep (cont.)
Cl- Concentrations
Similar to the previous two sections, the x-axis is the piezometer identification
number (1 to 40) and the y-axis is Cl- concentration in mg L
-1. The black circles represent study
site 1, the white squares represent study site 2, and the grey triangles represent study site 3.
0.0
5.0
10.0
15.0
20.0
0 10 20 30 40
January 11, 2012
0.0
1.0
2.0
3.0
4.0
0 10 20 30 40
January 11, 2012
0.0
1.0
2.0
3.0
4.0
0 10 20 30 40
April 25, 2012
0.0
1.0
2.0
3.0
4.0
0 10 20 30 40
April 25, 2012
0.0
1.0
2.0
3.0
4.0
0 10 20 30 40
May 31, 2012
0.0
1.0
2.0
3.0
0 10 20 30 40
May 31, 2012

173
Seep Non-seep
Seep (cont.) Non-seep (cont.)
0.0
5.0
10.0
15.0
20.0
25.0
0 10 20 30 40
October 5, 2010
0.0
3.0
6.0
9.0
0 10 20 30 40
October 5, 2010
0.0
5.0
10.0
15.0
20.0
0 10 20 30 40
November 23, 2010
0.0
4.0
8.0
12.0
16.0
0 10 20 30 40
November 23, 2010
0.0
4.0
8.0
12.0
0 10 20 30 40
March 14, 2011
0.0
2.0
4.0
6.0
8.0
0 10 20 30 40
March 14, 2011
0.0
4.0
8.0
12.0
0 10 20 30 40
May 6, 2011
0.0
2.0
4.0
6.0
8.0
10.0
0 10 20 30 40
May 6, 2011

174
Seep (cont.) Non-seep (cont.)
0.0
15.0
30.0
45.0
60.0
0 10 20 30 40
August 30, 2011
0.0
10.0
20.0
30.0
0 10 20 30 40
August 30, 2011
0.0
4.0
8.0
12.0
16.0
0 10 20 30 40
September 13, 2011
0.0
4.0
8.0
12.0
0 10 20 30 40
September 13, 2011
0.0
15.0
30.0
45.0
60.0
0 10 20 30 40
January 11, 2012
0.0
4.0
8.0
12.0
0 10 20 30 40
January 11, 2012
0.0
4.0
8.0
12.0
16.0
0 10 20 30 40
April 25, 2012
0.0
4.0
8.0
12.0
16.0
0 10 20 30 40
April 25, 2012
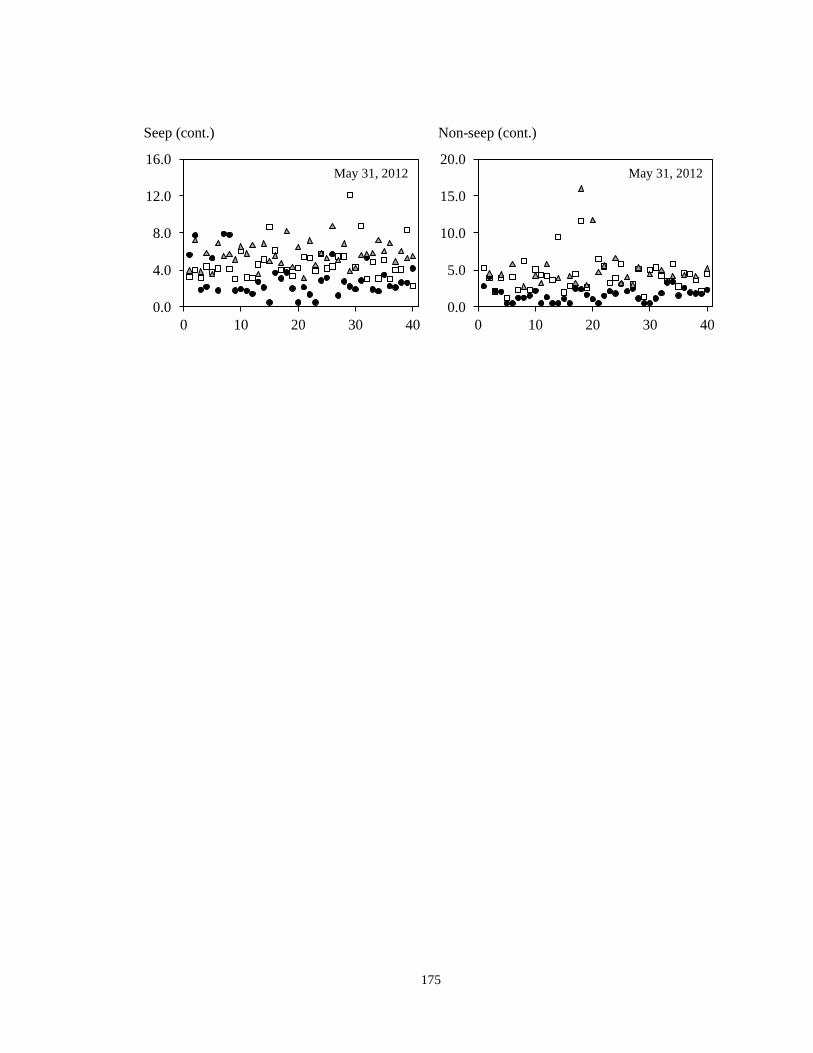
175
Seep (cont.) Non-seep (cont.)
0.0
4.0
8.0
12.0
16.0
0 10 20 30 40
May 31, 2012
0.0
5.0
10.0
15.0
20.0
0 10 20 30 40
May 31, 2012

176
APPENDIX B
Groundwater Table, Piezometer, and Electrical Resistivity Imaging
Data for Chapter Three
This appendix contains the water table, piezometer, and electrical resistivity imaging
(ERI) data from a seep and an adjacent non-seep area of the riparian zone that are presented in
chapter three. There are five sections in this appendix: 1) groundwater table depth measured in
piezometers; 2) non-seep apparent resistivity and inverted resistivity sections; 3) seep apparent
resistivity and inverted resistivity sections; 4) piezometer nitrate-N (NO3-N) concentration; and 5)
piezometer chloride (Cl-) concentration. The figures in each section of this appendix are
formatted to display the data and are not meant to show the differences among sampling dates
(i.e., the y-axis varies for each figure); thus, caution must be taken if comparing two sampling
dates or differences between seep and non-seep areas.
Groundwater Table Depth
The x-axis is the piezometer identification number (1 to 20) and the y-axis is the depth of
the groundwater table below (or above) the land surface (cm). The piezometers were installed at a
depth of 60 cm. The black circles represent water table measurements from the seep area and the
white squares represent water table measurements from the non-seep area. The dashed line at 0
cm represents the relative location of the land surface. On April 21 and April 22, 2012, the water
table depth was greater than 60 cm in both the seep and non-seep areas; therefore, the data are not
shown.
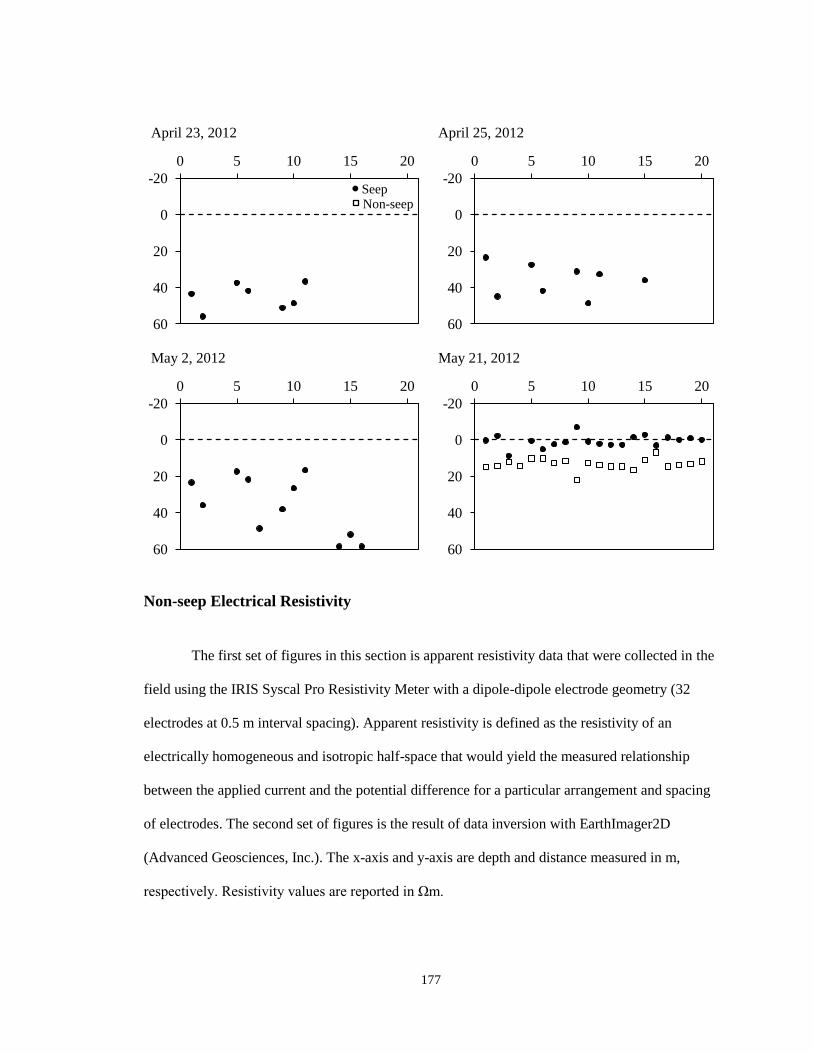
177
April 23, 2012 April 25, 2012
May 2, 2012 May 21, 2012
Non-seep Electrical Resistivity
The first set of figures in this section is apparent resistivity data that were collected in the
field using the IRIS Syscal Pro Resistivity Meter with a dipole-dipole electrode geometry (32
electrodes at 0.5 m interval spacing). Apparent resistivity is defined as the resistivity of an
electrically homogeneous and isotropic half-space that would yield the measured relationship
between the applied current and the potential difference for a particular arrangement and spacing
of electrodes. The second set of figures is the result of data inversion with EarthImager2D
(Advanced Geosciences, Inc.). The x-axis and y-axis are depth and distance measured in m,
respectively. Resistivity values are reported in Ωm.
-20
0
20
40
60
0 5 10 15 20
Non-seep Seep
-20
0
20
40
60
0 5 10 15 20
-20
0
20
40
60
0 5 10 15 20
-20
0
20
40
60
0 5 10 15 20
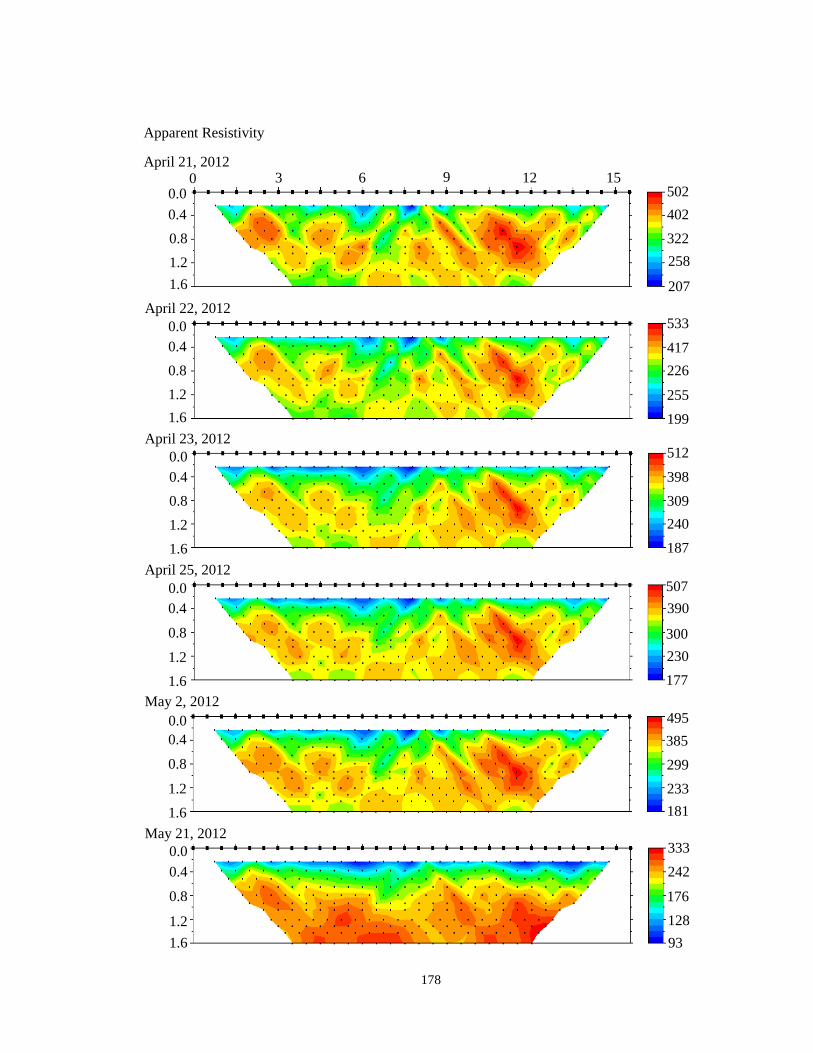
178
Apparent Resistivity
April 21, 2012
15 12 9 6 3 0 0.0
1.6
1.2
0.8
0.4
502
402
322
258
207
0.0
0.4
0.8
1.2
1.6
0.0
0.4
0.8
1.2
1.6
0.0
0.4
0.8
1.2
1.6
0.0
0.4
0.8
1.2
1.6
0.0
0.4
0.8
1.2
1.6
199
255
226
417
533 April 22, 2012
187
240
309
398
512 April 23, 2012
177
230
300
390
507 April 25, 2012
181
233
299
385
495 May 2, 2012
93
128
176
242
333 May 21, 2012

179
Inverted Resistivity Section
April 21, 2012
0.0
0.4
0.8
1.2
1.6
0 3 6 12 9 15 680
508
379
283
211
0.0
0.4
0.8
1.2
1.6
0.0
0.4
0.8
1.2
1.6
0.0
0.4
0.8
1.2
1.6
0.0
0.4
0.8
1.2
1.6
0.0
0.4
0.8
1.2
1.6
203
281
389
540
749 April 22, 2012
164
250
382
583
891 April 23, 2012
162
247
377
574
875 April 25, 2012
169
248
364
534
783 May 2, 2012
80
136
232
397
677 May 21, 2012
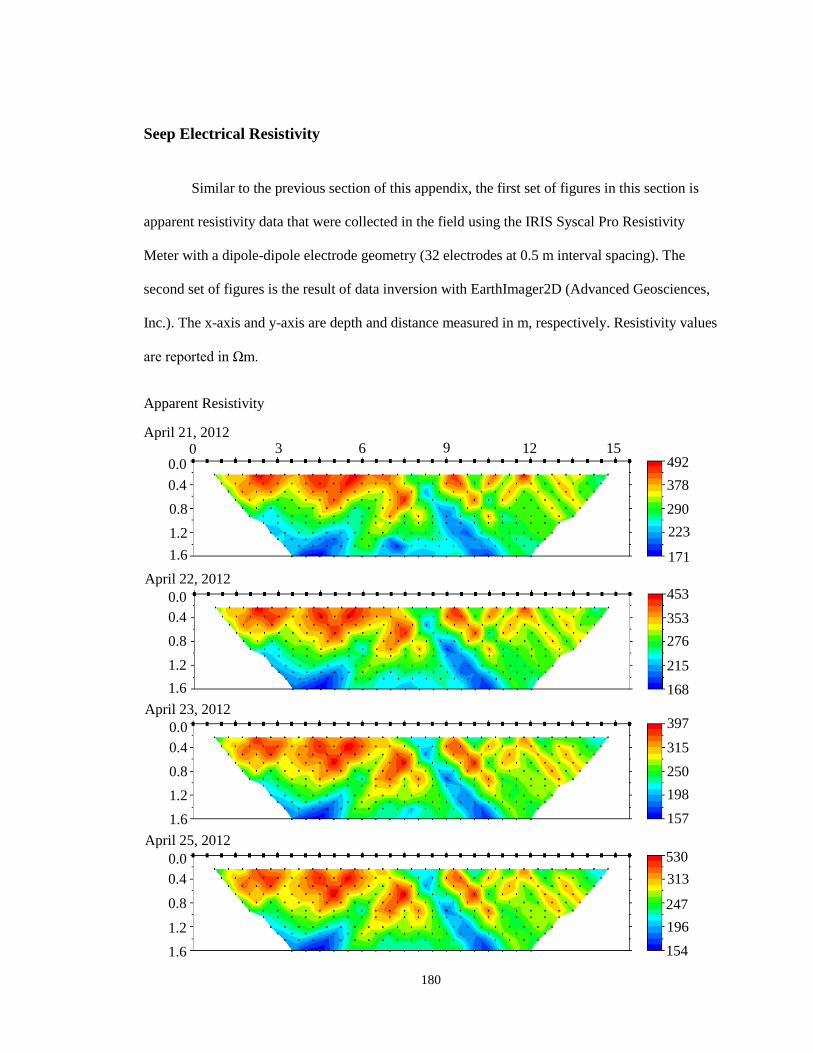
180
Seep Electrical Resistivity
Similar to the previous section of this appendix, the first set of figures in this section is
apparent resistivity data that were collected in the field using the IRIS Syscal Pro Resistivity
Meter with a dipole-dipole electrode geometry (32 electrodes at 0.5 m interval spacing). The
second set of figures is the result of data inversion with EarthImager2D (Advanced Geosciences,
Inc.). The x-axis and y-axis are depth and distance measured in m, respectively. Resistivity values
are reported in Ωm.
Apparent Resistivity
April 21, 2012
0.0
0.4
0.8
1.2
1.6
0 3 6 12 9 15 492
378
290
223
171
0.0
0.4
0.8
1.2
1.6
0.0
0.4
0.8
1.2
1.6
0.0
0.4
0.8
1.2
1.6
168
215
276
353
453 April 22, 2012
157
198
250
315
397 April 23, 2012
154
196
247
313
530 April 25, 2012
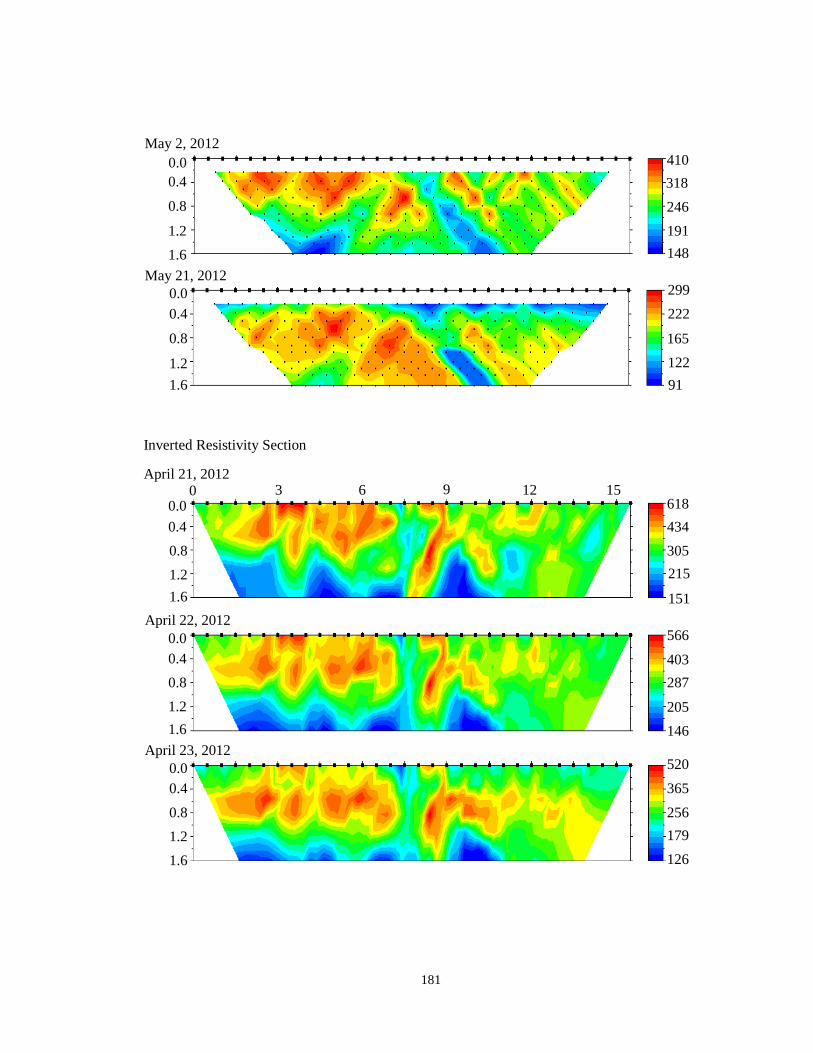
181
Inverted Resistivity Section
April 21, 2012
0.0
0.4
0.8
1.2
1.6
0.0
0.4
0.8
1.2
1.6
148
191
246
318
410 May 2, 2012
91
122
165
222
299 May 21, 2012
0.0
0.4
0.8
1.2
1.6
0 3 6 12 9 15 618
434
305
215
151
0.0
0.4
0.8
1.2
1.6
0.0
0.4
0.8
1.2
1.6
146
205
287
403
566 April 22, 2012
126
179
256
365
520 April 23, 2012

182
Piezometer NO3-N Concentration
The x-axis is the piezometer identification number (1 to 40) and the y-axis is NO3-N
concentration (mg L-1
). The piezometers were installed at two depths (20 and 60 cm). On April 21
and April 22, no water samples were collected from either the seep or non-seep area.
April 23, 2012 April 25, 2012
0.0
0.5
1.0
1.5
2.0
2.5
0 10 20 30 40
Seep Non-seep
0.0
1.0
2.0
3.0
4.0
0 10 20 30 40
0.0
0.4
0.8
1.2
1.6
0.0
0.4
0.8
1.2
1.6
0.0
0.4
0.8
1.2
1.6
141
196
273
380
530 April 25, 2012
140
191
261
358
489 May 2, 2012
48
116
192
284
457 May 21, 2012
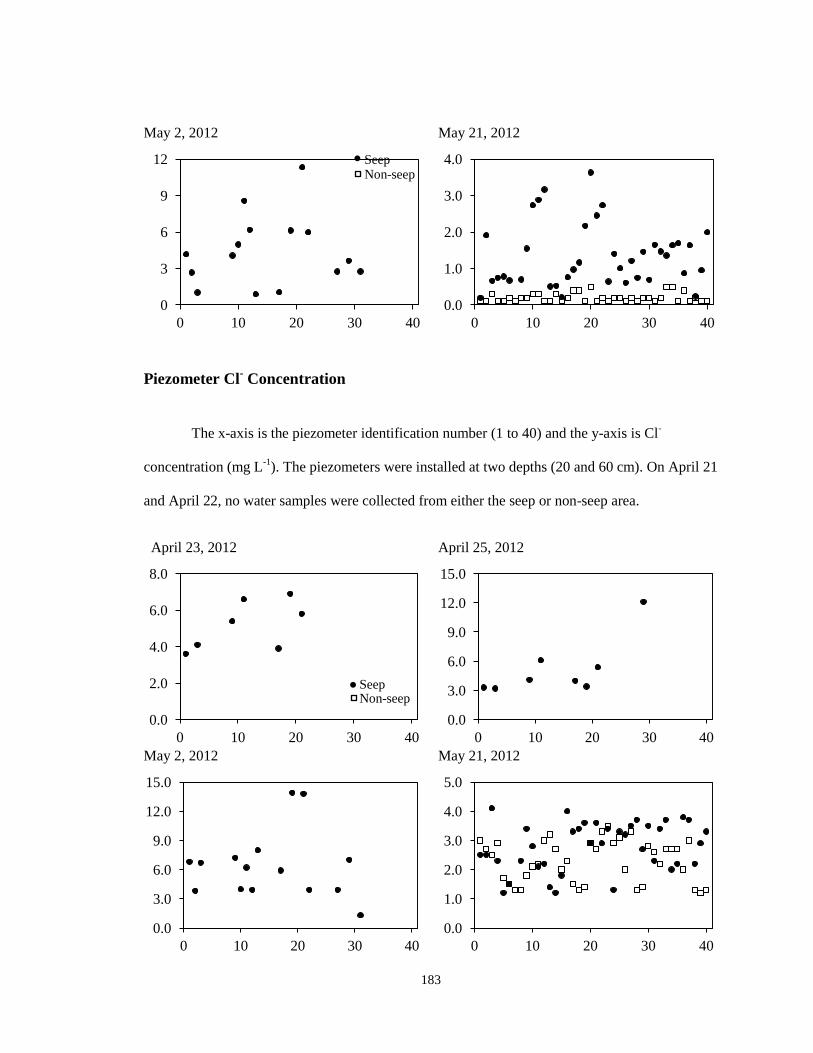
183
May 2, 2012 May 21, 2012
Piezometer Cl- Concentration
The x-axis is the piezometer identification number (1 to 40) and the y-axis is Cl-
concentration (mg L-1
). The piezometers were installed at two depths (20 and 60 cm). On April 21
and April 22, no water samples were collected from either the seep or non-seep area.
April 23, 2012 April 25, 2012
May 2, 2012 May 21, 2012
0
3
6
9
12
0 10 20 30 40
Seep Non-seep
0.0
1.0
2.0
3.0
4.0
0 10 20 30 40
0.0
2.0
4.0
6.0
8.0
0 10 20 30 40
Non-seep Seep
0.0
3.0
6.0
9.0
12.0
15.0
0 10 20 30 40
0.0
3.0
6.0
9.0
12.0
15.0
0 10 20 30 40
0.0
1.0
2.0
3.0
4.0
5.0
0 10 20 30 40

184
APPENDIX C
Stream and Seep Nitrate Data for Chapter Four
This appendix contains the stream and seep data that are presented in chapter four. There
are three main sections of this appendix: 1) baseflow stream and surface seep nitrate-nitrogen
(NO3-N) concentrations in FD36 and RS; 2) stream and seep NO3-N concentrations measured
during and following storm events; and 3) semi-variogram analysis of stream NO3-N
concentration. The figures in each section are formatted to display the data and are not meant to
show the differences among sampling dates (i.e., the y-axis varies for each figure); thus, caution
must be taken if comparing two sampling dates or differences between FD36 and RS.
Baseflow Stream and Seep NO3-N Concentrations
The x-axis is the distance (m) from the stream outlet and the y-axis is NO3-N
concentration (mg L-1
). Seep location and NO3-N concentration (mg L-1
) are also labeled.
FD36 RS
0
1
2
3
0 110 220 330 440 550
April 29,2009
1.4
9.8 10.1
2.5
1.9
0.1
7.1
2.9
Stream Seep
Tributary (RS only)
5
7
9
11
13
15
17
0 100 200 300 400 500
April 29,2009
19.3
24.1
1.2 9.7
12.0
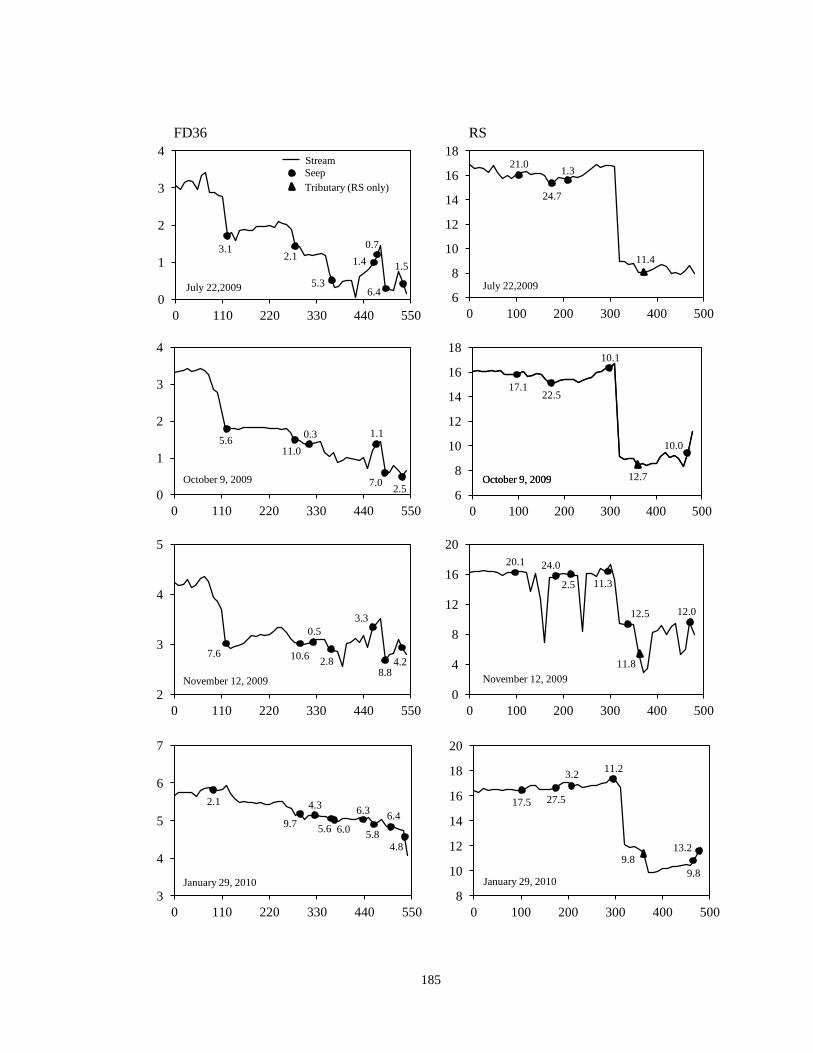
185
FD36 RS
0
1
2
3
4
0 110 220 330 440 550
July 22,2009
1.5
6.4
0.7
1.4
5.3
3.1 2.1
Seep
Tributary (RS only)
Stream
6
8
10
12
14
16
18
0 100 200 300 400 500
July 22,2009
1.3
11.4
24.7
21.0
0
1
2
3
4
0 110 220 330 440 550
October 9, 2009
5.6 11.0
0.3 1.1
7.0 2.5
6
8
10
12
14
16
18
0 100 200 300 400 500
October 9, 2009 October 9, 2009
22.5
10.1
17.1
10.0
12.7
2
3
4
5
0 110 220 330 440 550
November 12, 2009
7.6 10.6
0.5
2.8
3.3
8.8 4.2
0
4
8
12
16
20
0 100 200 300 400 500
November 12, 2009
11.8
20.1 24.0
2.5 11.3
12.5 12.0
3
4
5
6
7
0 110 220 330 440 550
January 29, 2010
2.1
9.7
4.3
5.6 6.0 5.8
6.3 6.4
4.8
8
10
12
14
16
18
20
0 100 200 300 400 500
January 29, 2010
17.5 27.5
3.2 11.2
9.8
13.2 9.8
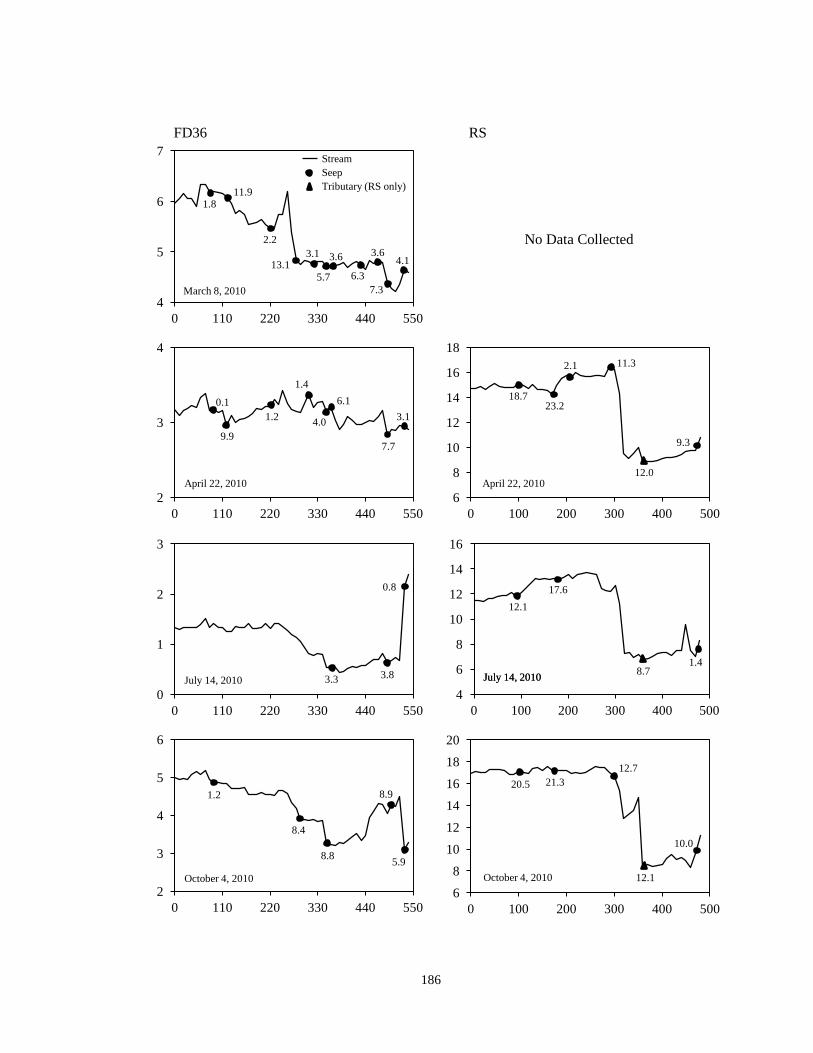
186
FD36 RS
No Data Collected
4
5
6
7
0 110 220 330 440 550
March 8, 2010
1.8 11.9
2.2
13.1 3.1
5.7
3.6
6.3
3.6
7.3
4.1
Tributary (RS only)
Seep
Stream
2
3
4
0 110 220 330 440 550
April 22, 2010
0.1
9.9
1.2
1.4
4.0
6.1
7.7
3.1
6
8
10
12
14
16
18
0 100 200 300 400 500
April 22, 2010
18.7 23.2
2.1 11.3
12.0
9.3
0
1
2
3
0 110 220 330 440 550
July 14, 2010 3.3 3.8
0.8
4
6
8
10
12
14
16
0 100 200 300 400 500
July 14, 2010 July 14, 2010
12.1
17.6
8.7 1.4
2
3
4
5
6
0 110 220 330 440 550
October 4, 2010
1.2
8.4
8.8
8.9
5.9
6
8
10
12
14
16
18
20
0 100 200 300 400 500
October 4, 2010
21.3
10.0
20.5
12.7
12.1
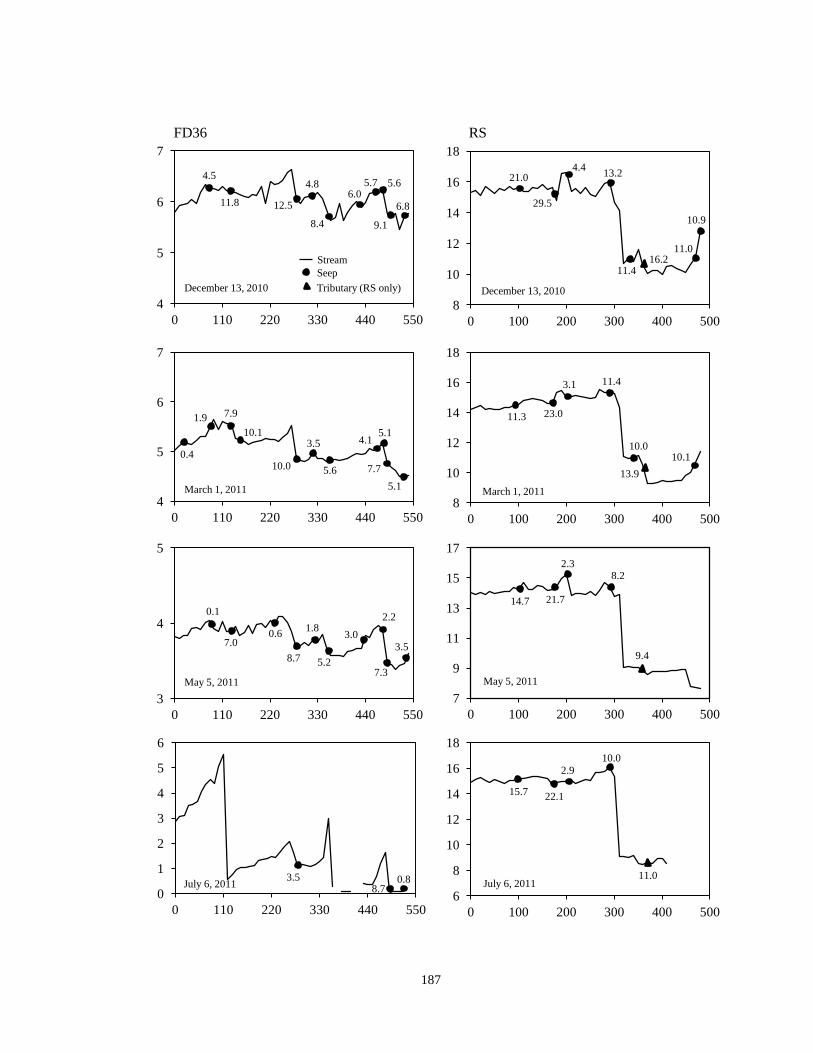
187
FD36 RS
4
5
6
7
0 110 220 330 440 550
December 13, 2010
4.5
11.8 12.5
4.8
8.4
6.0 5.7 5.6
9.1
6.8
Tributary (RS only)
Seep
Stream
8
10
12
14
16
18
0 100 200 300 400 500
December 13, 2010
21.0
29.5
4.4 13.2
11.4 16.2
10.9
11.0
4
5
6
7
0 110 220 330 440 550
March 1, 2011
0.4
1.9 7.9
10.1
10.0
3.5
5.6
4.1 5.1
7.7
5.1
8
10
12
14
16
18
0 100 200 300 400 500
March 1, 2011
11.3 23.0
3.1 11.4
10.0
13.9
10.1
3
4
5
0 110 220 330 440 550
May 5, 2011
0.1
7.0 0.6
8.7
1.8
5.2
3.0
2.2
7.3
3.5
7
9
11
13
15
17
0 100 200 300 400 500
May 5, 2011
14.7 21.7
2.3
9.4
8.2
0
1
2
3
4
5
6
0 110 220 330 440 550
July 6, 2011 3.5
8.7 0.8
6
8
10
12
14
16
18
0 100 200 300 400 500
July 6, 2011
15.7 22.1
2.9
10.0
11.0
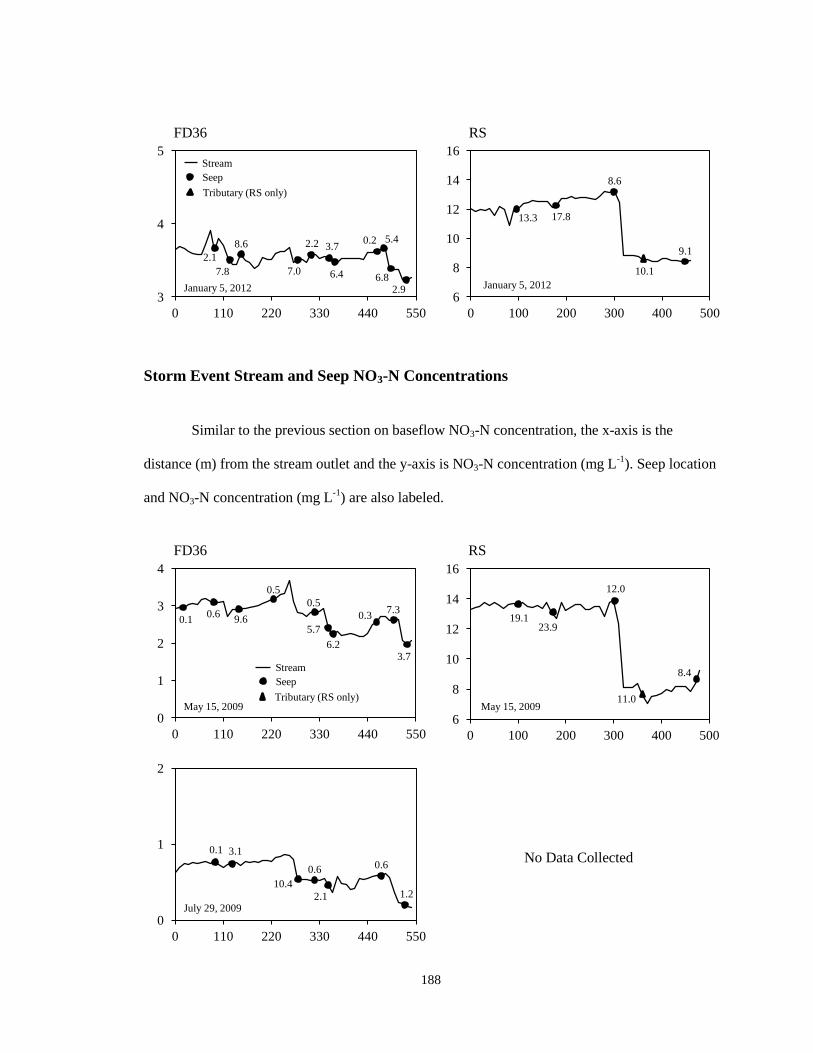
188
FD36 RS
Storm Event Stream and Seep NO3-N Concentrations
Similar to the previous section on baseflow NO3-N concentration, the x-axis is the
distance (m) from the stream outlet and the y-axis is NO3-N concentration (mg L-1
). Seep location
and NO3-N concentration (mg L-1
) are also labeled.
FD36 RS
No Data Collected
3
4
5
0 110 220 330 440 550
January 5, 2012
2.1
7.8
8.6
7.0
2.2 3.7
6.4
0.2
6.8 2.9
5.4
Seep
Stream
Tributary (RS only)
6
8
10
12
14
16
0 100 200 300 400 500
January 5, 2012
13.3 17.8
8.6
10.1
9.1
0
1
2
3
4
0 110 220 330 440 550
May 15, 2009
0.1 0.6
9.6
0.5
0.5
5.7
6.2
0.3 7.3
3.7
Seep
Stream
Tributary (RS only)
6
8
10
12
14
16
0 100 200 300 400 500
May 15, 2009
19.1 23.9
12.0
11.0
8.4
0
1
2
0 110 220 330 440 550
July 29, 2009
0.1 3.1
10.4
0.6
2.1
0.6
1.2

189
FD36 RS
0
1
2
3
4
5
6
0 110 220 330 440 550
July 30, 2009
0.1
0.1 9.9 12.1
0.4 6.4
7.4
1.6
1.4
6.4 1.5
Seep
Stream
Tributary (RS only)
0
4
8
12
16
20
24
0 100 200 300 400 500
July 30, 2009
21.0 22.8
12.5
9.9
6.4
3
4
5
6
0 110 220 330 440 550
March 9, 2010
0.1
1.4
9.2
6.3
1.7
10.5 2.7
5.8
4.1
5.8 8.2
3.8
4.7
8
10
12
14
0 100 200 300 400 500
March 9, 2010
19.6 22.1
2.9 10.7
9.1
11.5
3
4
5
6
0 110 220 330 440 550
March 15, 2010
0.1
2.2
12.2
8.3
2.4
10.5
4.0
5.8
6.0 4.2
5.0
7.6
4.6
8
10
12
14
16
18
0 100 200 300 400 500
March 15, 2010
16.6
24.2
3.6 10.5
11.9
11.5 9.0
9.0
3
4
5
6
0 110 220 330 440 550
March 11, 2011
1.1
2.3
8.0
10.2 2.1
10.3
4.7
5.7 5.3
4.1
5.1 6.6
5.0
6
8
10
12
14
16
0 100 200 300 400 500
March 11, 2011
16.1 23.9
2.4 8.3
8.0
14.2 9.8
7.6
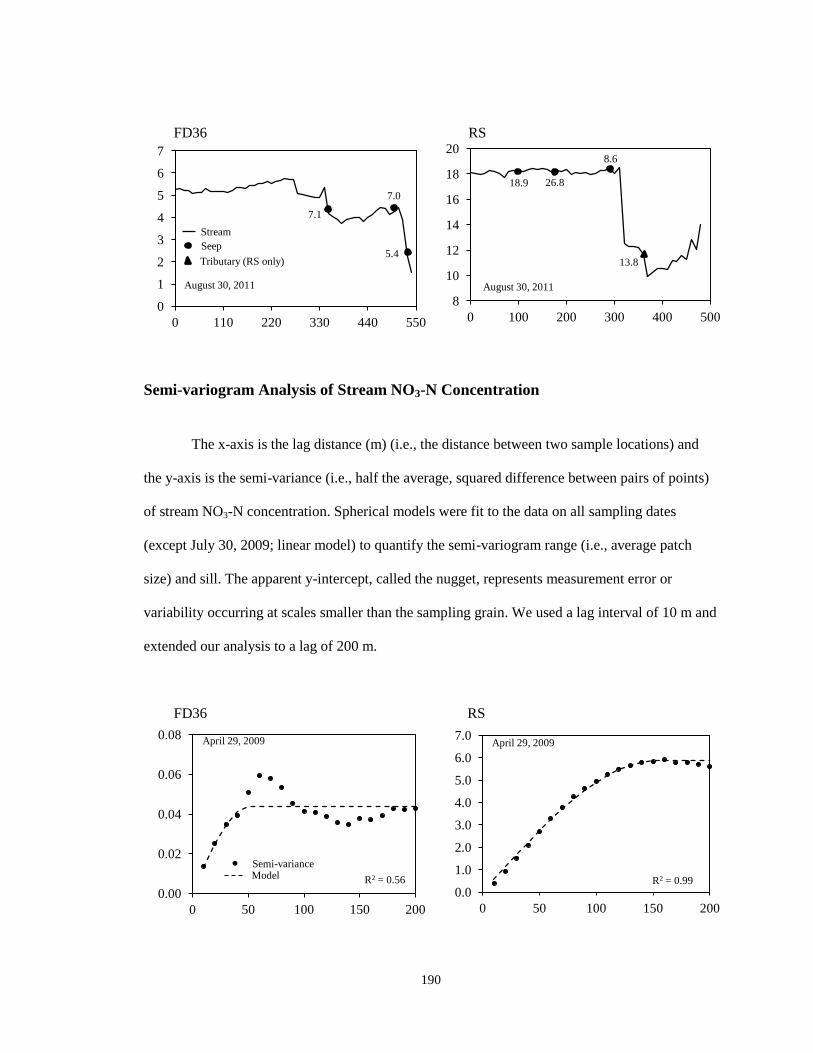
190
FD36 RS
Semi-variogram Analysis of Stream NO3-N Concentration
The x-axis is the lag distance (m) (i.e., the distance between two sample locations) and
the y-axis is the semi-variance (i.e., half the average, squared difference between pairs of points)
of stream NO3-N concentration. Spherical models were fit to the data on all sampling dates
(except July 30, 2009; linear model) to quantify the semi-variogram range (i.e., average patch
size) and sill. The apparent y-intercept, called the nugget, represents measurement error or
variability occurring at scales smaller than the sampling grain. We used a lag interval of 10 m and
extended our analysis to a lag of 200 m.
FD36 RS
0
1
2
3
4
5
6
7
0 110 220 330 440 550
August 30, 2011
Seep
Stream
Tributary (RS only)
7.1
7.0
5.4
8
10
12
14
16
18
20
0 100 200 300 400 500
August 30, 2011
18.9 26.8
8.6
13.8
0.00
0.02
0.04
0.06
0.08
0 50 100 150 200
April 29, 2009
Semi-variance Model R2 = 0.56
0.0
1.0
2.0
3.0
4.0
5.0
6.0
7.0
0 50 100 150 200
April 29, 2009
R2 = 0.99

191
FD36 RS
No Data Collected
0.00
0.03
0.06
0.09
0.12
0 50 100 150 200
May 15, 2009
Semi-variance Model
R2 = 0.90
0.0
1.0
2.0
3.0
4.0
0 50 100 150 200
May 15, 2009
R2 = 0.99
0.00
0.05
0.10
0.15
0.20
0.25
0 50 100 150 200
July 22, 2009
R2 = 0.88 0.0
3.0
6.0
9.0
0 50 100 150 200
R2 = 0.99
July 22, 2009
0.00
0.01
0.02
0 50 100 150 200
July 29, 2009
R2 = 0.94
0.00
0.30
0.60
0.90
0 50 100 150 200
July 30, 2009
R2 = 0.91 0.0
5.0
10.0
15.0
20.0
0 50 100 150 200
July 30, 2009
R2 = 0.95

192
FD36 RS
No Data Collected
0.00
0.04
0.08
0.12
0.16
0 50 100 150 200
October 9, 2009
Semi-variance Model
R2 = 0.88 0.0
1.0
2.0
3.0
4.0
5.0
6.0
0 50 100 150 200
October 9, 2009
R2 = 0.97
0.00
0.04
0.08
0.12
0.16
0 50 100 150 200
November 12, 2009
R2 = 0.91 0.0
3.0
6.0
9.0
12.0
15.0
0 50 100 150 200
November 12, 2009
R2 = 0.82
0.00
0.01
0.02
0.03
0 50 100 150 200
January 29, 2010
R2 = 0.60 0.0
1.0
2.0
3.0
4.0
5.0
0 50 100 150 200
January 29, 2010
R2 = 0.98
0
0.03
0.06
0.09
0 50 100 150 200
March 8, 2010
R2 = 0.85

193
FD36 RS
0.00
0.02
0.04
0.06
0.08
0.10
0 50 100 150 200
March 9, 2010
R2 = 0.91
Semi-variance Model
0.0
0.3
0.6
0.9
1.2
0 50 100 150 200
March 9, 2010
R2 = 0.98
0.00
0.01
0.02
0.03
0.04
0.05
0 50 100 150 200
March 15, 2010
R2 = 0.81 0.0
1.0
2.0
3.0
4.0
0 50 100 150 200
March 15, 2010
R2 = 0.99
0.00
0.01
0.02
0.03
0 50 100 150 200
April 22, 2010
R2 = 0.84 0.0
2.0
4.0
6.0
8.0
0 50 100 150 200
April 22, 2010
R2 = 0.99
0.00
0.05
0.10
0.15
0.20
0 50 100 150 200
July 14, 2010
R2 = 0.97 0.0
2.0
4.0
6.0
8.0
0 50 100 150 200
July 14, 2010
R2 = 0.99
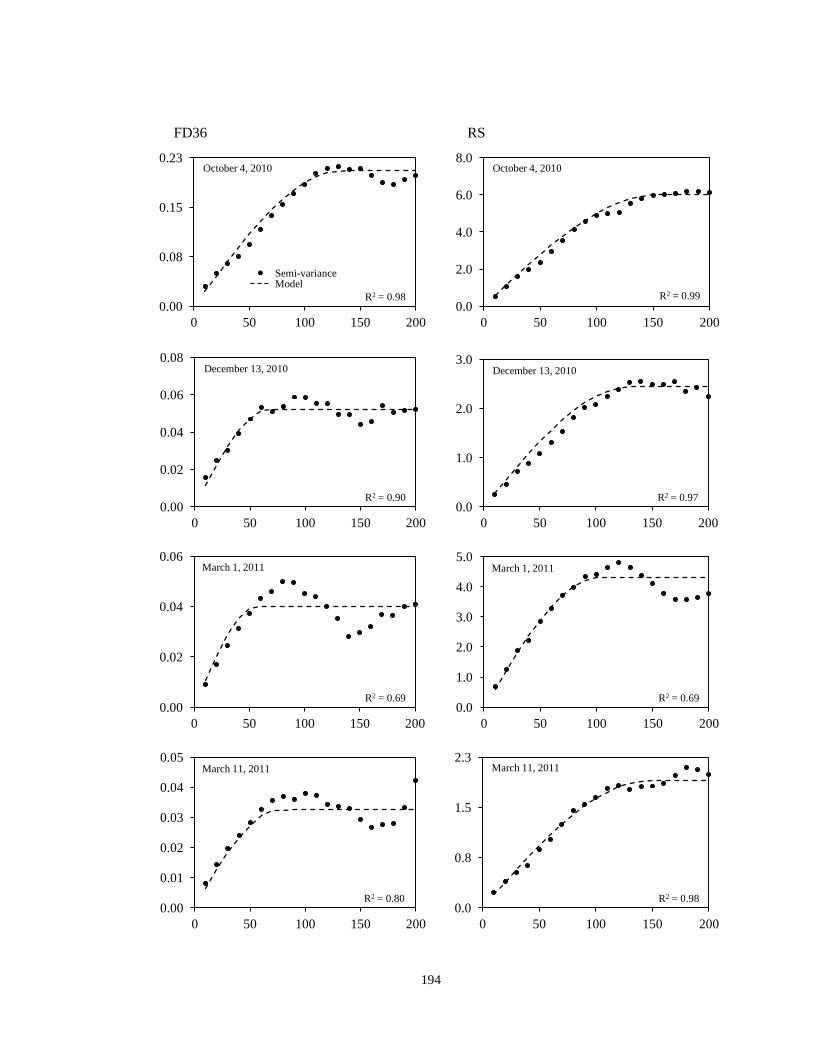
194
FD36 RS
0.00
0.08
0.15
0.23
0 50 100 150 200
October 4, 2010
R2 = 0.98
Semi-variance Model
0.0
2.0
4.0
6.0
8.0
0 50 100 150 200
October 4, 2010
R2 = 0.99
0.00
0.02
0.04
0.06
0.08
0 50 100 150 200
December 13, 2010
R2 = 0.90 0.0
1.0
2.0
3.0
0 50 100 150 200
December 13, 2010
R2 = 0.97
0.00
0.02
0.04
0.06
0 50 100 150 200
March 1, 2011
R2 = 0.69 0.0
1.0
2.0
3.0
4.0
5.0
0 50 100 150 200
March 1, 2011
R2 = 0.69
0.00
0.01
0.02
0.03
0.04
0.05
0 50 100 150 200
March 11, 2011
R2 = 0.80 0.0
0.8
1.5
2.3
0 50 100 150 200
March 11, 2011
R2 = 0.98
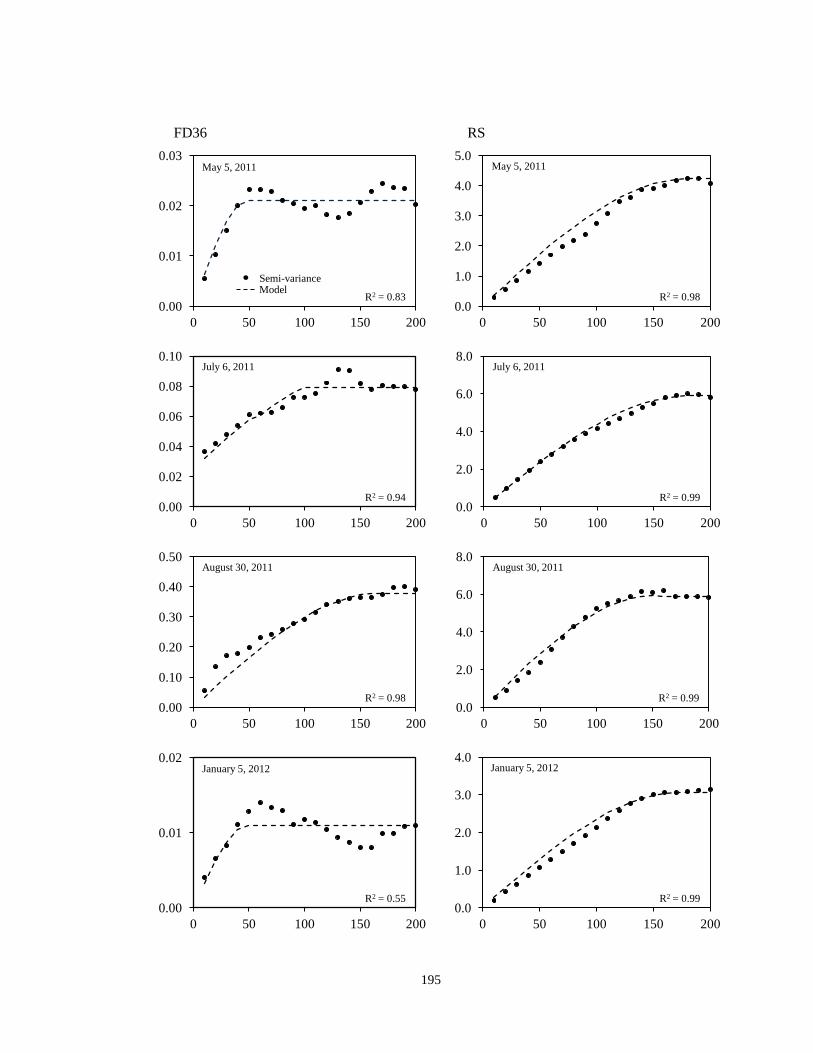
195
FD36 RS
0.00
0.01
0.02
0.03
0 50 100 150 200
May 5, 2011
R2 = 0.83
Semi-variance Model
0.0
1.0
2.0
3.0
4.0
5.0
0 50 100 150 200
May 5, 2011
R2 = 0.98
0.00
0.02
0.04
0.06
0.08
0.10
0 50 100 150 200
July 6, 2011
R2 = 0.94 0.0
2.0
4.0
6.0
8.0
0 50 100 150 200
July 6, 2011
R2 = 0.99
0.00
0.10
0.20
0.30
0.40
0.50
0 50 100 150 200
August 30, 2011
R2 = 0.98 0.0
2.0
4.0
6.0
8.0
0 50 100 150 200
August 30, 2011
R2 = 0.99
0.00
0.01
0.02
0 50 100 150 200
January 5, 2012
R2 = 0.55 0.0
1.0
2.0
3.0
4.0
0 50 100 150 200
January 5, 2012
R2 = 0.99

196
APPENDIX D
Stream, Seep, Groundwater, and Nitrogen Management Data for
Chapter Five
This appendix contains the stream, seep, groundwater, and N management data that are
presented in chapter five. There are six sections in this appendix: 1) nitrate-nitrogen (NO3-N)
concentrations at the seep top and bottom; 2) chloride (Cl-) concentrations at the seep top and
bottom; 3) stream discharge; 4) stream NO3-N concentration; 5) monitoring well NO3-N
concentration; and 6) N management data. The figures in each section are formatted to display the
data and are not meant to show the differences among sampling dates.
Seep Top and Bottom NO3-N Concentrations
The x-axis is time (d) and the y-axis is NO3-N concentration (mg L-1
). The seep top is
where groundwater emerges onto the land surface and the bottom is 0.5 m from the stream.
Seep: 20-S
Seep: 80-S
0
1
2
May Aug Nov Feb May Aug Nov Feb May
2010 2011 2012
Seep top
Seep bottom
0
2
4
6
May Aug Nov Feb May Aug Nov Feb May
2010 2011 2012
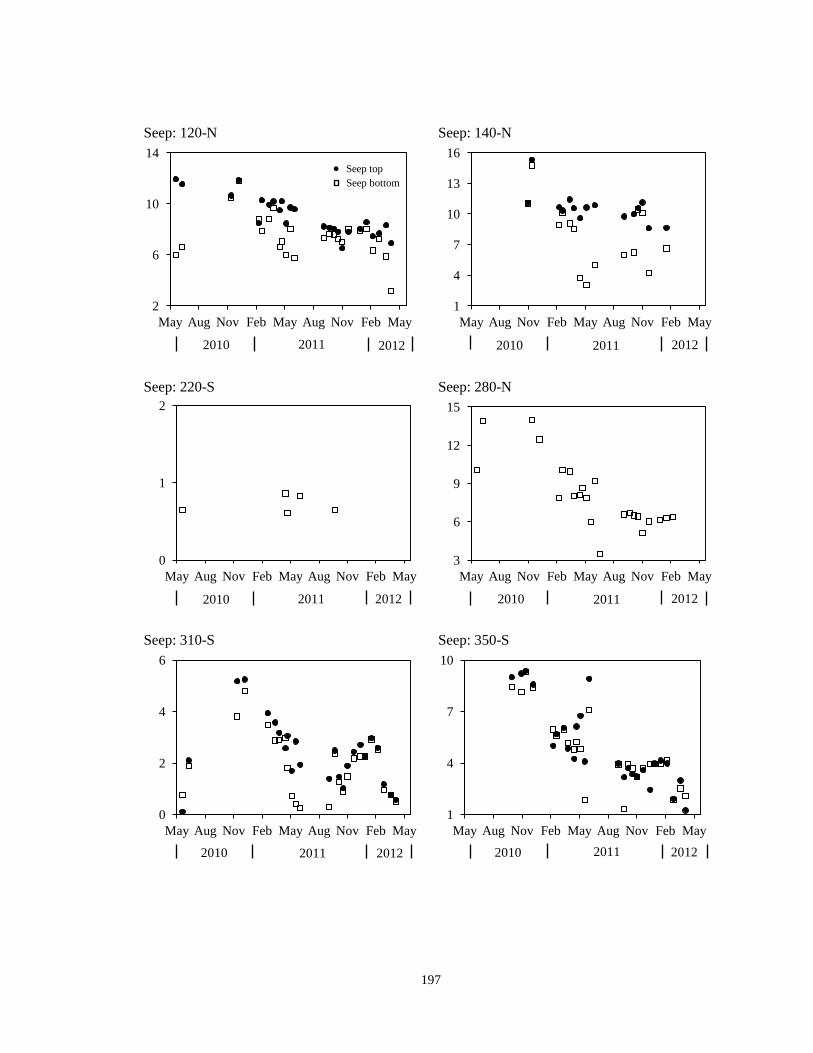
197
Seep: 120-N Seep: 140-N
Seep: 220-S
Seep: 280-N
Seep: 310-S
Seep: 350-S
2
6
10
14
May Aug Nov Feb May Aug Nov Feb May
2010 2011 2012
Seep top
Seep bottom
1
4
7
10
13
16
May Aug Nov Feb May Aug Nov Feb May
2010 2011 2012
0
1
2
May Aug Nov Feb May Aug Nov Feb May
2010 2011 2012
3
6
9
12
15
May Aug Nov Feb May Aug Nov Feb May
2010 2011 2012
0
2
4
6
May Aug Nov Feb May Aug Nov Feb May
2010 2011 2012
1
4
7
10
May Aug Nov Feb May Aug Nov Feb May
2012 2010 2011

198
Rock Drain: 360-S Seep: 430-N
Seep: 460-S
Seep: 470-N
Seep: 490-N
Seep: 530-S
0
2
4
6
8
10
May Aug Nov Feb May Aug Nov Feb May
2010 2011 2012
Seep top
Seep bottom
0
2
4
6
May Aug Nov Feb May Aug Nov Feb May
2010 2011 2012
0
2
4
6
8
May Aug Nov Feb May Aug Nov Feb May
2010 2011 2012
0
2
4
6
8
May Aug Nov Feb May Aug Nov Feb May
2010 2011 2012
4
6
8
10
12
May Aug Nov Feb May Aug Nov Feb May
2010 2011 2012
0
2
4
6
8
May Aug Nov Feb May Aug Nov Feb May
2012 2010 2011
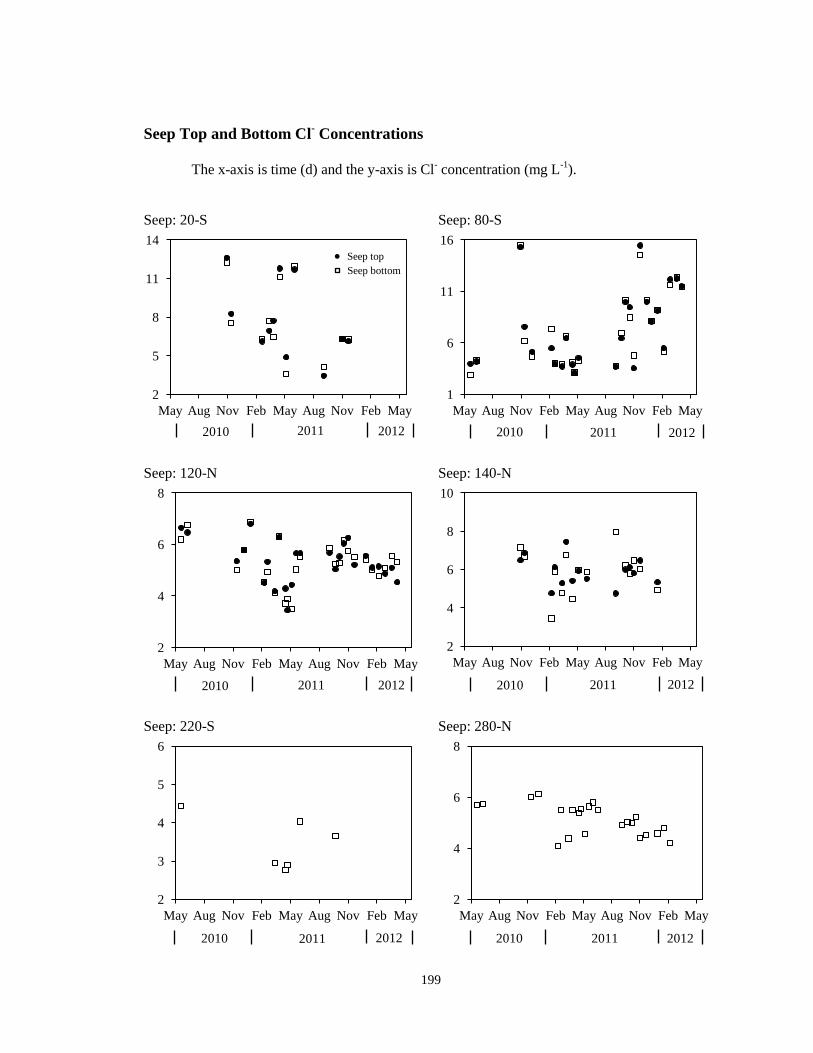
199
Seep Top and Bottom Cl- Concentrations
The x-axis is time (d) and the y-axis is Cl- concentration (mg L
-1).
Seep: 20-S
Seep: 80-S
Seep: 120-N
Seep: 140-N
Seep: 220-S
Seep: 280-N
2
5
8
11
14
May Aug Nov Feb May Aug Nov Feb May
Seep top
Seep bottom
2010 2011 2012
1
6
11
16
May Aug Nov Feb May Aug Nov Feb May
2010 2011 2012
2
4
6
8
May Aug Nov Feb May Aug Nov Feb May
2010 2011 2012
2
4
6
8
10
May Aug Nov Feb May Aug Nov Feb May
2010 2011 2012
2
3
4
5
6
May Aug Nov Feb May Aug Nov Feb May
2010 2011 2012
2
4
6
8
May Aug Nov Feb May Aug Nov Feb May
2010 2011 2012

200
Seep: 310-S Seep: 350-S
Rock Drain: 360-S
Seep: 430-N
Seep: 460-S
Seep: 470-N
3
5
7
9
11
13
May Aug Nov Feb May Aug Nov Feb May
2010 2011 2012
Seep top
Seep bottom
4
7
10
13
16
19
May Aug Nov Feb May Aug Nov Feb May
2010 2011 2012
0
3
6
9
12
May Aug Nov Feb May Aug Nov Feb May
2010 2011 2012
0
2
4
6
May Aug Nov Feb May Aug Nov Feb May
2010 2011 2012
0
4
8
12
16
20
May Aug Nov Feb May Aug Nov Feb May
2010 2011 2012
0
3
6
9
May Aug Nov Feb May Aug Nov Feb May
2010 2011 2012

201
Seep: 490-N Seep: 530-S
Stream Discharge
The x-axis is time (d) and the y-axis is stream discharge (m3 s
-1). Stream discharge is
collected every five minutes with recording H-flumes. The five minute data was used to calculate
daily average discharge for each flume. A large storm on September 7, 2011 destroyed flumes 2
and 3; therefore, no data was recorded until they could be fixed in April 2012. Also, flumes 2, 3,
and 4 often freeze during the winter; thus, the data collected is not accurate and has been
removed. Seep sampling dates are labeled on the figure for flume 1.
Flume 1
4
6
8
10
May Aug Nov Feb May Aug Nov Feb May
2010 2011 2012
Seep top
Seep bottom
5
10
15
20
25
30
May Aug Nov Feb May Aug Nov Feb May
2010 2011 2012
1E-07
1E-06
1E-05
0.0001
0.001
0.01
0.1
10-7
10-6
10-5
10-4
10-3
10-2
10-1
Str
eam
dis
char
ge
(m3 s
-1)
May Aug Nov Feb May Aug Nov Feb May
2010 2011 2012
Seep sample collected

202
Flume 2
Flume 3
Flume 4
1E-07
1E-06
1E-05
0.0001
0.001
0.01
0.1
10-7
10-6
10-5
10-4
10-3
10-2
10-1
Str
eam
dis
char
ge
(m3 s
-1)
May Aug Nov Feb May Aug Nov Feb May
2010 2011 2012
Fro
zen
Dam
aged
Flu
me
1E-07
1E-06
1E-05
0.0001
0.001
0.01
0.1
Dam
aged
Flu
me
Fro
zen
10-7
10-6
10-5
10-4
10-3
10-2
10-1
Str
eam
dis
char
ge
(m3 s
-1)
May Aug Nov Feb May Aug Nov Feb May
2010 2011 2012
1E-07
1E-06
1E-05
0.0001
0.001
0.01
0.1
Fro
zen
10-7
10-6
10-5
10-4
10-3
10-2
10-1
Str
eam
dis
char
ge
(m3 s
-1)
May Aug Nov Feb May Aug Nov Feb May
2010 2011 2012
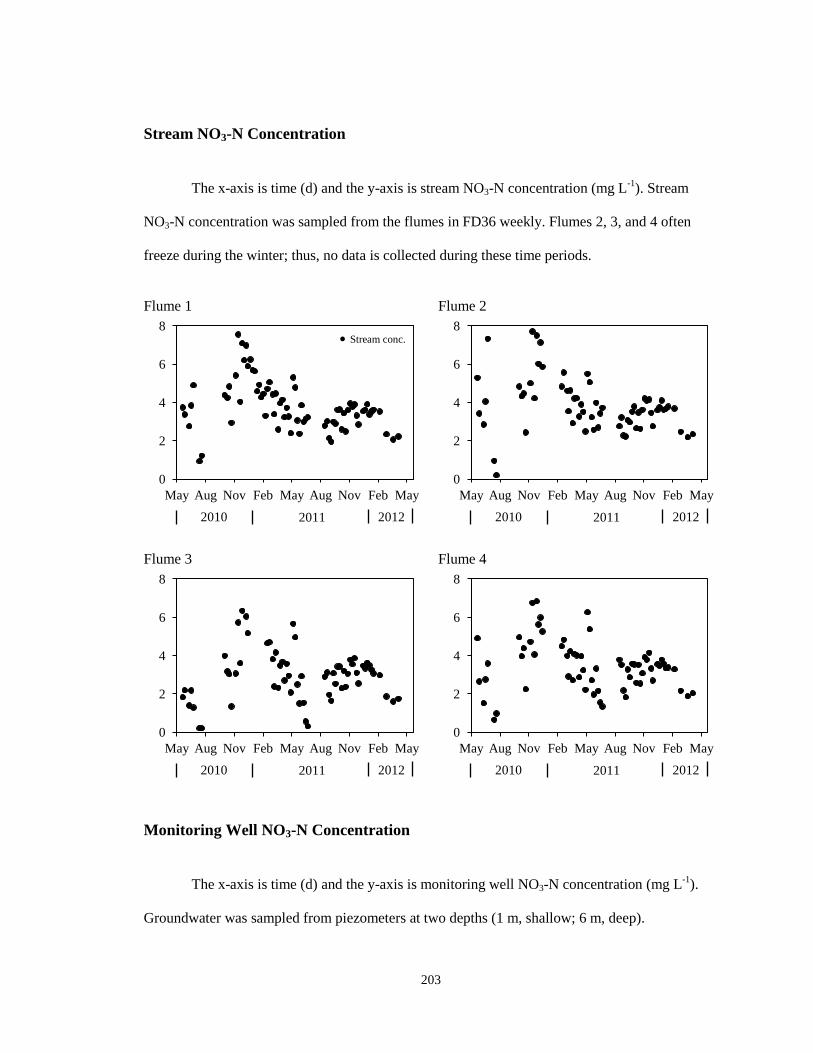
203
Stream NO3-N Concentration
The x-axis is time (d) and the y-axis is stream NO3-N concentration (mg L-1
). Stream
NO3-N concentration was sampled from the flumes in FD36 weekly. Flumes 2, 3, and 4 often
freeze during the winter; thus, no data is collected during these time periods.
Flume 1
Flume 2
Flume 3
Flume 4
Monitoring Well NO3-N Concentration
The x-axis is time (d) and the y-axis is monitoring well NO3-N concentration (mg L-1
).
Groundwater was sampled from piezometers at two depths (1 m, shallow; 6 m, deep).
0
2
4
6
8
May Aug Nov Feb May Aug Nov Feb May
2010 2011 2012
Stream conc.
0
2
4
6
8
May Aug Nov Feb May Aug Nov Feb May
2010 2011 2012
0
2
4
6
8
May Aug Nov Feb May Aug Nov Feb May
2010 2011 2012
0
2
4
6
8
May Aug Nov Feb May Aug Nov Feb May
2010 2011 2012

204
Piezometer nest 1
Piezometer nest 2
Piezometer nest 3
Piezometer nest 4
Piezometer nest 5
0
1
2
3
4
5
May Aug Nov Feb May Aug Nov Feb May
2010 2011 2012
Deep groundwater
Shallow groundwater
0
1
2
3
4
5
May Aug Nov Feb May Aug Nov Feb May
2010 2011 2012
0
2
4
6
8
May Aug Nov Feb May Aug Nov Feb May
2010 2011 2012
0
2
4
6
8
10
12
May Aug Nov Feb May Aug Nov Feb May
2010 2011 2012
0
1
2
3
May Aug Nov Feb May Aug Nov Feb May
2010 2011 2012
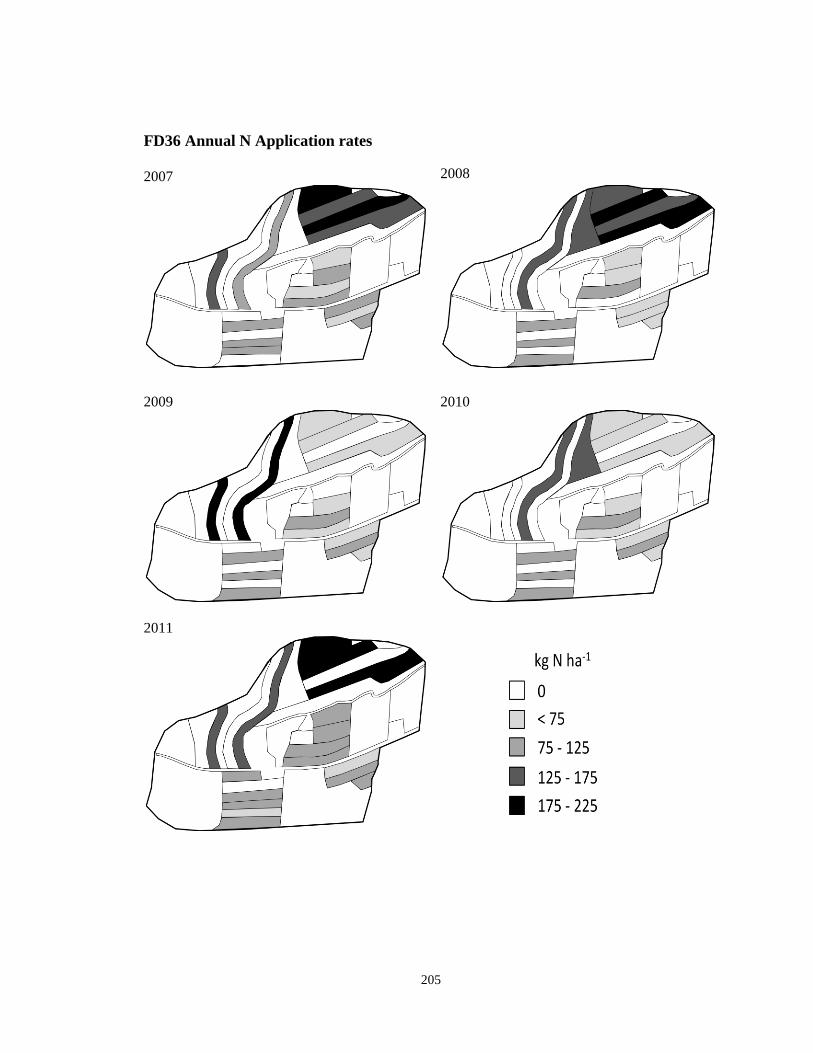
205
FD36 Annual N Application rates
2007
2008
2009
2010
2011
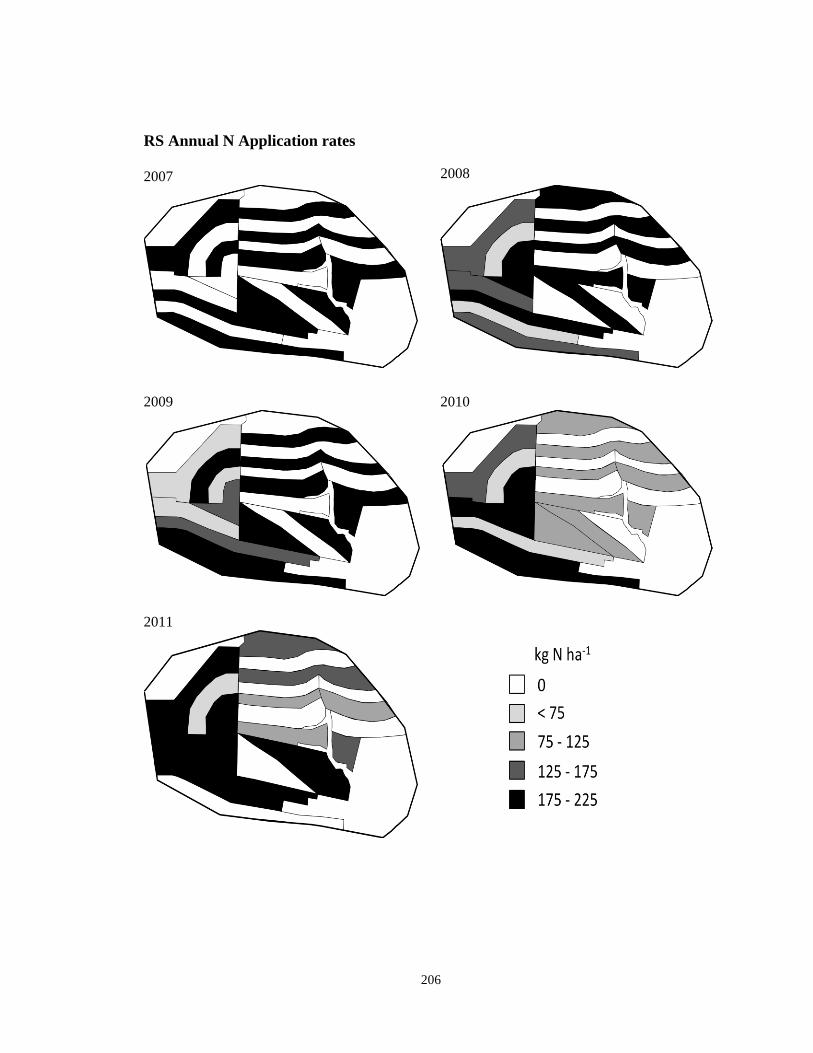
206
RS Annual N Application rates
2007
2008
2009
2010
2011

207
Curriculum Vitae
MARK R.WILLIAMS
EDUCATION
Doctor of Philosophy in Agricultural and Biological Engineering, The Pennsylvania State
University, Department of Agricultural and Biological Engineering, University Park, PA,
2013. DISSERTATION: Spatial and Temporal Variability of Nitrogen Transport in Riparian
Zone Seeps
Master of Science in Agricultural and Biological Engineering, The Pennsylvania State
University, Department of Agricultural and Biological Engineering, University Park, PA,
2010. THESIS: Manure Application Under Winter Conditions
Bachelor of Science in Environmental Resource Management, The Pennsylvania State
University, University Park, PA, 2008. SPECIALIZATION: Soil Science and Watershed and
Water Resources Management
PROFESSIONAL AND ACADEMIC EXPERIENCE
Postdoctoral Research Agricultural Engineer, USDA-ARS, Soil Drainage Research Unit,
Columbus, OH, starting June 2013
Graduate Research Assistant, The Pennsylvania State University, Department of Agricultural
and Biological Engineering, University Park, PA, 2010-2013
Student Laboratory Technician, USDA-Agricultural Research Service, University Park, PA,
2010
Graduate Teaching Assistant, The Pennsylvania State University, Department of Agricultural
and Biological Engineering, University Park, PA, 2008-2010
Student Waste Handler, The Pennsylvania State University, Department of Environmental
Health and Safety, 2006-2009.
PUBLICATIONS
Williams, M.R., G.W. Feyereisen, D.B. Beegle, and R.D. Shannon. 2012. Soil temperature
regulates phosphorus loss from lysimeters following fall and winter manure application.
Transactions of the ASABE 55(3): 871-880.
Williams, M.R., G.W. Feyereisen, D.B. Beegle, and R.D. Shannon. 2012. Soil temperature
regulates nitrogen loss from lysimeters following fall and winter manure application.
Transactions of the ASABE 55(3): 861-870.
Williams, M.R., G.W. Feyereisen, D.B. Beegle, R.D. Shannon, G.J. Folmar, and R.B. Bryant.
2011. Manure application under winter conditions: nutrient runoff and leaching losses.
Transactions of the ASABE 54(3): 891-899.
Williams, M.R., G.W. Feyereisen, G.J. Folmar, and H.S. Lin. 2010. Experimental system for
simulating a natural soil temperature profile during freeze-thaw cycles. Applied Engineering
in Agriculture 26(5): 843-848.