Embed Size (px)
Citation preview
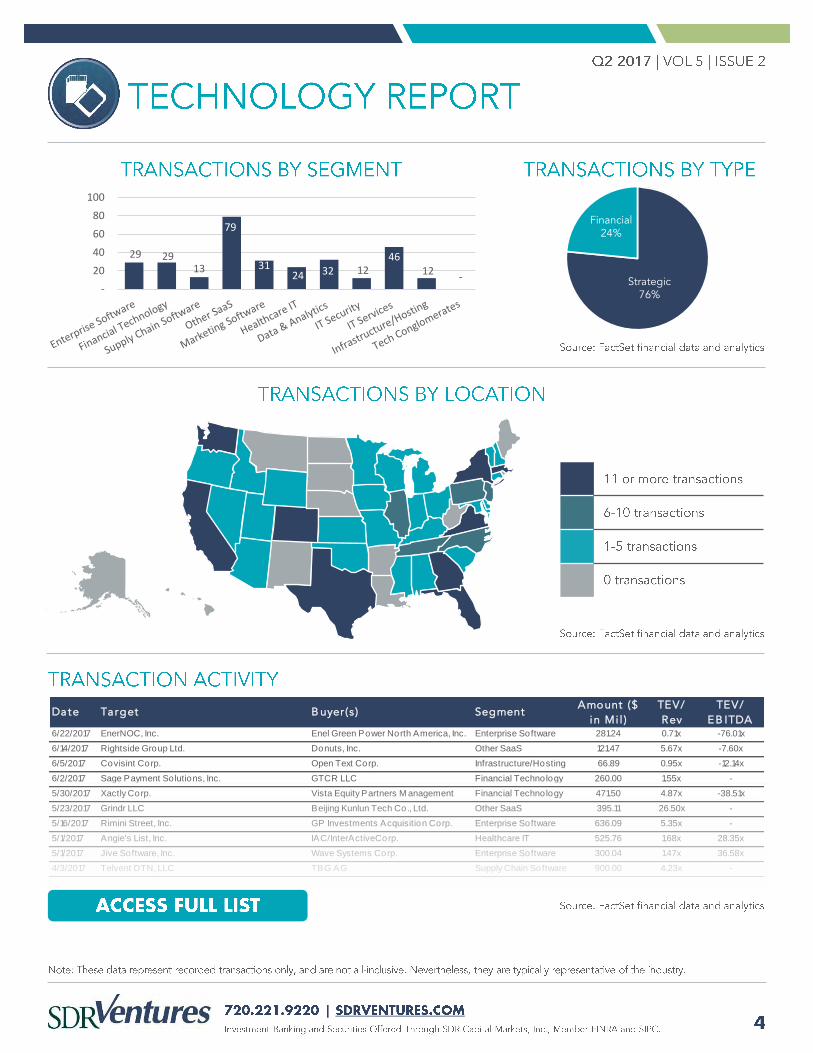
Date Target B uyer (s ) SegmentAmount ($
in Mi l )
TEV/
Rev
TEV/
EB ITDA6/22/2017 EnerNOC, Inc. Enel Green Power North America, Inc. Enterprise Software 281.24 0.71x -76.01x
6/14/2017 Rightside Group Ltd. Donuts, Inc. Other SaaS 121.47 5.67x -7.60x
6/5/2017 Covisint Corp. Open Text Corp. Infrastructure/Hosting 66.89 0.95x -12.14x
6/2/2017 Sage Payment Solutions, Inc. GTCR LLC Financial Technology 260.00 1.55x -
5/30/2017 Xactly Corp. Vista Equity Partners M anagement
LLC
Financial Technology 471.50 4.87x -38.51x
5/23/2017 Grindr LLC Beijing Kunlun Tech Co., Ltd. Other SaaS 395.11 26.50x -
5/16/2017 Rimini Street, Inc. GP Investments Acquisition Corp. Enterprise Software 636.09 5.35x -
5/1/2017 Angie's List, Inc. IAC/InterActiveCorp. Healthcare IT 525.76 1.68x 28.35x
5/1/2017 Jive Software, Inc. Wave Systems Corp. Enterprise Software 300.04 1.47x 36.58x
4/3/2017 Telvent DTN, LLC TBG AG Supply Chain Software 900.00 4.23x -
29 29 13
79
31 24 32 12
46 12
- -
20
40
60
80
100
Strategic76%
Financial24%

Strategic Buyer Inv. Date Select Corporate AcquisitionsAccenture plc (NYSE:ACN) 06/07/2017 ▪ Phase One Consulting Group, Inc.
06/02/2017 ▪ SolutionsIQ, Inc.
05/15/2017 ▪ Media Hive LLC
09/26/2016 ▪ DayNine Consulting, Inc.
Alphabet Inc. (NasdaqGS:GOOGL) 03/08/2017 ▪ Kaggle, Inc.
01/18/2017 ▪ Fabric
12/13/2016 ▪ Cronologics Corp.
11/21/2016 ▪ Qwiklabs, Inc.
10/25/2016 ▪ Eyefluence, Inc.
09/08/2016 ▪ Apigee Corporation (NasdaqGS:APIC)
08/08/2016 ▪ Orbitera Inc.
07/12/2016 ▪ FortyTwo Inc.
07/07/2016 ▪ Anvato Inc.
Cisco Systems, Inc. (NasdaqGS:CSCO) 05/11/2017 ▪ MindMeld, Inc.
05/01/2017 ▪ Viptela, Inc.
10/17/2016 ▪ Heroik Labs, Inc.
08/30/2016 ▪ ContainerX, Inc.
Oracle Corporation (NYSE:ORCL) 04/18/2017 ▪ Oracle Corp.
01/19/2017 ▪ Apiary, Inc.
11/21/2016 ▪ Dynamic Network Services, Inc.
09/18/2016 ▪ Palerra, Inc.
09/06/2016 ▪ LogFire, Inc
Salesforce.com, inc. (NYSE:CRM) 12/13/2016 ▪ Twin Prime, Inc.
11/01/2016 ▪ Krux Digital, Inc.
10/03/2016 ▪ Krux Digital, Inc.
09/07/2016 ▪ HeyWire, Inc.
08/15/2016 ▪ BeyondCore, Inc.
Financial Buyer Inv. Date Select Corporate InvestmentsInsight Venture Management LLC 06/20/2017 ▪ OptionsCity Software, Inc.
05/24/2017 ▪ Resolve Systems LLC
05/09/2017 ▪ Zyme Solutions, Inc.
02/13/2017 ▪ Steelwedge Software, Inc.
11/08/2016 ▪ Cyber Algorithms
10/31/2016 ▪ Ministry Brands LLC
KKR & Co. LP 03/20/2017 ▪ Communication Cable Co.
02/16/2017 ▪ RedTail Solutions, Inc.
12/06/2016 ▪ Optiv Security, Inc.
11/17/2016 ▪ Latitude Technologies LLC
08/29/2016 ▪ Calabrio, Inc.
07/05/2016 ▪ Epicor Software Corporation
The Carlyle Group LP 12/21/2016 ▪ Veris Group LLC
10/21/2016 ▪ Kroll Ontrack, Inc.
10/17/2016 ▪ ProKarma, Inc.
10/06/2016 ▪ Reval Holdings, Inc.
08/15/2016 ▪ NetMotion Wireless, Inc.
Thoma Bravo LLC 06/14/2017 ▪ Continuum Managed Services LLC
05/03/2017 ▪ Lexmark International, Inc. /Enterprise Software Business/
02/16/2017 ▪ Data3Sixty, Inc.
01/19/2017 ▪ PlanView, Inc.
12/06/2016 ▪ Standardware, Inc.
09/29/2016 ▪ T2 Systems, Inc.
07/13/2016 ▪ Imprivata, Inc. (NYSE:IMPR)
Vista Equity Partners 06/29/2017 ▪ Scoutit, Inc.
05/30/2017 ▪ Xactly Corp.
05/30/2017 ▪ Lithium Technologies, Inc.
05/15/2017 ▪ Quest Software, Inc. (Oklahoma)
04/26/2017 ▪ OmniEarth, Inc.
04/25/2017 ▪ RiskMatch LLC
04/19/2017 ▪ ToutApp, Inc.

Company Name SymbolMarket Cap
($ in Mil)Price ($)
Quarter
Change
YTD
Change
% of 52
Week High
Est.
Revenue
Growth
EBITDA
Margin
TEV/
Rev
TEV/
EBITDA
TEV/
NTM
Revenue
TEV/
NTM
EBITDA
Visa, Inc. V-US 211,234$ 93.78$ 5.4% 20.2% 97.1% 14.2% 65.7% 13.6x 19.6x 12.4x 17.5x
Mastercard, Inc. MA-US 127,999 121.45 7.8% 17.6% 96.2% 15.2% 60.0% 11.5x 19.8x 10.1x 17.4x
American Express Co. AXP-US 75,292 84.24 6.4% 13.7% 98.7% (0.4%) 36.3% 3.0x 8.7x 3.0x NM
Fidelity National Information Services, Inc. FIS-US 28,232 85.40 6.7% 12.9% 97.8% 3.5% 30.1% 4.0x 12.6x 3.9x 11.7x
Fiserv, Inc. FISV-US 25,982 122.34 5.5% 15.1% 96.3% 6.6% 33.8% 5.4x 16.1x 5.2x 14.6x
MSCI, Inc. MSCI-US 9,325 102.99 6.5% 30.7% 94.2% 10.1% 50.0% 9.1x 18.2x 8.4x 16.2x
The Western Union Co. WU-US 8,977 19.05 -7.0% -12.3% 83.9% 1.0% 23.7% 2.1x 8.2x 2.1x 8.7x
Jack Henry & Associates, Inc. JKHY-US 8,066 103.87 10.6% 17.0% 97.6% 7.1% 35.0% 5.7x 16.0x 5.3x 15.2x
Black Knight Financial Services, Inc. BKFS-US 2,860 40.95 6.8% 8.3% 97.0% 8.9% 43.6% 5.2x 11.9x 7.7x 16.1x
Envestnet, Inc. ENV-US 1,736 39.60 24.7% 12.3% 95.5% 17.1% 7.9% 3.3x 36.8x 2.8x 13.9x
Q2 Holdings, Inc. QTWO-US 1,513 36.95 5.0% 28.1% 91.2% 36.4% (6.9%) 8.9x NM 6.5x 102.1x
Bottomline Technologies, Inc. EPAY-US 1,040 25.69 8.9% 2.7% 90.6% 8.2% 10.9% 3.1x 34.5x 2.7x 12.2x
10.7% 32.5% 6.2x 18.4x 5.8x 22.3x8.6% 34.4% 5.3x 16.1x 5.3x 15.2x
Market Stats Operating Stats LTM Multiples NTM Multiples
Company Name SymbolMarket Cap
($ in Mil)Price ($)
Quarter
Change
YTD
Change
% of 52
Week High
Est.
Revenue
Growth
EBITDA
Margin
TEV/
Rev
TEV/
EBITDA
TEV/
NTM
Revenue
TEV/
NTM
EBITDA
Manhattan Associates, Inc. MANH-US 3,337$ 48.06$ -6.2% -9.4% 70.7% 5.5% 30.7% 5.4x 16.0x 5.2x 14.4x
The Descartes Systems Group, Inc. DSG-CA 1,846 24.29 4.3% 10.2% 95.5% 15.6% 32.9% 8.4x 25.5x 7.3x 20.6x
Kinaxis, Inc. KXS-CA 1,572 62.17 8.8% 29.2% 91.0% 31.2% 16.8% 11.6x 74.4x 9.2x 35.1x
SPS Commerce, Inc. SPSC-US 1,096 63.76 10.2% -8.8% 85.2% 18.8% 12.1% 4.7x 44.7x 4.0x 26.8x
American Software, Inc. AMSWA-US 278 10.29 -4.2% -0.4% 85.1% 4.3% NM 2.0x 14.1x 2.0x 11.9x
15.1% 23.1%15.6% 23.7%
Market Stats Operating Stats LTM Multiples NTM Multiples
Company Name SymbolMarket Cap
($ in Mil)Price ($)
Quarter
Change
YTD
Change
% of 52
Week High
Est.
Revenue
Growth
EBITDA
Margin
TEV/
Rev
TEV/
EBITDA
TEV/
NTM
Revenue
TEV/
NTM
EBITDA
Paychex, Inc. PAYX-US 20,464$ 56.94$ -3.7% -6.5% 90.3% 5.6% 42.0% 6.4x 14.7x 6.1x 13.9x
Workday, Inc. WDAY-US 12,717 97.00 15.9% 46.8% 92.6% 33.0% (5.9%) 10.8x NM 8.0x 52.9x
The Ultimate Software Group, Inc. ULTI-US 6,242 210.06 8.0% 15.2% 93.1% 30.3% 4.9% 7.5x 95.5x 5.9x 24.0x
Paycom Software, Inc. PAYC-US 4,065 68.41 19.6% 50.4% 92.9% 34.1% 35.9% 11.2x 48.3x 8.2x 29.0x
Paylocity Holding Corp. PCTY-US 2,327 45.18 16.4% 50.5% 91.0% 30.6% 22.7% 7.8x 91.3x 6.3x 35.4x
Cornerstone OnDemand, Inc. CSOD-US 2,031 35.75 -8.3% -15.5% 74.9% 19.1% (3.4%) 4.6x NM 3.8x 29.1x
Benefitfocus, Inc. BNFT-US 1,128 36.35 33.9% 22.4% 80.8% 19.5% (1.0%) 4.9x NM 4.0x 50.8x
Xactly Corp. XTLY-US 504 15.65 34.9% 42.3% 97.2% 26.5% (12.5%) 4.8x NM 3.8x NM
24.8% 10.3%28.4% 2.0%
Market Stats Operating Stats LTM Multiples NTM Multiples
Company Name SymbolMarket Cap
($ in Mil)Price ($)
Quarter
Change
YTD
Change
% of 52
Week High
Est.
Revenue
Growth
EBITDA
Margin
TEV/
Rev
TEV/
EBITDA
TEV/
NTM
Revenue
TEV/
NTM
EBITDA
Oracle Corp. ORCL-US 207,413$ 50.14$ 12.2% 30.4% 96.7% 4.5% 45.2% 5.3x 12.7x 5.2x 11.1x
International Business Machines Corp. IBM-US 144,523 153.83 -11.5% -7.3% 84.2% (1.5%) 12.4% 2.2x 11.2x 2.3x 9.6x
Adobe Systems, Inc. ADBE-US 69,787 141.44 9.1% 37.4% 95.9% 23.8% 32.5% 10.3x 31.8x 8.4x 20.3x
Intuit, Inc. INTU-US 34,028 132.81 14.9% 15.9% 92.4% 8.7% 59.1% 6.5x 20.9x 6.0x 15.3x
Constellation Software, Inc. CSU-CA 11,070 522.38 4.0% 11.2% 95.8% 15.0% 23.8% 4.9x 19.4x 4.3x 16.5x
The Sage Group Plc SGE-GB 9,660 8.94 8.4% 5.0% 90.0% 5.4% 27.3% 4.7x 15.8x 4.3x 14.8x
TOTVS SA TOTS3-BR 1,508 9.10 10.6% 25.5% 87.0% 5.5% 16.1% 2.4x 15.0x 2.3x 13.2x
8.8% 30.9% 5.2x 18.1x 4.7x 14.4x5.5% 27.3% 4.9x 15.8x 4.3x 14.8x
Market Stats Operating Stats LTM Multiples NTM Multiples

Company Name SymbolMarket Cap
($ in Mil)Price ($)
Quarter
Change
YTD
Change
% of 52
Week High
Est.
Revenue
Growth
EBITDA
Margin
TEV/
Rev
TEV/
EBITDA
TEV/
NTM
Revenue
TEV/
NTM
EBITDA
ServiceNow, Inc. NOW-US 18,007$ 106.00$ 21.9% 42.6% 95.8% 43.4% (4.1%) 11.7x NM 8.1x 34.7x
Snap, Inc. SNAP-US 12,122 17.77 -20.1% NM 60.4% 182.2% (1471.0%) 34.4x NM 9.4x (23.4x)
LogMeIn, Inc. LOGM-US 5,505 104.50 6.5% 8.2% 84.3% 144.3% 18.0% 11.8x 65.7x 4.0x 10.9x
Guidewire Software, Inc. GWRE-US 5,111 68.71 22.1% 39.3% 97.7% 25.8% 1.2% 9.8x 184.9x 7.7x 37.6x
Atlassian Corp. Plc TEAM-US 3,123 35.18 17.9% 46.1% 92.8% 41.1% (2.9%) 13.0x 3904.3x 9.1x 38.8x
RealPage, Inc. RP-US 2,972 35.95 3.0% 19.8% 94.0% 18.1% 16.1% 5.0x 31.9x 4.1x 16.1x
Zendesk, Inc. ZEN-US 2,749 27.78 0.8% 31.0% 87.2% 43.3% (20.7%) 7.4x NM 5.1x 124.0x
Xero Ltd. XRO-NZ 2,543 18.45 30.6% 44.0% 96.6% 52.9% (1.9%) 11.3x NM 7.4x NM
RingCentral, Inc. RNG-US 2,277 36.55 32.2% 77.4% 93.7% 35.2% (3.1%) 6.4x NM 4.7x 68.5x
Alarm.com Holdings, Inc. ALRM-US 1,743 37.63 25.4% 35.2% 97.7% 26.8% 10.2% 6.3x 77.4x 5.3x 25.1x
Ebix, Inc. EBIX-US 1,700 53.90 -11.6% -5.5% 82.8% 21.6% 36.6% 6.2x 16.7x 5.1x 15.5x
Five9, Inc. FIVN-US 1,172 21.52 33.2% 51.7% 86.8% 22.6% (4.8%) 6.8x 709.3x 5.5x 76.2x
MINDBODY, Inc. MB-US 1,071 27.20 -1.3% 27.7% 91.4% 36.2% (3.3%) 7.8x NM 5.1x 95.6x
Instructure, Inc. INST-US 853 29.50 30.0% 50.9% 98.0% 43.5% (33.6%) 6.7x NM 4.6x NM
Workiva, Inc. WK-US 582 19.05 22.5% 39.6% 94.5% 17.9% (9.8%) 4.0x NM 3.4x NM
AppFolio, Inc. APPF-US 401 32.60 18.5% 36.7% 92.6% 36.5% 11.2% 9.4x 163.9x 7.1x NM
Model N, Inc. MODN-US 383 13.30 30.4% 50.3% 95.9% 21.7% (32.2%) 3.3x NM 2.7x NM
Castlight Health, Inc. CSLT-US 316 4.15 10.7% -16.2% 75.5% 41.3% (51.6%) 4.1x NM 2.2x NM
47.5% (85.9%)36.3% (3.2%)
Market Stats Operating Stats LTM Multiples NTM Multiples
Company Name SymbolMarket Cap
($ in Mil)Price ($)
Quarter
Change
YTD
Change
% of 52
Week High
Est.
Revenue
Growth
EBITDA
Margin
TEV/
Rev
TEV/
EBITDA
TEV/
NTM
Revenue
TEV/
NTM
EBITDA
Adobe Systems, Inc. ADBE-US 69,787$ 141.44$ 9.1% 37.4% 95.9% 23.8% 32.5% 10.3x 31.8x 8.4x 20.3x
salesforce.com, inc. CRM-US 61,602 86.60 4.9% 26.5% 94.1% 25.3% 7.4% 6.9x 87.0x 5.4x 24.3x
Criteo SA CRTO-US 2,987 49.05 -3.2% 19.4% 87.6% (45.3%) 8.0% 1.6x 16.5x 3.0x 9.3x
HubSpot, Inc. HUBS-US 2,404 65.75 13.0% 39.9% 83.8% 37.3% (5.7%) 7.8x NM 5.6x 123.9x
Callidus Software, Inc. CALD-US 1,570 24.20 16.9% 44.0% 97.4% 23.3% (2.8%) 6.4x NM 5.1x 39.2x
Bazaarvoice, Inc. BV-US 417 4.95 13.8% 2.1% 80.7% 1.0% 2.9% 1.8x 93.0x 1.7x 15.1x
ChannelAdvisor Corp. ECOM-US 304 11.55 3.6% -19.5% 72.6% 13.8% (22.3%) 2.1x NM 1.8x 27.0x
11.3% 2.9%23.3% 2.9%
Market Stats Operating Stats LTM Multiples NTM Multiples
Company Name SymbolMarket Cap
($ in Mil)Price ($)
Quarter
Change
YTD
Change
% of 52
Week High
Est.
Revenue
Growth
EBITDA
Margin
TEV/
Rev
TEV/
EBITDA
TEV/
NTM
Revenue
TEV/
NTM
EBITDA
Cerner Corp. CERN-US 21,957$ 66.47$ 12.3% 40.3% 95.9% 10.0% 30.1% 4.5x 14.7x 4.1x 12.4xVeeva Systems, Inc. VEEV-US 6,669 61.31 20.6% 50.6% 90.1% 24.1% 25.8% 13.7x 57.1x 11.9x 36.7xathenahealth, Inc. ATHN-US 5,599 140.55 25.0% 33.6% 94.0% 17.7% 13.5% 5.2x 32.0x 4.4x 19.5xMedidata Solutions, Inc. MDSO-US 4,564 78.20 37.2% 57.4% 95.8% 24.2% 13.3% 9.2x 61.1x 7.4x 29.2xAllscripts Healthcare Solutions, Inc. MDRX-US 2,315 12.76 0.7% 25.0% 84.1% 9.3% 14.6% 2.5x 15.9x 2.2x 10.9xHMS Holdings Corp. HMSY-US 1,552 18.50 -8.0% 1.9% 77.1% 23.9% 14.5% 3.2x 15.3x 2.7x 11.1xQuality Systems, Inc. QSII-US 1,079 17.21 13.4% 30.9% 98.1% 3.4% 13.9% 2.1x 13.3x 2.0x 12.8xInovalon Holdings, Inc. INOV-US 832 13.15 7.1% 27.7% 65.6% 7.3% 17.4% 3.8x 20.8x 3.5x 14.4x
15.0% 17.9%13.8% 14.5%
Market Stats Operating Stats LTM Multiples NTM Multiples

Company Name SymbolMarket Cap
($ in Mil)Price ($)
Quarter
Change
YTD
Change
% of 52
Week High
Est.
Revenue
Growth
EBITDA
Margin
TEV/
Rev
TEV/
EBITDA
TEV/
NTM
Revenue
TEV/
NTM
EBITDA
Splunk, Inc. SPLK-US 7,872$ 56.89$ -9.2% 11.2% 82.2% 31.7% (36.4%) 6.7x NM 5.1x 42.6xPegasystems, Inc. PEGA-US 4,501 58.35 32.8% 62.1% 90.0% 15.7% 16.7% 5.5x 53.5x 5.0x 29.7xTeradata Corp. TDC-US 3,860 29.49 -5.7% 8.5% 88.5% (8.0%) 10.0% 1.4x 7.0x 1.6x 9.1xTableau Software, Inc. DATA-US 3,673 61.27 25.1% 45.4% 91.3% 6.7% (20.0%) 4.5x NM 4.2x 61.6xVerint Systems, Inc. VRNT-US 2,551 40.70 -7.6% 15.5% 91.1% 8.4% 8.8% 2.7x 19.1x 2.5x 10.9xMicroStrategy, Inc. MSTR-US 1,803 191.67 1.8% -2.9% 92.5% 2.9% 19.2% 3.1x 12.7x 3.0x 11.5xPROS Holdings, Inc. PRO-US 861 27.39 15.6% 27.3% 89.8% 12.0% (39.0%) 5.8x NM 5.1x NMInovalon Holdings, Inc. INOV-US 832 13.15 7.1% 27.7% 65.6% 7.3% 17.4% 3.8x 20.8x 3.5x 14.4xHortonworks, Inc. HDP-US 813 12.88 32.4% 55.0% 91.5% 36.0% (93.1%) 3.7x NM 2.6x 67.3xAlteryx, Inc. AYX-US 202 19.52 29.9% NM 95.2% NM (15.6%) 11.4x NM 3.6x NM
12.5% (13.2%)8.4% (3.4%)
Market Stats Operating Stats LTM Multiples NTM Multiples
Company Name SymbolMarket Cap
($ in Mil)Price ($)
Quarter
Change
YTD
Change
% of 52
Week High
Est.
Revenue
Growth
EBITDA
Margin
TEV/
Rev
TEV/
EBITDA
TEV/
NTM
Revenue
TEV/
NTM
EBITDA
International Business Machines Corp. IBM-US 144,523$ 153.83$ -11.5% -7.3% 84.2% (1.5%) 12.4% 2.2x 11.2x 2.3x 9.6xCognizant Technology Solutions Corp. CTSH-US 39,109 66.40 12.1% 18.5% 97.4% 11.3% 18.4% 2.6x 13.5x 2.4x 12.1xCGI Group, Inc. GIB.A-CA 13,436 51.02 2.6% 2.8% 98.0% 5.0% 17.8% 2.0x 10.9x 1.9x 10.3xLeidos Holdings, Inc. LDOS-US 7,807 51.69 0.7% 1.1% 91.2% 25.7% 9.6% 1.3x 14.0x 1.1x 10.8xBooz Allen Hamilton Holding Corp. BAH-US 4,827 32.54 -8.0% -9.8% 82.0% 7.5% 9.2% 1.1x 11.4x 1.0x 10.7xEPAM Systems, Inc. EPAM-US 4,359 84.09 10.8% 30.8% 96.7% 27.0% 11.8% 3.3x 24.8x 2.7x 14.6xTeradata Corp. TDC-US 3,860 29.49 -5.7% 8.5% 88.5% (8.0%) 10.0% 1.4x 7.0x 1.6x 9.1xInterXion Holding NV INXN-US 3,251 45.78 17.2% 30.5% 98.1% 19.9% 42.6% 8.4x 19.3x 7.0x 15.4xCACI International, Inc. CACI-US 3,058 125.05 5.8% 0.6% 92.4% 2.4% 7.9% 1.0x 11.5x 1.0x 11.1xManTech International Corp. MANT-US 1,060 41.38 19.8% -2.1% 90.9% 5.1% 7.7% 0.9x 12.1x 0.9x 11.6xVirtusa Corp. VRTU-US 885 29.40 -1.9% 17.0% 84.2% 11.8% 6.1% 1.1x 32.9x 1.0x 11.9xUnisys Corp. UIS-US 645 12.80 -9.5% -14.4% 76.6% (1.7%) 8.4% 0.2x 2.1x 0.2x 1.7xThe Hackett Group, Inc. HCKT-US 453 15.50 -18.9% -12.2% 74.9% 1.0% 12.6% 1.5x 11.4x 1.7x 9.6xServiceSource International, Inc. SREV-US 344 3.88 2.4% -31.7% 62.1% (0.9%) (8.0%) 1.2x NM 1.2x 14.7x
7.5% 11.9%5.0% 9.8%
Market Stats Operating Stats LTM Multiples NTM Multiples
Company Name SymbolMarket Cap
($ in Mil)Price ($)
Quarter
Change
YTD
Change
% of 52
Week High
Est.
Revenue
Growth
EBITDA
Margin
TEV/
Rev
TEV/
EBITDA
TEV/
NTM
Revenue
TEV/
NTM
EBITDA
Cisco Systems, Inc. CSCO-US 156,502$ 31.30$ -7.2% 3.6% 90.5% (0.5%) 31.9% 2.5x 8.0x 2.5x 7.2xCheck Point Software Technologies Ltd. CHKP-US 17,828 109.08 5.8% 29.1% 94.1% 9.4% 49.3% 9.2x 18.7x 8.7x 16.1xSymantec Corp. SYMC-US 17,183 28.25 -7.8% 18.3% 85.0% 30.0% 12.7% 5.3x 25.7x 4.1x 8.7xPalo Alto Networks, Inc. PANW-US 12,287 133.81 17.9% 7.0% 80.8% 26.9% (7.9%) 6.9x NM 5.4x 22.2xVeriSign, Inc. VRSN-US 9,433 92.96 6.6% 22.2% 97.9% 2.2% 65.3% 8.3x 12.7x 9.9x 14.0xTrend Micro, Inc. 4704-JP 7,229 51.53 18.6% 39.4% 96.5% 9.6% 33.0% 4.9x 14.3x 4.5x 13.9xFortinet, Inc. FTNT-US 6,580 37.44 -1.1% 24.3% 90.6% 20.1% 5.7% 4.0x 49.0x 3.4x 16.3xGemalto NV GTO-NL 5,420 59.94 2.2% -4.3% 83.1% 1.9% 22.2% 1.5x 7.6x 1.5x 8.3xCheetah Mobile, Inc. CMCM-US 4,426 10.78 3.7% 12.8% 78.2% 18.2% NM 0.4x 26.6x 1.7x 18.2xProofpoint, Inc. PFPT-US 3,796 86.83 17.1% 22.9% 92.0% 38.6% (8.9%) 9.2x NM 6.5x 49.6xFireEye, Inc. FEYE-US 2,713 15.21 18.6% 27.8% 82.6% 6.1% (18.6%) 3.6x NM 3.3x 38.1xCyberArk Software Ltd. CYBR-US 1,735 49.95 -2.7% 9.8% 84.3% 30.2% 13.0% 6.3x 34.2x 5.1x 21.2xImperva, Inc. IMPV-US 1,598 47.85 17.0% 24.6% 83.6% 26.4% (11.9%) 4.6x NM 3.7x 33.3xQualys, Inc. QLYS-US 1,511 40.80 8.5% 28.9% 92.0% 19.5% 23.5% 6.2x 26.3x 5.5x 16.8xMimecast Ltd. (Jersey) MIME-US 1,497 26.78 23.4% 49.6% 90.8% 38.0% 2.3% 7.4x 920.2x 5.3x 58.6xAVG Technologies NV AVGTF-US 1,301 25.70 4.7% 1.5% 73.4% NM NM 3.3x 12.1x NM NMVaronis Systems, Inc. VRNS-US 1,009 37.20 19.0% 38.8% 98.2% 26.3% (25.8%) 5.1x NM 4.0x 122.9xRapid7, Inc. RPD-US 726 16.83 12.1% 38.3% 87.2% 28.8% (19.6%) 3.9x NM 2.9x NM
19.5% 10.4%20.1% 9.2%
Market Stats Operating Stats LTM Multiples NTM Multiples

Company Name SymbolMarket Cap
($ in Mil)Price ($)
Quarter
Change
YTD
Change
% of 52
Week High
Est.
Revenue
Growth
EBITDA
Margin
TEV/
Rev
TEV/
EBITDA
TEV/
NTM
Revenue
TEV/
NTM
EBITDA
Equinix, Inc. EQIX-US 33,437$ 429.16$ 8.1% 20.1% 96.0% 20.5% 42.3% 10.1x 23.9x 8.0x 16.6xDigital Realty Trust, Inc. DLR-US 18,318 112.95 7.1% 15.0% 92.9% 6.6% 56.7% 11.7x 21.0x 10.9x 18.8xAkamai Technologies, Inc. AKAM-US 8,611 49.81 -17.7% -25.3% 69.5% 9.5% 32.8% 3.5x 10.5x 3.3x 8.6xDuPont Fabros Technology, Inc. DFT-US 4,760 61.16 25.7% 39.2% 92.4% 13.5% 60.7% 12.7x 21.0x 11.1x 17.8xGoDaddy, Inc. GDDY-US 3,883 42.42 14.3% 21.4% 95.9% 24.6% 7.6% 2.3x 21.1x 2.0x 7.8xCoreSite Realty Corp. COR-US 3,540 103.53 16.6% 30.4% 91.2% 20.3% 54.3% 10.7x 20.9x 8.9x 16.4xQTS Realty Trust, Inc. QTS-US 2,507 52.33 8.2% 5.4% 88.1% 16.3% 42.8% 8.8x 20.3x 8.4x 18.0xExtreme Networks, Inc. EXTR-US 1,016 9.22 24.9% 83.3% 83.6% 23.5% 8.7% 1.8x 27.3x 1.4x 10.6x
16.8% 38.3%18.3% 42.6%
Market Stats Operating Stats LTM Multiples NTM Multiples
Company Name SymbolMarket Cap
($ in Mil)Price ($)
Quarter
Change
YTD
Change
% of 52
Week High
Est.
Revenue
Growth
EBITDA
Margin
TEV/
Rev
TEV/
EBITDA
TEV/
NTM
Revenue
TEV/
NTM
EBITDA
Alphabet, Inc. GOOGL-US 591,999$ 929.68$ 9.4% 17.3% 92.2% 1.1% 32.0% 5.9x 18.1x 5.9x 11.9xMicrosoft Corp. MSFT-US 532,175 68.93 4.9% 10.9% 94.6% 19.6% 38.2% 5.7x 16.6x 4.8x 12.0xFacebook, Inc. FB-US 356,877 150.98 6.0% 31.2% 96.5% 44.7% 50.8% 13.4x 24.8x 9.4x 15.3xOracle Corp. ORCL-US 207,413 50.14 12.2% 30.4% 96.7% 4.5% 45.2% 5.3x 12.7x 5.2x 11.1xInternational Business Machines Corp. IBM-US 144,523 153.83 -11.5% -7.3% 84.2% (1.5%) 12.4% 2.2x 11.2x 2.3x 9.6xCisco Systems, Inc. CSCO-US 156,502 31.30 -7.2% 3.6% 90.5% (0.5%) 31.9% 2.5x 8.0x 2.5x 7.2xSAP SE SAP-US 128,137 104.67 6.9% 21.1% 96.3% 10.4% 18.8% 5.2x 18.2x 4.6x 14.0xsalesforce.com, inc. CRM-US 61,602 86.60 4.9% 26.5% 94.1% 25.3% 7.4% 6.9x 87.0x 5.4x 24.3x
13.0% 29.6%7.4% 32.0%
Market Stats Operating Stats LTM Multiples NTM Multiples