Embed Size (px)
Citation preview
RWE AG, Dr. Frank-Detlef Drake, 22.05.2014 SEITE 1
BDI/WEC workshop on ETP 2014
Technology as a basis for the
transformation of the energy system
Dr. Frank-Detlef Drake, RWE AG
Berlin, May 22nd, 2014
RWE AG, Dr. Frank-Detlef Drake, 22.05.2014 SEITE 2
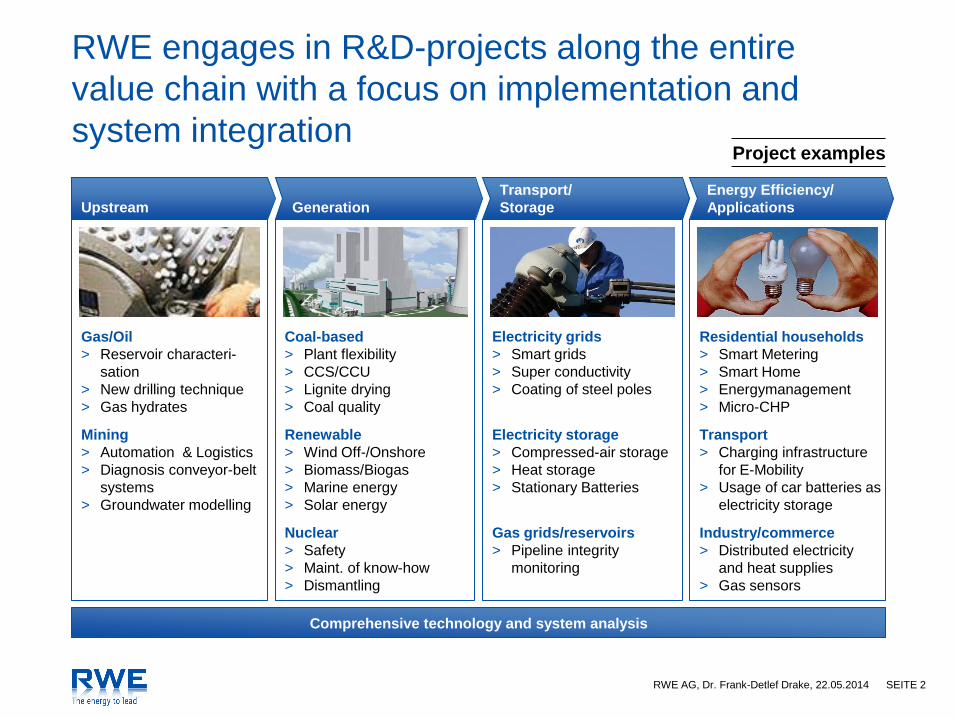
RWE engages in R&D-projects along the entire
value chain with a focus on implementation and
system integration
Upstream Generation
Transport/
Storage
Energy Efficiency/
Applications
Comprehensive technology and system analysis
Gas/Oil
> Reservoir characteri-
sation
> New drilling technique
> Gas hydrates
Mining
> Automation & Logistics
> Diagnosis conveyor-belt
systems
> Groundwater modelling
Coal-based
> Plant flexibility
> CCS/CCU
> Lignite drying
> Coal quality
Electricity grids
> Smart grids
> Super conductivity
> Coating of steel poles
Residential households
> Smart Metering
> Smart Home
> Energymanagement
> Micro-CHP
Renewable
> Wind Off-/Onshore
> Biomass/Biogas
> Marine energy
> Solar energy
Electricity storage
> Compressed-air storage
> Heat storage
> Stationary Batteries
Transport
> Charging infrastructure
for E-Mobility
> Usage of car batteries as
electricity storage
Nuclear
> Safety
> Maint. of know-how
> Dismantling
Gas grids/reservoirs
> Pipeline integrity
monitoring
Industry/commerce
> Distributed electricity
and heat supplies
> Gas sensors
Project examples
RWE AG, Dr. Frank-Detlef Drake, 22.05.2014 SEITE 3
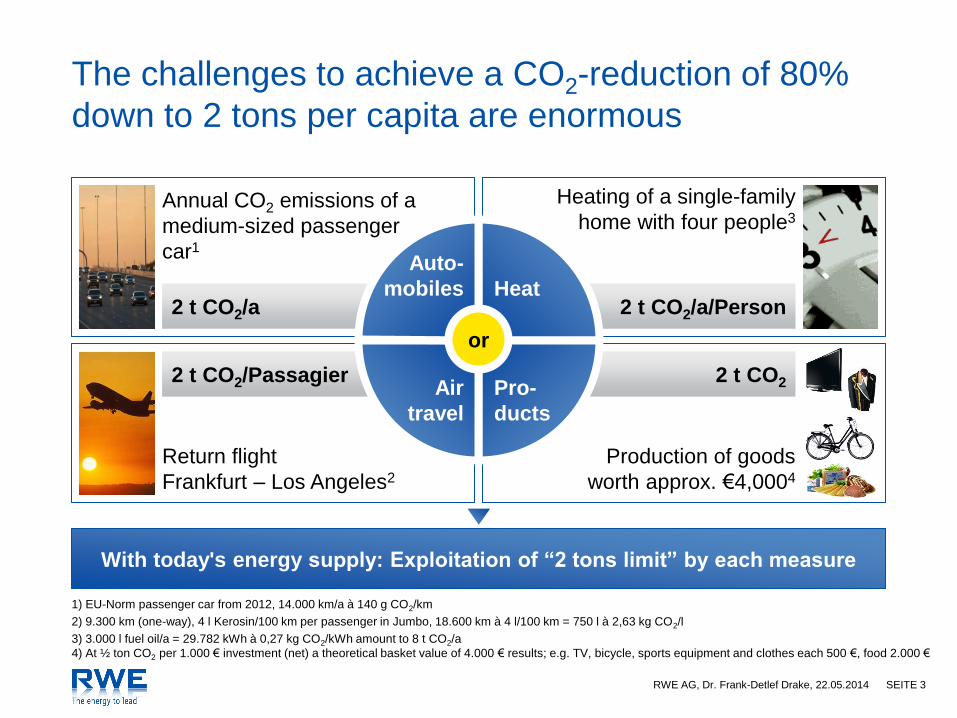
Return flight
Frankfurt – Los Angeles2
2 t CO2/Passagier
Annual CO2 emissions of a
medium-sized passenger
car1
2 t CO2/a
The challenges to achieve a CO2-reduction of 80%
down to 2 tons per capita are enormous
Heating of a single-family
home with four people3
Production of goods
worth approx. €4,0004
With today's energy supply: Exploitation of “2 tons limit” by each measure
2 t CO2
2 t CO2/a/Person
or
Auto-
mobiles Heat
Air
travel
Pro-
ducts
1) EU-Norm passenger car from 2012, 14.000 km/a à 140 g CO2/km
2) 9.300 km (one-way), 4 l Kerosin/100 km per passenger in Jumbo, 18.600 km à 4 l/100 km = 750 l à 2,63 kg CO2/l
3) 3.000 l fuel oil/a = 29.782 kWh à 0,27 kg CO2/kWh amount to 8 t CO2/a
4) At ½ ton CO2 per 1.000 € investment (net) a theoretical basket value of 4.000 € results; e.g. TV, bicycle, sports equipment and clothes each 500 €, food 2.000 €
RWE AG, Dr. Frank-Detlef Drake, 22.05.2014 SEITE 4
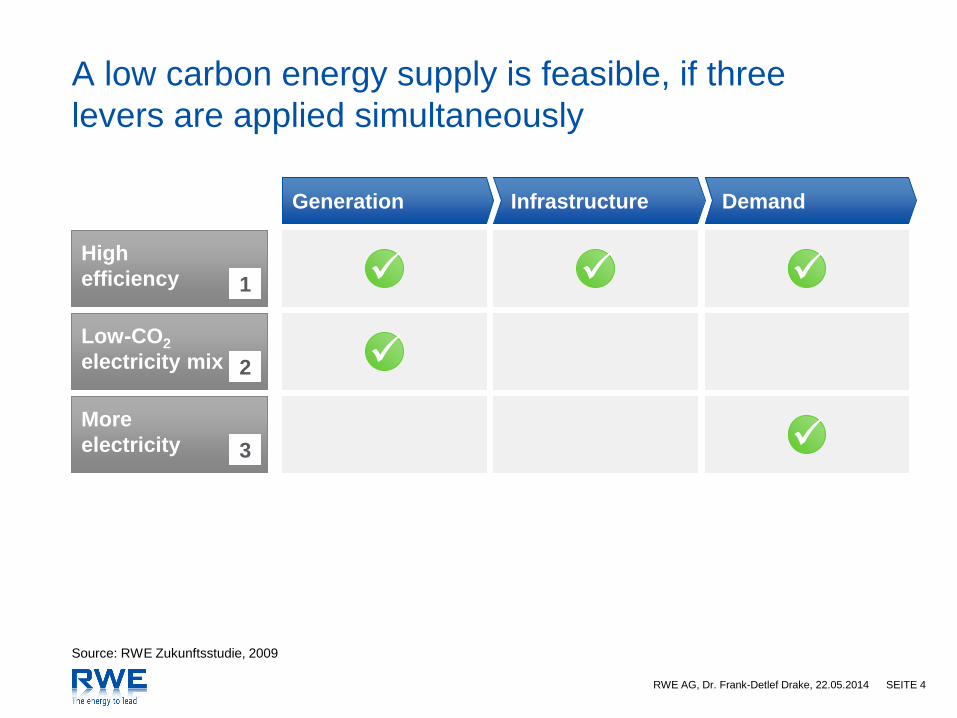
A low carbon energy supply is feasible, if three
levers are applied simultaneously
High
efficiency
More
electricity
Low-CO2
electricity mix
Generation Infrastructure Demand
1
2
3
Source: RWE Zukunftsstudie, 2009
RWE AG, Dr. Frank-Detlef Drake, 22.05.2014 SEITE 5
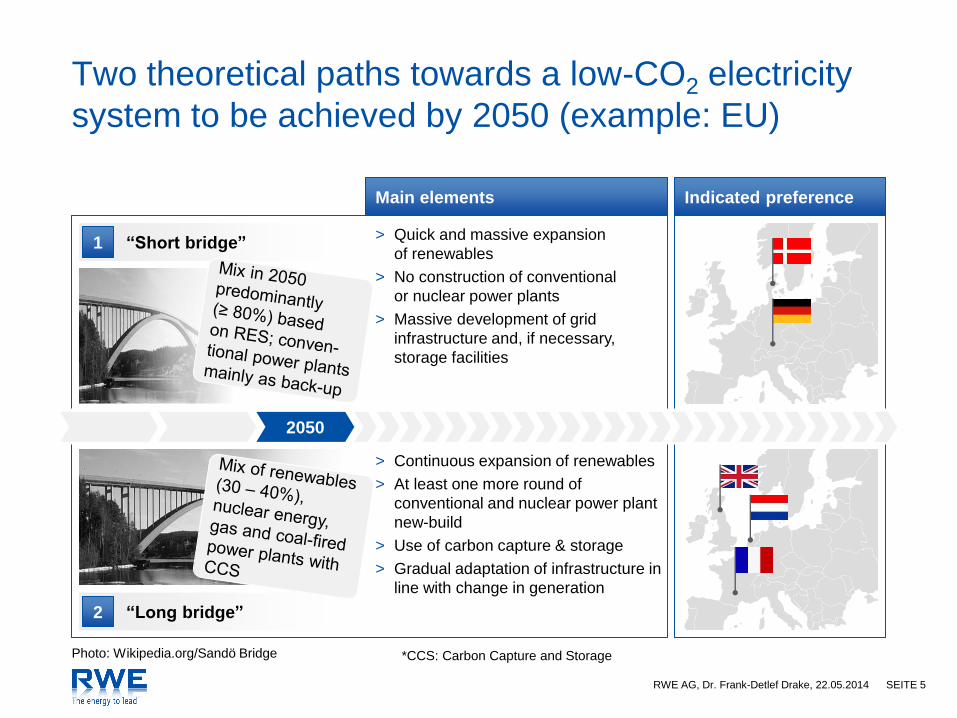
Two theoretical paths towards a low-CO2 electricity
system to be achieved by 2050 (example: EU)
Photo: Wikipedia.org/Sandö Bridge
2050
“Short bridge” > Quick and massive expansion
of renewables
> No construction of conventional
or nuclear power plants
> Massive development of grid
infrastructure and, if necessary,
storage facilities
> Continuous expansion of renewables
> At least one more round of
conventional and nuclear power plant
new-build
> Use of carbon capture & storage
> Gradual adaptation of infrastructure in
line with change in generation
“Long bridge”
Main elements Indicated preference
1
2
*CCS: Carbon Capture and Storage
RWE AG, Dr. Frank-Detlef Drake, 22.05.2014 SEITE 6
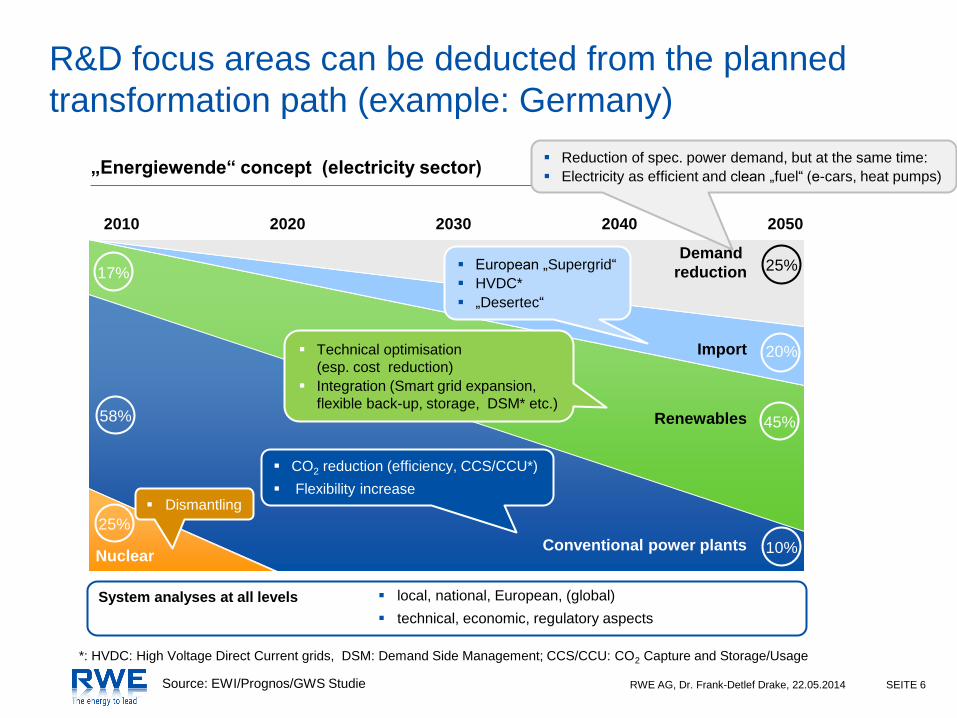
R&D focus areas can be deducted from the planned
transformation path (example: Germany)
„Energiewende“ concept (electricity sector)
Source: EWI/Prognos/GWS Studie
2010 2020 2050 2030 2040
Nuclear Conventional power plants
Renewables
Import
Demand
reduction 17%
25%
58% 45%
10%
20%
25%
System analyses at all levels local, national, European, (global)
technical, economic, regulatory aspects
Dismantling
CO2 reduction (efficiency, CCS/CCU*)
Flexibility increase
Technical optimisation
(esp. cost reduction)
Integration (Smart grid expansion,
flexible back-up, storage, DSM* etc.)
European „Supergrid“
HVDC*
„Desertec“
Reduction of spec. power demand, but at the same time:
Electricity as efficient and clean „fuel“ (e-cars, heat pumps)
*: HVDC: High Voltage Direct Current grids, DSM: Demand Side Management; CCS/CCU: CO2 Capture and Storage/Usage
RWE AG, Dr. Frank-Detlef Drake, 22.05.2014 SEITE 7
View on important ETP 2014 findings (1/2)
> ETP presents an encompassing and highly valuable work with a global as well as
clear system perspective and many important findings: Congratulation!
> Importance of system analysis cannot be overemphasized regarding the intricate
interplay of technology, economy, regulation and society. Future market design
needs to take these interdepencies into account (presently often not the case!)
> In light of fast technological developments, long-term goals, size of the challenge
and complexity of the energy system, a non-dogmatic, supra-national and
technology-open approach is of utmost importance
> Key levers for a cost-efficient and sustainable future energy system are efficiency,
decarbonisation of the power sector and a shift towards electricity in all sectors
o A cap and trade system such as the ETS ensures already today that
electrification of e.g. mobility or heating does not lead to higher emissions.
o With pressure on CO2-emissions, we will see again more coal-to-gas shift in
conventional generation. But, as ETP points out rightfully, also gas is a bridge.
o Word of caution: the realistic economic potential of efficiency might be lower
than postulated in many studies – so we should not rely on it and take rebound
effects into account
RWE AG, Dr. Frank-Detlef Drake, 22.05.2014 SEITE 8
View on important ETP 2014 findings (2/2)
> On RES: cost will come down further and competetiveness with conventional
plants “in sight” in many regions of the world, but “LCOE” and real cost (including
risk-adjusted cost of capital) differ largely. Financing is a key issue.
> On RES-integration:
> Combination of (smart) grid expansion and flexible back-up power plants is most
cost-efficient, but requires acceptance!
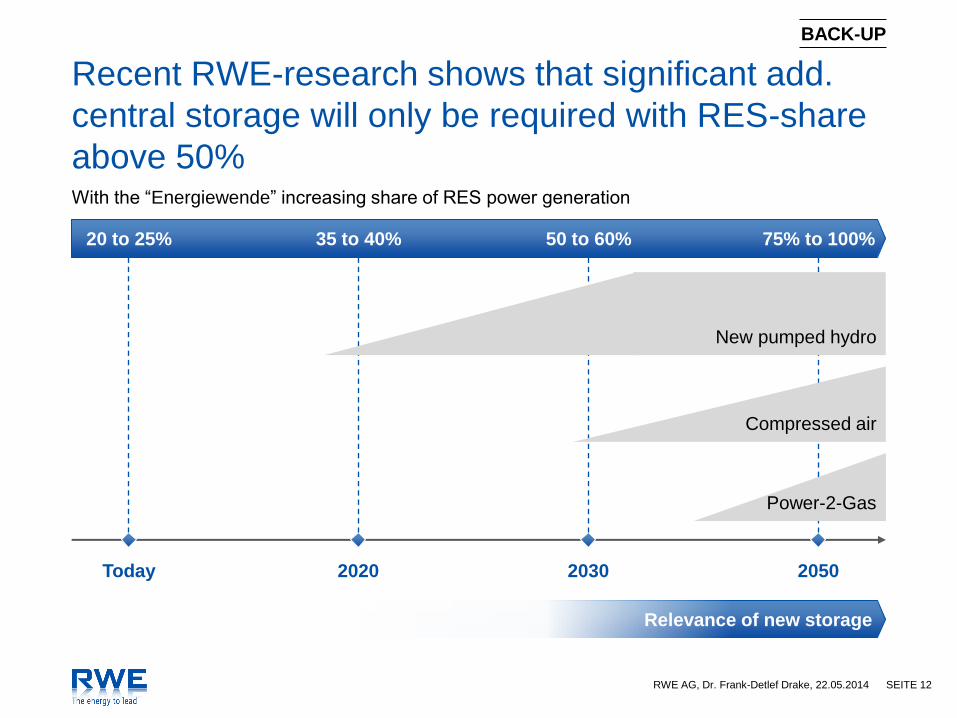
> Storage is not the “golden bullet” (yet): RWE research also shows that
significant additional central storage will only be needed beyond RES shares of
50%. Intense and diverse R&D is needed to develop options and bring down
cost. Battery developments with potential to be “game-changing”.
> On CCS: from a global perspective it looks indispensable, but the more
concrete/local you go, the higher the hurdles. We cannot count on it.
> On Smart Grid: the more volatile and the more decentral generation becomes, the
more smartness we need. There are “before the meter” and “beyond the meter”
measures (e.g DSM, smart charging…), which need effective coordination
(especially in unbundled markets)

RWE AG, Dr. Frank-Detlef Drake, 22.05.2014 SEITE 9
BACK-UP
RWE AG, Dr. Frank-Detlef Drake, 22.05.2014 SEITE 10
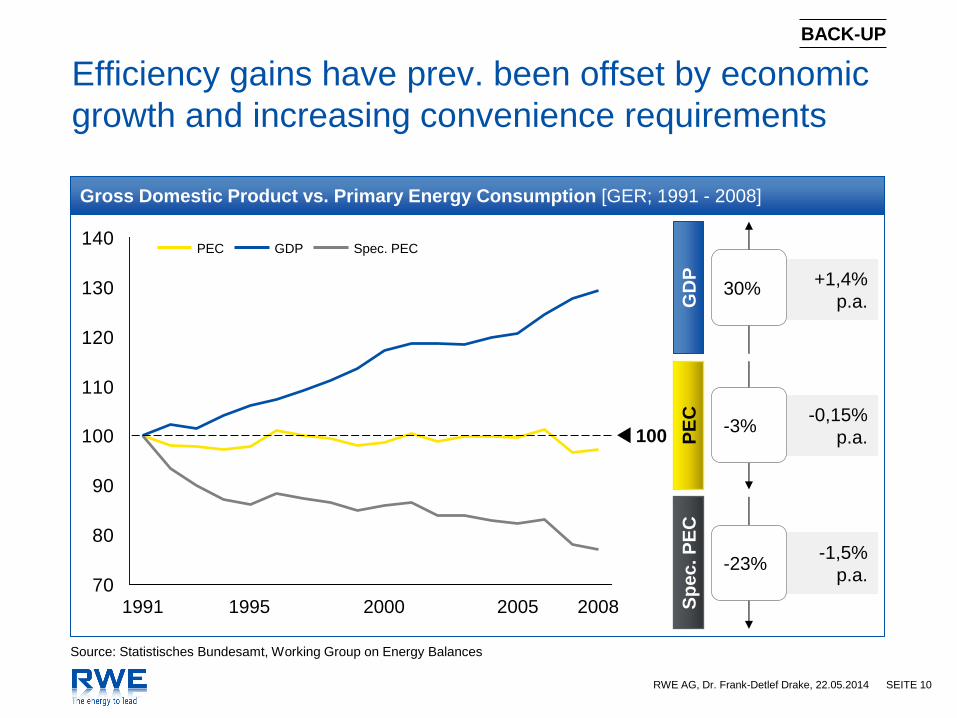
Efficiency gains have prev. been offset by economic
growth and increasing convenience requirements
BACK-UP
Gross Domestic Product vs. Primary Energy Consumption [GER; 1991 - 2008]
70
80
90
100
110
120
130
140
2005 2008
100
1991 1995 2000
GDP Spec. PEC PEC
GD
P
PE
C
Sp
ec
. P
EC
+1,4%
p.a.
-0,15%
p.a.
-1,5%
p.a.
30%
-3%
-23%
Source: Statistisches Bundesamt, Working Group on Energy Balances
RWE AG, Dr. Frank-Detlef Drake, 22.05.2014 SEITE 11
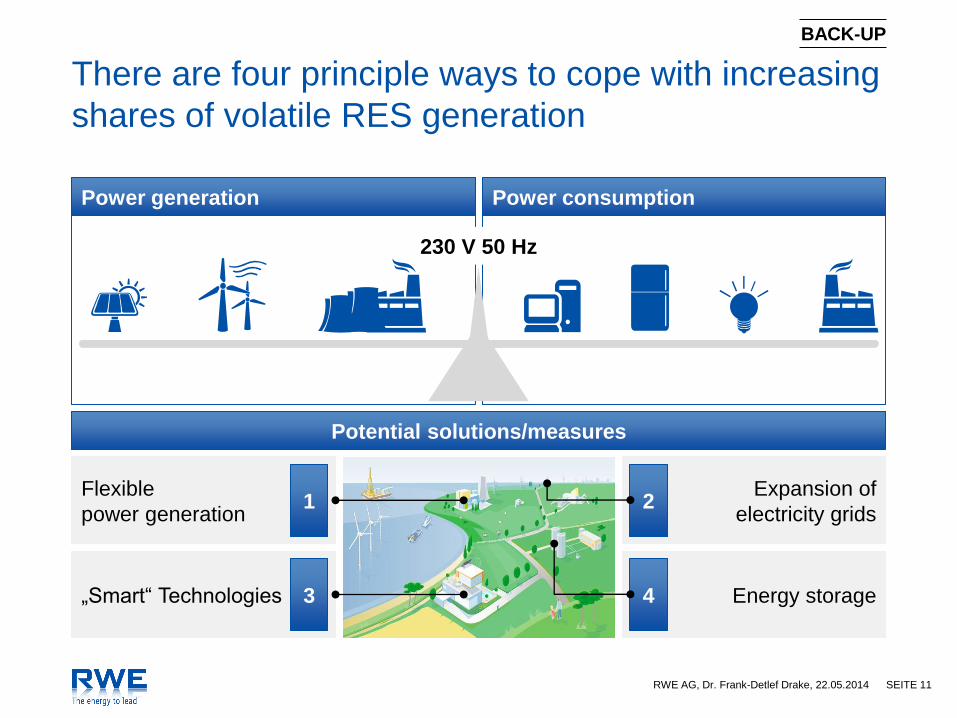
There are four principle ways to cope with increasing
shares of volatile RES generation
Power generation Power consumption
Potential solutions/measures
Flexible
power generation
„Smart“ Technologies
Expansion of
electricity grids
Energy storage 3
1
4
2
230 V 50 Hz
BACK-UP
RWE AG, Dr. Frank-Detlef Drake, 22.05.2014 SEITE 12
Recent RWE-research shows that significant add.
central storage will only be required with RES-share
above 50%
Today
With the “Energiewende” increasing share of RES power generation
20 to 25%
2020
35 to 40%
2030
50 to 60%
2050
75% to 100%
Relevance of new storage
New pumped hydro
Compressed air
Power-2-Gas
BACK-UP
RWE AG, Dr. Frank-Detlef Drake, 22.05.2014 SEITE 13
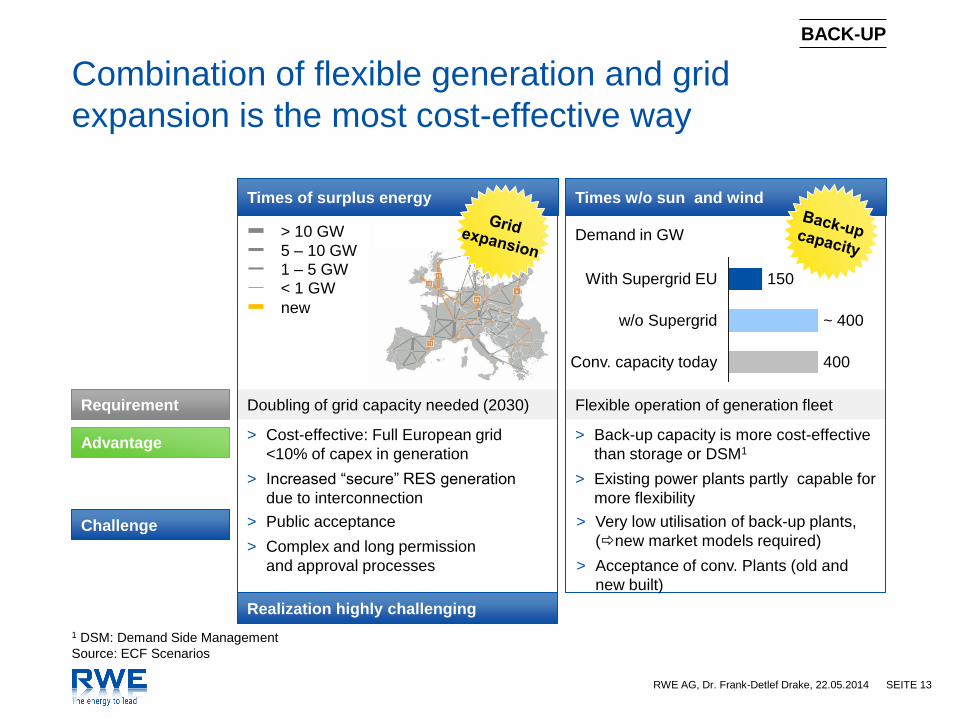
Combination of flexible generation and grid
expansion is the most cost-effective way
1 DSM: Demand Side Management
Source: ECF Scenarios
Times of surplus energy Times w/o sun and wind
Conv. capacity today 400
w/o Supergrid ~ 400
With Supergrid EU 150
> 10 GW
5 – 10 GW
1 – 5 GW
< 1 GW
Requirement
Advantage
Challenge
Doubling of grid capacity needed (2030) Flexible operation of generation fleet
Demand in GW
> Cost-effective: Full European grid
<10% of capex in generation
> Increased “secure” RES generation
due to interconnection
> Public acceptance
> Complex and long permission
and approval processes
> Back-up capacity is more cost-effective
than storage or DSM1
> Existing power plants partly capable for
more flexibility
> Very low utilisation of back-up plants,
(new market models required)
> Acceptance of conv. Plants (old and
new built)
Realization highly challenging
new
BACK-UP
RWE AG, Dr. Frank-Detlef Drake, 22.05.2014 SEITE 14
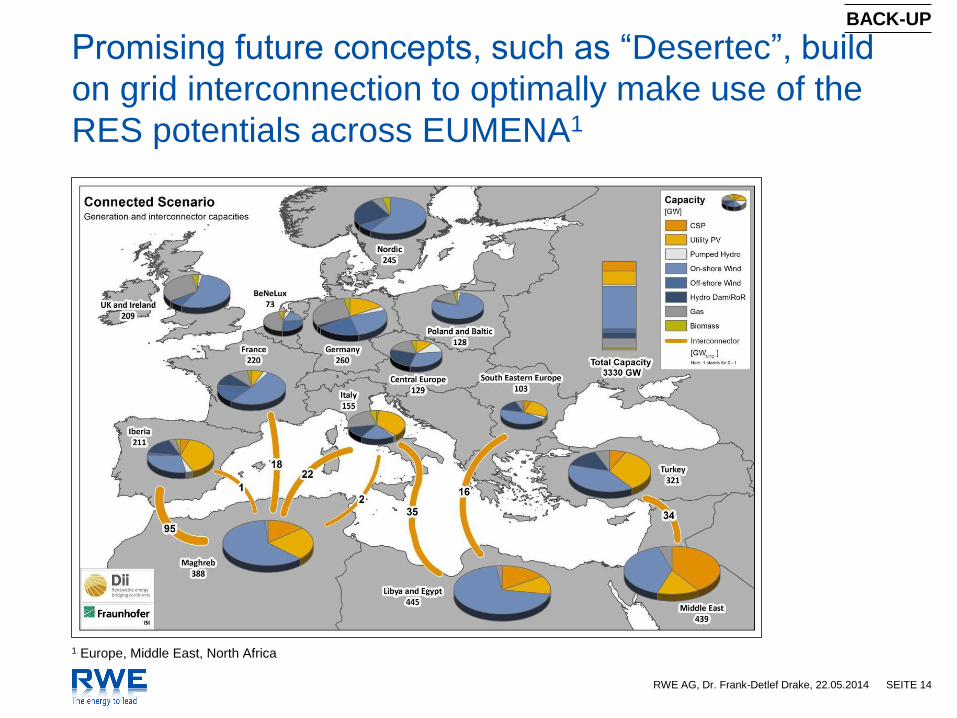
Promising future concepts, such as “Desertec”, build
on grid interconnection to optimally make use of the
RES potentials across EUMENA1
1 Europe, Middle East, North Africa
BACK-UP


![Sheet 07.5: Matrices II: Inverse, Basis Transformation · PDF file · 2016-08-16... Gaussian elimination and matrix inversion [4] ... Find the matrix T =1, and use the inverse transformation](https://img.pdfslide.us/doc/110x75/5ab9033d7f8b9ad3038d7e1c/sheet-075-matrices-ii-inverse-basis-transformation-gaussian-elimination.jpg)