Embed Size (px)
Citation preview
Helvea Swiss Equites Conference 2013
Bad Ragaz, January 18, 2013
Michael Buscher (CEO)
Andreas Schwarzwälder (Head of Investor Relations)
Oerlikon’s Transformation

save space
3 pillars as basis for Oerlikon’s Transformation
January 2013_Investor Presentation
PORTFOLIO REFINANCING OPERATIONAL EXCELLENCE
OERLIKON’S TRANSFORMATION
Page 2

save space
4.00
6.00
8.00
10.00
12.00
Oerlikon Portfolio – Streamlined portfolio with reduced volatility
Apr 16, 2012 Divestment of Pilatus stake
Mar 23, 2012 Sale of Arbon
property
Page 3
Oerlikon
Textile
Drive Systems
Vacuum
Coating
Advanced Technologies
Jun 29 & Oct 29, 2012 Streamlining of manufacturing
footprint of Drive Systems
Dec 3, 2012 Announcement Natural Fibers / Textile Components divestment
Nov 27, 2012 Closing Solar divestment
Mar 2, 2012 Announcement
Solar divestment
Jul 2, 2012 Divestment of Melco
in Textile Segment
January 2013_Investor Presentation

save space
Balanced Oerlikon Portfolio
Page 4
BALANCED SEGMENT
SALES
Divestment of Natural Fibers / Textile Components business
reduces Textile exposure from over 50 % to some 30 %
Potential: Portfolio adjustments and accelerated growth to
further balance Segment sales
BALANCED GEOGRAPHIC
SALES
Balanced geographic portfolio
Growth providing Asian region to account for 43 % of total
sales (preliminary HY 2012 figures)
CURRENCY EXPOSURE
No major currency mismatch between sales, COGS and
overhead costs – natural hedge in place
Limited Swiss Franc exposure
Limited transaction risk
SERVICE Service & spare parts to account for 21 % of total sales
Potential: Strengthening of service business to increase
proportion of recurring revenue
12%
Other
RMB 7%
USD
17%
EURO
60%
CHF
4%
January 2013_Investor Presentation
RoW
6%
Asia / Pacific
43%
North America
20%
Europe
32%
Service & Spare Parts
21%
79%
18% Coating
Vacuum
15%
30%
Drive Systems
Textile 33%
4%
Adv. Techn.
Goods, Equipment & Components
save space
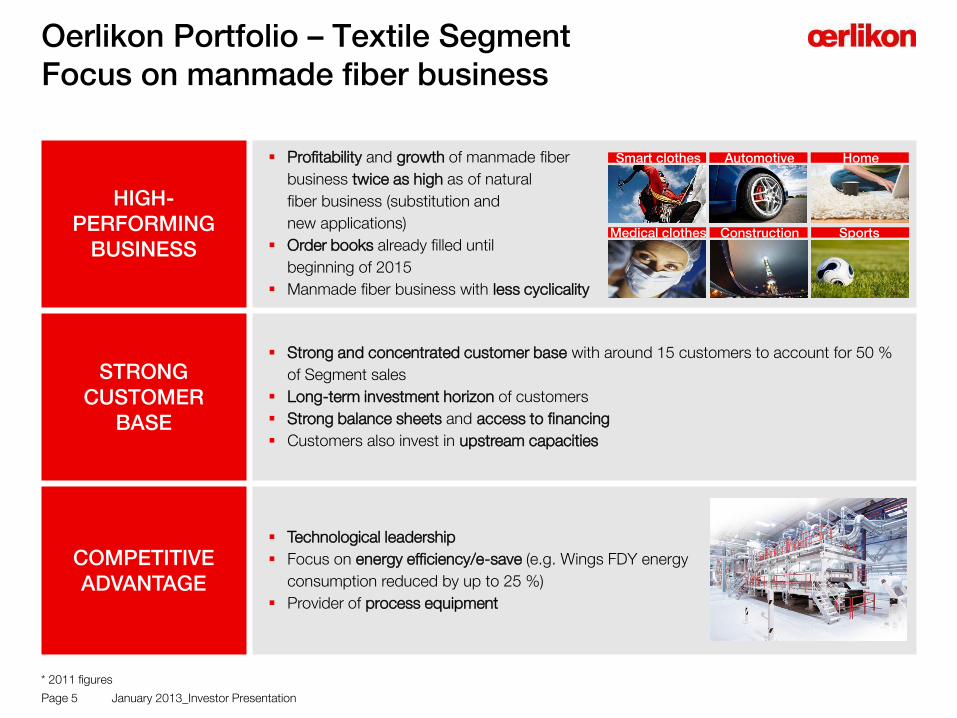
Oerlikon Portfolio – Textile Segment Focus on manmade fiber business
HIGH- PERFORMING
BUSINESS
Profitability and growth of manmade fiber
business twice as high as of natural
fiber business (substitution and
new applications)
Order books already filled until
beginning of 2015
Manmade fiber business with less cyclicality
STRONG CUSTOMER
BASE
Strong and concentrated customer base with around 15 customers to account for 50 %
of Segment sales
Long-term investment horizon of customers
Strong balance sheets and access to financing
Customers also invest in upstream capacities
COMPETITIVE ADVANTAGE
Technological leadership
Focus on energy efficiency/e-save (e.g. Wings FDY energy
consumption reduced by up to 25 %)
Provider of process equipment
Page 5
* 2011 figures
Medical clothes
Home Automotive
Sports
Smart clothes
Construction
January 2013_Investor Presentation

save space
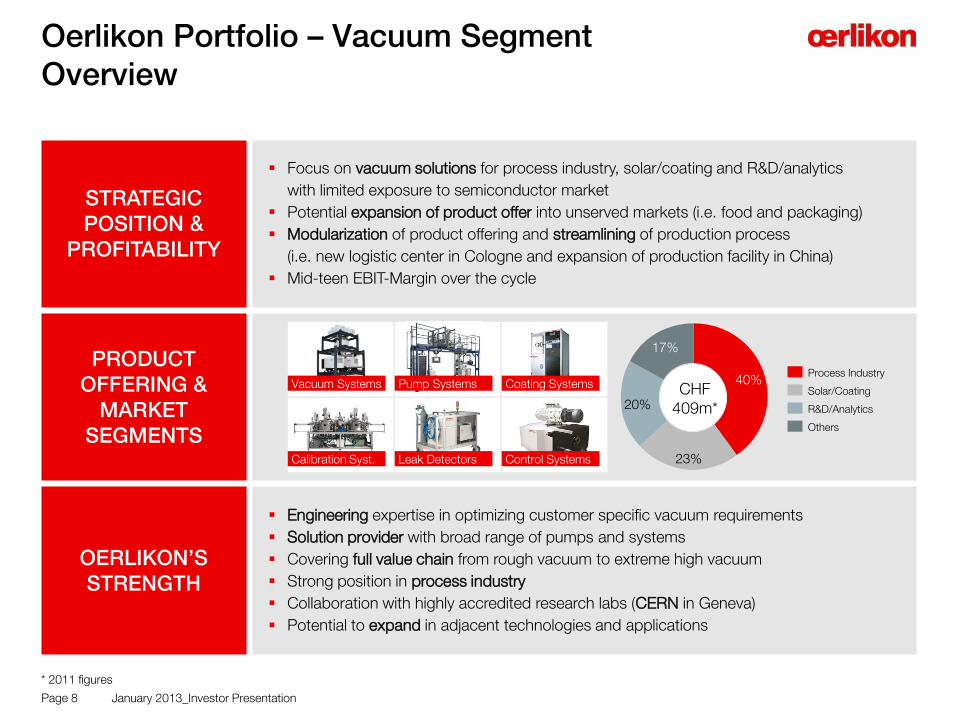
Oerlikon Portfolio – Textile Segment Overview
STRATEGIC POSITION &
PROFITABILITY
Focus on high-performing manmade fiber business with high profitable growth potential
and less cyclicality
Focus on high-end textile machines as demand for low-end products will shrink over time
due to objectives of the Chinese 5-Year-Plan
Focus on growing end markets as construction, automotive, home textiles, clothing,
geo / agro textiles and sports
EBIT-Margin of 14-16 % over the cycle
PRODUCT OFFERING &
MARKET SEGMENTS
Spinning plants and line equipment for
filaments, carpet yarn, staple fibers and
nonwovens and engineering services
OERLIKON’S STRENGTH
Market leader in manmade fiber industry
Solution provider (full range of products)
Strong R&D, playing to the strength of German Technology and precision engineering
Global footprint with strategic production sites in Asia and Europe
Technological leadership and know how to leverage in new applications and markets
Page 6
5%
6% 2% 12%
4%
71%
CHF 893m*
Nonwoven
Staple Fiber
Carpet Yarn (BCF)
Plastic Processing (BSZ)
Industrial Filament
Textile Filaments
* 2011 figures
Process equip.
January 2013_Investor Presentation
Line equip.

save space
Oerlikon Portfolio – Drive Systems Segment Overview
STRATEGIC POSITION &
PROFITABILITY
Focus on high growth segments of energy and on/off highway market while maintaining a
strong presence in other served areas
Niche applications with limited exposure to more commoditized gear component market
Focus on difficult-to-produce, high performance products in high-end applications
Adjustment of global production network (streamline in I and expansion in IN and CN)
Access to local markets in China and India
EBIT-Margin of 10 % as initial milestone, targeting for current Group average
PRODUCT OFFERING &
MARKET SEGMENTS
OERLIKON’S STRENGTH
Solution provider of true drive systems (joint development and engineering)
Most comprehensive support to customers in terms of product range, solutions and
geographical coverage
Highly advanced engineering and application expertise in gear and power transmission
Global footprint and network as increased technology demands will threaten smaller
independent firms
Potential to further expand in Emerging Marktes and new applications
Page 7
15%
8%
40%
20%
17%
Energy/Mining/Specialty Industrial
High-end Automotive
Agriculture
Construction
Off-Highway / Transportation
Gear components Clutches
Axles Transmissions
CHF 821m*
* 2011 figures
January 2013_Investor Presentation
save space
STRATEGIC POSITION &
PROFITABILITY
Focus on vacuum solutions for process industry, solar/coating and R&D/analytics
with limited exposure to semiconductor market
Potential expansion of product offer into unserved markets (i.e. food and packaging)
Modularization of product offering and streamlining of production process
(i.e. new logistic center in Cologne and expansion of production facility in China)
Mid-teen EBIT-Margin over the cycle
PRODUCT OFFERING &
MARKET SEGMENTS
OERLIKON’S STRENGTH
Engineering expertise in optimizing customer specific vacuum requirements
Solution provider with broad range of pumps and systems
Covering full value chain from rough vacuum to extreme high vacuum
Strong position in process industry
Collaboration with highly accredited research labs (CERN in Geneva)
Potential to expand in adjacent technologies and applications
Oerlikon Portfolio – Vacuum Segment Overview
Page 8
20%
23%
40%
17%
R&D/Analytics
Solar/Coating
Process Industry
Others
CHF 409m*
Vacuum Systems Pump Systems Coating Systems
Calibration Syst. Leak Detectors Control Systems
* 2011 figures
January 2013_Investor Presentation

save space
Oerlikon Portfolio – Coating Segment Overview
STRATEGIC POSITION &
PROFITABILITY
Undisputed technology and market leader in Physical Vapor Deposition (PVD)
Continues expansion of Components business
Automotive industry represents around 40 % (direct and indirect). Coating to benefit
from efforts to further reduce weight and fuel consumption (structural growth)
Extension of product offer to new coatings and services
Sustainable profitability level with EBIT-Margin of around 20 %
PRODUCT OFFERING &
MARKET SEGMENTS
OERLIKON’S STRENGTH
Market leader in PVD coating
Global presence with ~90 coating centers worldwide
Organic growth by implementing 3-5 new coating centers every year
Coating systems to be implemented in the client’s production process
Potential to expand in adjacent technologies and applications
Page 9
9%
20%
51%
8%
12%
Forming Tools
Cutting Tools
Precision Components
Automotive Components
Equipment
CHF 484m*
ePD interior PVD/PECVD
Equipment
* 2011 figures
ePD exterior
January 2013_Investor Presentation

save space
Oerlikon Portfolio – Advanced Technologies Overview
STRATEGIC POSITION &
PROFITABILITY
Focus on high growth and high value added applications in cleantech, semiconductors
and mobile device markets
Incubator for new technologies and applications predominantly in deposition technology
EBIT-Margin mid-term in the range of 10 %
PRODUCT OFFERING &
MARKET SEGMENTS
OERLIKON’S STRENGTH
Core competence in industrializing thin film coating applications for Advanced Packaging,
and Energy Management
Highest productivity PVD tools for semi, mobile and clean tech applications
Excellent reputation confirmed by independent market surveys
Strong customer base in Asia
R&D capabilities – Incubator function
Page 10
77%
3%
18%
2%
Photovoltaic
Others
Touch Panel
Semi
CHF 108m*
Thin-film Deposit.
Thin-film Coating
* 2011 figures
January 2013_Investor Presentation

save space
3 pillars as basis for Oerlikon’s Transformation
PORTFOLIO REFINANCING OPERATIONAL EXCELLENCE
OERLIKON’S TRANSFORMATION
Page 11 January 2013_Investor Presentation
save space
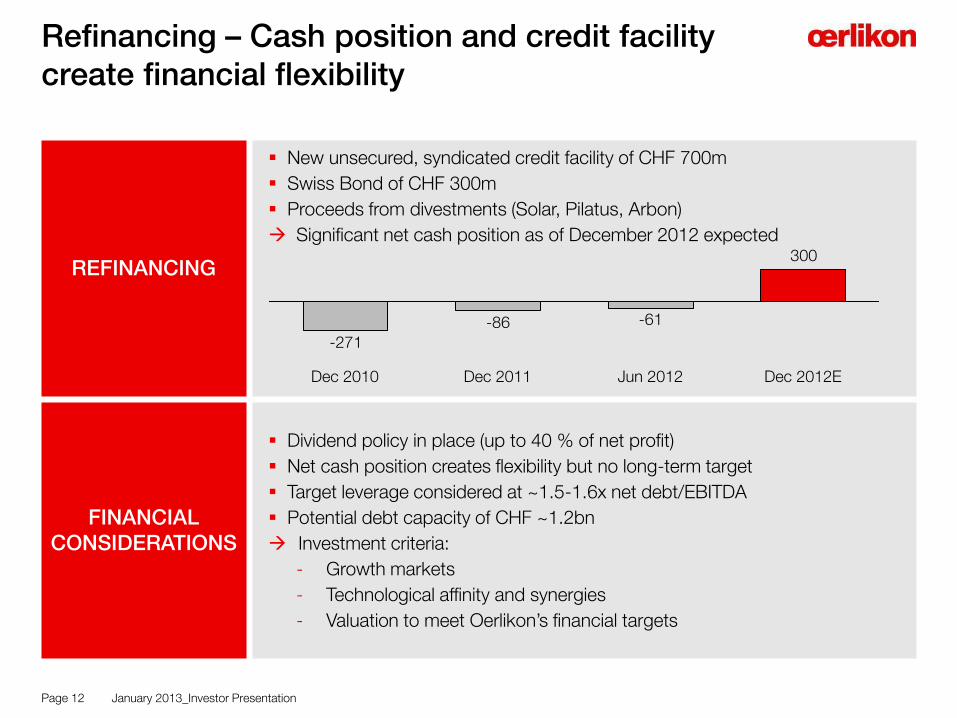
Refinancing – Cash position and credit facility create financial flexibility
REFINANCING
New unsecured, syndicated credit facility of CHF 700m
Swiss Bond of CHF 300m
Proceeds from divestments (Solar, Pilatus, Arbon)
Significant net cash position as of December 2012 expected
FINANCIAL CONSIDERATIONS
Dividend policy in place (up to 40 % of net profit)
Net cash position creates flexibility but no long-term target
Target leverage considered at ~1.5-1.6x net debt/EBITDA
Potential debt capacity of CHF ~1.2bn
Investment criteria:
- Growth markets
- Technological affinity and synergies
- Valuation to meet Oerlikon’s financial targets
Page 12
300
-61-86-271
Dec 2012E Jun 2012 Dec 2011 Dec 2010
January 2013_Investor Presentation

save space
3 pillars as basis for Oerlikon’s Transformation
PORTFOLIO REFINANCING OPERATIONAL EXCELLENCE
OERLIKON’S TRANSFORMATION
Page 13 January 2013_Investor Presentation

save space
Operational Excellence – Basis for improvement of underlying performance
MANAGEMENT
Changes in management to acquire and ensure necessary know how and
capabilities for transformation process
New Segment CEOs in Textile, Vacuum and Drive Systems
Introduction of Country Representatives for China, India, Russia
and the Americas to identify growth potential across all Segments
OPERATIONAL EXCELLENCE
Significant improvement of On-Time Delivery (OTD)
Manufacturing footprint alignment
Production process improvement
Cross Segment procurement
Platform strategies (i.e. in Textile and Vacuum)
Sustained Innovation is crucial to meet and exceed customer expectation
Continued invest in R&D to deliver groundbreaking innovations
Innovations to decrease operating costs, increase production efficiency,
reduce environmental impact and increase performance
GROWTH
Portfolio shaping to accelerate growth
Continued CapEx in the magnitude of depreciation level
Addressing growth regions in emerging markets
Expansion in growth applications and technologies
Page 14 January 2013_Investor Presentation

save space
Outlook Oerlikon Group 2012
Natural Fibers and Textile Components Business Units reported as «discontinued operations»
Based on the current assessment of the effects from Natural Fibers and Textile Components Business Units reported as discontinued, we updated our guidance:
- sales growth of more than 5 % (prior: to be at 2011 levels)
- order intake to be close to previous year’s level (prior: up to minus 5 %)
- EBIT margin to increase by 1 percentage point on prior guidance (prior: around 12.5 % reported)
Guidance FY 2012 based on current currency exchange rates
Financial flexibility to further capture organic and inorganic growth opportunities as well as continued focus on Operational Excellence to further increase value creation of Oerlikon
Page 15 January 2013_Investor Presentation

save space
Question and Answers
Page 16 January 2013_Investor Presentation

save space
Oerlikon divests Natural Fibers and Textile Components Business Units – Summary
Page 17
TRANSACTION
Oerlikon to divest Natural Fibers and Textile Components Business Units
(including certain real estate) to Jinsheng Group of China
Enterprise Value of around CHF 650 million
Subject to merger control approval in a number of countries
Closing expected for Q3 2013
RATIONALE
Manmade and natural fiber markets different in terms of industry dynamics,
technologies, customers and regions – limited overlap and synergies incl.
manufacturing footprint
Focus on manmade fibers – fastest growing area in the global fiber industry
Reduces complexity / cyclicality and overall textile exposure of Group portfolio
Focus on technological leadership and value creation of Oerlikon Group
TRANSFORMATION PROCESS 2012
Disciplined execution of Operational Excellence
Disposal of non-operating assets (Pilatus Flugzeugwerke AG, Arbon property)
Divestment of Solar Segment and announced reduction of textile exposure
Repositioning of Balance Sheet (net cash positive, unsecured CHF 700m
credit facility and CHF 300m Swiss Bond)
January 2013_Investor Presentation

save space
Group Sales Group Order Intake Group EBIT
20
11
excl. S
ola
r
FY 2011 Group EBIT Margin excluding Solar Segment at 11.1 %
20
11
p
relim
inary
resta
ted
Divestment will be accretive on restated FY 2011 EBIT margin by 50 to 60 bps dependent on cost allocation and deconsolidation impacts
Oerlikon Portfolio – Segment split more balanced
53%
21%
13%
11% 3%
CHF 3.9 bn 53%
24%
11%
11% 2%
CHF 3.8 bn
33%
30%
18%
15% 4%
CHF 2.7 bn
36%
32%
15%
14% 3%
CHF 2.9 bn
Textile Drive Systems Coating Vacuum Advanced Technologies
Page 18 January 2013_Investor Presentation
save space
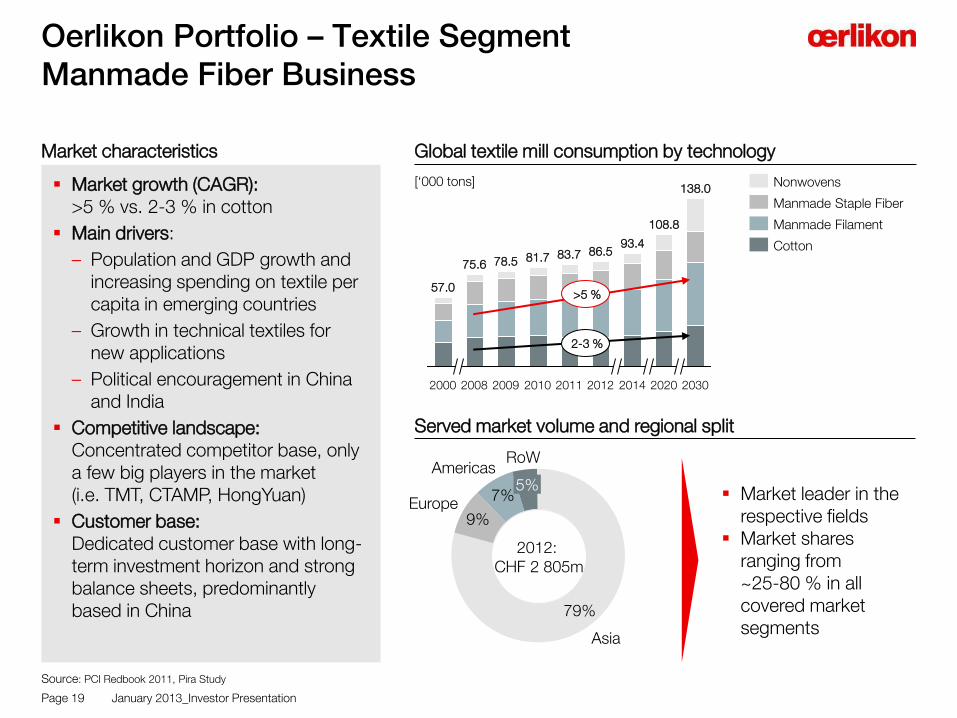
Market growth (CAGR): >5 % vs. 2-3 % in cotton
Main drivers:
– Population and GDP growth and increasing spending on textile per capita in emerging countries
– Growth in technical textiles for new applications
– Political encouragement in China and India
Competitive landscape: Concentrated competitor base, only a few big players in the market (i.e. TMT, CTAMP, HongYuan)
Customer base: Dedicated customer base with long-term investment horizon and strong balance sheets, predominantly based in China
Oerlikon Portfolio – Textile Segment Manmade Fiber Business
2030
138.0
2020
108.8
2014
93.4
2012
86.5
2011
83.7
2010
81.7
2009
78.5
2008
75.6
2000
57.0
[‘000 tons]
Global textile mill consumption by technology
Cotton
Manmade Filament
Manmade Staple Fiber
Nonwovens
Market characteristics
Served market volume and regional split
Source: PCI Redbook 2011, Pira Study
>5 %
2-3 %
Page 19
7%
9%
RoW
5% Americas
Europe
Asia
79%
2012: CHF 2 805m
Market leader in the respective fields
Market shares ranging from ~25-80 % in all covered market segments
January 2013_Investor Presentation

save space
Oerlikon Portfolio – Drive Systems Segment Agriculture and Construction as drivers
Construction & Agricultural Equipment Market 2008-2014E* Market characteristics
Served market volume and regional split
Page 20
Source: IHS Global Insight, CNH, BaB estimates
Market growth (CAGR): GDP correlated
Main drivers:
– Population growth, rising middle class and increased mobility
– Migration towards higher technology/systems in agriculture in emerging markets
– Construction and infrastructure build-up in developing countries
Competitive landscape: Many competitors worldwide competing in the niche gear and drives market. Competitors include both global players as well as smaller regional producers
Customer base: Concentrated customer base of global OEMs and producers (CNH, John Deere, Caterpillar)
Americas 40%
Europe
25%
Asia 35%
2012: CHF 9 200m
Drive Systems Segment No. 2 or 3 in addressable markets
Market shares ranging from ~5-15 % in all covered market segments
2012 2014E
2 000
2013E
1 900 2 000
2011
1 900
2010
1 600
2009
1 600
2008
1 700
Tractors Light Equipment Heavy Equipment Combines
[‘000 units]
January 2013_Investor Presentation

save space
Oerlikon Portfolio – Vacuum Segment Process industry and China
Cyclicality and growth in the vacuum business Market characteristics
Served market volume and regional split
Page 21
Americas
21%
Europe 25%
Asia 54% 2012:
CHF 3 450m
Oerlikon Leybold No. 3 in addressable markets
Market shares ranging from ~10-15 % in all covered market segments
Market growth (CAGR): GDP correlated
Main drivers:
– Aging population with growing demand for health care and pharma
– Demographics and middle class development driving process industry growth
– Construction and infrastructure with coating of glass and solar panels
Competitive landscape: Big global competitors (Edwards, Pfeiffer, Busch) as well as regional competitors
Customer base: Reliable partner for more than 18 000 customers
CAGR
Cyclicity
Chemical F&P / PP
SEMI
Coating
Solar
R&D
Analytics Process Industry
Stable Highly cyclical
Oerlikon involved
January 2013_Investor Presentation

save space
Oerlikon Portfolio – Coating Segment Automotive and Components Business
Oerlikon’s global network Market characteristics
Served market volume and regional split
Page 22
* Source: OICA 2012
Americas
21%
Europe
41%
Asia 38%
2012: CHF 1 400m
Market leader in the respective fields
Market shares ranging from ~25-45 % in all covered market segments
Market growth (CAGR): ~7-8 % organic growth (incl. build-up of new coating centers)
Main drivers:
– High increase in automotive sales in emerging markets
– Usage of adv. surface solutions in various sub-segments for functional and decorative enhancements (watches, medical, aerospace etc.)
– Substitution of chrome-plating technology on automotive
Competitive landscape: Undisputed market and technology leader
Customer base: Broad customer base worldwide
Americas: 21 Centres
Asia: 30 Centres
Europe: 38 Centres
January 2013_Investor Presentation

Consistent high level of profitability in Q3 2012 Group EBIT margin at 11.6 %
With an EBIT margin of 11.6 %, Oerlikon operates on a continued high level
Strong margin improvements in the Textile and Drive Systems Segment
Positive currency impact
Growth in Europe +13 % and Asia +9% (whereof China +12 %)
Execution of Operational Excellence programs and portfolio adjustments
Consistent high level of profitability
in 2012
Page 23
Oerlikon net cash positive after strong operational and financial performance
and based on completion of comprehensive refinancing in July 2012
Order intake Sales*
837 +7%
Q3 2012 cont. op.
898
Q3 2011 restated
939 +2%
Q3 2012 cont. op.
957
Q3 2011 restated
EBIT
123 -10%
Q3 2012 cont. op.
111
Q3 2011 restated
Order backlog
1,485
-16%
Q3 2012 cont. op.
1,240
Q3 2011 restated
EBIT margin
13.1
-1.5% pts.
Q3 2012 cont. op.
11.6
Q3 2011 restated
* Sales to third parties
in CHF million in CHF million in CHF million in CHF million in %
January 2013_Investor Presentation

Key figures by Segment Q3 2012
Order intake Δ to Q3 2011
Order backlog Δ to Q3 2011
Sales* Δ to Q3 2011
EBIT % of sales
in CHF m Vacuum
93 +9.4 %
74 -1.3 %
92 -8.9 %
8 8.3 %
Page 24
Textile
486 +17.1 %
970 -20.0 %
524 +3.6 %
57 10.9 %
Coating
126 +5.0 %
n/a
126 +5.0 %
25 20.0 %
Adv.Tech.
28 +40.0 %
33 +50.0 %
20 -13.0 %
-1 n.a.
Drive
165 -16.2 %
163 -7.4 %
195 +3.2 %
18 9.3 %
Group**
898 +7.3 %
1 240 -16.5 %
957 +1.9 %
111 11.6 %
** restated
* Sales to third parties
January 2013_Investor Presentation

FX impact on Sales, EBIT and EBIT margin
+68+2
+887
+8%
Q3 2012 reported
+957
Translation effects
Transaction effect
Q3 2012 FX impact adj.
+10+4
+97
+14%
Q3 2012 reported
+111
Translation Effects
Transaction Effects
Q3 2012 FX impact adj.
11.6 10.9
Currency impact driven by strong development of USD and CNY
EBIT margin disproportionate affected due to currency mix in global network
EBIT margin in %
Page 25
* Sales to third parties
in CHF m
Oerlikon Group Sales* Q3 2012
in CHF m
Oerlikon Group EBIT Q3 2012
January 2013_Investor Presentation

Return On Capital Employed (ROCE) ROCE = NOPAT / Capital Employed
17.3%17.5%17.6%
Q3 2012 continuing operations
Q2 2012 continuing operations
Q1 2012 continuing operations
FY 2011 restated
16.5%
FY 2011 reported
14.9%
Page 26
in %
ROCE
9M 2012: improvement in 12-month rolling NOPAT and disproportionate increase in Capital Employed
Oerlikon Group creates value by earning premium over cost of capital
January 2013_Investor Presentation

Successful closing of Solar divestment will allow to further reduce debt (drawing of Facility A)
Oerlikon net cash positive by end of Q3 2012
483 486
345
196
-56%
Others
Bond
Facility C (old)
Facility B (old)
Facility A (new)
9M 2012
368
4
298*
66*
HY 2012
687
5
FY 2011
832
4
Page 27
Development of debt position FY 2011 – 9M 2012
* Including capitalized financing costs (Bond CHF 2 million, Facility A CHF 14 million)
January 2013_Investor Presentation
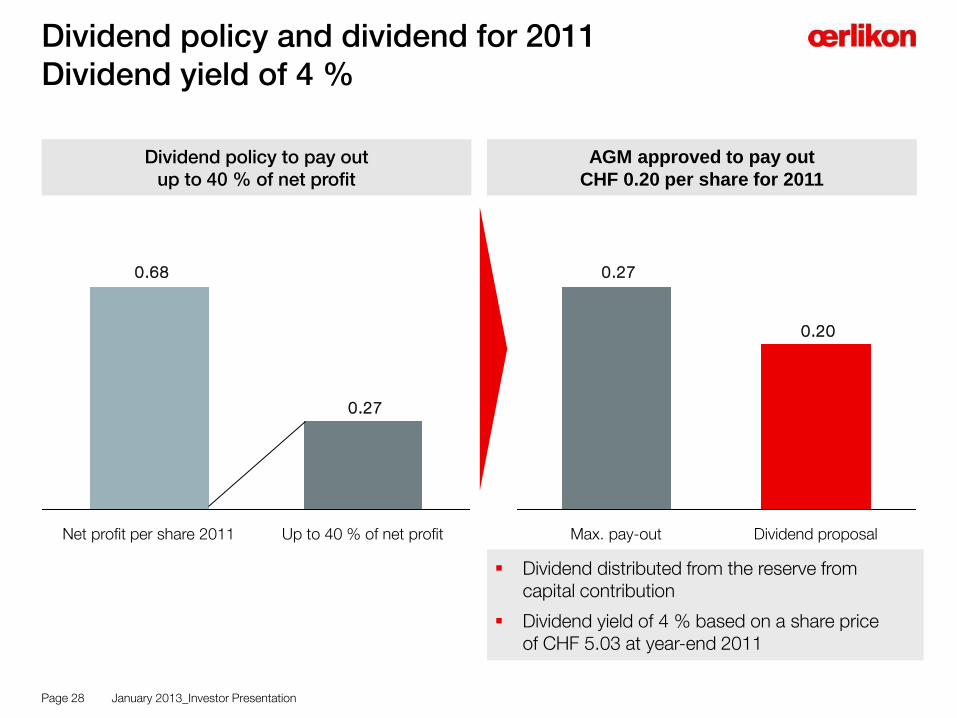
Dividend policy and dividend for 2011 Dividend yield of 4 %
0.27
0.68
Up to 40 % of net profit Net profit per share 2011
0.20
0.27
Max. pay-out Dividend proposal
Dividend distributed from the reserve from capital contribution
Dividend yield of 4 % based on a share price of CHF 5.03 at year-end 2011
Page 28
Dividend policy to pay out up to 40 % of net profit
AGM approved to pay out
CHF 0.20 per share for 2011
January 2013_Investor Presentation

Oerlikon Shares
Listed on Swiss Exchange (SIX) since 1975
Securities symbol: OERL
Securities number 81 682
ISIN: CH0000816824
No. of shares outstanding: 325 547 970 shares*
Re-entry to Swiss SMIM on April 17, 2012
Addition to STOXX Europe 600 as of June 18, 2012
48,86% Free Float 51,14%
Treasury Shares (part of Free Float)
0,15%
Renova Group
Page 29
* as of September 30, 2012
(as of June 14, 2012)
Oerlikon Shares Oerlikon Shareholder Structure
(as of December 31, 2012, Indexed; 100 percent = Closing price per December 31, 2011
Oerlikon Share Price Development
90.0
100.0
110.0
120.0
130.0
140.0
150.0
160.0
170.0
180.0
190.0
200.0
210.0
220.0
30.1
2.1
1
06.0
1.1
2
13.0
1.1
2
20.0
1.1
2
27.0
1.1
2
03.0
2.1
2
10.0
2.1
2
17.0
2.1
2
24.0
2.1
2
02.0
3.1
2
09.0
3.1
2
16.0
3.1
2
23.0
3.1
2
30.0
3.1
2
06.0
4.1
2
13.0
4.1
2
20.0
4.1
2
27.0
4.1
2
04.0
5.1
2
11.0
5.1
2
18.0
5.1
2
25.0
5.1
2
01.0
6.1
2
08.0
6.1
2
15.0
6.1
2
22.0
6.1
2
29.0
6.1
2
06.0
7.1
2
13.0
7.1
2
20.0
7.1
2
27.0
7.1
2
03.0
8.1
2
10.0
8.1
2
17.0
8.1
2
24.0
8.1
2
31.0
8.1
2
07.0
9.1
2
14.0
9.1
2
21.0
9.1
2
28.0
9.1
2
05.1
0.1
2
12.1
0.1
2
19.1
0.1
2
26.1
0.1
2
02.1
1.1
2
09.1
1.1
2
16.1
1.1
2
23.1
1.1
2
30.1
1.1
2
07.1
2.1
2
14.1
2.1
2
21.1
2.1
2
28.1
2.1
2
OC OERLIKON CORP SWISS MARKET INDEX SMIM PRICE INDEX STXE 600 € Pr
January 2013_Investor Presentation

Coverage 8 Buy/Accumulate – 2 Hold/Neutral
Page 30
Broker (as of December 31, 2012)
Analyst Recommendation Date of last update
Target Price
AlphaValue Pierre-Yves Gauthier Buy 06.12.2012 12.50
Bank am Bellevue Michael Studer Hold 20.12.2012 10.50
Berenberg Bank Benjamin Glaeser Buy 03.12.2012 11.00
Credit Suisse Patrick Laager Outperform 10.01.2013 14.20
Helvea SA Reto Amstalden Accumulate 10.12.2012 11.20
Kepler CM Christoph Ladner Buy 04.12.2012 11.00
MainFirst Resumption of coverage planned for 2013
Société Générale Jean Baptiste Roussille Hold 04.12.2012 11.00
UBS Torsten Wyss Buy 05.12.2012 12.00
Vontobel Michael Foeth Buy 04.12.2012 12.50
Zürcher Kantonalbank Armin Rechberger Overweight 04.12.2012 -
Consensus 11.99
January 2013_Investor Presentation

save space
Investor Relations Contact
OC Oerlikon Management AG Churerstrasse 120 CH-8808 Pfäffikon SZ Switzerland Andreas Schwarzwälder Head of Investor Relations Phone: +41-58-360-9622 Mobile: +41-79-810-8211 E-mail: [email protected]
Page 31 January 2013_Investor Presentation

save space
Oerlikon has made great efforts to include accurate and up-to-date information in this document. However, we make no representation or warranties, expressed or implied, as to the accuracy or completeness of the information provided in this document and we disclaim any liability whatsoever for the use of it.
This presentation is based on information currently available to management. The forward-looking statements contained herein could be substantially impacted by risks and influences that are not foreseeable at present, so that actual results may vary materially from those anticipated, expected or projected. Oerlikon is under no obligation to (and expressly disclaims any obligation to) update or alter its forward-looking statements, whether as a result of new information, future events or otherwise.
All information provided in this document is not intended as, and may not be construed as, an offer or solicitation for the purchase or disposal, trading or any transaction in any Oerlikon securities. Investors must not rely on this information for investment decisions.
Disclaimer
December 2012_Investor Presentation Page 32