Embed Size (px)
Citation preview
An agile high-frequency radar used for ionospheric research
Jingye Yan1,2, Ailan Lan1,2,*, Xiang Deng1,2,3, Jiaojiao Zhang1,2, Chi Wang1,2, and Hongbin Qiu4
1 National Space Science Center, Chinese Academy of Sciences, Beijing 100190, China2 State Key Laboratory of Space Weather, Beijing 100190, China3 University of Chinese Academy of Sciences, Beijing, 100049, China4 Jiamusi University, Jiamusi 154007, China
Received 30 May 2020 / Accepted 3 March 2021
Abstract –The Super Dual Radar Network (SuperDARN) is an international high-frequency (HF) radarnetwork used to study plasma convection in the upper atmosphere. An agile SuperDARN radar(AgileDARN radar) was deployed to join the network in Jiamusi, China. The AgileDARN radar is a digitalphased array radar equipped with an field-programmable gate array (FPGA)-based digital processing unit(DPU). It can operate as a standard SuperDARN radar or a multiple-input-multiple-out (MIMO) radar.Each channel can be controlled and processed separately. Digital beam forming (DBF) is used to makebeam steering flexible and beam switching fast. Multiple sub-beam forming for receiving can be imple-mented on FPGA or computer to improve position accuracy. Additionally, internal calibration and externalcalibration are carried out to improve the performance of beam forming. The internal calibration is a self-calibration without any external connections. Calibration signals are produced by the generators in DPU.The gain and phase of transmitters/receivers are read and compared to the based transmitter/receiver. Thenthe differences are recorded to compensate for the imbalances. During the external calibration, meteor trailsare used as calibration sources to detect the imbalance between antennas (including cables). The imbal-ances are compensated in the same way as the internal calibration. By calibration, the amplitude and phaseimbalances between channels are reduced significantly.
Keywords: HF radar / multiple sub-beam forming / calibration / SuperDARN
1 Introduction
The Super Dual Auroral Radar Network (SuperDARN) isan international collaborative organization. The SuperDARNradars are high-frequency (HF) radars that operate on frequen-cies between 8 and 20 MHz. These radars are used to remotelysense the backscatter from decameter-scale magnetic field-aligned plasma density irregularities in both the E and F regionsof the ionosphere (Greenwald et al., 1995). The movements ofthese irregularities respond to energy coupled into the auroraland sub-auroral regions from the solar wind and magnetosphere.Therefore, SuperDARN data provide scientists with informationregarding the Earth’s interaction with the space environment. Ithas been successful in addressing many space weather questionscovering the area of ionospheric convection, field-alignedcurrents, magnetic reconnection, substorms, MHD waves, theneutral atmosphere, and so on (Chisham et al., 2007; Nishitaniet al., 2019).
The history of SuperDARN has been introduced detailedlyin some pieces of literature (Greenwald et al., 1995; Chisham
et al., 2007; Nishitani et al., 2019). The extensive use of coher-ent scatter radars to study ionospheric convection began withthe Scandinavian Twin Auroral Radar Experiment (STARE)in the late 1970s (Greenwald et al., 1978). STARE consists oftwo pulsed bistatic phased-array radars located in Nalvik,Norway and Hankasalmi, Finland. It was the only instrumentcapable of providing two-dimensional images of the structureof ionospheric convection patterns at that time. Subsequently,several paired VHF radar systems including the Sweden AndBritain radar Experiment (SABRE) and the Bistatic AuroralRadar System (BARS) were developed. Both of these systemswere identified as elements of the DARN network. However,the prototype for the current SuperDARN radar is Goose BayHF radar developed by the Johns Hopkins University AppliedPhysics Laboratory, which commenced operations at GooseBay in October 1983 (Greenwald et al., 1985). The initialpurpose of the SuperDARN radar network was to observe theplasma convection at both Polar Regions; therefore, all the earlySuperDARN radars covered the auroral and polar regions(Greenwald et al., 1995). However, during periods of magneticstorms and substorm expansions, radars at high-latitude wereunable to completely map the convection process because the
Topical Issue - Space Weather Instrumentation
*Corresponding author: [email protected]
J. Space Weather Space Clim. 2021, 11, 25� J. Yan et al., Published by EDP Sciences 2021https://doi.org/10.1051/swsc/2021010
Available online at:www.swsc-journal.org
OPEN ACCESSTECHNICAL ARTICLE
This is an Open Access article distributed under the terms of the Creative Commons Attribution License (https://creativecommons.org/licenses/by/4.0),which permits unrestricted use, distribution, and reproduction in any medium, provided the original work is properly cited.
RETRACTED
equatorward expansion of the auroral oval used to reach to mid-latitude region. The expansion of the SuperDARN network tothe mid-latitudes allows the SuperDARN network to trace theplasma convection processes during magnetic storm andsubstorm activity (Baker et al., 2007). The first mid-latituderadar, the Wallops Island radar, was constructed in 2005, shortlyfollowed by the second mid-latitude radar in Hokkaido,Hokkaido East radar (HOK) in 2006. Until 2018, more thanten SuperDARN radars have been built in mid-latitude regionsin the northern hemisphere (Nishitani et al., 2019).
There is another mid-latitude SuperDARN radar establishedin Jiamusi (China) in 2017. It is developed as an agileSuperDARN radar (AgileDARN) by the National SpaceScience Center, Chinese Academic of Sciences. The radarextends the coverage of the mid-latitude SuperDARN chain intoChina. Its data have been contributed to the SuperDARN datastream since 2019. The measurements during storm time showthe contribution to the ionospheric convection patterns (Zhanget al., 2020). Supported by the Chinese Meridian Project-II,six additional AgileDARN radars in three sites (Bayinbluk,Siziwangqi Banner, and Longjing) are under construction tocover the mid-latitude region over China and expand the cover-age of the mid-latitude HF radar considerably. The significantlyexpanded coverage of mid-latitude SuperDARN plays animportant role in SAPS (sub-auroral polarization stream)research, including dependence of SPS on solar wind andgeomagnetic drivers, interhemispheric comparisons of SAPS,evolution, and variability of SAPS, etc. (Nishitani et al.,2019). Meanwhile, the data from the mid-latitude radars havea dramatic effect on the overall convection strength, increasingthe cross-polar cap potential and changing the potential contourson the nightside (Baker et al., 2007; Chisham et al., 2007).
The paper is organized as follows. In Section 2, we describethe system configuration and the specific design features inhardware. In Section 3, we focus on the advanced signal pro-cessing methods based on the distributed structure. We presentthe measured data to validate the proposed methods. Finally, thesummary and conclusion are given in Section 4.
2 System description
The AgileDARN radar is built as one part of the Super-DARN network. Its operational concept is essentially identicalto other SuperDARN radars. Meanwhile, the radar has somedistinctive designs.
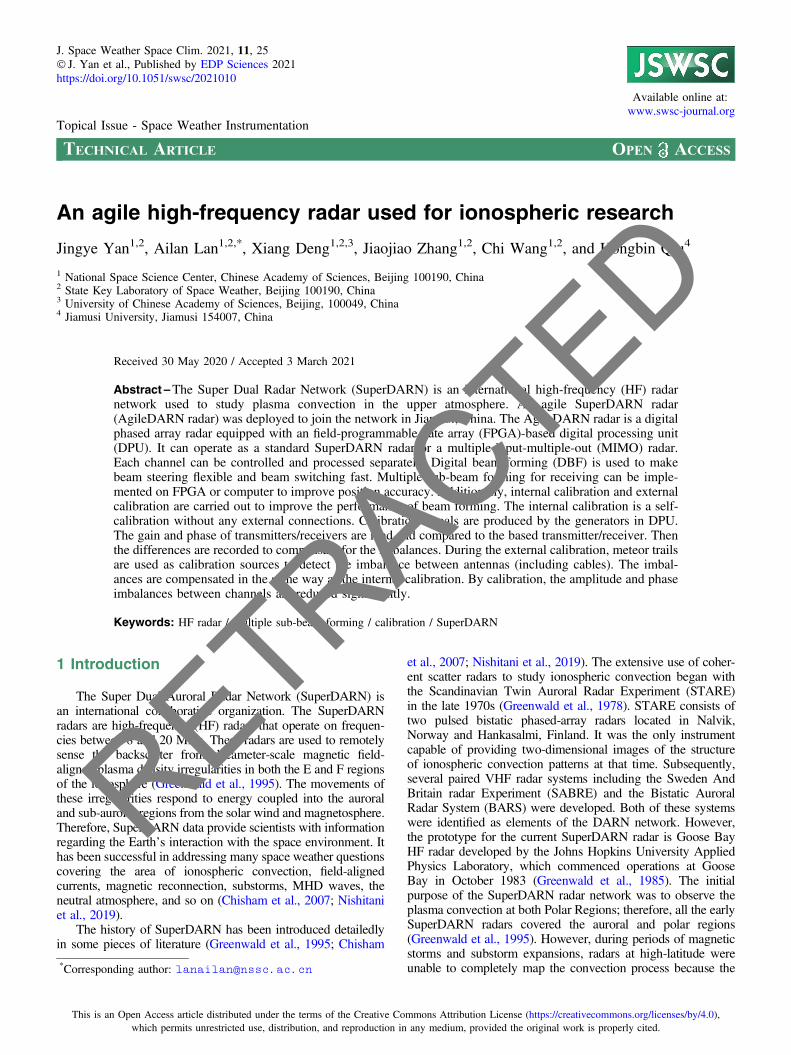
The AgileDARN radar is composed of two arrays, 20individual transceivers, a digital processing unit (DPU), and acomputer (shown as Fig. 1). The primary array consists ofsixteen twin-terminated folded dipole (TTFD) elements with12.8 m spacing, designed as the Blackstone radar (Sterneet al., 2011). The interferometric array with four antennas isused to estimate the elevation angle of the incoming signal.The phasing matrix used in the early SuperDARN radar is aban-doned. Beam steering and beam switching are implemented bydigital beam forming (DBF) (Whittington et al., 2002; Custovicet al., 2012; Deng et al., 2019). Each antenna has its owntransceiver, which has a separate transmitter and receiver. Theantennas are transmit-receive shared. They switch between thetransmitters and receivers by transmitter/receiver (Tx/Rx)
switches. Besides, directional couplers and combinationswitches are added in transceivers to implement internal calibra-tion, see the “calibration circuit” subsection. All the controlsignals of the switches are provided by the DPU.
The DPU is composed of a direct digital synthesis (DDS)module, a digital signal processing module, a timing controller,20 analog-to-digital converters (ADCs), and 20 digital-to-analogconverters (DACs). It performs signal generation and process-ing, commanding and control of the system, instrument healthmonitoring, scientific data acquisition, and formatting. Thesefunctions are implemented based on field-programmable gatearrays (FPGAs), which makes the radar flexible. Most of theradar parameters are adjustable to meet different types ofobservation. Each channel can be controlled and processedseparately. Consequently, the radar can operate as a multiple-input-multiple-output (MIMO) radar, besides a standardSuperDARN radar. The twenty separate receivers are allowedeach to be recorded and stored independently. Beamformingand calibrations can be performed online or offline as needed.The radar can respond quickly to a request for special observa-tion. Therefore, the radar is called AgileDARN.
The computer is used as a platform on which radar controlsoftware can be run. The control software is to take control ofthe radar to operate as required. Operation parameters andsequences are configured in the software but carried out onthe DPU. The two parts communicate with each other via aperipheral component interconnect express (PCIe) bus.
2.1 Field of view
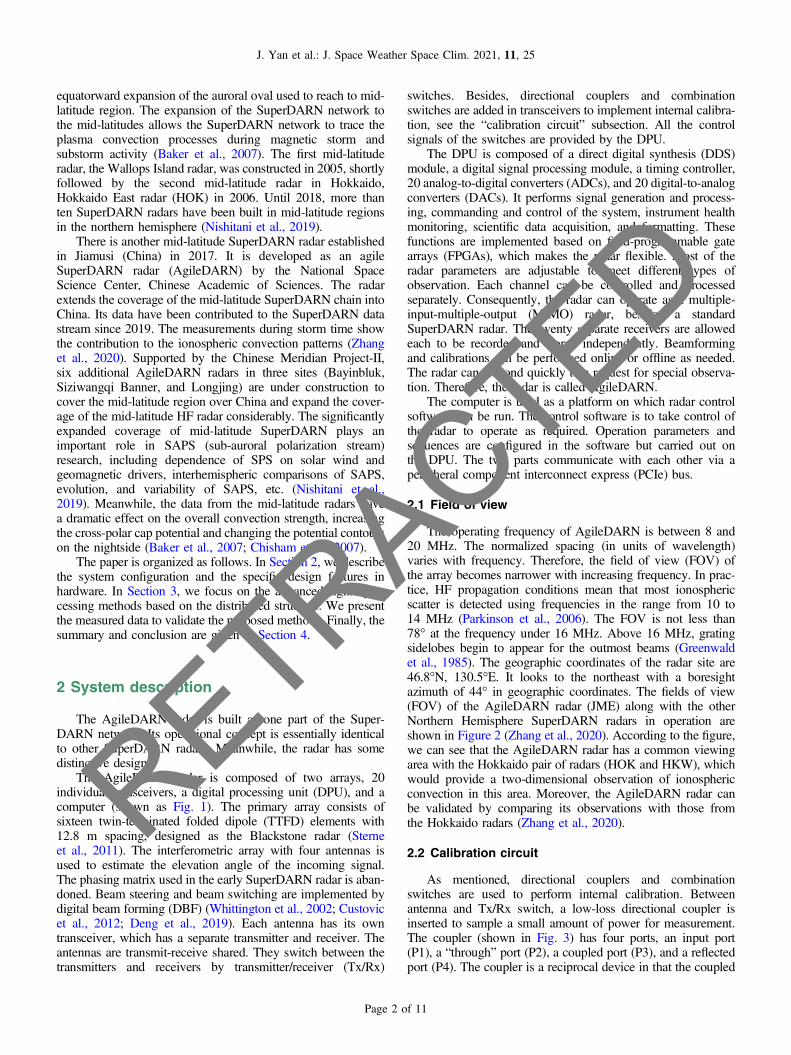
The operating frequency of AgileDARN is between 8 and20 MHz. The normalized spacing (in units of wavelength)varies with frequency. Therefore, the field of view (FOV) ofthe array becomes narrower with increasing frequency. In prac-tice, HF propagation conditions mean that most ionosphericscatter is detected using frequencies in the range from 10 to14 MHz (Parkinson et al., 2006). The FOV is not less than78� at the frequency under 16 MHz. Above 16 MHz, gratingsidelobes begin to appear for the outmost beams (Greenwaldet al., 1985). The geographic coordinates of the radar site are46.8�N, 130.5�E. It looks to the northeast with a boresightazimuth of 44� in geographic coordinates. The fields of view(FOV) of the AgileDARN radar (JME) along with the otherNorthern Hemisphere SuperDARN radars in operation areshown in Figure 2 (Zhang et al., 2020). According to the figure,we can see that the AgileDARN radar has a common viewingarea with the Hokkaido pair of radars (HOK and HKW), whichwould provide a two-dimensional observation of ionosphericconvection in this area. Moreover, the AgileDARN radar canbe validated by comparing its observations with those fromthe Hokkaido radars (Zhang et al., 2020).
2.2 Calibration circuit
As mentioned, directional couplers and combinationswitches are used to perform internal calibration. Betweenantenna and Tx/Rx switch, a low-loss directional coupler isinserted to sample a small amount of power for measurement.The coupler (shown in Fig. 3) has four ports, an input port(P1), a “through” port (P2), a coupled port (P3), and a reflectedport (P4). The coupler is a reciprocal device in that the coupled
J. Yan et al.: J. Space Weather Space Clim. 2021, 11, 25
Page 2 of 11
RETRACTED
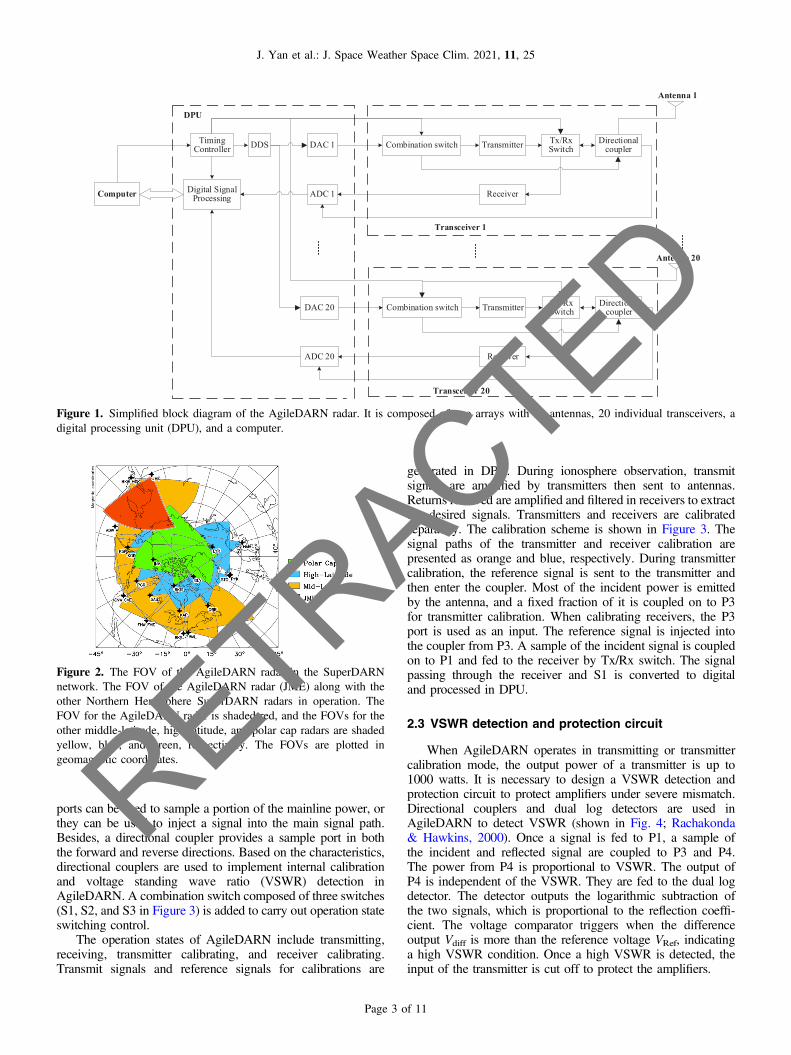
ports can be used to sample a portion of the mainline power, orthey can be used to inject a signal into the main signal path.Besides, a directional coupler provides a sample port in boththe forward and reverse directions. Based on the characteristics,directional couplers are used to implement internal calibrationand voltage standing wave ratio (VSWR) detection inAgileDARN. A combination switch composed of three switches(S1, S2, and S3 in Figure 3) is added to carry out operation stateswitching control.
The operation states of AgileDARN include transmitting,receiving, transmitter calibrating, and receiver calibrating.Transmit signals and reference signals for calibrations are
generated in DPU. During ionosphere observation, transmitsignals are amplified by transmitters then sent to antennas.Returns received are amplified and filtered in receivers to extractthe desired signals. Transmitters and receivers are calibratedseparately. The calibration scheme is shown in Figure 3. Thesignal paths of the transmitter and receiver calibration arepresented as orange and blue, respectively. During transmittercalibration, the reference signal is sent to the transmitter andthen enter the coupler. Most of the incident power is emittedby the antenna, and a fixed fraction of it is coupled on to P3for transmitter calibration. When calibrating receivers, the P3port is used as an input. The reference signal is injected intothe coupler from P3. A sample of the incident signal is coupledon to P1 and fed to the receiver by Tx/Rx switch. The signalpassing through the receiver and S1 is converted to digitaland processed in DPU.
2.3 VSWR detection and protection circuit
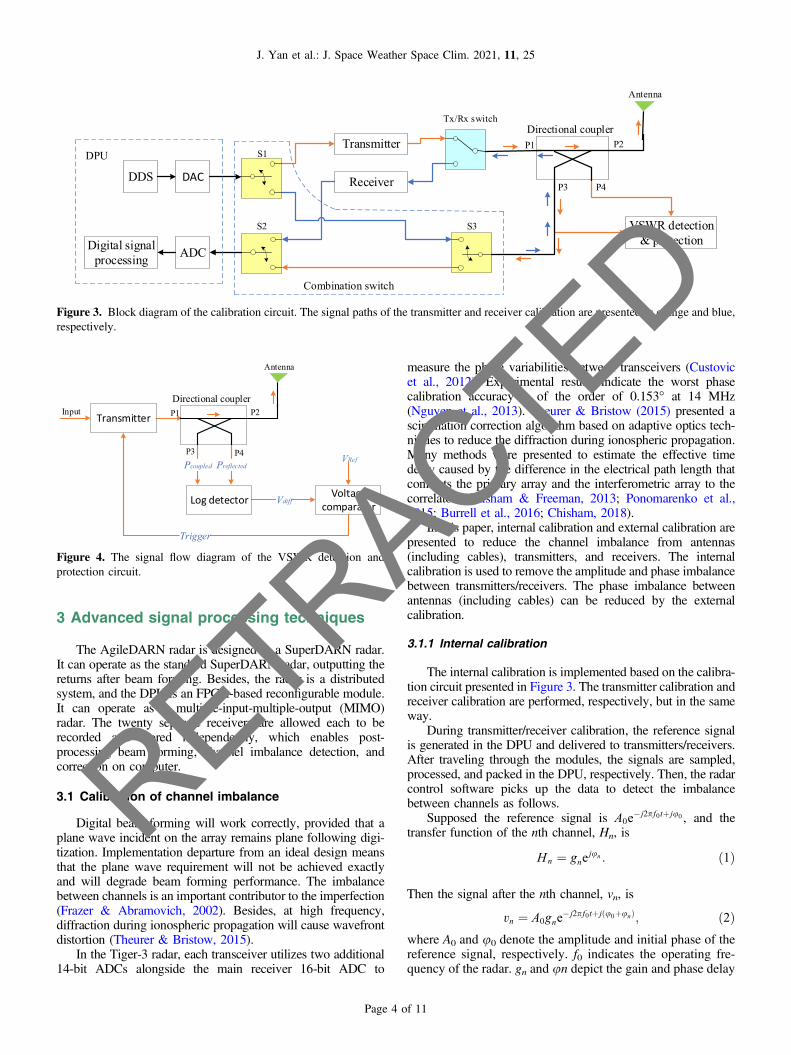
When AgileDARN operates in transmitting or transmittercalibration mode, the output power of a transmitter is up to1000 watts. It is necessary to design a VSWR detection andprotection circuit to protect amplifiers under severe mismatch.Directional couplers and dual log detectors are used inAgileDARN to detect VSWR (shown in Fig. 4; Rachakonda& Hawkins, 2000). Once a signal is fed to P1, a sample ofthe incident and reflected signal are coupled to P3 and P4.The power from P4 is proportional to VSWR. The output ofP4 is independent of the VSWR. They are fed to the dual logdetector. The detector outputs the logarithmic subtraction ofthe two signals, which is proportional to the reflection coeffi-cient. The voltage comparator triggers when the differenceoutput Vdiff is more than the reference voltage VRef, indicatinga high VSWR condition. Once a high VSWR is detected, theinput of the transmitter is cut off to protect the amplifiers.
Timing Controller
DDS TransmitterTx/Rx Switch
Directional coupler
ADC 1
Combination switch
Digital Signal Processing
Computer
DPU
Transceiver 1
Antenna 1
Receiver
DAC 1
TransmitterTx/Rx Switch
Directional coupler
ADC 20
Combination switch
Transceiver 20
Antenna 20
Receiver
DAC 20
Figure 1. Simplified block diagram of the AgileDARN radar. It is composed of two arrays with 20 antennas, 20 individual transceivers, adigital processing unit (DPU), and a computer.
Figure 2. The FOV of the AgileDARN radar in the SuperDARNnetwork. The FOV of the AgileDARN radar (JME) along with theother Northern Hemisphere SuperDARN radars in operation. TheFOV for the AgileDARN radar is shaded red, and the FOVs for theother middle-latitude, high-latitude, and polar cap radars are shadedyellow, blue, and green, respectively. The FOVs are plotted ingeomagnetic coordinates.
J. Yan et al.: J. Space Weather Space Clim. 2021, 11, 25
Page 3 of 11
RETRACTED
3 Advanced signal processing techniques
The AgileDARN radar is designed as a SuperDARN radar.It can operate as the standard SuperDARN radar, outputting thereturns after beam forming. Besides, the radar is a distributedsystem, and the DPU is an FPGA-based reconfigurable module.It can operate as a multiple-input-multiple-output (MIMO)radar. The twenty separate receivers are allowed each to berecorded and stored independently, which enables post-processing beam forming, channel imbalance detection, andcorrection on computer.
3.1 Calibration of channel imbalance
Digital beam forming will work correctly, provided that aplane wave incident on the array remains plane following digi-tization. Implementation departure from an ideal design meansthat the plane wave requirement will not be achieved exactlyand will degrade beam forming performance. The imbalancebetween channels is an important contributor to the imperfection(Frazer & Abramovich, 2002). Besides, at high frequency,diffraction during ionospheric propagation will cause wavefrontdistortion (Theurer & Bristow, 2015).
In the Tiger-3 radar, each transceiver utilizes two additional14-bit ADCs alongside the main receiver 16-bit ADC to
measure the phase variabilities between transceivers (Custovicet al., 2012). Experimental results indicate the worst phasecalibration accuracy is of the order of 0.153� at 14 MHz(Nguyen et al., 2013). Theurer & Bristow (2015) presented ascintillation correction algorithm based on adaptive optics tech-niques to reduce the diffraction during ionospheric propagation.Many methods were presented to estimate the effective timedelay caused by the difference in the electrical path length thatconnects the primary array and the interferometric array to thecorrelator (Chisham & Freeman, 2013; Ponomarenko et al.,2015; Burrell et al., 2016; Chisham, 2018).
In this paper, internal calibration and external calibration arepresented to reduce the channel imbalance from antennas(including cables), transmitters, and receivers. The internalcalibration is used to remove the amplitude and phase imbalancebetween transmitters/receivers. The phase imbalance betweenantennas (including cables) can be reduced by the externalcalibration.
3.1.1 Internal calibration
The internal calibration is implemented based on the calibra-tion circuit presented in Figure 3. The transmitter calibration andreceiver calibration are performed, respectively, but in the sameway.
During transmitter/receiver calibration, the reference signalis generated in the DPU and delivered to transmitters/receivers.After traveling through the modules, the signals are sampled,processed, and packed in the DPU, respectively. Then, the radarcontrol software picks up the data to detect the imbalancebetween channels as follows.
Supposed the reference signal is A0e�j2pf0tþju0 , and the
transfer function of the nth channel, Hn, is
Hn ¼ gnejun : ð1Þ
Then the signal after the nth channel, vn, is
vn ¼ A0gne�j2pf0tþjðu0þunÞ; ð2Þ
where A0 and u0 denote the amplitude and initial phase of thereference signal, respectively. f0 indicates the operating fre-quency of the radar. gn and un depict the gain and phase delay
Figure 3. Block diagram of the calibration circuit. The signal paths of the transmitter and receiver calibration are presented as orange and blue,respectively.
P3
PreflectedPcoupled
Vdiff
Trigger
VRef
P1 P2
Antenna
Directional coupler
P4
Input
Figure 4. The signal flow diagram of the VSWR detection andprotection circuit.
J. Yan et al.: J. Space Weather Space Clim. 2021, 11, 25
Page 4 of 11
RETRACTED
of the nth transmitter/receiver. With the same input signal, thedifference between the output signals represents theimbalance.
Given the 1st channel as the reference, the differencebetween the nth Tx/Rx and the 1st Tx/Rx can be obtained bycomparing vn with v1.
�gn ¼gng1
�uTx=Rx;n ¼ un � u1
8><
>:ð3Þ
where Dgn and D/n are the correction factors for the nthTx/Rx that compensate for amplitude and phase imbalance,respectively. Since the imbalances between Tx/Rxs have beendetected, the next step is to remove these differences bycompensation.
The correction for transmitters is implemented on FPGAand executed in real-time. The transmitter correction factorsare distributed to the generators, compensating transmit signalsfor transmitter imbalances. Assuming that two sinusoid signalswith the same frequency and 90-degree out of phase aregenerated:
sI ;n tð Þ ¼ A0 cosð2pf0tÞsQ;n tð Þ ¼ A0 sinð2pf0tÞ
(
ð4Þ
where f0 is the operating frequency, and A0 is the amplitudeof the transmit signal. sI,n(t) and sQ,n(t) are the real andimaginary part of the complex transmit signal, sn (t), beforeDBF.
sn tð Þ ¼ sI ;n tð Þ þ jsQ;n tð Þ ¼ A0ej2pf0t: ð5Þ
The transmit signal after correction is expressed as
scn tð Þ ¼ A0
�gncos 2pf0t ��uTx;n
� �þ jA0
�gn� sin 2pf0t ��uTx;n
� �: ð6Þ
The receiver imbalances are corrected in the same way as thetransmitter imbalance, whereas the signals compensated areechoes. The correction process can be executed in real-time(based on FPGA) or post-processed on computer.
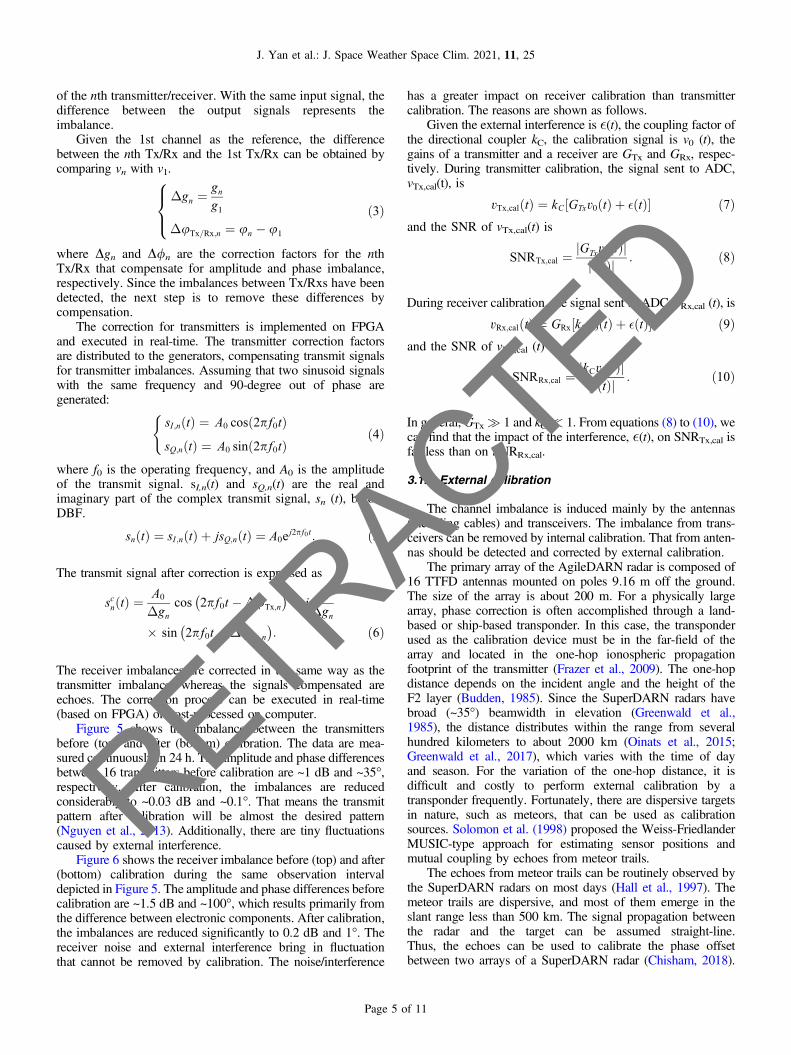
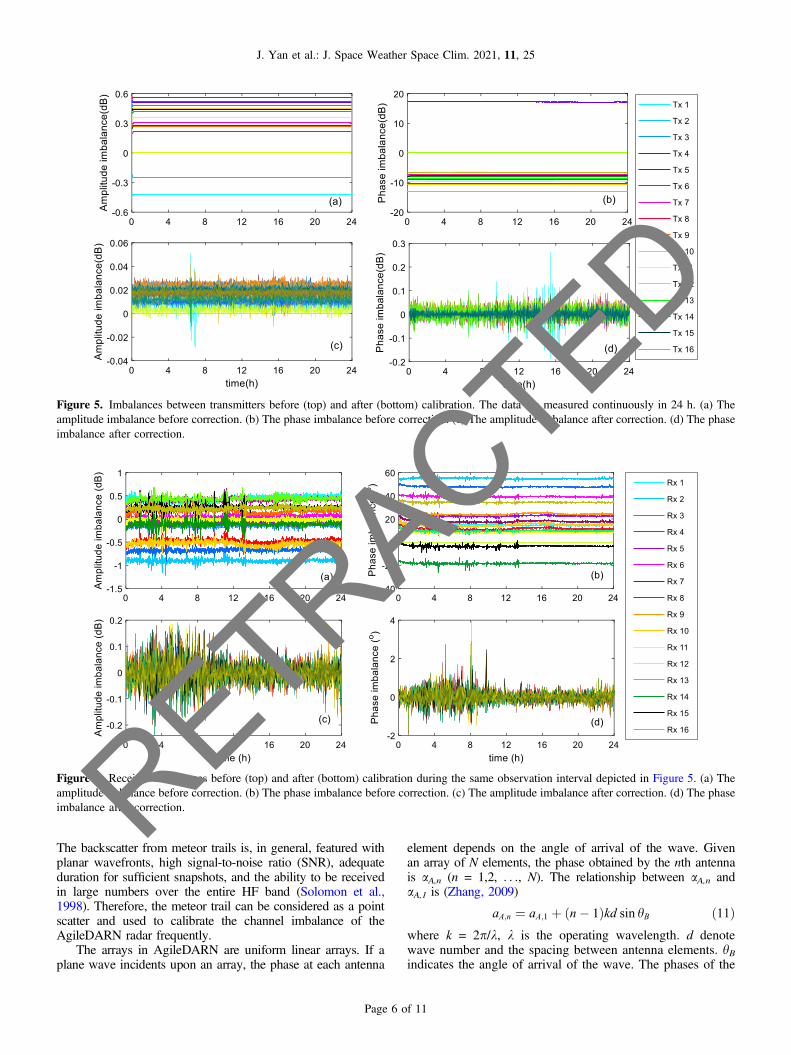
Figure 5 shows the imbalance between the transmittersbefore (top) and after (bottom) calibration. The data are mea-sured continuously in 24 h. The amplitude and phase differencesbetween 16 transmitters before calibration are ~1 dB and ~35�,respectively. After calibration, the imbalances are reducedconsiderably to ~0.03 dB and ~0.1�. That means the transmitpattern after calibration will be almost the desired pattern(Nguyen et al., 2013). Additionally, there are tiny fluctuationscaused by external interference.
Figure 6 shows the receiver imbalance before (top) and after(bottom) calibration during the same observation intervaldepicted in Figure 5. The amplitude and phase differences beforecalibration are ~1.5 dB and ~100�, which results primarily fromthe difference between electronic components. After calibration,the imbalances are reduced significantly to 0.2 dB and 1�. Thereceiver noise and external interference bring in fluctuationthat cannot be removed by calibration. The noise/interference
has a greater impact on receiver calibration than transmittercalibration. The reasons are shown as follows.
Given the external interference is �(t), the coupling factor ofthe directional coupler kC, the calibration signal is v0 (t), thegains of a transmitter and a receiver are GTx and GRx, respec-tively. During transmitter calibration, the signal sent to ADC,vTx,cal(t), is
vTx;cal tð Þ ¼ kC GTxv0 tð Þ þ �ðtÞ½ � ð7Þand the SNR of vTx,cal(t) is
SNRTx;cal ¼ jGTxv0 tð Þjj� tð Þj : ð8Þ
During receiver calibration, the signal sent to ADC, vRx,cal (t), is
vRx;cal tð Þ ¼ GRx½kCv0 tð Þ þ � tð Þ� ð9Þand the SNR of vRx,cal (t) is
SNRRx;cal ¼ jkCv0 tð Þjj� tð Þj : ð10Þ
In general, GTx � 1 and kC � 1. From equations (8) to (10), wecan find that the impact of the interference, �(t), on SNRTx,cal isfar less than on SNRRx,cal.
3.1.2 External calibration
The channel imbalance is induced mainly by the antennas(including cables) and transceivers. The imbalance from trans-ceivers can be removed by internal calibration. That from anten-nas should be detected and corrected by external calibration.
The primary array of the AgileDARN radar is composed of16 TTFD antennas mounted on poles 9.16 m off the ground.The size of the array is about 200 m. For a physically largearray, phase correction is often accomplished through a land-based or ship-based transponder. In this case, the transponderused as the calibration device must be in the far-field of thearray and located in the one-hop ionospheric propagationfootprint of the transmitter (Frazer et al., 2009). The one-hopdistance depends on the incident angle and the height of theF2 layer (Budden, 1985). Since the SuperDARN radars havebroad (~35�) beamwidth in elevation (Greenwald et al.,1985), the distance distributes within the range from severalhundred kilometers to about 2000 km (Oinats et al., 2015;Greenwald et al., 2017), which varies with the time of dayand season. For the variation of the one-hop distance, it isdifficult and costly to perform external calibration by atransponder frequently. Fortunately, there are dispersive targetsin nature, such as meteors, that can be used as calibrationsources. Solomon et al. (1998) proposed the Weiss-FriedlanderMUSIC-type approach for estimating sensor positions andmutual coupling by echoes from meteor trails.
The echoes from meteor trails can be routinely observed bythe SuperDARN radars on most days (Hall et al., 1997). Themeteor trails are dispersive, and most of them emerge in theslant range less than 500 km. The signal propagation betweenthe radar and the target can be assumed straight-line.Thus, the echoes can be used to calibrate the phase offsetbetween two arrays of a SuperDARN radar (Chisham, 2018).
J. Yan et al.: J. Space Weather Space Clim. 2021, 11, 25
Page 5 of 11
RETRACTED
The backscatter from meteor trails is, in general, featured withplanar wavefronts, high signal-to-noise ratio (SNR), adequateduration for sufficient snapshots, and the ability to be receivedin large numbers over the entire HF band (Solomon et al.,1998). Therefore, the meteor trail can be considered as a pointscatter and used to calibrate the channel imbalance of theAgileDARN radar frequently.
The arrays in AgileDARN are uniform linear arrays. If aplane wave incidents upon an array, the phase at each antenna
element depends on the angle of arrival of the wave. Givenan array of N elements, the phase obtained by the nth antennais aA,n (n = 1,2, . . ., N). The relationship between aA,n andaA,1 is (Zhang, 2009)
aA;n ¼ aA;1 þ n� 1ð Þkd sin hB ð11Þwhere k = 2p/k, k is the operating wavelength. d denotewave number and the spacing between antenna elements. hBindicates the angle of arrival of the wave. The phases of the
Figure 5. Imbalances between transmitters before (top) and after (bottom) calibration. The data are measured continuously in 24 h. (a) Theamplitude imbalance before correction. (b) The phase imbalance before correction. (c) The amplitude imbalance after correction. (d) The phaseimbalance after correction.
Figure 6. Receiver imbalances before (top) and after (bottom) calibration during the same observation interval depicted in Figure 5. (a) Theamplitude imbalance before correction. (b) The phase imbalance before correction. (c) The amplitude imbalance after correction. (d) The phaseimbalance after correction.
J. Yan et al.: J. Space Weather Space Clim. 2021, 11, 25
Page 6 of 11
RETRACTED
antennas increase or decrease linearly, which is determinedby hB. When the channel imbalance exists, the linearity willbe destroyed. The deviations from linear indicate theimbalance.
During external calibration, internal calibration is performedin real-time to remove the imbalance between transceivers. Theprocess steps for external calibration are shown as follows:
1. Pick up meteor echoes based on some currently recog-nized characteristics of SuperDARN meteor echoes, suchas slant range, SNR, line-of-sight (LOS) Doppler velocity,spectral width, and altitude (elevation angle) (Solomonet al., 1998).
2. Further, calculate the phases of echoes received bythe antenna elements. The least-squares linear fittingmethod is used to fit a linear model to the unwrappedphase.
3. The slope of the fit line represents in equation (11). Thedeviations from the line denote the antenna (includingcable) imbalance, DaA,n.
4. The correction factors for transmitting channel (includingantenna, cable, and transmitter) and receiving channel(including antenna, cable, and receiver) are expressed as
�/T ;n ¼ �uTx;n þ�aA;n
�/R;n ¼ �uRx;n þ�aA;n
(
ð12Þ
where the subscript n denotes the channel index. D/T andD/R depict the correction factor for transmitting channeland receiving channel, respectively.
5. The last step is to correct the imbalance. The antennaimbalances are corrected in the same way as the Tx/Rximbalances. The transmitting correction factors are usedto compensate the transmit signals, and the receivingcorrection factors are used to compensate the echoes.
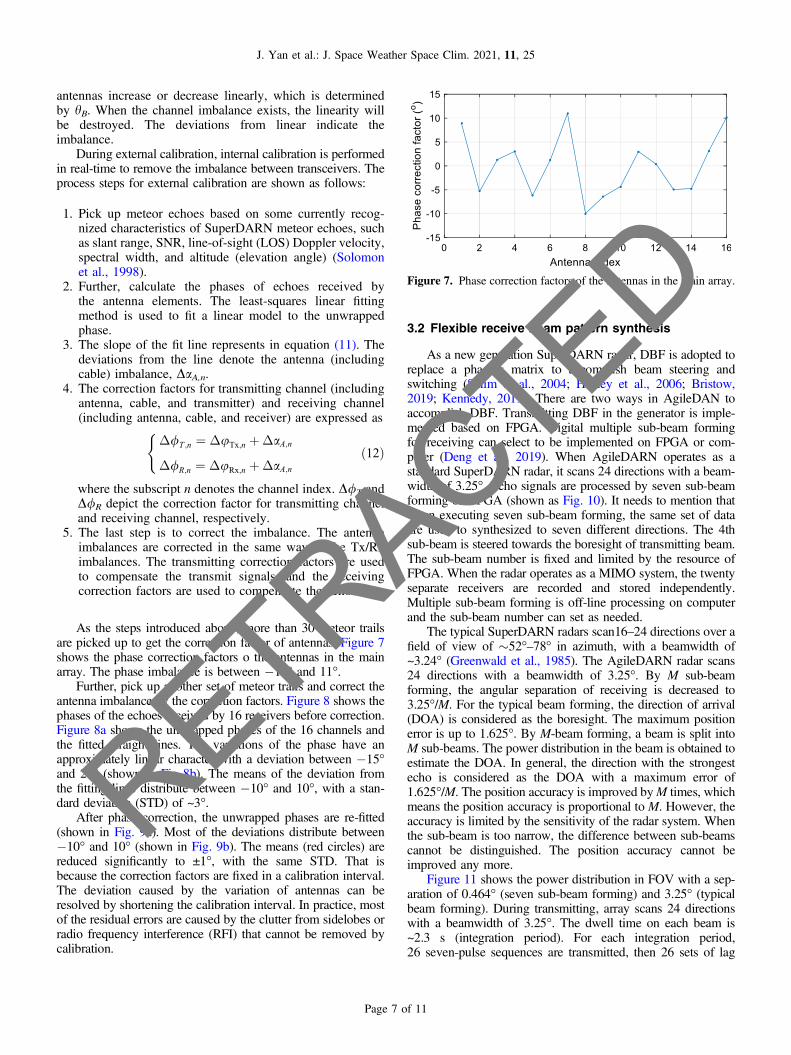
As the steps introduced above, more than 30 meteor trailsare picked up to get the correction factor of antennas. Figure 7shows the phase correction factors o the antennas in the mainarray. The phase imbalance is between �10� and 11�.
Further, pick up another set of meteor trails and correct theantenna imbalance by the correction factors. Figure 8 shows thephases of the echoes received by 16 receivers before correction.Figure 8a shows the unwrapped phases of the 16 channels andthe fitted straight lines. The variations of the phase have anapproximately linear character with a deviation between �15�and 20� (shown in Fig 8b). The means of the deviation fromthe fitting lines distribute between �10� and 10�, with a stan-dard deviation (STD) of ~3�.
After phase correction, the unwrapped phases are re-fitted(shown in Fig. 9a). Most of the deviations distribute between�10� and 10� (shown in Fig. 9b). The means (red circles) arereduced significantly to ±1�, with the same STD. That isbecause the correction factors are fixed in a calibration interval.The deviation caused by the variation of antennas can beresolved by shortening the calibration interval. In practice, mostof the residual errors are caused by the clutter from sidelobes orradio frequency interference (RFI) that cannot be removed bycalibration.
3.2 Flexible receive beam pattern synthesis
As a new generation SuperDARN radar, DBF is adopted toreplace a phasing matrix to accomplish beam steering andswitching (Salim et al., 2004; Healey et al., 2006; Bristow,2019; Kennedy, 2019). There are two ways in AgileDAN toaccomplish DBF. Transmitting DBF in the generator is imple-mented based on FPGA. Digital multiple sub-beam formingfor receiving can select to be implemented on FPGA or com-puter (Deng et al., 2019). When AgileDARN operates as astandard SuperDARN radar, it scans 24 directions with a beam-width of 3.25�. Echo signals are processed by seven sub-beamforming on FPGA (shown as Fig. 10). It needs to mention thatwhen executing seven sub-beam forming, the same set of dataare used to synthesized to seven different directions. The 4thsub-beam is steered towards the boresight of transmitting beam.The sub-beam number is fixed and limited by the resource ofFPGA. When the radar operates as a MIMO system, the twentyseparate receivers are recorded and stored independently.Multiple sub-beam forming is off-line processing on computerand the sub-beam number can set as needed.
The typical SuperDARN radars scan16–24 directions over afield of view of �52�–78� in azimuth, with a beamwidth of~3.24� (Greenwald et al., 1985). The AgileDARN radar scans24 directions with a beamwidth of 3.25�. By M sub-beamforming, the angular separation of receiving is decreased to3.25�/M. For the typical beam forming, the direction of arrival(DOA) is considered as the boresight. The maximum positionerror is up to 1.625�. By M-beam forming, a beam is split intoM sub-beams. The power distribution in the beam is obtained toestimate the DOA. In general, the direction with the strongestecho is considered as the DOA with a maximum error of1.625�/M. The position accuracy is improved byM times, whichmeans the position accuracy is proportional to M. However, theaccuracy is limited by the sensitivity of the radar system. Whenthe sub-beam is too narrow, the difference between sub-beamscannot be distinguished. The position accuracy cannot beimproved any more.
Figure 11 shows the power distribution in FOV with a sep-aration of 0.464� (seven sub-beam forming) and 3.25� (typicalbeam forming). During transmitting, array scans 24 directionswith a beamwidth of 3.25�. The dwell time on each beam is~2.3 s (integration period). For each integration period,26 seven-pulse sequences are transmitted, then 26 sets of lag
Figure 7. Phase correction factors of the antennas in the main array.
J. Yan et al.: J. Space Weather Space Clim. 2021, 11, 25
Page 7 of 11
RETRACTED
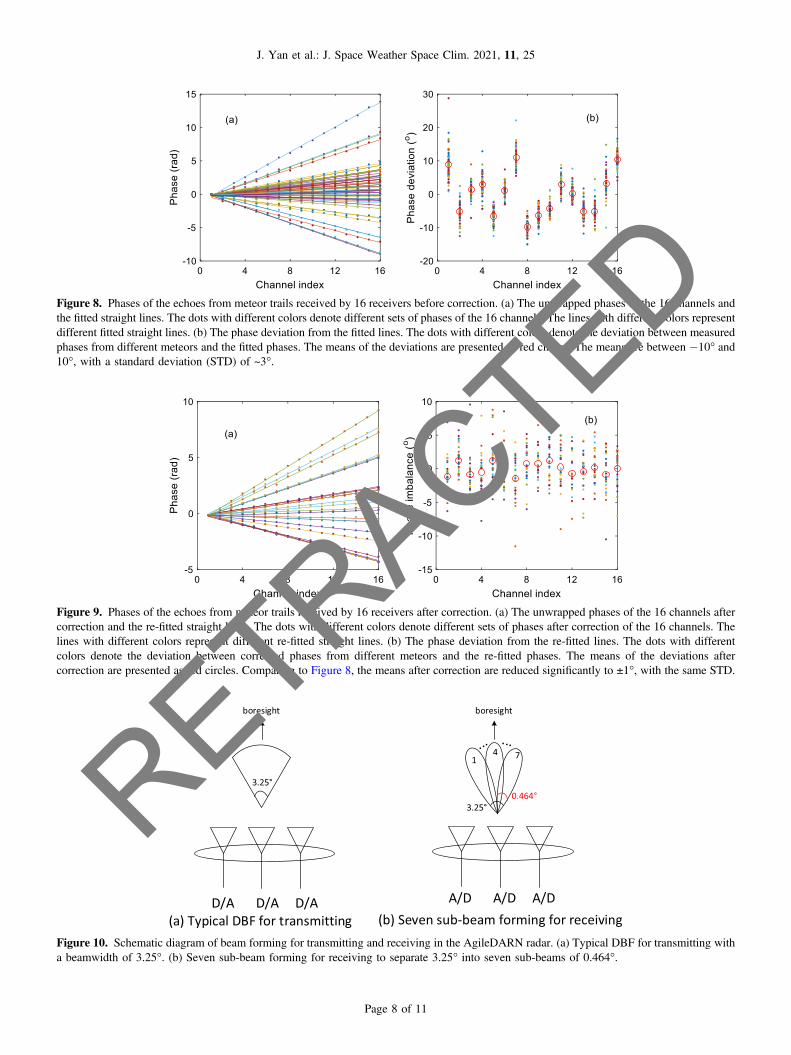
Figure 8. Phases of the echoes from meteor trails received by 16 receivers before correction. (a) The unwrapped phases of the 16 channels andthe fitted straight lines. The dots with different colors denote different sets of phases of the 16 channels. The lines with different colors representdifferent fitted straight lines. (b) The phase deviation from the fitted lines. The dots with different colors denote the deviation between measuredphases from different meteors and the fitted phases. The means of the deviations are presented as red circles. The means are between �10� and10�, with a standard deviation (STD) of ~3�.
Figure 9. Phases of the echoes from meteor trails received by 16 receivers after correction. (a) The unwrapped phases of the 16 channels aftercorrection and the re-fitted straight lines. The dots with different colors denote different sets of phases after correction of the 16 channels. Thelines with different colors represent different re-fitted straight lines. (b) The phase deviation from the re-fitted lines. The dots with differentcolors denote the deviation between corrected phases from different meteors and the re-fitted phases. The means of the deviations aftercorrection are presented as red circles. Comparing to Figure 8, the means after correction are reduced significantly to ±1�, with the same STD.
Figure 10. Schematic diagram of beam forming for transmitting and receiving in the AgileDARN radar. (a) Typical DBF for transmitting witha beamwidth of 3.25�. (b) Seven sub-beam forming for receiving to separate 3.25� into seven sub-beams of 0.464�.
J. Yan et al.: J. Space Weather Space Clim. 2021, 11, 25
Page 8 of 11
RETRACTED
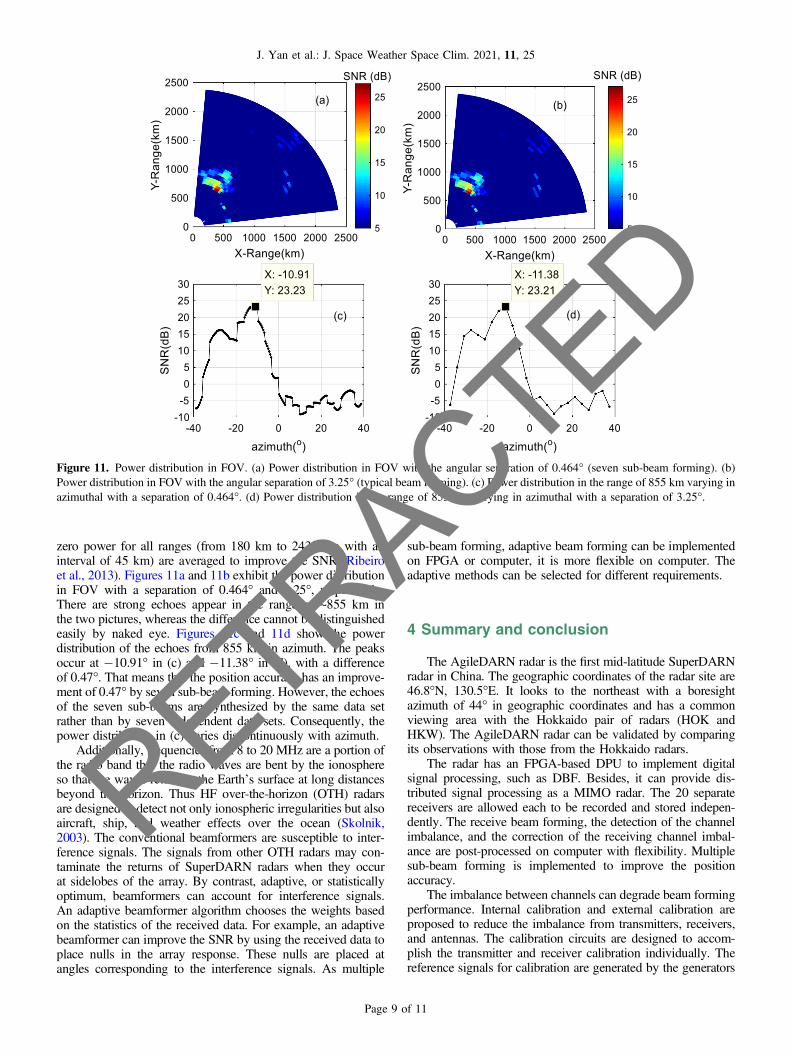
zero power for all ranges (from 180 km to 2430 km with aninterval of 45 km) are averaged to improve the SNR (Ribeiroet al., 2013). Figures 11a and 11b exhibit the power distributionin FOV with a separation of 0.464� and 3.25�, respectively.There are strong echoes appear in the range of ~855 km inthe two pictures, whereas the difference cannot be distinguishedeasily by naked eye. Figures 11c and 11d show the powerdistribution of the echoes from 855 km in azimuth. The peaksoccur at �10.91� in (c) and �11.38� in (d), with a differenceof 0.47�. That means that the position accuracy has an improve-ment of 0.47� by seven sub-beam forming. However, the echoesof the seven sub-beams are synthesized by the same data setrather than by seven independent data sets. Consequently, thepower distribution in (c) varies discontinuously with azimuth.
Additionally, frequencies from 8 to 20 MHz are a portion ofthe radio band that the radio waves are bent by the ionosphereso that the waves return to the Earth’s surface at long distancesbeyond the horizon. Thus HF over-the-horizon (OTH) radarsare designed to detect not only ionospheric irregularities but alsoaircraft, ship, and weather effects over the ocean (Skolnik,2003). The conventional beamformers are susceptible to inter-ference signals. The signals from other OTH radars may con-taminate the returns of SuperDARN radars when they occurat sidelobes of the array. By contrast, adaptive, or statisticallyoptimum, beamformers can account for interference signals.An adaptive beamformer algorithm chooses the weights basedon the statistics of the received data. For example, an adaptivebeamformer can improve the SNR by using the received data toplace nulls in the array response. These nulls are placed atangles corresponding to the interference signals. As multiple
sub-beam forming, adaptive beam forming can be implementedon FPGA or computer, it is more flexible on computer. Theadaptive methods can be selected for different requirements.
4 Summary and conclusion
The AgileDARN radar is the first mid-latitude SuperDARNradar in China. The geographic coordinates of the radar site are46.8�N, 130.5�E. It looks to the northeast with a boresightazimuth of 44� in geographic coordinates and has a commonviewing area with the Hokkaido pair of radars (HOK andHKW). The AgileDARN radar can be validated by comparingits observations with those from the Hokkaido radars.
The radar has an FPGA-based DPU to implement digitalsignal processing, such as DBF. Besides, it can provide dis-tributed signal processing as a MIMO radar. The 20 separatereceivers are allowed each to be recorded and stored indepen-dently. The receive beam forming, the detection of the channelimbalance, and the correction of the receiving channel imbal-ance are post-processed on computer with flexibility. Multiplesub-beam forming is implemented to improve the positionaccuracy.
The imbalance between channels can degrade beam formingperformance. Internal calibration and external calibration areproposed to reduce the imbalance from transmitters, receivers,and antennas. The calibration circuits are designed to accom-plish the transmitter and receiver calibration individually. Thereference signals for calibration are generated by the generators
Figure 11. Power distribution in FOV. (a) Power distribution in FOV with the angular separation of 0.464� (seven sub-beam forming). (b)Power distribution in FOV with the angular separation of 3.25� (typical beam forming). (c) Power distribution in the range of 855 km varying inazimuthal with a separation of 0.464�. (d) Power distribution in the range of 855 km varying in azimuthal with a separation of 3.25�.
J. Yan et al.: J. Space Weather Space Clim. 2021, 11, 25
Page 9 of 11
RETRACTED
in the DPU. The internal calibration is executed with an intervalof 1 min. By the internal calibration, the imbalances betweentransmitters/receivers are eliminated significantly. During theexternal calibration, the echoes from meteor trails are used ascalibration signals to detect the imbalance between antennas.The calibration interval is determined by the stability of theantenna imbalance. In a calibration interval, the imbalancesbetween antennas are expected to remain stable. Fortunately,meteors can be routinely observed by the HF radar on mostdays, but the detecting ability of meteors depends dominantlyon transmit power, operating frequency, and range resolution.With the same transmit power and operating frequency, a higherrange resolution can detect more meteors. The calibration canreduce effectively the imbalance between channels but has noeffect on the fluctuation caused by clutter or radio frequencyinterference (RFI).
Acknowledgements. The authors would like to thank J.M. Rou-honiemi, K.T. Sterne, N. Nishitani, P.V. Ponomarenko, and A.S. Yukimatu for their insightful comments about the design anddata processing of the AgileDARN radar. We also thank theSuperDARN community for the open nature of the technicalexchange of information. This work was supported by theNational Natural Science Foundation of China (Grant No.:42004139), the Frontier Science Key Research Project ofChinese Academy of Sciences (Grant No.: QYZDY-SSW-JSC014), and the Large Research Infrastructures-Ground-based Space Environment Monitoring Network. TheAgileDARN data are available from the BAS SuperDARNdata mirror website. (http://vt.superdarn.org/tiki-index.php?page=Data+Access or https://www.bas.ac.uk/project/superdarn/#data). The editor thanks Michael Kosch and an anonymousreviewer for their assistance in evaluating this paper.
References
Baker JBH, Greenwald RA, Ruohoniemi JM, Oksavik K, GjerloevJW, Paxton LJ, Hairston MR. 2007. Observations of ionosphericconvection from the Wallops SuperDARN radar at middlelatitudes: OBSERVATIONS FROM THE WALLOPS RADAR.J Geophys Res Space Phys 112(A1): A01303. https://doi.org/10.1029/2006JA011982.
Bristow WA. 2019. Application of RADAR imaging analysis toSuperDARN observations. Radio Sci 54, 692–703. https://doi.org/10.1029/2019RS006851.
Budden KG. 1985. The propagation of radio waves: The theory ofradio waves of low power in the ionosphere and magnetosphere(1st Ed.). Cambridge University Press. https://doi.org/10.1017/CBO9780511564321.
Burrell AG, Yeoman TK, Milan SE, Lester M. 2016. Phase calibrationof interferometer arrays at high-frequency radars. Radio Sci 51(9):1445–1456. https://doi.org/10.1002/2016RS006089.
Chisham G. 2018. Calibrating SuperDARN interferometers usingmeteor backscatter. Radio Sci 53(6): 761–774. https://doi.org/10.1029/2017RS006492.
Chisham G, Freeman MP. 2013. A reassessment of SuperDARNmeteor echoes from the upper mesosphere and lower thermo-sphere. J Atmos Sol Terr Phys 102: 207–221. https://doi.org/10.1016/j.jastp.2013.05.018.
Chisham G, Lester M, Milan SE, Freeman MP, Bristow WA,Grocott A, et al. 2007. A decade of the Super Dual Auroral RadarNetwork (SuperDARN): Scientific achievements, new techniquesand future directions. Surv Geophys 28(1): 33–109. https://doi.org/10.1007/s10712-007-9017-8.
Custovic E, McDonald A, Kane T, Vu V, Whittington J, Devlin J.2012. Next generation of over the horizon HF Radars and thedetermination of foF2 in real-time. In: Proceedings of the 11thAustralian Space Science Conference, National Space Society ofAustralia Ltd, pp. 141–156. ISBN: 978-0-9775740-5-6.
Deng X, Yan J, Wu J, Lan A. 2019. A Method and implementationof internal calibration in AgileDARN HF Radar. Remote SensTechnol Appl 34(6): 1221–1226. http://www.rsta.ac.cn/CN/10.11873/j.issn.1004-0323.2019.6.1221.
Frazer GJ, Abramovich YI, Johnson BA. 2009. MIMO based spatialcalibration of OTHR transmit arrays. In: 2009 International RadarConference “Surveillance for a Safer World” (RADAR 2009),Bordeaux, France, pp. 1–5. ISBN: 978-2-912328-55-7.
Frazer GJ, Abramovich YI. 2002. Quantifying multi-channel receivercalibration. In: Sensor Array and Multichannel Signal ProcessingWorkshop Proceedings, Rosslyn, USA, pp. 561–564. https://doi.org/10.1109/SAM.2002.1191103.
Greenwald RA, Weiss W, Nielsen E, Thomson NR. 1978. STARE:A new radar auroral backscatter experiment in northern Scandi-navia. Radio Sci 13(6): 1021–1039. https://doi.org/10.1029/RS013i006p01021.
Greenwald RA, Baker KB, Hutchins RA, Hanuise C. 1985. An HFphased-array radar for studying small-scale structure in the high-latitude ionosphere. Radio Sci 20(1): 63–79. https://doi.org/10.1029/RS020i001p00063.
Greenwald RA, Baker KB, Dudeney JR, Pinnock M, Jones TB,Thomas EC, et al. 1995. DARN/SuperDARN: A global view ofthe dynamics of high-latitude convection. Space Sci Rev 71(1–4):761–796. https://doi.org/10.1007/BF00751350.
Greenwald RA, Frissell N, de Larquier S. 2017. The importance ofelevation angle measurements in HF radar investigations of theionosphere. Radio Sci 52(3): 305–320. https://doi.org/10.1002/2016RS006186.
Hall GE, MacDougall JW, Moorcroft DR, Maurice J-P, Manson AH,Meek CE. 1997. Super Dual Auroral Radar Network observationsof meteor echoes. J Geophys Res Space Phys 102(A7): 14603–14614. https://doi.org/10.1029/97JA00517.
Healey RC, Parkinson ML, Devlin JC, Gentile M, Ye H. 2006.Enhanced beam steering capabilities for the TIGER SuperDARNradars. In: Australia Institute of Physics 17th National Congress,Brisbane, pp. 1–4, Paper 125. ISBN: 0-9598064-7-4
Kennedy P. 2019. Design of Software Defined Radio for SuperDARNRadars, MS Thesis, Virginia Tech. https://vtechworks.lib.vt.edu/bitstream/handle/10919/89908/Kennedy_P_S_T_2019.pdf
Nguyen HQ, Whittington JS, Devlin JC, Vu HL, Vu N-V,Custovic E. 2013. Accurate phase calibration for digital beam-forming in multi-transceiver HF radar system. Int J ElectronTelecommun 59(3): 245–254. https://doi.org/10.2478/eletel-2013-0029.
Nishitani N, Ruohoniemi JM, Lester M, Baker JBH, Koustov AV,Shepherd SG, et al. 2019. Review of the accomplishments of mid-latitude Super Dual Auroral Radar Network (SuperDARN) HFradars. Prog Earth Planet Sci 6(1): 27. https://doi.org/10.1186/s40645-019-0270-5.
Oinats AV, Kurkin VI, Nishitani N. 2015. Statistical study ofmedium-scale traveling ionospheric disturbances using Super-DARN Hokkaido ground backscatter data for 2011. Earth PlanetSpace 67(1): 22. https://doi.org/10.1186/s40623-015-0192-4.
J. Yan et al.: J. Space Weather Space Clim. 2021, 11, 25
Page 10 of 11
RETRACTED
Parkinson M, Devlin JC, Whittington J. 2006. Why do we need“DIGIDARN” – A global network of digital SuperDARN radars?In: Proceedings of the Workshop on the Applications of RadioScience (WARS) 2006 Conference, Leura, Australia, 2006, PaperR-25, pp. 1–14. ISBN: 0643093184.
Ponomarenko P, Nishitani N, Oinats AV, Tsuya T, Maurice J-P.2015. Application of ground scatter returns for calibration of HFinterferometry data. Earth Planet Space 67(1): 138. https://doi.org/10.1186/s40623-015-0310-3.
Rachakonda A, Hawkins L. 2000. Log amps and directionalcouplers enable VSWR detection. Retrieved from https://www.analog.com/en/technical-articles/log-amps-and-directional-couplers-enable-vswr-detection.html.
Ribeiro AJ, Ruohoniemi JM, Ponomarenko PV, Clausen LBN, BakerJBH, Greenwald RA, et al. 2013. A comparison of SuperDARNACF fitting methods: SUPERDARN ACF FITTING. Radio Sci 48(3): 274–282. https://doi.org/10.1002/rds.20031.
Salim T, Devlin J, Whittington J. 2004. FPGA implementation of aphased array DBF using polyphase filters. In: 2004 IEEEInternational Conference on Field-Programmable Technology(IEEE Cat. No.04EX921), Brisbane, Australia, pp. 339–342.
Skolnik MI. 2003. Introduction to Radar Systems (3rd Ed.), TataMcGraw-Hill Publishing Company Limited, New Delhi. ISBN: 0-07-044533-8.
Solomon ISD, Gray DA, Abramovich YI, Anderson SJ. 1998. Over-the-horizon radar array calibration using echoes from ionisedmeteor trails. IEEE Proc Radar Sonar Navig 145(3): 173–179.https://doi.org/10.1049/ip-rsn:19981899.
Sterne KT, Greenwald RA, Baker JBH, Ruohoniemi JM. 2011.Modeling of a twin terminated folded dipole antenna for the SuperDual Auroral Radar Network (SuperDARN). In: 2011 IEEERadarCon (RADAR), Kansas City, MO, USA, pp. 934–938.https://doi.org/10.1109/RADAR.2011.5960673.
Theurer TE, Bristow WA. 2015. Application of adaptive optics toscintillation correction in phased array high-frequency radar. RadioSci 50(6): 526–538. https://doi.org/10.1002/2015RS005703.
Whittington J, Devlin J, Salim T. 2002. Evaluation of digitalgeneration and phasing techniques for transmitter signals of theTIGER N.Z. Radar. In: Proceedings of the Workshop onApplications of Radio Science (WARS02), Leura, Australia,2002, pp. 1–9. ISBN: 0-9580476-0-X.
Zhang GY. 2009. Principle of phased array radar. National DefenceIndustry Press, Beijing. ISBN: 9787118065718.
Zhang JJ, Wang W, Wang C, Lan AL, Yan JY, Xiang D, et al. 2020.First observation of ionospheric convection from the Jiamusi HFradar during a strong geomagnetic storm. Earth Space Sci 7(1).https://doi.org/10.1029/2019EA000911.
Cite this article as: Yan J, Lan A, Deng X, Zhang J, Wang C, et al. 2021. An agile high-frequency radar used for ionospheric research. J.Space Weather Space Clim. 11, 25. https://doi.org/10.1051/swsc/2021010.
J. Yan et al.: J. Space Weather Space Clim. 2021, 11, 25
Page 11 of 11
RETRACTED