Embed Size (px)
Citation preview

Renew. Energy Environ. Sustain. 5, 6 (2020)© D. Laslett, published by EDP Sciences, 2020https://doi.org/10.1051/rees/2020001
Available online at:www.rees-journal.org
RESEARCH ARTICLE
Can high levels of renewable energy be cost effective usingbattery storage? Cost of renewable energy scenariosfor an isolated electric grid in Western AustraliaDean Laslett*
School of Engineering and Information Technology, Murdoch University, South Street, Murdoch, WA 6150, Australia
* e-mail: g
This is anO
Received: 23 June 2018 / Accepted: 13 February 2020
Abstract. Many simulations of very high or 100% renewable energy electricity systems rely on existing orexpanded capacity of utility scale power technologies with long construction lead times, such as hydro power orpumped hydro power. However, globally, the shorter lead time andmore distributed technologies of wind power,solar PV, and batteries are expanding rapidly, and costs are falling. Can a grid get to high levels of renewableenergy with these technologies alone, along with energy efficiency improvements, at reasonable cost? To addressthis question, scenarios of partial (<100%) renewable electricity supply were simulated for the South-WestInterconnected System (SWIS) in the southwest of Western Australia. The SWIS is isolated from other grids, sopower balance between supply and demand must be maintained completely within the grid, and there is nosignificant hydropower capacity to fall back on. Even with no improvement in cost and no carbon price, thepartial renewable energy scenarios were found to be less expensive than a fossil fuel “business as usual” scenarioup to about 70% renewable generation.With carbon prices of $24/tonne and $70/tonne, the same scenarios wereless expensive up to around 80% and 96% renewable generation respectively. Hence at current costs, using solarPV, wind, energy efficiency and battery storage technologies are cost effective up to very high levels of renewableenergy, but not 100%. However the cost of these technologies are falling rapidly. A simple way to include thesecontinuous cost improvements into the levelised cost of energy calculation was developed, and it was found thatif the costs of solar, wind and battery technologies continue to improve at current global rates, then the breakeven level with conventional generation increases significantly, up to 99% or above with a carbon price of $70/tonne and current Australian installed capacity growth rates. Hence a battery based system operating at almost100% renewable energy which is no more expensive than a conventional fossil system is foreseeable for the SWISgrid, and perhaps other grids as well.
1 Introduction
Electricity systems with high levels of variable renewableenergy generation are now widely considered able tooperate effectively and reliably, although doubts remain[1]. Here renewable energy (or RE) is also taken to includeenergy efficiency measures and some form of storage.However, there is still a degree of uncertainty about thecosts of such electricity systems, compared to the cost ofusing conventional fossil fuel or nuclear generation. On theone hand, many studies found the cost of RE systemsfavourable. For example, Mathiesen et al. [2] found that100 percent RE systems for the country of Denmarkmay beeconomically beneficial compared to fossil fuel systems,
penAccess article distributed under the terms of the CreativeComwhich permits unrestricted use, distribution, and reproduction
particularly if externalities such as health costs arecounted. Elliston et al. [3] found that the cost of a 100%renewable energy system for the national grid in EasternAustralia was competitive with fossil fuel based low carbonalternative systems. In the South West of WesternAustralia, Lu et al. [4] modelled costs for a 100% REscenario using pumped hydro, and found that if 2030capital prices are used, then the cost is similar to aconventional fossil generation scenario if there is a price oncarbon of $25 per tonne. Sadiqa et al. [5] found a 100%renewable system for Pakistan using RE gas storage wasless costly than a conventional fossil fuel system.Aghahosseini et al. [6] found that a renewable poweredgrid spanning the Americas would be less costly thanconventional generation. Jacobson et al. [7] modelled aworld wide 100% RE system containing 139 countries andfound the overall cost to be less expensive than using
monsAttribution License (https://creativecommons.org/licenses/by/4.0),in any medium, provided the original work is properly cited.

2 D. Laslett: Renew. Energy Environ. Sustain. 5, 6 (2020)
conventional generation. A more recent similar studyfound the 100% RE system to have similar direct costs tothe business as usual case [8]. If climate and health costswere included, the RE system was much cheaper.
In contrast, Zappa et al. [9] modelled seven renewableenergy scenarios for Europe, and found them to be moreexpensive than the current system unless nuclear power orcarbon capture and storage were used. Connolly et al. [10]modelled an RE system for Europe, including electricity,heat and transport, and found the cost of the system wouldbe more expensive. Riesz et al. [11] found that the lowestcost renewable energy system scenarios for Australia hadvery high levels of wind power generation, but would bemore expensive than the current conventional system. Roseet al. [12] found that an 85% renewable scenario for theSouth West of Western Australia would have a matchingcost, but a 100%RE system would be more costly. Cochranet al. [13] conducted a meta study of large scale REelectricity system scenarios around the world, finding thatsome complete (100%) renewable energy scenarios wereestimated to be more expensive than an equivalentconventional fossil fuel system, some on a par, and someless costly. A very recent meta study [14] found 100% REscenarios to be the same or more expensive than anequivalent conventional system, unless externalities wereincluded.
However, the costs of wind power and solar PV havefallen rapidly over the past decade, and are continuing tofall, to the point where new build wind power in particularcould compete on a purely investment cost basis with newbuild fossil fuel power stations [15]. Benson and Magee [16]reported a cost improvement rate of around 3% per year forwind power, and around 9% per year for solar PV. Morerecent reports suggest these cost improvement rates arecontinuing [17,18]. Globally, installed capacity of wind andsolar PV have also grown rapidly, by about 29% and 22%per year respectively [15]. There are some doubts overwhether these growth rates can be maintained [19],although in Australia Baldwin et al. [20] forecast theywill be exceeded in 2019.
Many of the most widely available sources of RE, suchas wind and solar PV, are variable, and dependent onmeteorological conditions. They cannot always generateaccording to the current level of demand, although there isoften a correlation between availability and demand, forexample extra air conditioning load on a hot sunnyafternoon with high levels of solar radiation. There is alsocomplementarity between different types of RE, such thatthe generation level of one type can be high when another islow. Hence using more than one type of RE, and alsoincreasing the geographic spread of RE power plants, areoptions to more fully cover the demand if the availability ofone RE source is low in one region. However this may meanthere will be significant excess in generation availabilitywhen demand is low. Denholm et al. [21] investigated theeffects of increasing levels of RE on an isolated electric grid,and found that costs would become prohibitive because ofincreasing levels of curtailment of the RE generators whendemand was less than the available supply. Adding a formof energy storage decreased curtailment, although therewere diminishing returns as the amount of storage
increased. This is consistent with the findings of Ellistonet al. [22] for the national grid in Eastern Australia. Thecost incremented in a mostly linear fashion as theproportion of RE generation increased, with some costacceleration above linear increase as the proportion of REexceeded 80%.
Hence most very high or 100% RE studies utilisestorage, or a source of energy that can be generated flexiblyaccording to demand, and can compensate for lowavailability of the variable sources of RE [14]. Theseinclude hydroelectricity, pumped hydroelectricity, bioenergy, renewable hydrogen or methane conversion,geothermal energy and solar thermal generation andstorage. The flexible generation technologies in effectutilise a form of stored energy. Demand side management,which is the controlled withdrawal of non-essential loads,can also be used when demand exceeds supply. Energyefficiency measures have the potential to reduce demandover all time scales.
A common feature of most high RE studies is thereliance on existing or expansion of hydro or pumped hydrocapacity as one of the sources of flexible generation toachieve cost competitive 100% RE systems. All of thestudies chosen by Deason [14] for in-depth analysis had thischaracteristic. Nine out of twelve of the studies assessed byCochran et al. [13] also used hydro or pumped hydro. Oneof the exceptional studies, Kemp andWexler [23], modelledBritain and relied on bio energy, tidal and wave powerrather than significant levels of hydro power. The secondexception, Lund and Mathieson [24], used biomass andhydrogen electrolysis for flexible generation. The thirdexception, Connolly et al. [25], relied heavily on bio energy.Another study, Plebmann et al. [26], also simulated global100%RE electricity relying on solar thermal and renewablepower to gas storage rather than hydroelectricity.
Use of hydroelectricity or biomass on a large scale maynot be feasible in many areas of the world due totopographical or environmental constraints. Even iffeasible, these technologies could involve significantinstallation lead times. The average lead time forhydroelectric projects around the world has been about8.6 years [27]. There can also be other barriers. Forexample, even though extensive pumped hydro capacity inthe European Union is already available, Kougias andSzabó [28] found that rising levels of RE did notautomatically lead to a rise in utilisation rates, and thatthis might inhibit the needed investment in new capacity.The authors suggested the use of proactive technological,policy and market measures to encourage utilisation andnew investment.
However, in the absence of specific policies andplanning to enable these large scale and long lead timeprojects, the use of another storage technology, batteries, islikely to grow. Usually considered for short term storage,battery systems are distributed, scalable from home or carsize to utility scale, have short installation times, nondependence on suitable topography or geology, a growinginstalled base and a cost reduction trajectory. Benson andMagee [16] reported a cost improvement rate of around 3%per year. However, Nykvist and Benson [29] concluded thatEV battery costs had improved at a faster rate of around
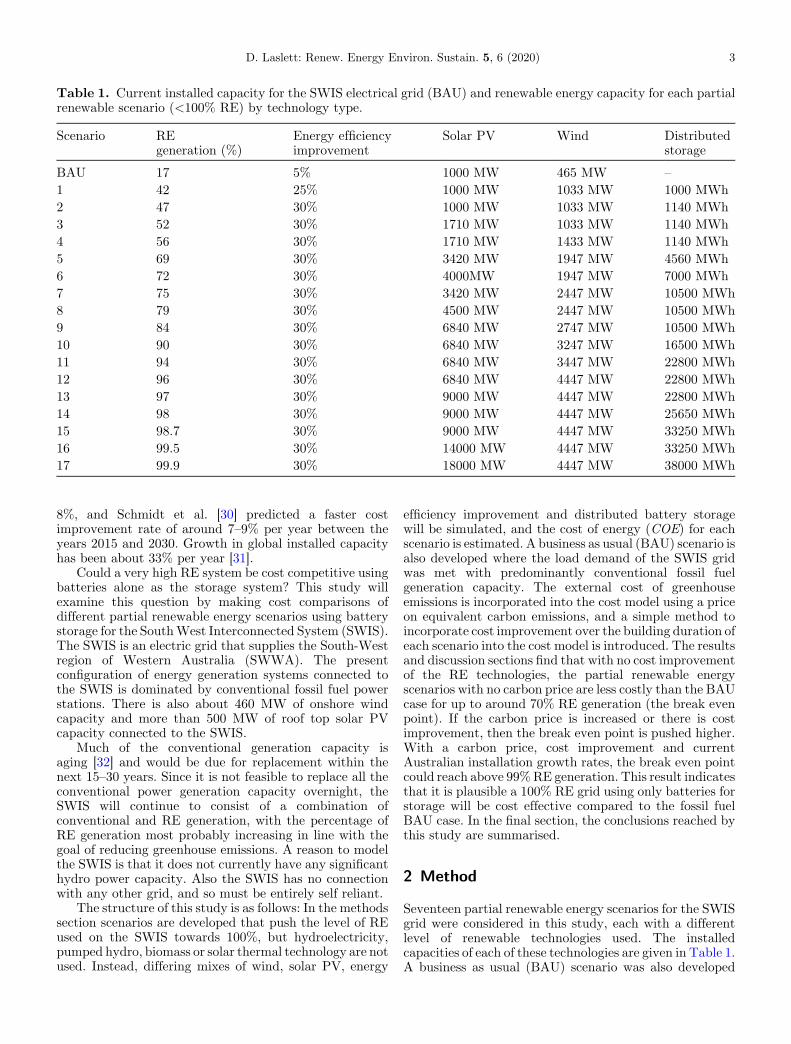
Table 1. Current installed capacity for the SWIS electrical grid (BAU) and renewable energy capacity for each partialrenewable scenario (<100% RE) by technology type.
Scenario REgeneration (%)
Energy efficiencyimprovement
Solar PV Wind Distributedstorage
BAU 17 5% 1000 MW 465 MW –
1 42 25% 1000 MW 1033 MW 1000 MWh2 47 30% 1000 MW 1033 MW 1140 MWh3 52 30% 1710 MW 1033 MW 1140 MWh4 56 30% 1710 MW 1433 MW 1140 MWh5 69 30% 3420 MW 1947 MW 4560 MWh6 72 30% 4000MW 1947 MW 7000 MWh7 75 30% 3420 MW 2447 MW 10500 MWh8 79 30% 4500 MW 2447 MW 10500 MWh9 84 30% 6840 MW 2747 MW 10500 MWh10 90 30% 6840 MW 3247 MW 16500 MWh11 94 30% 6840 MW 3447 MW 22800 MWh12 96 30% 6840 MW 4447 MW 22800 MWh13 97 30% 9000 MW 4447 MW 22800 MWh14 98 30% 9000 MW 4447 MW 25650 MWh15 98.7 30% 9000 MW 4447 MW 33250 MWh16 99.5 30% 14000 MW 4447 MW 33250 MWh17 99.9 30% 18000 MW 4447 MW 38000 MWh
D. Laslett: Renew. Energy Environ. Sustain. 5, 6 (2020) 3
8%, and Schmidt et al. [30] predicted a faster costimprovement rate of around 7–9% per year between theyears 2015 and 2030. Growth in global installed capacityhas been about 33% per year [31].
Could a very high RE system be cost competitive usingbatteries alone as the storage system? This study willexamine this question by making cost comparisons ofdifferent partial renewable energy scenarios using batterystorage for the SouthWest Interconnected System (SWIS).The SWIS is an electric grid that supplies the South-Westregion of Western Australia (SWWA). The presentconfiguration of energy generation systems connected tothe SWIS is dominated by conventional fossil fuel powerstations. There is also about 460 MW of onshore windcapacity and more than 500 MW of roof top solar PVcapacity connected to the SWIS.
Much of the conventional generation capacity isaging [32] and would be due for replacement within thenext 15–30 years. Since it is not feasible to replace all theconventional power generation capacity overnight, theSWIS will continue to consist of a combination ofconventional and RE generation, with the percentage ofRE generation most probably increasing in line with thegoal of reducing greenhouse emissions. A reason to modelthe SWIS is that it does not currently have any significanthydro power capacity. Also the SWIS has no connectionwith any other grid, and so must be entirely self reliant.
The structure of this study is as follows: In the methodssection scenarios are developed that push the level of REused on the SWIS towards 100%, but hydroelectricity,pumped hydro, biomass or solar thermal technology are notused. Instead, differing mixes of wind, solar PV, energy
efficiency improvement and distributed battery storagewill be simulated, and the cost of energy (COE) for eachscenario is estimated. A business as usual (BAU) scenario isalso developed where the load demand of the SWIS gridwas met with predominantly conventional fossil fuelgeneration capacity. The external cost of greenhouseemissions is incorporated into the cost model using a priceon equivalent carbon emissions, and a simple method toincorporate cost improvement over the building duration ofeach scenario into the cost model is introduced. The resultsand discussion sections find that with no cost improvementof the RE technologies, the partial renewable energyscenarios with no carbon price are less costly than the BAUcase for up to around 70% RE generation (the break evenpoint). If the carbon price is increased or there is costimprovement, then the break even point is pushed higher.With a carbon price, cost improvement and currentAustralian installation growth rates, the break even pointcould reach above 99%RE generation. This result indicatesthat it is plausible a 100% RE grid using only batteries forstorage will be cost effective compared to the fossil fuelBAU case. In the final section, the conclusions reached bythis study are summarised.
2 Method
Seventeen partial renewable energy scenarios for the SWISgrid were considered in this study, each with a differentlevel of renewable technologies used. The installedcapacities of each of these technologies are given in Table 1.A business as usual (BAU) scenario was also developed
4 D. Laslett: Renew. Energy Environ. Sustain. 5, 6 (2020)
whereby the load demand on the SWIS was met usingmainly current conventional fossil fuel generation technol-ogies. It was assumed that the cost of the BAU scenariodoes not change, although it may go up because ofincreasing fuel costs. The framework to model thesescenarios has previously been developed to model 100%renewable energy (RE) scenarios for the SWIS on an hour-by-hour basis [33–35]. Hourly power generation profileswere synthesised for each scenario, based on the installedcapacity of each renewable energy technology andstatistical profiles of wind speed and solar radiation. Theseprofiles were compared to the hourly load profile over aperiod of one year to estimate the percentage of REgeneration.
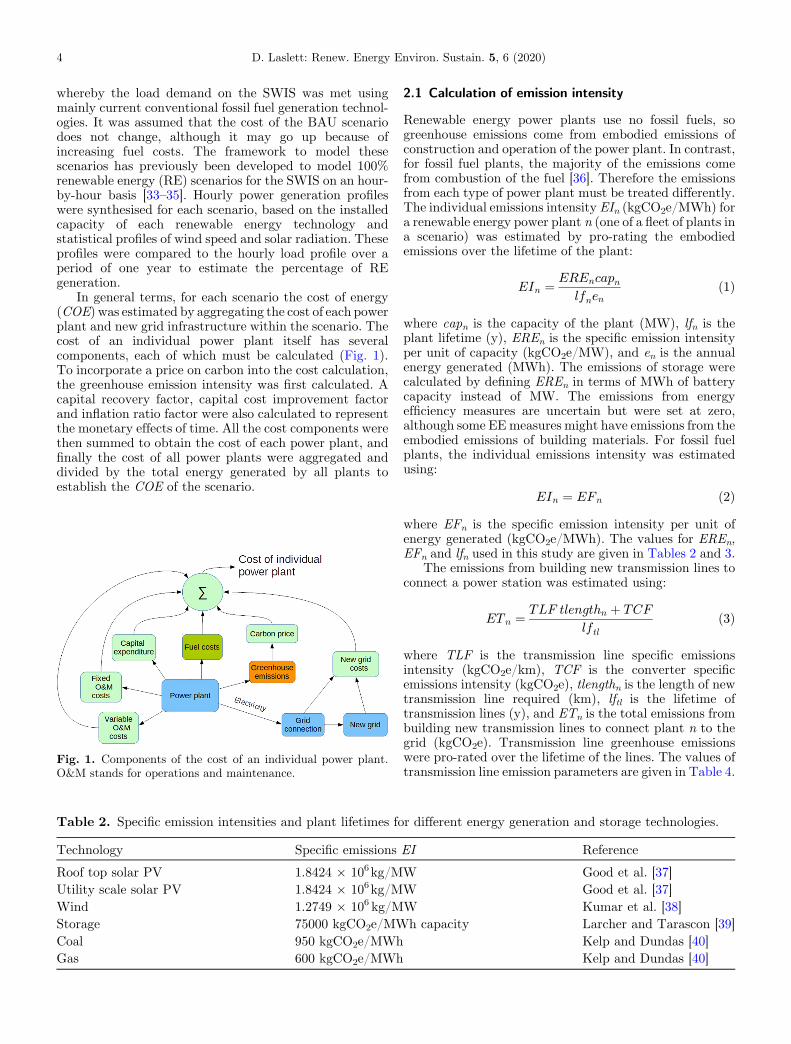
In general terms, for each scenario the cost of energy(COE) was estimated by aggregating the cost of each powerplant and new grid infrastructure within the scenario. Thecost of an individual power plant itself has severalcomponents, each of which must be calculated (Fig. 1).To incorporate a price on carbon into the cost calculation,the greenhouse emission intensity was first calculated. Acapital recovery factor, capital cost improvement factorand inflation ratio factor were also calculated to representthe monetary effects of time. All the cost components werethen summed to obtain the cost of each power plant, andfinally the cost of all power plants were aggregated anddivided by the total energy generated by all plants toestablish the COE of the scenario.
Fig. 1. Components of the cost of an individual power plant.O&M stands for operations and maintenance.
Table 2. Specific emission intensities and plant lifetimes fo
Technology Specific emissions
Roof top solar PV 1.8424 � 106kg/MUtility scale solar PV 1.8424 � 106kg/MWind 1.2749 � 106 kg/MStorage 75000 kgCO2e/MWCoal 950 kgCO2e/MWhGas 600 kgCO2e/MWh
2.1 Calculation of emission intensity
Renewable energy power plants use no fossil fuels, sogreenhouse emissions come from embodied emissions ofconstruction and operation of the power plant. In contrast,for fossil fuel plants, the majority of the emissions comefrom combustion of the fuel [36]. Therefore the emissionsfrom each type of power plant must be treated differently.The individual emissions intensity EIn (kgCO2e/MWh) fora renewable energy power plant n (one of a fleet of plants ina scenario) was estimated by pro-rating the embodiedemissions over the lifetime of the plant:
EIn ¼ EREncapnlfnen
ð1Þ
where capn is the capacity of the plant (MW), lfn is theplant lifetime (y), EREn is the specific emission intensityper unit of capacity (kgCO2e/MW), and en is the annualenergy generated (MWh). The emissions of storage werecalculated by defining EREn in terms of MWh of batterycapacity instead of MW. The emissions from energyefficiency measures are uncertain but were set at zero,although some EEmeasures might have emissions from theembodied emissions of building materials. For fossil fuelplants, the individual emissions intensity was estimatedusing:
EIn ¼ EFn ð2Þwhere EFn is the specific emission intensity per unit ofenergy generated (kgCO2e/MWh). The values for EREn,EFn and lfn used in this study are given in Tables 2 and 3.
The emissions from building new transmission lines toconnect a power station was estimated using:
ETn ¼ TLF tlengthn þ TCF
lftlð3Þ
where TLF is the transmission line specific emissionsintensity (kgCO2e/km), TCF is the converter specificemissions intensity (kgCO2e), tlengthn is the length of newtransmission line required (km), lftl is the lifetime oftransmission lines (y), and ETn is the total emissions frombuilding new transmission lines to connect plant n to thegrid (kgCO2e). Transmission line greenhouse emissionswere pro-rated over the lifetime of the lines. The values oftransmission line emission parameters are given in Table 4.
r different energy generation and storage technologies.
EI Reference
W Good et al. [37]W Good et al. [37]W Kumar et al. [38]h capacity Larcher and Tarascon [39]
Kelp and Dundas [40]Kelp and Dundas [40]
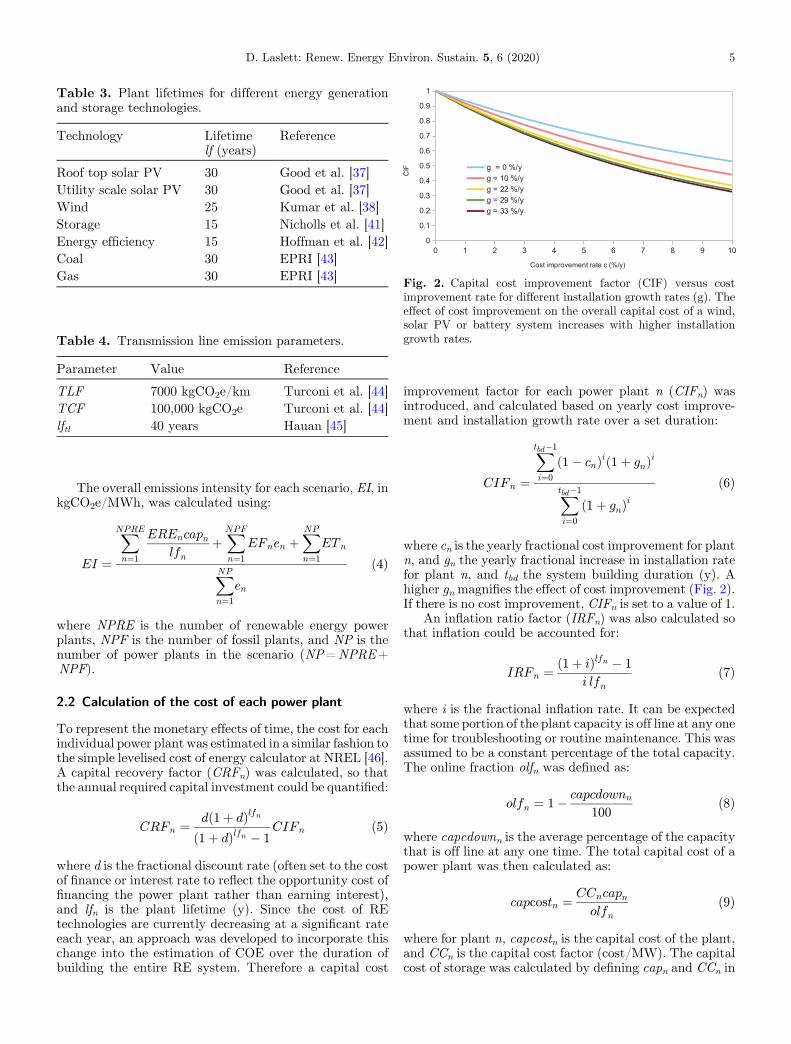
Table 3. Plant lifetimes for different energy generationand storage technologies.
Technology Lifetimelf (years)
Reference
Roof top solar PV 30 Good et al. [37]Utility scale solar PV 30 Good et al. [37]Wind 25 Kumar et al. [38]Storage 15 Nicholls et al. [41]Energy efficiency 15 Hoffman et al. [42]Coal 30 EPRI [43]Gas 30 EPRI [43]
Table 4. Transmission line emission parameters.
Parameter Value Reference
TLF 7000 kgCO2e/km Turconi et al. [44]TCF 100,000 kgCO2e Turconi et al. [44]lftl 40 years Hauan [45]
Fig. 2. Capital cost improvement factor (CIF) versus costimprovement rate for different installation growth rates (g). Theeffect of cost improvement on the overall capital cost of a wind,solar PV or battery system increases with higher installationgrowth rates.
D. Laslett: Renew. Energy Environ. Sustain. 5, 6 (2020) 5
The overall emissions intensity for each scenario, EI, inkgCO2e/MWh, was calculated using:
EI ¼
XNPRE
n¼1
EREncapnlfn
þXNPF
n¼1
EFnen þXNP
n¼1
ETn
XNP
n¼1
en
ð4Þ
where NPRE is the number of renewable energy powerplants, NPF is the number of fossil plants, and NP is thenumber of power plants in the scenario (NP=NPRE+NPF).
2.2 Calculation of the cost of each power plant
To represent the monetary effects of time, the cost for eachindividual power plant was estimated in a similar fashion tothe simple levelised cost of energy calculator at NREL [46].A capital recovery factor (CRFn) was calculated, so thatthe annual required capital investment could be quantified:
CRFn ¼ d 1þ dð Þlfn1þ dð Þlfn � 1
CIFn ð5Þ
where d is the fractional discount rate (often set to the costof finance or interest rate to reflect the opportunity cost offinancing the power plant rather than earning interest),and lfn is the plant lifetime (y). Since the cost of REtechnologies are currently decreasing at a significant rateeach year, an approach was developed to incorporate thischange into the estimation of COE over the duration ofbuilding the entire RE system. Therefore a capital cost
improvement factor for each power plant n (CIFn) wasintroduced, and calculated based on yearly cost improve-ment and installation growth rate over a set duration:
CIFn ¼
Xtbd�1
i¼0
1� cnð Þi 1þ gnð Þi
Xtbd�1
i¼0
1þ gnð Þið6Þ
where cn is the yearly fractional cost improvement for plantn, and gn the yearly fractional increase in installation ratefor plant n, and tbd the system building duration (y). Ahigher gn magnifies the effect of cost improvement (Fig. 2).If there is no cost improvement, CIFn is set to a value of 1.
An inflation ratio factor (IRFn) was also calculated sothat inflation could be accounted for:
IRFn ¼ 1þ ið Þlfn � 1
i lfnð7Þ
where i is the fractional inflation rate. It can be expectedthat some portion of the plant capacity is off line at any onetime for troubleshooting or routine maintenance. This wasassumed to be a constant percentage of the total capacity.The online fraction olfn was defined as:
olfn ¼ 1� capcdownn
100ð8Þ
where capcdownn is the average percentage of the capacitythat is off line at any one time. The total capital cost of apower plant was then calculated as:
capcostn ¼ CCncapnolfn
ð9Þ
where for plant n, capcostn is the capital cost of the plant,and CCn is the capital cost factor (cost/MW). The capitalcost of storage was calculated by defining capn and CCn in
6 D. Laslett: Renew. Energy Environ. Sustain. 5, 6 (2020)
terms of MWh of battery capacity instead of MW.Although these formulae can be applied to any currency,in this study any dollar value given is Australian dollars.
The capital cost of new transmission line and connec-tion infrastructure for utility scale power plants wasestimated using:
gridcostn ¼ TLC tlengthn þ CCC ð10Þ
Table 5. New grid costs.
Parameter Value Reference
TLC $1 millionper km
Krieg [47]
CCC $105,340 ERA [48]GCC for rooftop PV $170 per kW CEC [49]GCC for distributedstorage
$25 per kWh CEC [49]
All costs are in Australian dollars.
Table 6. Down time for different energy generation orstorage technologies.
Technology Down timecapcdown (%)
Reference
Roof top solar PV 1.5 Jacobson et al. [50]Utility scale solar PV 1.5 Jacobson et al. [50]Wind 3 Faulstich et al. [51]Storage 10 Dubarry et. al. [52]Energy efficiency 0*
Coal 16.83 Cochran et al. [53]Gas 15 Gouveia et al. [54]* Energy efficiency measures chosen to involve intrinsic or passivedesign improvements with no down time, or active systems withequivalent or better reliability than those they replace.
Table 7. Capital cost factors for different energy generatio
Technology Capital cost fa($million/MW)
Roof top solar PV 1.7Utility scale solar PV 1.7Wind 2.3Storage 0.265 $million/Energy efficiency $350 per (MWCoal 3Gas 1.45
All costs are in Australian dollars.
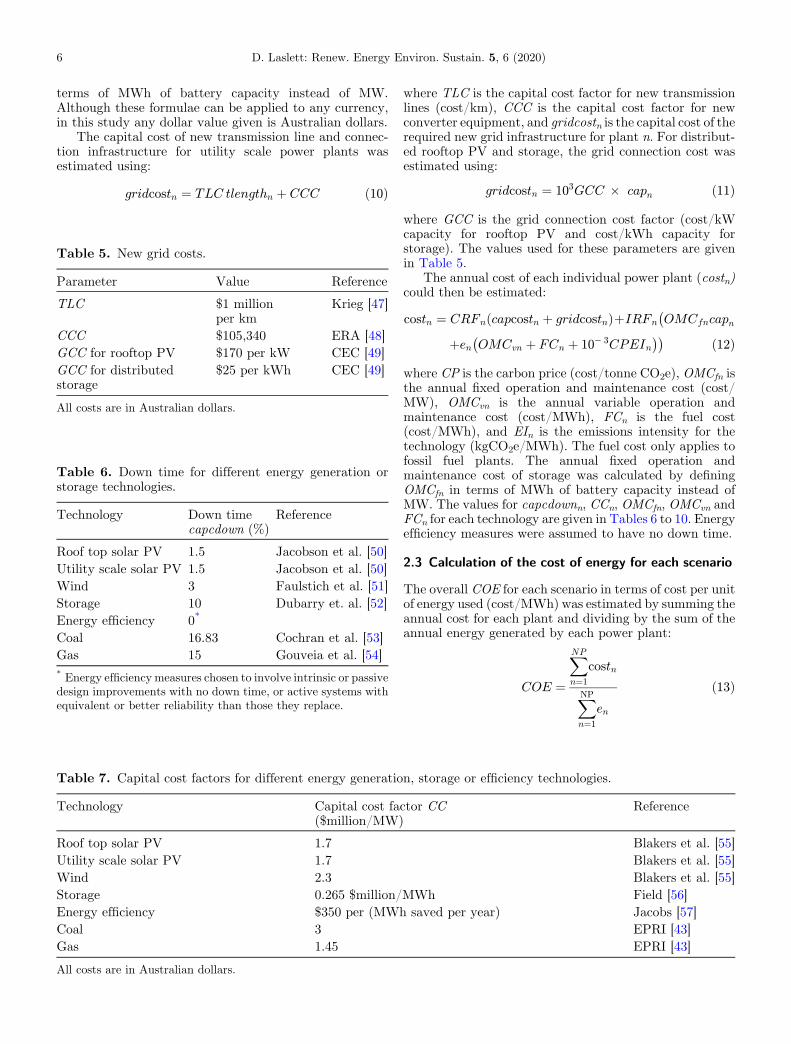
where TLC is the capital cost factor for new transmissionlines (cost/km), CCC is the capital cost factor for newconverter equipment, and gridcostn is the capital cost of therequired new grid infrastructure for plant n. For distribut-ed rooftop PV and storage, the grid connection cost wasestimated using:
gridcostn ¼ 103GCC � capn ð11Þ
where GCC is the grid connection cost factor (cost/kWcapacity for rooftop PV and cost/kWh capacity forstorage). The values used for these parameters are givenin Table 5.
The annual cost of each individual power plant (costn)could then be estimated:
costn ¼ CRFn capcostn þ gridcostnð ÞþIRFn OMCfncapn�
þen OMCvn þ FCn þ 10� 3CPEIn� �� ð12Þ
where CP is the carbon price (cost/tonne CO2e), OMCfn isthe annual fixed operation and maintenance cost (cost/MW), OMCvn is the annual variable operation andmaintenance cost (cost/MWh), FCn is the fuel cost(cost/MWh), and EIn is the emissions intensity for thetechnology (kgCO2e/MWh). The fuel cost only applies tofossil fuel plants. The annual fixed operation andmaintenance cost of storage was calculated by definingOMCfn in terms of MWh of battery capacity instead ofMW. The values for capcdownn, CCn, OMCfn, OMCvn andFCn for each technology are given in Tables 6 to 10. Energyefficiency measures were assumed to have no down time.
2.3 Calculation of the cost of energy for each scenario
The overall COE for each scenario in terms of cost per unitof energy used (cost/MWh) was estimated by summing theannual cost for each plant and dividing by the sum of theannual energy generated by each power plant:
COE ¼
XNP
n¼1
costn
XNP
n¼1
en
ð13Þ
n, storage or efficiency technologies.
ctor CC Reference
Blakers et al. [55]Blakers et al. [55]Blakers et al. [55]
MWh Field [56]h saved per year) Jacobs [57]
EPRI [43]EPRI [43]
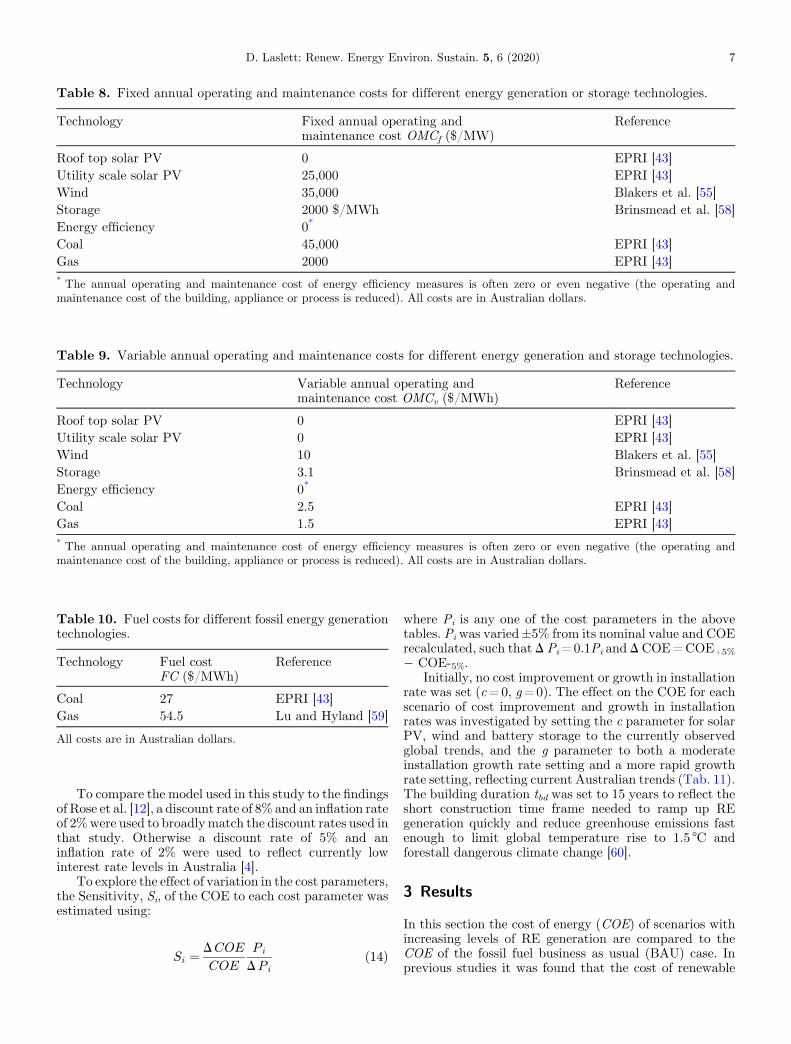
Table 10. Fuel costs for different fossil energy generationtechnologies.
Technology Fuel costFC ($/MWh)
Reference
Coal 27 EPRI [43]Gas 54.5 Lu and Hyland [59]
All costs are in Australian dollars.
Table 8. Fixed annual operating and maintenance costs for different energy generation or storage technologies.
Technology Fixed annual operating andmaintenance cost OMCf ($/MW)
Reference
Roof top solar PV 0 EPRI [43]Utility scale solar PV 25,000 EPRI [43]Wind 35,000 Blakers et al. [55]Storage 2000 $/MWh Brinsmead et al. [58]Energy efficiency 0*
Coal 45,000 EPRI [43]Gas 2000 EPRI [43]* The annual operating and maintenance cost of energy efficiency measures is often zero or even negative (the operating andmaintenance cost of the building, appliance or process is reduced). All costs are in Australian dollars.
Table 9. Variable annual operating and maintenance costs for different energy generation and storage technologies.
Technology Variable annual operating andmaintenance cost OMCv ($/MWh)
Reference
Roof top solar PV 0 EPRI [43]Utility scale solar PV 0 EPRI [43]Wind 10 Blakers et al. [55]Storage 3.1 Brinsmead et al. [58]Energy efficiency 0*
Coal 2.5 EPRI [43]Gas 1.5 EPRI [43]* The annual operating and maintenance cost of energy efficiency measures is often zero or even negative (the operating andmaintenance cost of the building, appliance or process is reduced). All costs are in Australian dollars.
D. Laslett: Renew. Energy Environ. Sustain. 5, 6 (2020) 7
To compare the model used in this study to the findingsof Rose et al. [12], a discount rate of 8% and an inflation rateof 2%were used to broadlymatch the discount rates used inthat study. Otherwise a discount rate of 5% and aninflation rate of 2% were used to reflect currently lowinterest rate levels in Australia [4].
To explore the effect of variation in the cost parameters,the Sensitivity, Si, of the COE to each cost parameter wasestimated using:
Si ¼ DCOE
COE
Pi
DPið14Þ
where Pi is any one of the cost parameters in the abovetables. Pi was varied±5% from its nominal value and COErecalculated, such that D Pi=0.1Pi and D COE=COE+5%� COE-5%.
Initially, no cost improvement or growth in installationrate was set (c=0, g=0). The effect on the COE for eachscenario of cost improvement and growth in installationrates was investigated by setting the c parameter for solarPV, wind and battery storage to the currently observedglobal trends, and the g parameter to both a moderateinstallation growth rate setting and a more rapid growthrate setting, reflecting current Australian trends (Tab. 11).The building duration tbd was set to 15 years to reflect theshort construction time frame needed to ramp up REgeneration quickly and reduce greenhouse emissions fastenough to limit global temperature rise to 1.5 °C andforestall dangerous climate change [60].
3 Results
In this section the cost of energy (COE) of scenarios withincreasing levels of RE generation are compared to theCOE of the fossil fuel business as usual (BAU) case. Inprevious studies it was found that the cost of renewable
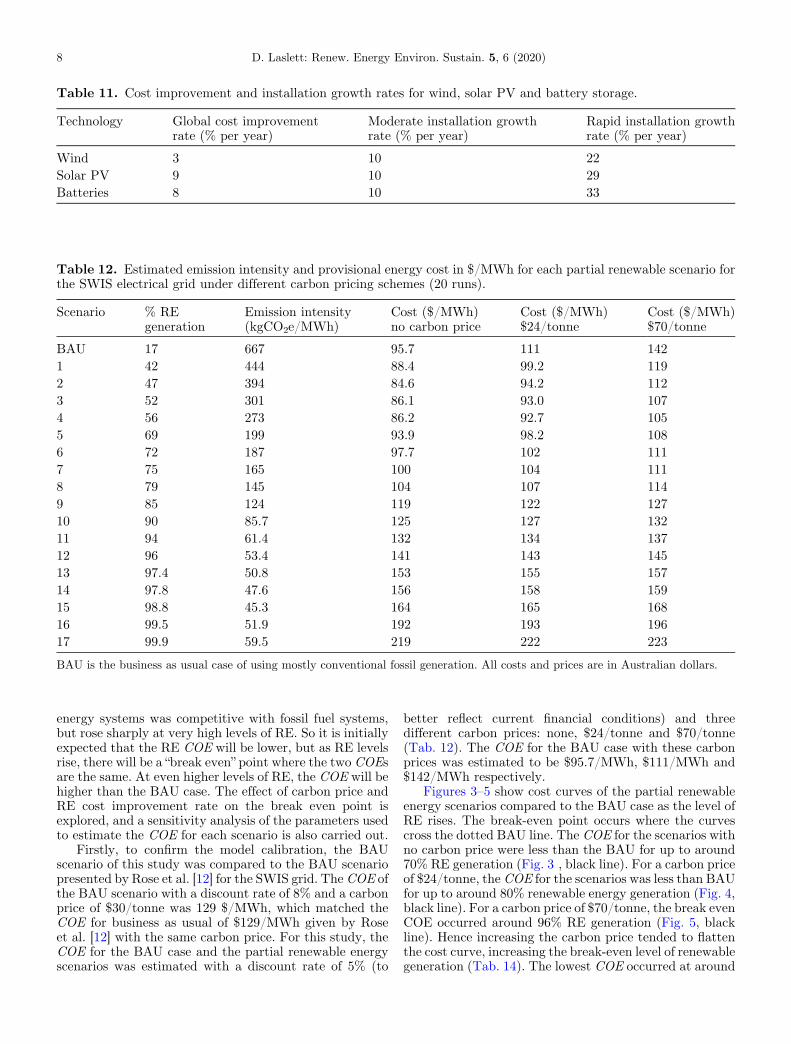
Table 12. Estimated emission intensity and provisional energy cost in $/MWh for each partial renewable scenario forthe SWIS electrical grid under different carbon pricing schemes (20 runs).
Scenario % REgeneration
Emission intensity(kgCO2e/MWh)
Cost ($/MWh)no carbon price
Cost ($/MWh)$24/tonne
Cost ($/MWh)$70/tonne
BAU 17 667 95.7 111 1421 42 444 88.4 99.2 1192 47 394 84.6 94.2 1123 52 301 86.1 93.0 1074 56 273 86.2 92.7 1055 69 199 93.9 98.2 1086 72 187 97.7 102 1117 75 165 100 104 1118 79 145 104 107 1149 85 124 119 122 12710 90 85.7 125 127 13211 94 61.4 132 134 13712 96 53.4 141 143 14513 97.4 50.8 153 155 15714 97.8 47.6 156 158 15915 98.8 45.3 164 165 16816 99.5 51.9 192 193 19617 99.9 59.5 219 222 223
BAU is the business as usual case of using mostly conventional fossil generation. All costs and prices are in Australian dollars.
Table 11. Cost improvement and installation growth rates for wind, solar PV and battery storage.
Technology Global cost improvementrate (% per year)
Moderate installation growthrate (% per year)
Rapid installation growthrate (% per year)
Wind 3 10 22Solar PV 9 10 29Batteries 8 10 33
8 D. Laslett: Renew. Energy Environ. Sustain. 5, 6 (2020)
energy systems was competitive with fossil fuel systems,but rose sharply at very high levels of RE. So it is initiallyexpected that the RE COE will be lower, but as RE levelsrise, there will be a “break even” point where the two COEsare the same. At even higher levels of RE, the COE will behigher than the BAU case. The effect of carbon price andRE cost improvement rate on the break even point isexplored, and a sensitivity analysis of the parameters usedto estimate the COE for each scenario is also carried out.
Firstly, to confirm the model calibration, the BAUscenario of this study was compared to the BAU scenariopresented by Rose et al. [12] for the SWIS grid. TheCOE ofthe BAU scenario with a discount rate of 8% and a carbonprice of $30/tonne was 129 $/MWh, which matched theCOE for business as usual of $129/MWh given by Roseet al. [12] with the same carbon price. For this study, theCOE for the BAU case and the partial renewable energyscenarios was estimated with a discount rate of 5% (to
better reflect current financial conditions) and threedifferent carbon prices: none, $24/tonne and $70/tonne(Tab. 12). The COE for the BAU case with these carbonprices was estimated to be $95.7/MWh, $111/MWh and$142/MWh respectively.
Figures 3–5 show cost curves of the partial renewableenergy scenarios compared to the BAU case as the level ofRE rises. The break-even point occurs where the curvescross the dotted BAU line. The COE for the scenarios withno carbon price were less than the BAU for up to around70% RE generation (Fig. 3 , black line). For a carbon priceof $24/tonne, the COE for the scenarios was less than BAUfor up to around 80% renewable energy generation (Fig. 4,black line). For a carbon price of $70/tonne, the break evenCOE occurred around 96% RE generation (Fig. 5, blackline). Hence increasing the carbon price tended to flattenthe cost curve, increasing the break-even level of renewablegeneration (Tab. 14). The lowest COE occurred at around

Fig. 3. Cost of partial renewable energy generation scenarioscompared to business as usual (BAU) case (dashed line) with nocarbon price. Renewable technologies used are wind, solarphotovoltaic and distributed battery storage. Black line is nocost improvement over time, blue line is global cost improvementrates and moderate installation growth rates. Green line is globalcost improvement rates and rapid installation growth rates. Costis in Australian dollars.
Fig. 4. Cost of partial renewable energy generation scenarioscompared to business as usual (BAU) case (dashed line) with a$24 per tonne carbon price. Renewable technologies used arewind, solar photovoltaic and distributed battery storage. Blackline is no cost improvement over time, blue line is global costimprovement rates andmoderate installation growth rates. Greenline is global cost improvement rates and rapid installationgrowth rates. Cost is in Australian dollars.
Fig. 5. Cost of partial renewable energy generation scenarioscompared to business as usual (BAU) case (dashed line) with a$70 per tonne carbon price. Renewable technologies used arewind, solar photovoltaic and distributed battery storage. Blackline is no cost improvement over time, blue line is global costimprovement rates andmoderate installation growth rates. Greenline is global cost improvement rates and rapid installationgrowth rates. Cost is in Australian dollars.
D. Laslett: Renew. Energy Environ. Sustain. 5, 6 (2020) 9
45–55% RE generation with no carbon price, and around50–60% RE generation for carbon prices at $24/tonne and$70/tonne. For very high levels of renewable energygeneration (>95%), the COE rose sharply, almost in anexponential like manner.
Sensitivity analysis of the parameters used to estimatethe COE for each scenario revealed that the cost was mostsensitive to investment parameters (discount rate, inflationrate and carbon price), capital cost parameters, fixed andvariable O+M costs and plant lifetime. The most sensitiveparameter was discount rate (Tab. 13), and the sensitivityto this parameter increased with the level of RE. Therefore,decreasing the discount rate would increase the break-even
level of RE and vice versa. In contrast, sensitivity to theinflation rate decreased with increasing RE. These effectscould be due to the higher required capital expenditure andabsence of fuel costs of the RE technologies. Inclusion of acarbon price generally decreased the sensitivity to otherparameters, and not surprisingly, the BAU scenario wasmost sensitive to the carbon price.
These sensitivity estimates were consistent withimprovements in the capital cost of RE technologiesreducing the COE of the high RE scenarios the most. Ifcurrent global improvement rates in wind, solar PV andbattery costs were implemented, along with installationgrowth rates consistent with current Australian trends(Tab. 11), then the break even cost points for the REscenarios compared to the BAU scenario were increased(Tab. 14 and Figs. 3–5). With no carbon price, the breakeven point rose to around 95% RE, and with a carbonprice of $70 per tonne, the break even point wasabove 99%. Even with more moderate installationgrowth rates, the break even point with no carbonprice rose to 85%, and with a $70 per tonne carbon pricewas at 99%.
4 Discussion
Based on current technology costs, as RE generationincreased from low levels, the cost dropped, reaching aminimum around 45–60% RE generation. The cost thenrose again in a roughly linear fashion as RE increased up toabout 80%RE generation, similar to the findings of Ellistonet al. [22]. The cost increased more sharply up to around95% RE generation, which was also noticed by Ellistonet al. [22], and then increased steeply, almost in anexponential like way, at very high levels of RE generationabove 95%. Hence the vanishing returns found by Denholmet al. [21] from adding capacity to cover increasingly
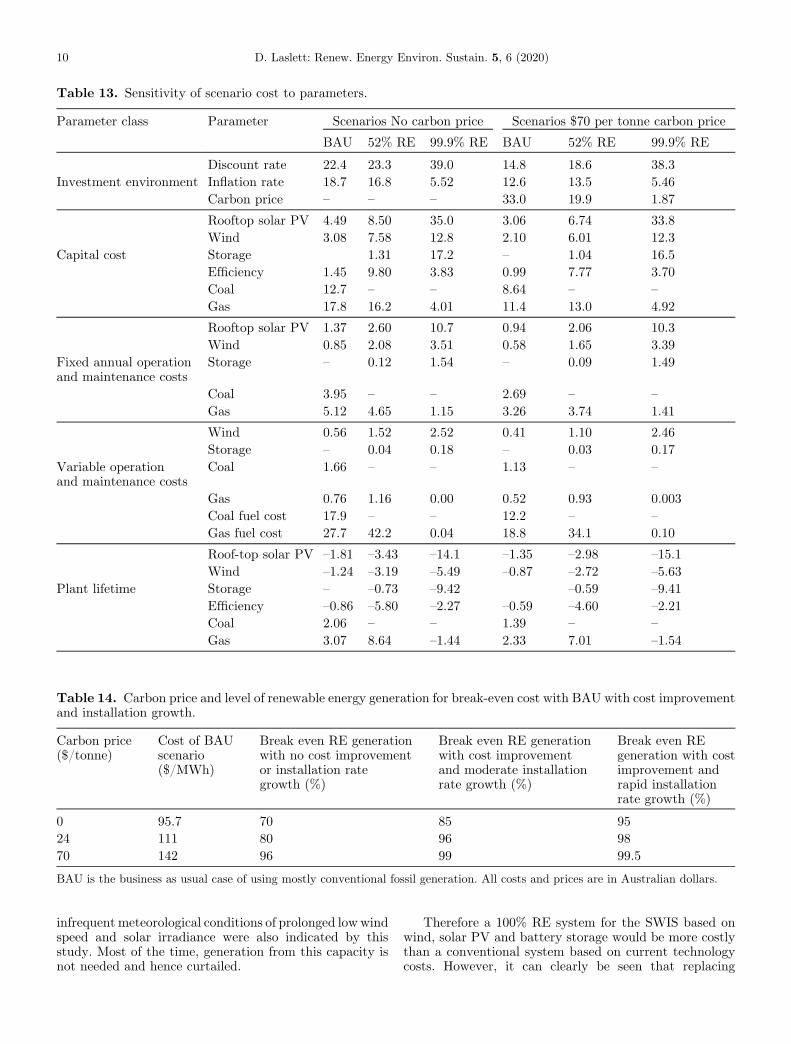
Table 13. Sensitivity of scenario cost to parameters.
Parameter class Parameter Scenarios No carbon price Scenarios $70 per tonne carbon price
BAU 52% RE 99.9% RE BAU 52% RE 99.9% RE
Discount rate 22.4 23.3 39.0 14.8 18.6 38.3Investment environment Inflation rate 18.7 16.8 5.52 12.6 13.5 5.46
Carbon price – – – 33.0 19.9 1.87
Rooftop solar PV 4.49 8.50 35.0 3.06 6.74 33.8Wind 3.08 7.58 12.8 2.10 6.01 12.3
Capital cost Storage 1.31 17.2 – 1.04 16.5Efficiency 1.45 9.80 3.83 0.99 7.77 3.70Coal 12.7 – – 8.64 – –
Gas 17.8 16.2 4.01 11.4 13.0 4.92
Rooftop solar PV 1.37 2.60 10.7 0.94 2.06 10.3Wind 0.85 2.08 3.51 0.58 1.65 3.39
Fixed annual operationand maintenance costs
Storage – 0.12 1.54 – 0.09 1.49
Coal 3.95 – – 2.69 – –
Gas 5.12 4.65 1.15 3.26 3.74 1.41
Wind 0.56 1.52 2.52 0.41 1.10 2.46Storage – 0.04 0.18 – 0.03 0.17
Variable operationand maintenance costs
Coal 1.66 – – 1.13 – –
Gas 0.76 1.16 0.00 0.52 0.93 0.003Coal fuel cost 17.9 – – 12.2 – –
Gas fuel cost 27.7 42.2 0.04 18.8 34.1 0.10
Roof-top solar PV –1.81 –3.43 –14.1 –1.35 –2.98 –15.1Wind –1.24 –3.19 –5.49 –0.87 –2.72 –5.63
Plant lifetime Storage – –0.73 –9.42 –0.59 –9.41Efficiency –0.86 –5.80 –2.27 –0.59 –4.60 –2.21Coal 2.06 – – 1.39 – –
Gas 3.07 8.64 –1.44 2.33 7.01 –1.54
Table 14. Carbon price and level of renewable energy generation for break-even cost with BAU with cost improvementand installation growth.
Carbon price($/tonne)
Cost of BAUscenario($/MWh)
Break even RE generationwith no cost improvementor installation rategrowth (%)
Break even RE generationwith cost improvementand moderate installationrate growth (%)
Break even REgeneration with costimprovement andrapid installationrate growth (%)
0 95.7 70 85 9524 111 80 96 9870 142 96 99 99.5
BAU is the business as usual case of using mostly conventional fossil generation. All costs and prices are in Australian dollars.
10 D. Laslett: Renew. Energy Environ. Sustain. 5, 6 (2020)
infrequent meteorological conditions of prolonged low windspeed and solar irradiance were also indicated by thisstudy. Most of the time, generation from this capacity isnot needed and hence curtailed.
Therefore a 100% RE system for the SWIS based onwind, solar PV and battery storage would be more costlythan a conventional system based on current technologycosts. However, it can clearly be seen that replacing
D. Laslett: Renew. Energy Environ. Sustain. 5, 6 (2020) 11
conventional fossil generation with renewable energyrather than more conventional plants will be the leastcost option up to high levels of RE generation, with a costbreak even point of around 70% even without a price oncarbon. Any policy system that results in a price on carbonwill make the break even point higher.
Denholm et al. [21] and other studies have suggestedthat interconnection with another grid, or a form ofrenewable energy that is capable of being stored forlonger time scales, such as biomass, renewable power togas, or pumped hydro, combined with the use of demandmanagement, might be a more cost effective way to coverthe final 5–10% of RE generation capacity to achieve alow emission 100% renewable electricity system. Howev-er, the cost of wind power has been falling in the last fewyears, and the cost of solar and battery storage is alsocurrently falling rapidly. The results of this study showthat if costs continue to improve on the same trajectoryas currently observed, and installation rates grow even ata moderate rate of 10%, then the break even point withBAU will increase significantly, up to 85% RE with nocarbon price. With a carbon price of $24 per tonne, thebreak even point reaches 96% RE. With a higher carbonprice and/or faster cost improvement and installationgrowth rates, the cost advantage of using a conventionalfossil generation system begins to vanish altogether, anda cost effective 100% RE system based on batteries isforeseeable.
5 Conclusions
In this study the cost effectiveness of using high levels ofdistributed renewable energy, and batteries as the onlymajor storage technology, to supply the energy needs of awide scale electrical grid was investigated. A number ofconclusions can be drawn from the findings:
– It is cost effective to pursue the approach of using batterystorage now: Even with no carbon price or costimprovement, the cost was less than using a businessas usual fossil fuel approach up to a break even level of70% RE. With a price on carbon or cost improvement ofthe RE technologies, the break even level was pushedhigher, and could reach above 99%. However the costs ofRE technologies play out in the real world, increasing thelevel of renewable energy generation on the SWIS fromthe current low levels using batteries will reduce costs aswell as reducing greenhouse emissions for many years tocome, even without the benefit of hydroelectricity,pumped hydro storage, bio energy or solar thermalstorage.–
Yearly cost improvements in RE technologies can beincorporated into levelised COE estimations. This studydeveloped a simple method to incorporate the continu-ously improving capital costs of RE technologies over thebuild duration of the system into the estimation of COE.This approach can be widely adopted, as there is urgencyto build these low emission systems now, in order to avoiddangerous climate change, and not wait until some pointin the future. It is perhaps more realistic to use thisapproach rather than estimating projected costs at somepoint in the future and then calculating the cost ofbuilding the entire system based on these costs.
–
These findings are applicable to other regions. Thefinding of this study have positive implications for otherregions in the world with variable renewable energyresources and also having to rely on battery storage, orcoming to rely on battery storage by default in theabsence of policies designed to enable the implementationof other technologies. A cost effective 100% RE systemfor these regions seems to be in reach even if there aregeographical or policy challenges.Nomenclature
BAU
Business as usual c Fractional yearly cost improvement cap Plant capacity (MW) capcdown Capacity that is off line at any one time (%) capcost Capital cost ($million) CC Capital cost factor ($million/MW) CCC Capital cost factor for new converter equip-ment ($million)
CIF Capital cost improvement factor CP Carbon price ($/tonne) COE Cost of energy ($/MWh) costn Annual cost of power plant n CRF Capital recovery factor d Discount (investment) rate EE Energy efficiency EF Specific emission intensity of fossil fuel gen-erators (kgCO2e/MWh)
EI Emission intensity (kgCO2e/MWh) ERE Specific emission intensity of renewable energygenerators (kgCO2e/MW)
ET Emissions from new transmission lines(kgCO2e)
ey Annual energy generated (MWh) FC Fuel cost ($million/MWh) g Fractional installation growth rate GCC Distributed PV or storage grid connection costfactor ($/kW or $/kWh)
gridcost Capital cost of new grid infrastructure ($mil-lion)
i Inflation rate (%) IRF Inflation ratio factor lf Plant lifetime (y) olf Online fraction OMCf Fixed annual operations and maintenance cost($million/MW)
OMCv Variable annual operations and maintenancecost ($million/MWh)
Pi One of the parameters used in the calculationof COE
RE Renewable energy (includes energy efficiencymeasures and storage)
SWIS South west interconnected system SWWA South west region of Western Australia tbd System building duration
12 D. Laslett: Renew. Energy Environ. Sustain. 5, 6 (2020)
TCF
Converter specific emissions intensity(kgCO2e)TLC
Capital cost factor for new transmission lines($million/km)tlength
Length of new transmission line (km) TLF Transmission line specific emissions intensity(kgCO2e/km)
Thanks to Murdoch University for supporting my candidature.
References
1. T.W. Brown, T. Bischof-Niemz, K. Blok, C. Breyer, H. Lund,B.V. Mathiesen, Response to ‘Burden of proof: A compre-hensive review of the feasibility of 100% renewable-electricitysystems,’ Renew. Sustain. Energy Rev. 92, 834–847 (2018)
2. B.V. Mathiesen, H. Lund, K. Karlsson, 100% Renewableenergy systems, climate mitigation and economic growth,Appl. Energy 88, 488–501 (2011)
3. B. Elliston, I. MacGill, M. Diesendorf, Comparing least costscenarios for 100% renewable electricity with low emissionfossil fuel scenarios in the Australian National ElectricityMarket, Renew. Energy 66, 196–204 (2014)
4. B. Lu, A. Blakers, M. Stocks, 90-100% renewable electricityfor the South West Interconnected System of WesternAustralia, Energy 122, 663–674 (2017)
5. A. Sadiqa, A. Gulagi, C. Breyer, Energy transition roadmaptowards 100% renewable energy and role of storagetechnologies for Pakistan by2050, Energy 147, 518–533(2018)
6. A. Aghahosseini, D. Bogdanov, L.S.N.S. Barbosa, C. Breyer,Analysing the feasibility of powering the Americas withrenewable energy and inter-regional grid interconnectionsby2030, Renew. Sustain. Energy Rev. 105, 187–205 (2019)
7. M.Z. Jacobson,M.A. Delucchi, Z.A.F. Bauer, S.C. Goodman,W.E. Chapman, M.A. Cameron, C. Bozonnat, L. Chobadi,H.A. Clonts, P. Enevoldsen, J.R. Erwin, S.N. Fobi, O.K.Goldstrom, E.M. Hennessy, J. Liu, J. Lo, C.B. Meyer, S.B.Morris, K.R. Moy, P.L. O’Neill, I. Petkov, S. Redfern, R.Schucker, M.A. Sontag, J. Wang, E. Weiner, A.S. Yachanin,100% clean and renewable wind, water, and sunlight all-sector energy roadmaps for 139 countries of the world, Joule1, 108–121 (2017)
8. M.Z. Jacobson, M.A. Delucchi, M.A. Cameron, B.V.Mathiesen, Matching demand with supply at low cost in139 countries among 20 world regions with 100% intermittentwind, water, and sunlight (WWS) for all purposes, Renew.Energy 123, 236–248 (2018)
9. W. Zappa, M. Junginger, M. van den Broek, Is a 100%renewable European power system feasible by 2050? Appl.Energy 233–234, 1027–1050 (2019)
10. D. Connolly, H. Lund, B.V. Mathiesen, Smart EnergyEurope: The technical and economic impact of one potential100% renewable energy scenario for the European Union,Renew. Sustain. Energy Rev. 60, 1634–1653 (2016)
11. J. Riesz, B. Elliston, P. Vithayasrichareon, I. MacGill, 100%Renewables in Australia: A Research Summary, Centre forEnergy and Environmental Markets, University of NSW,Sydney, 2016
12. B. Rose, S. Gates, S. Begg, L. Bunn, C. Carter, S. Jerejian, A.King, I. Porter, Clean Electricity Western Australia 2030.Modelling Renewable Energy Scenarios for the South WestIntegrated System, Sustainable Energy Now (SEN),WesternAustralia, 2016
13. J. Cochran, T. Mai, M. Bazilian, Meta-analysis of highpenetration renewable energy scenarios, Renew. Sustain.Energy Rev. 29, 246–253 (2014)
14. W. Deason, Comparison of 100% renewable energy systemscenarios with a focus on flexibility and cost, Renew. Sustain.Energy Rev. 82, 3168–3178 (2018)
15. J.E. Trancik, J. Jean, G. Kavlak, M.M. Klemun, M.R.Edwards, J. McNerney, M. Miotti, P.R. Brown, J.M.Mueller, Z.A. Needell, Technology improvement and emis-sions reductions as mutually reinforcing efforts: Observationsfrom the global development of solar and wind energy (MIT,2015)
16. C.L. Benson, C.L. Magee, On improvement rates forrenewable energy technologies: Solar PV, wind turbines,capacitors, and batteries, Renew. Energy. 68, 745–751 (2014)
17. Lazard, Lazard’s Levelized Cost of Energy Analysis—Version 11.0, 2017
18. Lazard, Lazard’s Levelized Cost of Energy Analysis—Version 12.0, 2018
19. J.P. Hansen, P.A. Narbel, D.L. Aksnes, Limits to growth inthe renewable energy sector, Renew. Sustain. Energy Rev.70, 769–774 (2017)
20. K. Baldwin, A. Blakers, M. Stocks, Australia’s renewableenergy industry is delivering rapid and deep emissions cuts,The Energy Change Institute, Australian National Universi-ty, 2018. http://re100.eng.anu.edu.au/
21. P. Denholm, M. Hand, Grid flexibility and storage requiredto achieve very high penetration of variable renewableelectricity, Energy Policy 39, 1817–1830 (2011)
22. B. Elliston, J. Riesz, I. MacGill, What cost for morerenewables? The incremental cost of renewable generation.An Australian National Electricity Market case study,Renew. Energy 95, 127–129 (2016)
23. M. Kemp, J. Wexler, eds., Zero carbon Britain 2030: a newenergy strategy: the second report of the zero carbon Britainproject (Centre for Alternative Technology, Wales, 2010)
24. H. Lund, B.V. Mathiesen, Energy system analysis of 100%renewable energy systems—The case of Denmark inyears2030 and 2050, Energy 34, 524–531 (2009)
25. D. Connolly, H. Lund, B.V. Mathiesen, M. Leahy, The firststep towards a 100% renewable energy-system for Ireland,Appl. Energy 88, 502–507 (2011)
26. G. Pleßmann, M. Erdmann, M. Hlusiak, C. Breyer, GlobalEnergy Storage Demand for a 100% Renewable ElectricitySupply, Energy Proc. 46, 22–31 (2014)
27. A. Ansar, B. Flyvbjerg, A. Budzier, D. Lunn, Should we buildmore large dams? The actual costs of hydropower megaproj-ect development, Energy Policy 69, 43–56 (2014)
28. I. Kougias, S. Szabó, Pumped hydroelectric storage utiliza-tion assessment: Forerunner of renewable energy integrationor Trojan horse?, Energy 140, 318–329 (2017)
29. B. Nykvist, M. Nilsson, Rapidly falling costs of battery packsfor electric vehicles, Nat. Clim. Change 5, 329–332 (2015)
30. O. Schmidt, A. Hawkes, A. Gambhir, I. Staffell, The futurecost of electrical energy storage based on experience rates,Nat. Energy 2, 17110 (2017)
D. Laslett: Renew. Energy Environ. Sustain. 5, 6 (2020) 13
31. R. Kempener, E. Borden, Batter*+y Storage for Renewables:Market Status and Technology Outlook, InternationalRenewable Energy Agency (IRENA), 2015
32. AEMO, 2017 Electricity statement of opportunities, Austra-lian Energy Market Operator, Western Australia, 2017.www.aemo.com.au
33. D. Laslett, C. Creagh, P. Jennings, A method for generatingsynthetic hourly solar radiation data for any location in thesouth west of Western Australia, in a world wide web page,Renew. Energy 68, 87–102 (2014)
34. D. Laslett, C. Creagh, P. Jennings, A simple hourly windpower simulation for the South-West region of WesternAustralia usingMERRA data, Renew. Energy 96, 1003–1014(2016)
35. D. Laslett, C. Carter, C. Creagh, P. Jennings, A large-scalerenewable electricity supply system by 2030: solar, wind,energy efficiency, storage and inertia for the South WestInterconnected System (SWIS) in Western Australia.,Renew. Energy (submitted) (2017)
36. A. Burnham, J. Han, C.E. Clark, M. Wang, J.B. Dunn, I.Palou-Rivera, Life-cycle greenhouse gas emissions of shalegas, natural gas, coal, and petroleum, Environ. Sci. Technol.46, 619–627 (2012)
37. C. Good, T. Kristjansdottír, A. Houlihan Wiberg, L.Georges, A.G. Hestnes, Influence of PV technology andsystem design on the emission balance of a net zero emissionbuilding concept, Sol. Energy 130, 89–100 (2016)
38. I. Kumar, W.E. Tyner, K.C. Sinha, Input-output life cycleenvironmental assessment of greenhouse gas emissions fromutility scale wind energy in the United States, Energy Policy89, 294–301 (2016)
39. D. Larcher, J.-M. Tarascon, Towards greener and moresustainable batteries for electrical energy storage, Nat.Chem. 7, 19–29 (2014)
40. O. Kelp, G. Dundas, Electricity Sector Emissions. Modellingof the Australian Electricity Generation Sector, ACILALLEN CONSULTIN G, Brisbane, 2013
41. A. Nicholls, R. Sharma, T.K. Saha, Financial and environ-mental analysis of rooftop photovoltaic installations withbattery storage in Australia, Appl. Energy 159, 252–264(2015)
42. I.M. Hoffman, C.A. Goldman, G. Rybka, G. Leventis, L.Schwartz, A.H. Sanstad, S. Schiller, Estimating the cost ofsaving electricity through U.S. utility customer-fundedenergy efficiency programs, Energy Policy 104, 1–12(2017)
43. EPRI, The Australian Power Generation TechnologyReport, Electric Power Re search Institute, Australia,2015
44. R. Turconi, C.G. Simonsen, I.P. Byriel, T. Astrup, Life cycleassessment of the Danish electricity distribution network,Int. J. Life Cycle Assess. 19, 100–108 (2014)
45. I.B. Hauan, Life Cycle Assessment of Electricity Transmis-sion and Distribution, Institutt for energi-og prosessteknikk,2014. https://brage.bibsys.no/xmlui/handle/11250/235701(accessed March 6, 2017)
46. NREL, NREL: Energy Analysis � Energy Technology Costand Performance Data, (2013). http://www.nrel.gov/analysis/tech_lcoe_documentation.html (accessed February 28,2017)
47. T. Krieg, Transmission Asset Cost Benchmarking. Reportsummarising SKM benchmarking of selected asset costestimates to assist in verifying cost models. V0.4, SinclairKnight Merz, Western Power, Armadale, Western Australia,2008. www.skmconsulting.com (accessed January 17, 2017)
48. ERA, Draft Determination on the New Facilities InvestmentTest Application for the Connection of Collgar Windfarm,Economic Regulation Authority, Perth, 2011. www.erawa.com.au (accessed January 17, 2017)
49. CEC, Guide to installing solar PV for business and industry,Clean Energy Council, Melbourne, 2014. cleanenergycouncil.org.au (accessed March 20, 2017)
50. M.Z. Jacobson, M.A. Delucchi, M.A. Cameron, B.A. Frew,Low-cost solution to the grid reliability problem with 100%penetration of intermittent wind, water, and solar for allpurposes, Proc. Natl. Acad. Sci. 112, 15060–15065 (2015)
51. S. Faulstich, B. Hahn, P.J. Tavner, Wind turbine downtimeand its importance for offshore deployment,Wind Energy 14,327–337 (2011)
52. M. Dubarry, A. Devie, K. Stein, M. Tun, M. Matsuura, R.Rocheleau, Battery energy storage system battery durabilityand reliability under electric utility grid operations: analysisof 3 years of real usage, J. Power Sources 338, 65–73 (2017)
53. J. Cochran, D. Lew, N. Kumarb, Flexible Coal (2013).https://pdfs.semanticscholar.org/8beb/ab4da70a1d0babe1fee13eccbc6018c9e916.pdf (accessed March 15, 2017)
54. J.P. Gouveia, L. Dias, I. Martins, J. Seixas, Effects ofrenewables penetration on the security of Portugueseelectricity supply, Appl. Energy. 123, 438–447 (2014)
55. A. Blakers, B. Lu, M. Stocks, 100% renewable electricity inAustralia, (2017). http://energy.anu.edu.au/files/100%25%20renewable%20electricity%20in%20Australia.pdf (accessedMarch 15, 2017)
56. K. Field, UBS Analyst Dubs Model 3 Unprofitable, TeslaResponds With Battery Pricing, CleanTechnica (2016).https://cleantechnica.com/2016/04/27/tesla-model-3-pricing-battery-pricing-unveiled/ (accessed March 18, 2017)
57. Jacobs, NSW Energy efficiency programs Cost benefitanalysis, Jacobs Group (Australia) Pty Limited, Melbourne,2014
58. T.S. Brinsmead, P. Graham, J. Hayward, E.L. Ratnam, L.Reedman, Future energy storage trends: an assessment of theeconomic viability, potential uptake and impacts of electricalenergy storage on the NEM 2015-2035, CSIRO, Australia,2015
59. J. Lu, S. Hyland, Energy Price Limits for the WholesaleElectricity Market in Western Australia. Final draft report1.4, Jacobs, Melbourne, 2016
60. B.S. Howard, N.E. Hamilton, M. Diesendorf, T. Wiedmann,Modeling the carbon budget of the Australian electricitysector’s transition to renewable energy, Renew. Energy 125,712–728 (2018)
Cite this article as: Dean Laslett, Can high levels of renewable energy be cost effective using battery storage? Cost of renewableenergy scenarios for an isolated electric grid in Western Australia, Renew. Energy Environ. Sustain. 5, 6 (2020)